K REDUCE THE WATER FOOTPRINT A.Y. H OF...
76
ASSESSMENT OF MEASURES TO REDUCE THE WATER FOOTPRINT OF COTTON FARMING IN I NDIA M. P AHLOW M. S. K ROL A. Y. H OEKSTRA D ECEMBER 2015 V ALUE OF WATER RESEARCH REPORT SERIES NO. 68
Transcript of K REDUCE THE WATER FOOTPRINT A.Y. H OF...
ASSESSMENT OF MEASURES TO
REDUCE THE WATER FOOTPRINT
OF COTTON FARMING IN INDIA
M. PAHLOW
M.S. KROL
A.Y. HOEKSTRA
DECEMBER 2015
VALUE OF WATER RESEARCH REPORT SERIES NO. 68

ASSESSMENT OF MEASURES TO REDUCE THE WATER
FOOTPRINT OF COTTON FARMING IN INDIA
M. PAHLOW*
M.S. KROL
A.Y. HOEKSTRA
DECEMBER 2015
VALUE OF WATER RESEARCH REPORT SERIES NO. 68
Twente Water Centre, University of Twente, P.O. Box 217, 7500 AE Enschede, The Netherlands.
*Corresponding author: Markus Pahlow, e-mail: [email protected]
© 2015 M. Pahlow, M.S. Krol and A.Y. Hoekstra
Published by:
UNESCO-IHE Institute for Water Education
P.O. Box 3015
2601 DA Delft
The Netherlands
The Value of Water Research Report Series is published by UNESCO-IHE Institute for Water Education, in
collaboration with University of Twente, Enschede, and Delft University of Technology, Delft.
All rights reserved. No part of this publication may be reproduced, stored in a retrieval system, or transmitted, in
any form or by any means, electronic, mechanical, photocopying, recording or otherwise, without the prior
permission of the authors. Printing the electronic version for personal use is allowed.
Please cite this publication as follows:
Pahlow, M., Krol, M.S. and Hoekstra, A.Y. (2015) Assessment of measures to reduce the water footprint of cotton
farming in India, Value of Water Research Report Series No. 68, UNESCO-IHE, Delft, the Netherlands.
Acknowledgements
We gratefully acknowledge the participation of S. Safaya (WFN), Dr. G. Zhang (WFN), A. Chukalla (University
of Twente), R. Hogeboom (University of Twente) and J. Schyns (University of Twente) in the project inception
meeting and useful discussions while this work has been carried out. Funding for this research was provided by
the Water Footprint Network (WFN).
Contents
Summary................................................................................................................................................................. 5
1 Introduction .................................................................................................................................................... 7
2 Measures to reduce the water footprint in cotton farming ............................................................................ 11
2.1 Reduction of the consumptive (green and blue) water footprint .......................................................... 11
2.1.1 Mulching ......................................................................................................................................... 12
2.1.2 Irrigation technology....................................................................................................................... 14
2.1.3 Irrigation strategy ............................................................................................................................ 16
2.1.4 Precision irrigation in time and space ............................................................................................. 19
2.1.5 Crop variety and hybrids ................................................................................................................. 20
2.1.6 Planting date ................................................................................................................................... 21
2.1.7 Nutrient management ...................................................................................................................... 22
2.1.8 Combined measures ........................................................................................................................ 24
2.1.9 Other soil and crop management .................................................................................................... 27
2.2 Reduction of the grey water footprint .................................................................................................. 29
2.2.1 Increasing yield in organic farming ................................................................................................ 29
2.2.2 Type of pesticide ............................................................................................................................. 31
2.2.3 Type of nutrient .............................................................................................................................. 36
2.2.4 Amount and timing of application .................................................................................................. 38
2.2.5 Application method......................................................................................................................... 41
2.2.6 Soil and crop management .............................................................................................................. 42
3 Recommendation .......................................................................................................................................... 45
3.1 Reduction of the green and blue water footprint .................................................................................. 46
3.1.1 Mulching ......................................................................................................................................... 46
3.1.2 Irrigation technology....................................................................................................................... 47
3.1.3 Irrigation strategy ............................................................................................................................ 48
3.1.4 Crop variety .................................................................................................................................... 49
3.1.5 Nutrient management ...................................................................................................................... 49
3.1.6 Other ............................................................................................................................................... 49
3.2 Reduction of the grey water footprint .................................................................................................. 50
3.2.1 Increasing yield in organic farming ................................................................................................ 50
3.2.2 Type of pesticide ............................................................................................................................. 50
3.2.3 Type of nutrient .............................................................................................................................. 51
3.2.4 Amount and timing of application .................................................................................................. 51
3.2.5 Application method......................................................................................................................... 52
3.2.6 Other ............................................................................................................................................... 52
References ............................................................................................................................................................ 53

APPENDICES ...................................................................................................................................................... 59
Appendix I. Seed rate spacing and population for different cotton species recommended by CICR .............. 59
Appendix II. Pesticides/Active ingredients, class of toxicity and number of pests targeted. .......................... 60
Appendix III. Insecticides for cotton insect pests recommended by CICR. .................................................... 63
Appendix IV. NPK status for Gujarat, Madhya Pradesh and Maharashtra soils ............................................. 64
Appendix V. Fertilizer dose and method of application recommended by CICR ........................................... 69
Summary
There are substantial opportunities to reduce the green, blue and grey water footprint (WF) of cotton production
in India due to the large production volume, the low productivity in terms of kg/ha, high pesticide use and sub-
optimal utilization of the broad range of agronomic measures available today. Effects of individual and combined
agronomic measures aiming at yield improvement, evapotranspiration reduction and pollution reduction have
been evaluated regarding their potential for WF reduction. Thereby the water consumption (green and blue WF),
as well as water pollution (grey WF) have been considered.
Based on the findings presented in this report, general recommendations regarding measures and strategies to
decrease the WF of cotton production can be provided. Given that the grey WF is generally much larger than the
consumptive WF, reduction of the grey WF has priority over reduction of the consumptive WF. Yet India has
diverse agro-ecological zones and therefore it must be noted that region-specific measures and strategies are
essential to achieve best benefit. The zones deviate in climate, soil type and financial means from each other,
hence suitability and feasibility of implementation of a certain measure may differ for a given location.
There are certain measures that can be termed 'no regret' options, as they require little or no additional investment,
yield reduction is not probable and they have WF reduction potential. To that end, pesticides that result in a large
grey WF should be replaced with substances that target the same pest(s), are effective, but lead to a WF reduction.
Crop rotation has a positive effect on soil fertility and supports pests control. Application of nutrients can be
optimized and potentially reduced after determination of actual soil fertility and a sequential adjustment of the
amount of fertilizer applied. Furthermore, the amount of nutrients may partially be replaced with organic and
locally available replacements such as farmyard manure without sacrificing yield. Mulching with available crop
residue is an effective means to reduce evaporation and at the same time may increase yield. Intercropping is very
efficient to that end, as the intercrop shades the soil, provides additional yield and crop residue for additional
mulching and soil improvement. Field runoff should be reduced through measures such as field levelling, cropping
on contour in sloping terrain or a ridge and furrow system. Application of irrigation water can be reduced by
applying a deficit irrigation strategy, whereby water is provided at less than full irrigation and at those times where
water is most critical for crop growth (flowering and boll formation). Note that in the case of rain-fed farming
supplemental irrigation in incidental drought periods is highly effective.
Best management practices include, but go beyond the 'no regret' options and may require substantial investment
and adequate training of the farmers. These involve the selection of cultivars best suited for the production region,
innovative and sustainable cotton-based cropping systems and precise water and fertilizer application systems. In
short, the grey WF can be most effectively reduced through organic farming, whereby precision application of
water and nutrients (fertigation) is implemented, when compared to conventional farming. The major trade-off
may be lower yield, thus larger consumptive WF, at least in the short term. However, in the long term this effect
may be small. The consumptive WF can be reduced most effectively by implementation of the following
agronomic measures: mulching (organic or, even more effective, synthetic mulching); efficient irrigation
technology (with sub-surface drip irrigation resulting in the smallest consumptive WF, followed by drip irrigation,
6 / Water Footprint Reduction of Cotton Farming in India
furrow irrigation and finally sprinkler irrigation); a deficit irrigation strategy (reducing field evapotranspiration
by 20-40% compared to full irrigation); and precision irrigation in time and space (irrigation scheduling and
variable rate irrigation).
In the short term it is recommended to aim at implementation of no-regret measures in conventional cotton
farming, creating market support for organic cotton and developing a capacity building and investment
programme to help farmers switch to conservation agriculture.
In the long term it is recommended to strive for a transition to less pesticide-intensive agronomic practices. This
leads to direct and substantial reduction of the grey WF. The consumptive WF can be reduced significantly
through best management practices. However, temporary trade-offs with respect to yield may have to be accepted.
1 Introduction
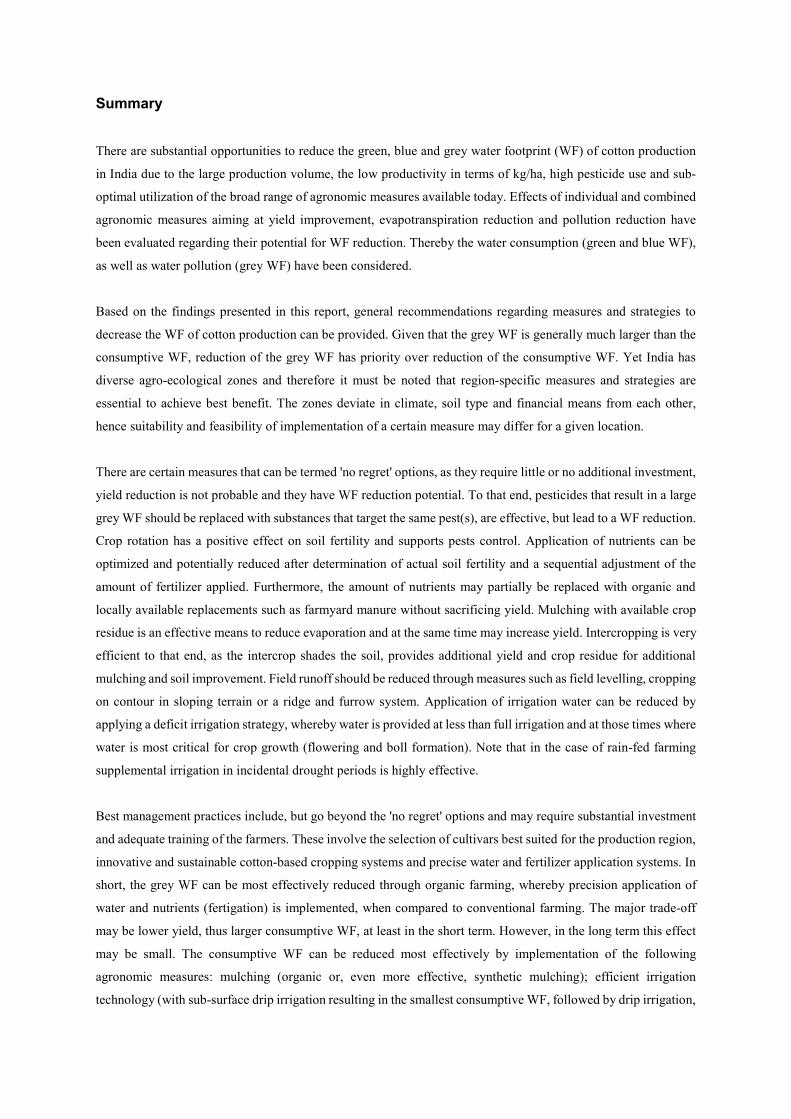
In India cotton is grown in the rainy season, whereby the main crop growing regions are Maharashtra, Andhra
Pradesh and Gujarat, followed by Punjab, Haryana, Karnataka and Madhya Pradesh. Figure 1 shows the cotton
producing regions of the country in terms of harvested area (averaged for the time period 1996-2005).
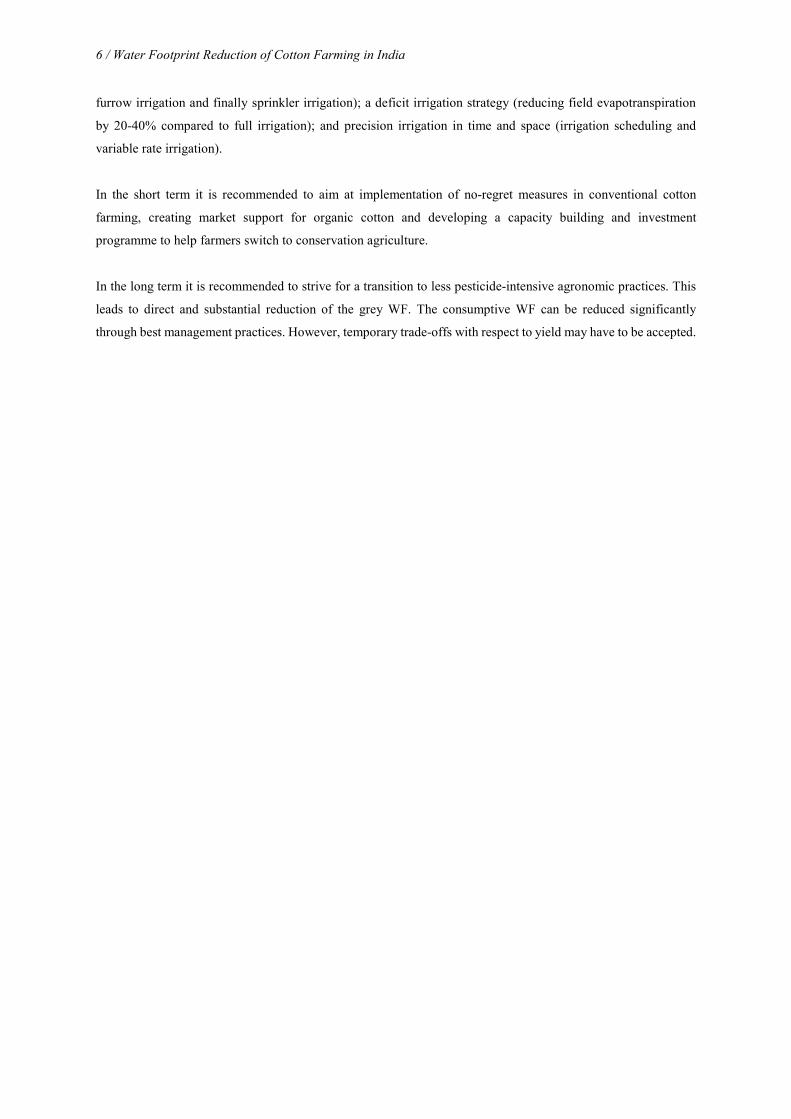
In the north Indian states of Punjab, Haryana and Rajasthan, the crop is irrigated, whereas in other states, it is
partially irrigated or rain-fed. Figure 2 shows the fraction of the harvested area (shown in Figure 1) under irrigation
in cotton production in India.
According to Aggarwal et al. (2008) almost the entire crop production is rain-fed in the state of Maharashtra,
which accounts for 34% of the cotton area and 27% of national production. The total production of cotton in India
is 10 million bales (170 kg each) from a nine million hectare area. Aggerwal et al. (2008) determined that, on
average, the yield gap of actual yield relative to simulated rain-fed potential yields was 1,120 kg/ha for cotton,
whereas the mean yield gap based on the average of simulated, experimental and on-farm rain-fed potential yields
was less, 770 kg/ha for cotton. Yet these results show that irrespective of the definition of potential yield, there is
large scope for increasing rain-fed yields in the future.
Figure 1. Harvested area of cotton production in India. The fraction of the grid cell (5'x5') harvested is shown. This represents the situation averaged over 1996-2005. Source: Mekonnen and Hoekstra (2010).
8 / Water Footprint Reduction of Cotton Farming in India
Figure 2. Fraction of the harvested area under irrigation in cotton production in India. Source: Mekonnen and Hoekstra (2010).
Rockström et al. (2007) point out that the large observed differences between farmers’ yields and attainable yields
globally cannot be explained by differences in rainfall. Rather, they are a result of combined differences in water,
soil, and crop management. In general, only 70% - 80% of the rainfall is available to plants as soil moisture, and
on poorly managed land the share of plant-available water can be as low as 40% - 50% (Falkenmark and
Rockström, 2004). This leads to agricultural dry spells and droughts, which are due primarily to management-
related problems with the on-farm water balance and are thus an indicator of large opportunities to improve yields
through better water management (Rockström et al., 2007). Also Kijne et al. (2009) ascertain that there is a large
potential to improve water productivity and hence for water footprint (WF) reduction through implementation of
known as well as improved water management practices on the ground. In a review of crop water productivity for
various cereals, Zwart and Bastiaanssen (2004) state that the wide ranges in crop water use efficiency (yield
divided by evapotranspiration) found suggest that agricultural production can be maintained with 20% - 40% less
water resources, provided that new water management practices are adopted. An example for the cotton industry
is the development in Australia. Over the past decade, water productivity by Australian cotton growers has
improved by 40% due to both yield increases and more efficient water-management systems (Roth et al., 2013).
Regarding farm agronomic strategy choices it should be noted that in regions where water resources are restrictive
it can be more profitable for a farmer to maximize crop water productivity instead of maximizing the harvest per
unit land (Fereres and Soriano, 2007).
Water Footprint Reduction of Cotton Farming in India / 9
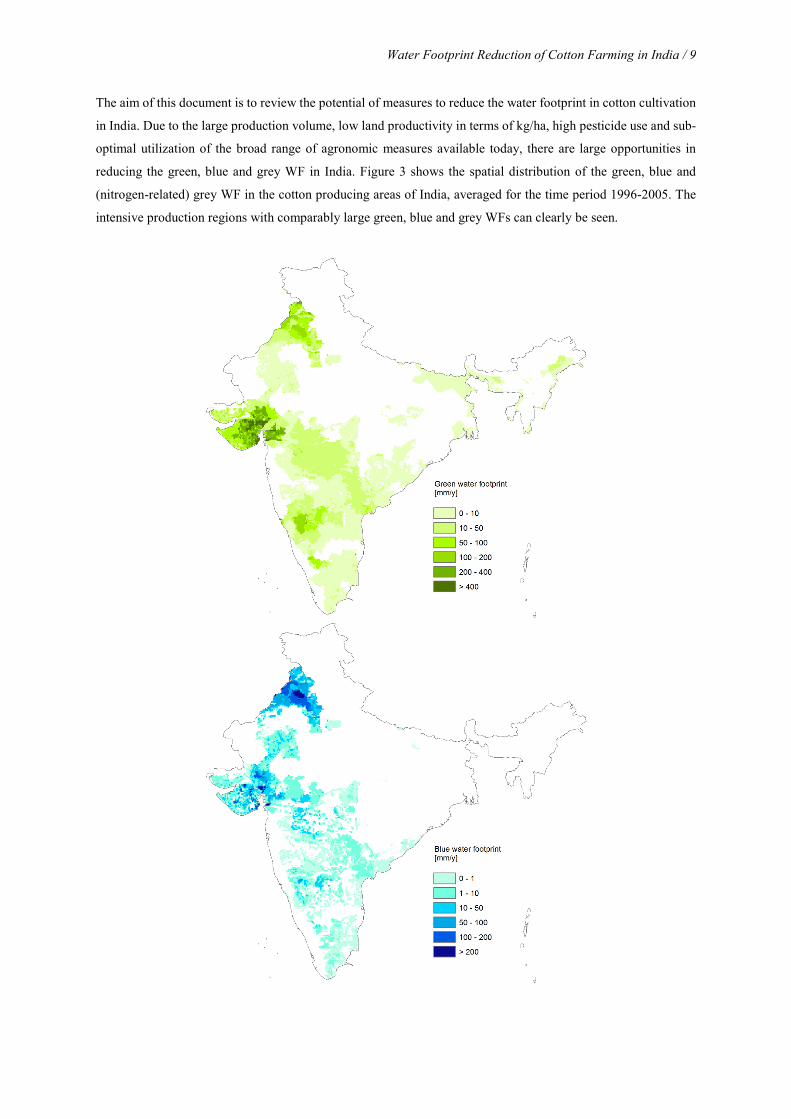
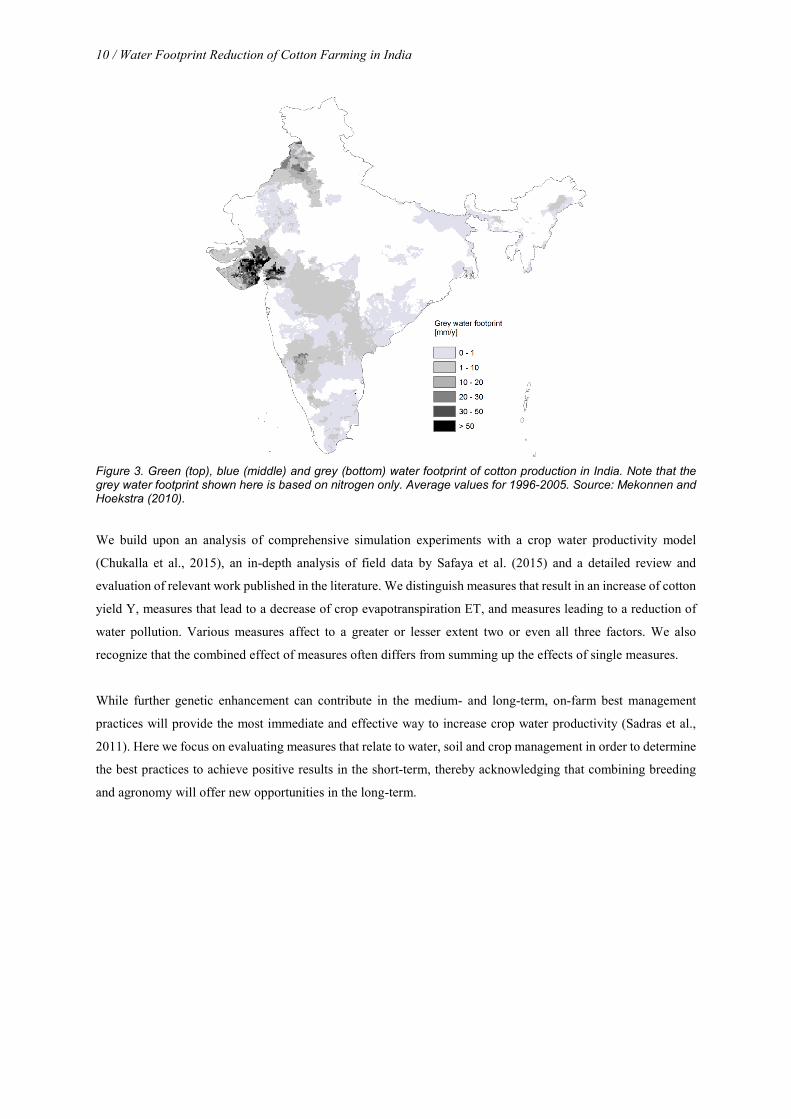
The aim of this document is to review the potential of measures to reduce the water footprint in cotton cultivation
in India. Due to the large production volume, low land productivity in terms of kg/ha, high pesticide use and sub-
optimal utilization of the broad range of agronomic measures available today, there are large opportunities in
reducing the green, blue and grey WF in India. Figure 3 shows the spatial distribution of the green, blue and
(nitrogen-related) grey WF in the cotton producing areas of India, averaged for the time period 1996-2005. The
intensive production regions with comparably large green, blue and grey WFs can clearly be seen.
10 / Water Footprint Reduction of Cotton Farming in India
Figure 3. Green (top), blue (middle) and grey (bottom) water footprint of cotton production in India. Note that the grey water footprint shown here is based on nitrogen only. Average values for 1996-2005. Source: Mekonnen and Hoekstra (2010).
We build upon an analysis of comprehensive simulation experiments with a crop water productivity model
(Chukalla et al., 2015), an in-depth analysis of field data by Safaya et al. (2015) and a detailed review and
evaluation of relevant work published in the literature. We distinguish measures that result in an increase of cotton
yield Y, measures that lead to a decrease of crop evapotranspiration ET, and measures leading to a reduction of
water pollution. Various measures affect to a greater or lesser extent two or even all three factors. We also
recognize that the combined effect of measures often differs from summing up the effects of single measures.
While further genetic enhancement can contribute in the medium- and long-term, on-farm best management
practices will provide the most immediate and effective way to increase crop water productivity (Sadras et al.,
2011). Here we focus on evaluating measures that relate to water, soil and crop management in order to determine
the best practices to achieve positive results in the short-term, thereby acknowledging that combining breeding
and agronomy will offer new opportunities in the long-term.
2 Measures to reduce the water footprint in cotton farming
2.1 Reduction of the consumptive (green and blue) water footprint
The consumptive water footprint (WF) of crop cultivation per unit of crop is defined as the field evapotranspiration
(ET) divided by the yield (Y) and is often expressed in terms of m3/t (or litre/kg) (Hoekstra et al., 2011). We focus
here on water consumption of crop cultivation at field level, not considering indirect consumptive water uses like
the evaporation from irrigation water storage reservoirs and transport canals or evaporation related to the
production of materials used in agriculture. Since the consumptive WF per unit of crop is defined as ET/Y, it can
be reduced if evapotranspiration ET decreases or yield Y increases. The consumptive WF per hectare (m3/ha) can
be decreased by lowering evaporation. Generally, it is best (from the perspective of moderating water use) to aim
for lowering consumptive WF per unit of crop, but in cases of great blue water scarcity it can be advisable to
reduce blue (and thus overall consumptive) WF per hectare.
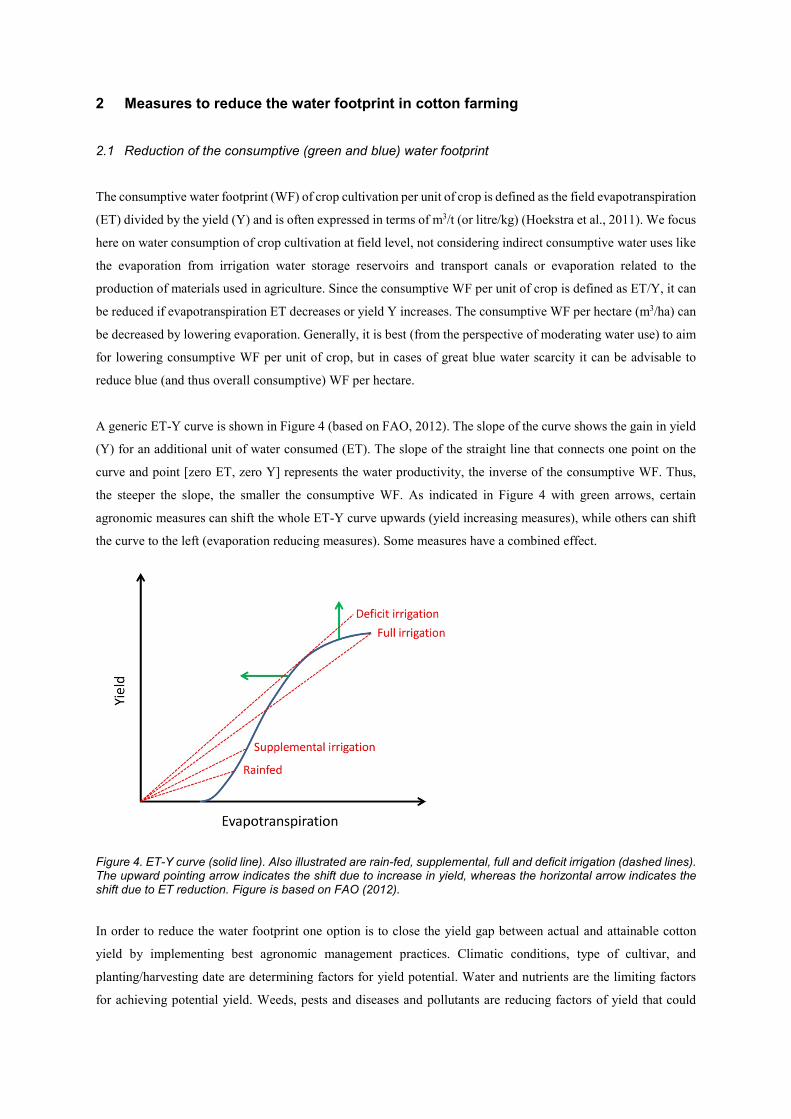
A generic ET-Y curve is shown in Figure 4 (based on FAO, 2012). The slope of the curve shows the gain in yield
(Y) for an additional unit of water consumed (ET). The slope of the straight line that connects one point on the
curve and point [zero ET, zero Y] represents the water productivity, the inverse of the consumptive WF. Thus,
the steeper the slope, the smaller the consumptive WF. As indicated in Figure 4 with green arrows, certain
agronomic measures can shift the whole ET-Y curve upwards (yield increasing measures), while others can shift
the curve to the left (evaporation reducing measures). Some measures have a combined effect.
Figure 4. ET-Y curve (solid line). Also illustrated are rain-fed, supplemental, full and deficit irrigation (dashed lines). The upward pointing arrow indicates the shift due to increase in yield, whereas the horizontal arrow indicates the shift due to ET reduction. Figure is based on FAO (2012).
In order to reduce the water footprint one option is to close the yield gap between actual and attainable cotton
yield by implementing best agronomic management practices. Climatic conditions, type of cultivar, and
planting/harvesting date are determining factors for yield potential. Water and nutrients are the limiting factors
for achieving potential yield. Weeds, pests and diseases and pollutants are reducing factors of yield that could
12 / Water Footprint Reduction of Cotton Farming in India
potentially be achieved (Van Ittersum et al., 2013). With respect to water footprint reduction by means of lowering
ET, measures in agriculture aim at reduction of non-beneficial evaporation by for example reducing early season
soil evaporation that occurs from bare soil. One can also aim to reduce non-productive evaporation in favour of
productive transpiration. Increasing the ratio of transpiration to total evapotranspiration (T/ET) through improved
agricultural management will result in increased yield and thus a reduction of the consumptive WF.
Below we introduce and discuss the most promising management options available to reduce consumptive, i.e.
green and blue, WF per unit of crop. Please note that in the literature often the ‘water use efficiency’ or ‘water
productivity’ rather than the water footprint is reported. In our overview we refer to both water use efficiency
(WUE) and water productivity (WP) as yield divided by evapotranspiration, i.e. the inverse of the combined green
and blue water footprint in irrigated agriculture and the inverse of the green water footprint in rain-fed agriculture.
For the case that WUE or WP has been defined differently in the respective literature source, it will be clearly
stated.
2.1.1 Mulching
Mulching entails the application of natural and/or synthetic material to cover the soil surface. A variety of
materials can be used as mulch, e.g. hay, leaves, manure, compost, vermicompost, wood, bark, cocoa hulls, rice
straw, wheat straw, peanut hulls, plastics, gravel, and geo-textiles. The main potential advantages of this practice
are to retain soil moisture, to prevent weed growth, to control wind and water erosion, to regulate temperature and
to enhance soil structure (Kahlon and Lal, 2011). As a result of those improvements yield may also increase.
While mulching can be an effective technique to reduce soil evaporation, one must be aware that its efficiency
depends on meteorological conditions, irrigation, the soil type and the characteristics of the different mulching
materials. Mulching is most effective in the early crop growth stages, as shading by the plant canopy substitutes
for the beneficial effect of a growing season mulch (Tolk et al., 1999). Note that potential limitations are that it
may harbour pests and diseases and it is not recommended in wet conditions over long time periods.
The combined laboratory and field study by Zribi et al. (2015) sheds light on the efficiency of selected inorganic
(plastic black polyethylene with 0.1 mm thickness) and organic (pine bark 5 cm, vine pruning residues 5 cm, jute
geotextile 5.5 mm, and wheat straw 5 cm) mulching materials for soil evaporation control during the energy-
limited (high soil water content in topsoil; evaporation limited only by energy availability at the soil surface) and
falling-rate (limited soil water content in topsoil and evaporation reduced in proportion to the amount of water
remaining in topsoil) evaporation stages. Overall, the results indicate that during the energy-limited stage all
materials studied reduced the evaporation rate compared to bare soil. However, the black PE film was the most
effective material for soil evaporation control during the energy-limited stage, followed by vine residues and pine
bark. These materials were therefore recommended for soil evaporation control in high-frequency irrigation
systems where the soil surface remains wet most of the time. For long drying cycles and relatively low soil water
contents (i.e. falling-rate stage), the evaporation reduction was low and similar among treatments (plastic, bark,
vine residue, geotextile), implying that soil mulching will be less effective for soil evaporation control in low-
Water Footprint Reduction of Cotton Farming in India / 13
frequency irrigation systems. Similar results were obtained by Unger and Parker (1976) and Xie et al. (2006), with
evaporation rates almost identical in all the tested mulching treatments for long periods of evaporation and the
subsequent drying of soils. With respect to effectiveness of evaporation control of mulch materials, comparable
results to those obtained by Zribi et al. (2015) were obtained in other studies under cropped soils. Ghosh et al.
(2006) found in a peanut crop that the reduction of soil evaporation was higher with plastic than with wheat straw
cover except in the rainy months. Maurya and Lal (1981) concluded from a study of a maize cropping system that
in the dry period the reduction of soil evaporation was higher with plastic than with rice straw cover. Kumar and
Dey (2011) showed in their investigation at Nauni in district Solan of Himachal Pradesh, India, for a strawberry
crop that both black plastic and cereal straw cover significantly reduced soil evaporation as compared to the bare
soil. Under cereal straw and rain-fed conditions the improvement in water use efficiency was 29%, whereas black
polyethylene mulch resulted in an increase of 83%. For full irrigation the respective improvements were 21% for
cereal straw and 51% for black polyethylene mulch. Awoodoyin et al. (2007) established the efficiency for soil
evaporation control of different mulching materials in a tomato crop that followed the order black plastic > bark
materials > weed residues > bare soil. Zribi et al. (2015) note that although the evaporation rate of pine bark or
vine residues was higher than with plastic, those materials allow for infiltration of rainfall. Therefore, pine bark
and other porous materials such as wheat straw and vine residues may be more beneficial than plastic in terms of
root zone water storage in areas where rainfall is relevant. New developments such as permeable geotextiles are
a suitable alternative. Since precipitation penetrates porous materials, these can be also more effective than plastic
for soil salinity control, as indicated by Aragüés et al. (2014).
Deng et al. (2006) summarize findings for studies that compare mulching and no mulching practice for winter
wheat and maize in the North China Plain and Loess Plateau. Water use efficiency improvements of 13% for
winter wheat and 19% for maize were achieved through mulching treatment. Zhang et al. (2011) show in their
analysis of the results from a three-year field experiment on the Loess Plateau in China considering four agronomic
practices – (i) flat bed, no mulch; (ii) straw or crop residue mulching; (iii) ridges mulched with plastic film and
furrows; and (iv) ridges mulched with plastic film and furrows mulched with crop residue – that straw mulching
combined with no-tillage played a significant role in increasing soil water storage compared to traditional practice
(flat bed, no mulch). The ridges mulched with white plastic film combined with furrows covered with or without
crop residue enhanced maize development and grain yield and hence water use efficiency (WUE). The increase
of WUE for practice (iv) was, averaged over the three-year study period, 17% higher when compared to practice (i).
In their study in Gayeshpur, India, on the effect of different mulching materials (no mulch (NM), rice straw mulch
(RSM), white polyethylene mulch (WPM) and black polyethylene mulch (BPM)) on tomato cultivation,
Mukherjee et al. (2010) found that the use of mulch increased yield by 23–57% in comparison to no mulch
application. Among different mulches, BPM was responsible for attaining the highest WUE, which was 22%,
21% and 39% higher than under WPM, RSM and NM, respectively. At Coimbatore, India, field trials were carried
out to investigate the influence of polyethylene mulch application in RCH 20 Bt and RCH 20 non-Bt cotton
cultivation. Irrespective of the genotypes, poly mulching improved yield (up to 43% for Bt and 26% for non Bt)
(Nalayini, 2007). Again at Coimbatore, India, during winter 2007-2008 a field study showed that poly mulching
of RCHB 708 Bt increased yield by 38% (CICR, 2008). In the latter study, yield per water used increased by
14 / Water Footprint Reduction of Cotton Farming in India
134% for the mulching treatment. In a two-year field trial of cotton cultivation under rain-fed conditions in
Dharwad, Karnataka, India, Halemani et al. (2009) find that polyethylene mulch resulted in increased cotton yield
when compared with no mulch cultivation. The thickness of the mulch led to nonlinear and insignificant
differences with respect to yield (75micron-16% increase in yield compared to no mulch, 100micron-11% and
125 micron-20%). For the two years studied, the three thicknesses of the mulch material and the genotypes studied,
the average yield increase was 16% when compared with no mulch.
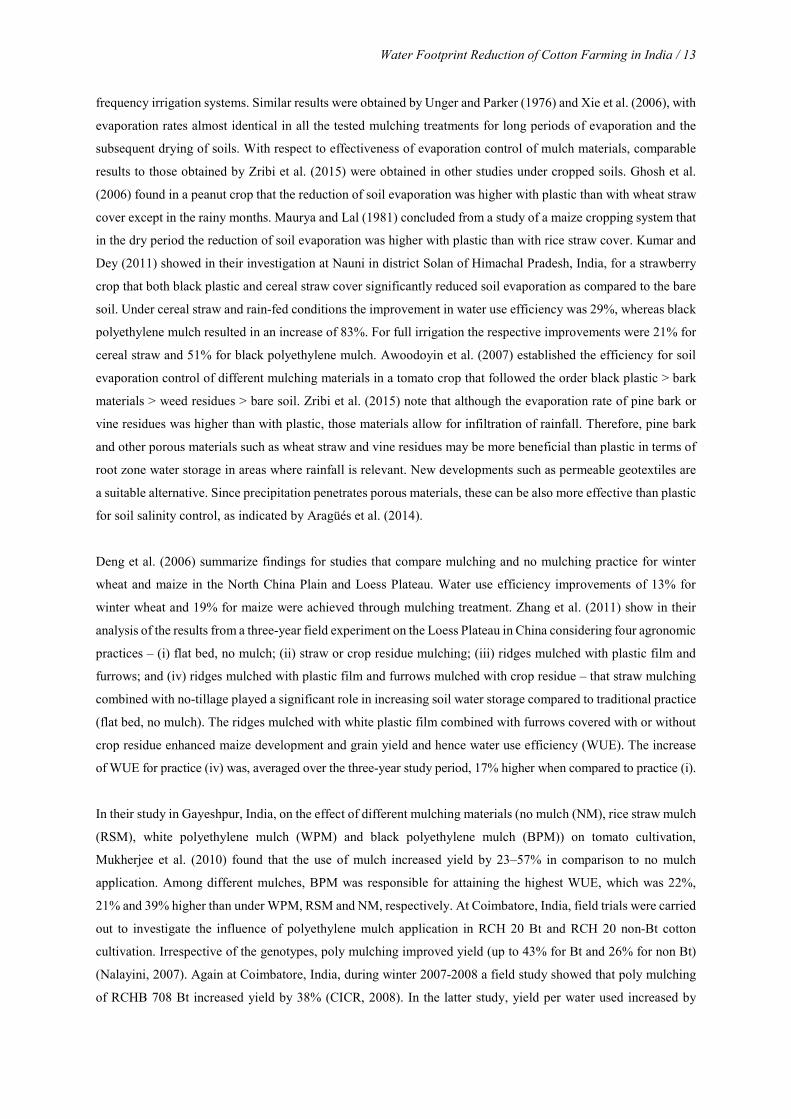
These experimental results were confirmed with extensive simulation experiments with a crop water productivity
model, whereby the changes in yield and evapotranspiration for the application of organic and synthetic mulch,
with 'no mulching' serving as baseline scenario, have been investigated (Chukalla et al., 2015). Overall it can be
stated that the consumptive WF reduces from no mulching to organic mulching, to synthetic mulching (Figure 5).
This trend has also been observed by Safaya et al. (2015) for cotton cultivation in India.
Figure 5. Effect of different types of mulching on Y and ET. Solid arrows (1) indicate ET reduction, while dotted arrows (2) indicate ET reduction and yield increase.
2.1.2 Irrigation technology
One of the reasons for low yield of seed cotton in India is its cultivation on lighter/shallow soils and inefficient
water management. Cotton suffers from water stress at the crucial phase of boll development on 70% of the rain-
fed area, and from inefficient water management on most of the irrigated areas, facing problems of drainage and
rising salinity (Vittal et al., 2004).
Here, furrow, sprinkler, drip and subsurface drip irrigation technologies are evaluated regarding their effect on
yield, evapotranspiration and the consumptive WF. In furrow irrigation water is applied in small, parallel channels.
The crop is usually grown on the ridges between the furrows. Sprinkler irrigation is a method of applying irrigation
water that is similar to natural rainfall. Water is distributed through a system of pipes usually by pumping. It is
Water Footprint Reduction of Cotton Farming in India / 15
then sprayed into the air through sprinklers so that it breaks up into small water drops that fall to the ground (FAO,
1986). LESA (low elevation spray application) and MESA (mid-elevation spray application) are sprinkler system
technologies with the potential to reduce water losses. Drip irrigation systems use commonly tubes that are placed
on the soil surface next to the crop to apply irrigation water with high precision. Similarly, the emitters of low
energy precision application (LEPA) systems are also in contact with the soil surface. LEPA systems are often
used in conjunction with furrow dikes. Subsurface drip is a low-pressure, high efficiency irrigation system that
uses buried drip tubes or drip tape to meet crop water needs (FAO, 2002).
Various experimental studies compared drip irrigation with sprinkler and/or surface irrigation in crop production.
Ibragimov et al. (2007) investigated the water use efficiency of irrigated cotton in Uzbekistan under drip and
furrow irrigation over a three-year period. WUE was always significantly larger for drip irrigation than for furrow
irrigation, with improvements being on average 60% for the three-year period. Kumar and Dey (2011) find for
strawberry in Nauni, district Solan of Himachal Pradesh, India, that drip irrigation increased yield per total water
applied by 60% compared with surface irrigation. In a study on onion production in Jalgaon district in Maharashtra
state in India it was shown that by using drip instead of furrow irrigation it is feasible to reduce both green and
blue WF. The consumptive water saved with drip irrigation was 129 l/kg raw onions. Overall a 35% reduction of
the consumptive green and blue WF was reached (IFC et al., 2010). Ayars et al. (1999) reported that on average
the ratio of yield to the volume of water applied was 15% higher for drip-irrigated cotton than for furrow-irrigated
cotton in the Central Valley of California, USA. Similarly, Hodgson et al. (1992) compared furrow and drip
irrigation methods for cotton and found that the ratio of lint yield to the total water received by the crop (stored
irrigation water + effective rainfall + antecedent stored water) was 18% higher for drip than for furrow irrigation.
Results by Aujla et al. (2005) from a field study at the Research Farm of Punjab Agricultural University Regional
Station, Bathinda, Punjab, India, during the summer of 2002, show that the ratio of seed cotton yield to the sum
of total of irrigation water, profile water used and rainfall increased by 26% with drip irrigation when the same
quantity of water and N fertilizer was applied, as compared with check basin application of irrigation water. Cetin
and Bilgel (2002) reported that drip irrigation increased seed cotton yield by 21% and 30% over furrow and
sprinkler irrigation, respectively, in the Southeastern Anatolia Region (GAP) in Turkey. Furthermore, the ratio of
yield to the volume of water applied proved to be 26% higher for drip compared to furrow and 106% higher for
drip compared to sprinkler. In a field study in Coimbatore, Tamil Nadu in India that compared various drip systems
with ridge-furrow irrigation in cotton cultivation it was found that drip irrigation overall improved the ratio of
yield to the sum of irrigation water and effective rainfall by 39% compared to furrow irrigation practice (CICR,
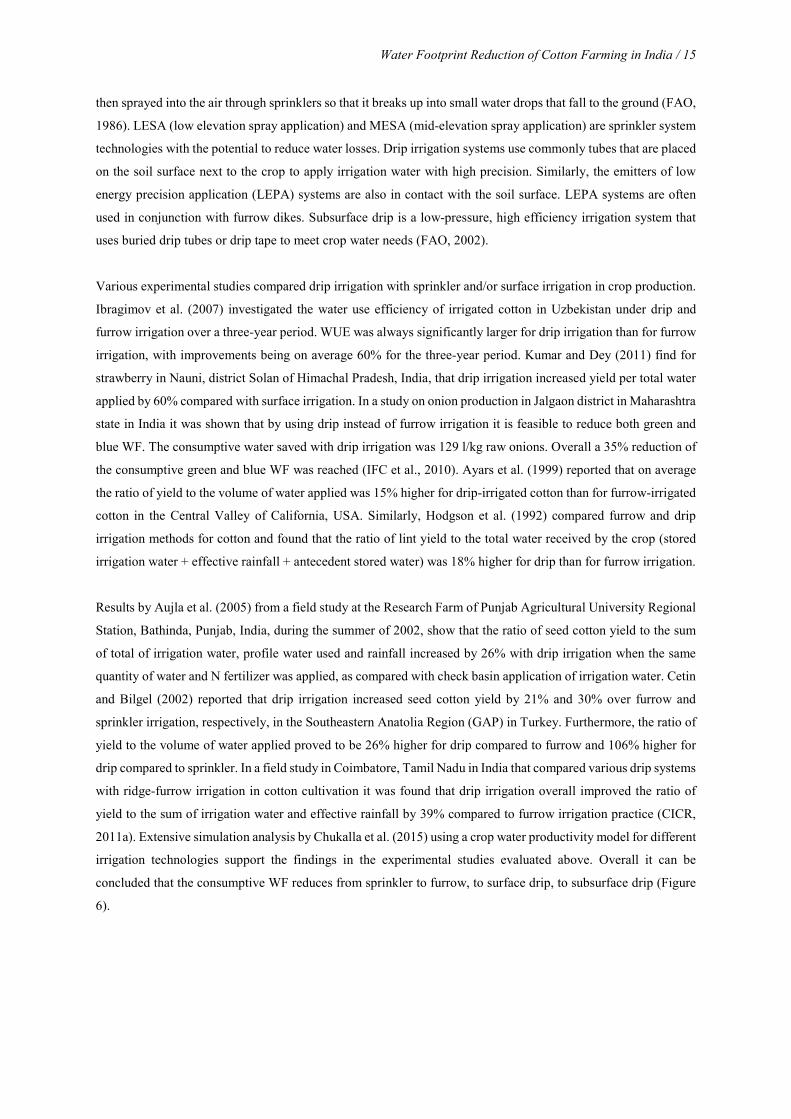
2011a). Extensive simulation analysis by Chukalla et al. (2015) using a crop water productivity model for different
irrigation technologies support the findings in the experimental studies evaluated above. Overall it can be
concluded that the consumptive WF reduces from sprinkler to furrow, to surface drip, to subsurface drip (Figure
6).
16 / Water Footprint Reduction of Cotton Farming in India
Figure 6. The effect of different irrigation techniques on yield and evapotranspiration. Either (1) solely ET may be reduced or (2) a combined ET reduction and yield increase may result from using one technique instead of another.
It must be noted that LESA and MESA sprinkler irrigation may provide for lower consumptive water footprint
compared to furrow irrigation if the respective coverage is less than 100%. It should furthermore be noted that the
consumptive WF can be reduced through the practice of alternate furrow irrigation, which consists of irrigating
every other furrow of a field, whereby the off furrow is left dry (Grimes et al., 1968). Alternate furrow irrigation
results in a reduction of water application without significantly affecting yield and thereby leading to more
efficient water use (CICR, 2015). Through this measure a controlled plant-water stress during a period when this
is desirable to slow vegetative growth and promote a more favourable fruiting balance of e.g. a cotton plant is
feasible.
The conclusion drawn from these experimental and simulation studies is that drip and in particular subsurface drip
irrigation can lead to an increase in lint yield and a reduction of the consumptive WF of cotton production when
compared with sprinkler or surface irrigation. Yet, while drip irrigation may not increase yield relative to well-
managed surface irrigation (Howell et al. (1987) show an example for furrow versus drip irrigation), the practice
of sprinkler and surface irrigation may result in non-beneficial water use, as the irrigation water evaporates, rather
than to contribute to crop growth through transpiration.
2.1.3 Irrigation strategy
Deficit and supplemental irrigation are investigated here in detail regarding their potential to reduce the
consumptive WF. Deficit irrigation (DI) is the deliberate and systematic under-irrigation of crops (English, 1990).
The main objective of DI is to increase the water use efficiency of a crop by eliminating irrigations that have little
impact on yield (drought-tolerant phenological stages, often the vegetative stages and the late ripening period). It
is a measure to stabilize, rather than maximize yield, since the crop may undergo water stress conditions and hence
the consequence may be production loss. Yet at the same time the resulting yield reduction may be small compared
Water Footprint Reduction of Cotton Farming in India / 17
with the benefits gained through diverting the saved water to irrigate other crops for which water would normally
be insufficient under traditional irrigation practices (FAO, 2002). Supplemental irrigation (SI), defined as the
application of a limited amount of water to rain-fed crops when unfavourable precipitation patterns fail to provide
essential soil moisture for normal plant growth, has proven potential in reducing adverse effects of moisture deficit
on crop growth, particularly during sensitive growth stages (Oweis et al., 1998). This measure is demanding from
a management perspective, as it cannot be determined in advance when SI is required. The farmer has to observe
and apply SI in particular during moisture-sensitive stages of crop growth.
In a meta-study, Zwart and Bastiaanssen (2004) report that deficit irrigation practices were found to improve crop
water use efficiency for cereals, sometimes even by more than 200%. This can in part be attributed to the fact that
plants are more efficient with water when they are stressed. The authors concluded that in order to achieve
optimum crop water productivity in water short regions, it is wise to irrigate wheat and maize with less water as
recommended for attaining maximized yields. In another detailed study on deficit irrigation for various crops und
various ecological conditions it was found that crops less sensitive to stress such as cotton, maize, groundnut,
wheat, sunflower and sugar beet can adapt well to deficit irrigation practices provided good management practices
can be secured. For more sensitive crops such as potatoes deficit irrigation proved less economic (FAO, 2002).
Oweis and Hachum (2003) find an average increase over a five-year period in the ratio of yield to rain+irrigation
water of 16% in wheat production in northern Syria by applying supplemental irrigation. Fox and Rockström
(2003) present results on the effects on sorghum yields under supplemental irrigation and soil nutrient application
in a three-year on-farm experiment in northern Burkina Faso. Supplemental irrigation ranging from 60 to 90 mm
per season was applied based on actual occurrence of dry-spell induced crop water stress and resulted in an average
increase of the ratio of yield to the sum of rainfall + supplemental irrigation of 39%. Bhattarai et al. (2005)
investigated the response of cotton to subsurface drip irrigation (SDI) and furrow irrigation during a two-year
experiment in Queensland, Australia, in a vertisol soil for varying irrigation amounts, representing full,
supplemental and deficit irrigation regimes. Yield plateaued when 75% or more of daily ETc was supplied by
SDI. The two drier treatments (SDI at 50% and 75% of ETc) had consistently higher yield per sum of soil moisture
before planting + irrigation + rainfall – soil moisture at harvest for lint production compared with those of the two
wetter SDI treatments (SDI at 90% and 105/120% ETc). All SDI treatments were more efficient in the first year
in the use of water for lint production than was furrow irrigation, with the two drier treatments outperforming the
wetter treatments, whereby SDI at 50% ETc was 138% of yield per sum of soil moisture before planting +
irrigation + rainfall – soil moisture at harvest by furrow irrigation and SDI at 75% was 144% of yield per sum of
soil moisture before planting + irrigation + rainfall – soil moisture at harvest by furrow irrigation. It is interesting
to note that improved irrigation management in the form of faster irrigation and reduction of tail water in the
second year reduced the advantage of SDI over furrow irrigation with respect to yield per sum of soil moisture
before planting + irrigation + rainfall – soil moisture at harvest. Furrow irrigation yield per sum of soil moisture
before planting + irrigation + rainfall – soil moisture at harvest was 1% higher than SDI at 50% ETc and 11%
higher than SDI at 75%. Overall this study shows that irrigating at less than 100% ETc has advantages with respect
to yield per sum of soil moisture before planting + irrigation + rainfall – soil moisture at harvest. Irrigation of
cotton with SDI at 75% ETc offered significant benefits in terms of saved irrigation water over wetter SDI
treatments, resulted in the highest average yield per sum of soil moisture before planting + irrigation + rainfall –
18 / Water Footprint Reduction of Cotton Farming in India
soil moisture at harvest for lint production over the two years, and reduced drainage and runoff compared with
higher SDI rates and furrow irrigation (Bhattarai et al., 2005). In their field study on Calcic Xerosols soil in
Uzbekistan, Ibragimov et al. (2007) find that under drip irrigation and the optimal mode (70–70–60% of field
capacity for three main plant growth periods 1: germination to squaring, 2: squaring to flowering-fruiting, 3:
maturation of cotton bolls) of irrigation scheduling, water use efficiency was increased by 60% on average in
comparison with furrow irrigated cotton grown under the same condition.
Field experiments of cotton cultivation by Dagdelen et al. (2006) for cotton in western Turkey during 2003 and
2004 for different irrigation regimes (full irrigation, which received 100% of the soil water depletion and those
that received 70, 50 and 30% of the amount received by the control treatment) demonstrated that under the given
conditions 30% of full irrigation resulted in a 15% higher WUE than the control irrigation level.
Gundlur et al. (2013) carried out a three-year field trial in Belvatagi, Karnataka, India for Bt cotton hybrid (JK-
2007 Bt) and show that 60% of full irrigation resulted in 14% higher yield per water applied than full irrigation
treatment. Similar results were obtained by Ramamurthy et al. (2009) in a three year experiment of hybrid cotton
cultivation in Kalmeshwar Tehsil, Nagpur District, Maharashtra, India, who found that yield per irrigation water
applied with drip-irrigated cotton was 28–58% higher than broad bed furrow and 45–68% higher than the flood
method of irrigation. The increase in yield per irrigation water applied due to drip irrigation at 0.6 ETc was 97%
over 1.0 ETc and 35% over 0.8 ETc. Broad bed furrow method recorded 50% higher yield per irrigation water
applied over farmer’s practice of flood irrigation.
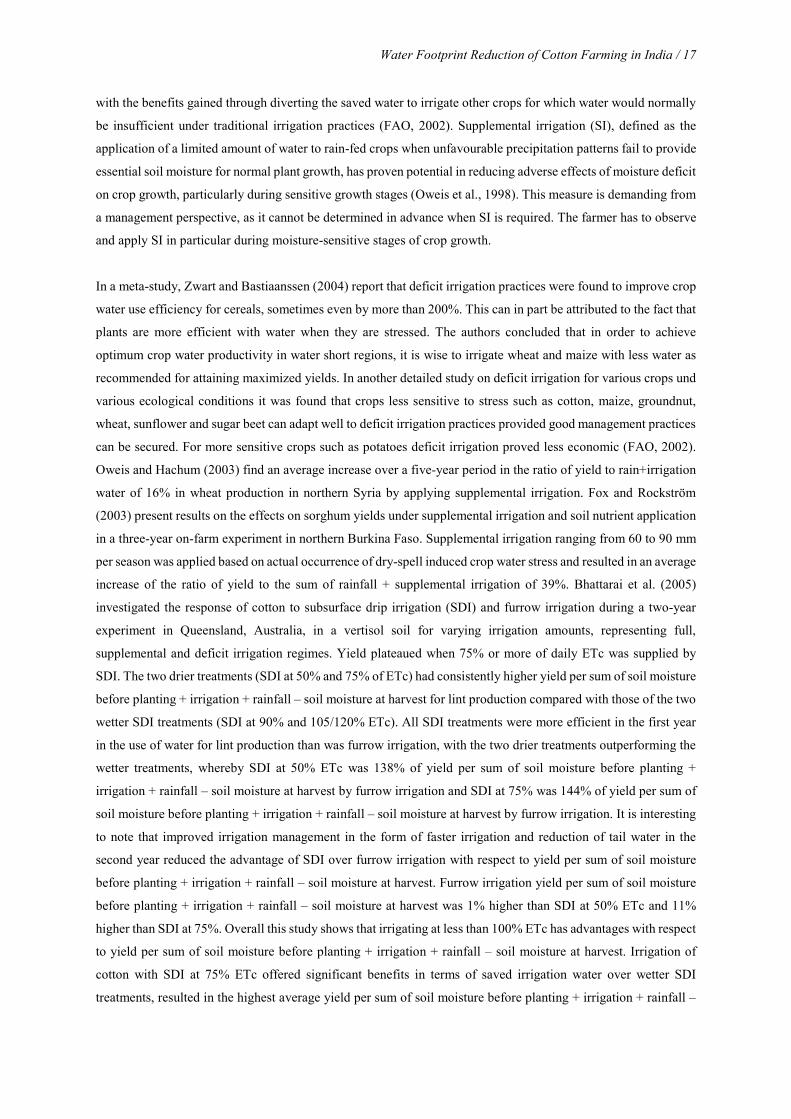
The effect of different strategies has in addition been investigated by means of extensive simulation experiments
by Chukalla et al. (2015), thereby considering the spectrum from rain-fed irrigation, to supplemental irrigation, to
deficit irrigation and full irrigation. Figure 7 shows schematically the relative magnitude of the green and blue
water footprint for each strategy.
The consumptive WF per unit of crop reduces from rain-fed practice to supplemental irrigation, to full irrigation
and to deficit irrigation. Adequate application of deficit irrigation practice can generate significant savings in
irrigation water allocation when compared to full irrigation.
There are nine major cotton-growing states in the country grouped into three zones – the north zone (Punjab,
Haryana and Rajasthan), central zone (Maharashtra, Madhya Pradesh and Gujarat) and south zone (Andhra
Pradesh, Karnataka and Tamilnadu). About 65-70% of the cotton production area in India is rain-fed. In case of
Maharashtra, it is as high as 97% (CICR, 2005). Out of 9 million ha cotton area in India, about 5.7 million ha is
dependent on rain, predominantly on vertisols and its associate soils. The rainfall in such rain-fed areas ranges
from 450 to 1100 mm during the crop season, distributed over 45 to 50 rainy days with an irregular rainfall pattern
and many intermittent dry spells (MOFF, 2006). Productivity may be affected significantly due to erratic and
uneven rainfall. Therefore supplemental irrigation is an important measure to provide water in critical crop growth
stages due to lack of rain (CICR, 2005). Whereby regions such as Vidarbha in Maharashtra falls under the drought-
Water Footprint Reduction of Cotton Farming in India / 19
prone, semi-arid eco-region, where a deficit irrigation strategy may be best suited to achieve the highest reduction
of the consumptive WF.
Figure 7. Schematic comparison of the consumptive water footprint for rain-fed, supplemental, deficit and full irrigation based on Chukalla et al. (2015).
2.1.4 Precision irrigation in time and space
Precision irrigation has the potential to increase water use efficiency by optimally matching irrigation inputs to
crop water needs. The consumptive WF can generally be reduced through (i) optimized irrigation scheduling (in
time) and (ii) variable rate irrigation (VRI) (in space). Optimizing irrigation scheduling can have substantial
influence on achieving the goal to reduce water consumption without sacrificing yield. The risk associated with
deficit irrigation can be minimized through proper irrigation scheduling (when and how much to irrigate) and by
avoiding water stress during the growth stages when the crop is particularly sensitive to water stress (Zhang,
2003). Yield will be least affected if water application is synchronized with crop water demand. For example,
decreased water use efficiency has been found in field experiments by Prieto and Anguiera (1999) for cotton,
where water stress occurred during vegetative and early bud formation periods. Yet gentle stress during yield
formation did not affect yield production, but reduced vegetative growth and hence improved WUE. The cotton
growth stages known to be most sensitive to water stress are squaring, flowering and boll development (Jalota et
al., 2006; Sankaranarayanan et al., 2007; FAO, 1989; Bhaskar et al., 2005), whereby Sankaranarayanan et al.
(2007) point out that boll development is the most critical stage among those three. In terms of percentage of total
seasonal water use, Sankaranarayanan et al. (2007) state that in general for cotton crop water requirement is 20%
until 1st flower, 40% during 1st flower to peak flower, 30% during peak flower to bursting of few bolls and only
10% until maturity. Field studies of cotton production in India showed that two irrigations, the first one at
flowering and second one at boll development stage resulted in maximum yield per water used (45% higher than
the control) whereas one irrigation at peak boll development stage lead to 41% higher yield per water used than
under rain-fed conditions (CICR, 2015). Based on field studies in India, Sankaranarayanan et al. (2007)
recommend to schedule cotton irrigation based on percent depletion in available soil moisture (50 to 75%
depletion) or soil water potential of 0.5 bars in a soil profile of 30 cm depth. Trials conducted at Coimbatore and
20 / Water Footprint Reduction of Cotton Farming in India
Dharwad (with MCU 5 and hybrid Varalaxmi) reveals that cotton may be irrigated at 75% depletion of available
soil moisture for acceptable yield.
Systems to improve water use efficiency in cotton production using variable rate irrigation, coupled to remote and
local sensing systems are both operational and constantly being further developed at present. These technical
solutions include (and are not limited to) in situ soil water status sensing, plant water status sensing, canopy
reflectance measurement by drone copter, canopy photosynthetically active radiation absorption measurement,
canopy shape measurement by lidar, among others, which allow farmers to optimize decisions regarding when,
where and how much to irrigate. An example of a measurement system that can directly reduce the use of water
is the Biologically Identified Optimal Temperature Interactive Console (BIOTIC). The system provides irrigation
scheduling based upon measurements of canopy temperatures and the temperature optimum of a given crop
species (Wanjura et al., 2006). The threshold values to schedule an irrigation event are calculated from the thermal
optimum for the plant and the amount of time that a given species can exceed a temperature threshold and
adequately recover.
2.1.5 Crop variety and hybrids
There are four cultivated species of cotton, i.e. Gossypium hirsutum, G. arboreum, G. herbaceum and G.
barbadense. India is the only country worldwide in which all four cultivated species are grown, plus inter and intra
specific hybrids, under diverse agro-ecological conditions. The maximum area cultivated is covered by hybrids
(40%), followed by G. hirsutum (36%), G. arboreum (16%) and G. herbaceum (8%). The area under G.
Barbadense is negligible (0.2%) (MOFF, 2006).
The consumptive WF can potentially be reduced through use of improved crop varieties. In India different
varieties adapted to the different agro-ecological zones are required for optimum efficiency. In a study that focused
on yield of various cultivars, Halemani et al. (2009) investigated several cotton varieties in a two-year field trial
in Dharward district in Karnataka, India, during kharif season under rain-fed conditions. Among the genotypes
investigated in the study by Halemani et al. (2009), RCH-Bt hybrid recorded the highest seed cotton yield (2,784
kg/ha). It was followed by DHH-11 (2,158 kg/ha), Sahana variety (2,032 kg/ha) and DHB-290 hybrid (1,804
kg/ha). Low yields were recorded with Jayadhar (1,262 kg/ha) and DLSa-17 (1,409 kg/ha). Intensive research is
on-going regarding breeding and genetically modifying crops to develop varieties that are best suited for a given
environment, cope with pests and are both high yielding and optimized in terms of water and nutrient use.
Regarding the latter, CICR (2007) found that Hybrid-4 was more nutrient efficient and less exhaustive of soil
nutrients compared to varieties SRT-1 and AKH-4. Cultivars with such characteristics have the potential to lead
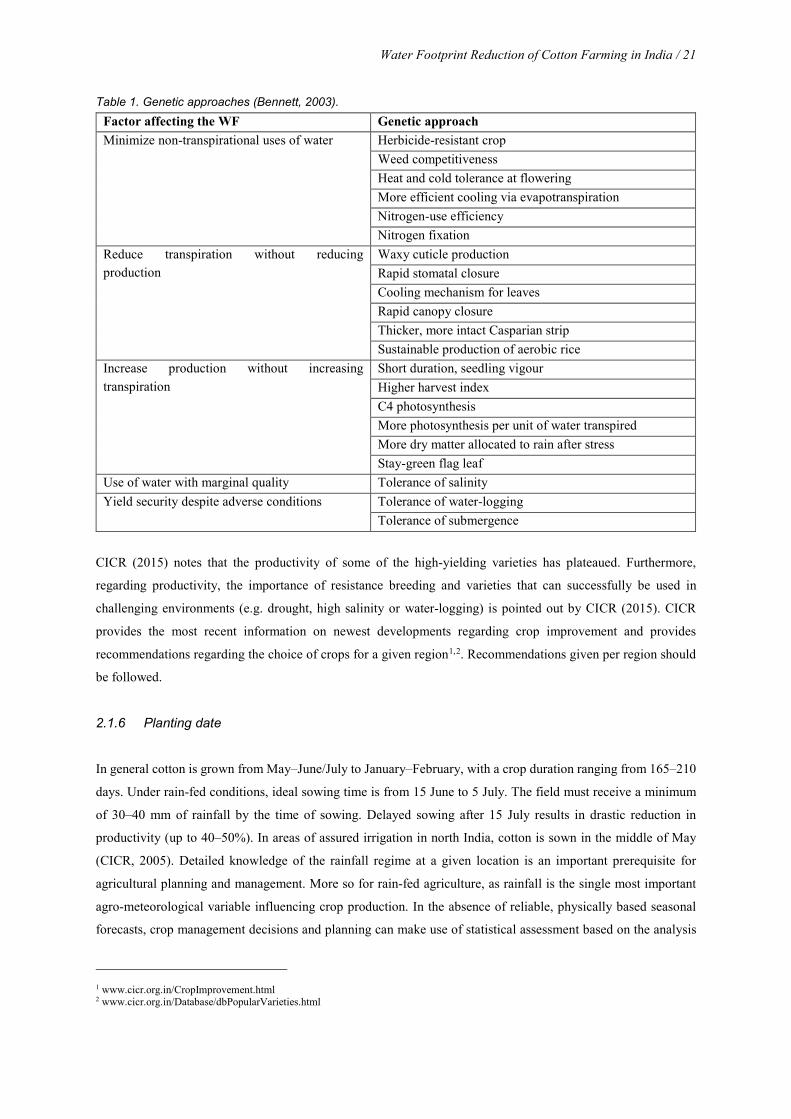
to a smaller consumptive WF as well. Bennett (2003) summarizes genetic approaches that have the potential to
support efforts to reduce the water footprint (Table 1). Some of these may result in WF reduction in the future
indeed, but are not investigated in detail here, as we strive for options that help in the short term.
Water Footprint Reduction of Cotton Farming in India / 21
Table 1. Genetic approaches (Bennett, 2003). Factor affecting the WF Genetic approach Minimize non-transpirational uses of water Herbicide-resistant crop
Weed competitiveness Heat and cold tolerance at flowering More efficient cooling via evapotranspiration Nitrogen-use efficiency Nitrogen fixation
Reduce transpiration without reducing production
Waxy cuticle production Rapid stomatal closure Cooling mechanism for leaves Rapid canopy closure Thicker, more intact Casparian strip Sustainable production of aerobic rice
Increase production without increasing transpiration
Short duration, seedling vigour Higher harvest index C4 photosynthesis More photosynthesis per unit of water transpired More dry matter allocated to rain after stress Stay-green flag leaf
Use of water with marginal quality Tolerance of salinity Yield security despite adverse conditions Tolerance of water-logging
Tolerance of submergence
CICR (2015) notes that the productivity of some of the high-yielding varieties has plateaued. Furthermore,
regarding productivity, the importance of resistance breeding and varieties that can successfully be used in
challenging environments (e.g. drought, high salinity or water-logging) is pointed out by CICR (2015). CICR
provides the most recent information on newest developments regarding crop improvement and provides
recommendations regarding the choice of crops for a given region1,2. Recommendations given per region should
be followed.
2.1.6 Planting date
In general cotton is grown from May–June/July to January–February, with a crop duration ranging from 165–210
days. Under rain-fed conditions, ideal sowing time is from 15 June to 5 July. The field must receive a minimum
of 30–40 mm of rainfall by the time of sowing. Delayed sowing after 15 July results in drastic reduction in
productivity (up to 40–50%). In areas of assured irrigation in north India, cotton is sown in the middle of May
(CICR, 2005). Detailed knowledge of the rainfall regime at a given location is an important prerequisite for
agricultural planning and management. More so for rain-fed agriculture, as rainfall is the single most important
agro-meteorological variable influencing crop production. In the absence of reliable, physically based seasonal
forecasts, crop management decisions and planning can make use of statistical assessment based on the analysis
1 www.cicr.org.in/CropImprovement.html 2 www.cicr.org.in/Database/dbPopularVarieties.html
22 / Water Footprint Reduction of Cotton Farming in India
of historical rainfall records of a given region. For example Ravindran (2000) provides a statistical analysis for
central India to support planning and management of rain-fed cotton cropping systems.
Yet in India farmers of rain-fed areas will still face the problem of sowing seeds on time in case of delay in the
onset of monsoon. Aggerwal et al. (2008) suggest to provide irrigation at the sowing time if monsoon is delayed,
i.e. apply supplemental irrigation, possibly from a previously installed rainwater harvesting system to provide for
initial soil moisture.
2.1.7 Nutrient management
Nutrient availability, particularly nitrogen and phosphorus, are critical to high yield and water use efficiency.
There is a large body of literature reporting the increase of e.g. cereal WUE with N application. At first, nitrogen
fertilization may increase the CO2 assimilation rate capacity. In addition, and probably more importantly,
fertilization increases the early growth and the crop cover, protecting the soil from evaporation and, consequently,
increasing the proportion of transpired water by the plant.
Indian soils not only show deficiency of primary nutrients (nitrogen, phosphorous and potassium) but also of
secondary nutrients (sulphur, calcium and magnesium) and micronutrients (boron, zinc, copper and iron, etc.) in
most parts of the country. Besides the three primary nutrients (N, P, K), deficiency of sulphur and micronutrients
like zinc and boron in many of the states, and of iron, manganese and molybdenum in some of the states, has
become a limiting factor in increasing crop productivity (Ministry of Agriculture of India, 2008; 2012). In a
comprehensive study carried out by the Indian Council of Agricultural Research (ICAR) through their coordinated
research project on micronutrients, toxic and heavy metals it was found that 48% of the soil samples analysed
were deficient in zinc, 33% in boron, 13% in molybdenum, 12% in iron, 5% in manganese and 3% in copper
(Ministry of Agriculture of India, 2012). Deficiency of micronutrients needs to be corrected through the
application of micronutrient carrying fertilizers. With regard to response of crops to the application of
micronutrients, under large scale agronomic trials conducted by ICAR, it has been observed that the additional
yield is obtained in cereals in the range of 0.3 to 0.6 ton per hectare. The response of micronutrients in food crops
and vegetables is highly pronounced. Under micronutrient deficient situations, the application of major nutrients
alone does not give expected results (MOFF, 2006). Similar trends can be expected for cotton.
Hussain et al. (2014) showed in a two-year field study of a Bt cotton-wheat cropping system, in New Delhi, India,
that N was the most limiting nutrient and there was a reduction in the seed cotton yield of about 28%, 7% and
15% due to N, P and K omissions during experimental year 2010. The corresponding figures for the year 2011
were a 27%, 16% and 12% NPK reduction, respectively. N continued to be the most limiting nutrient followed
by P and K during the year 2011. P omission led to the higher yield reduction during the second year of
experimentation, which proves that P supplies depleted faster in the cotton-wheat cropping than the K supply.
Lint yield followed similar trends. The yield reduction due to S and Zn omission ranged from 2% to 5%, which
was statistically at par with the plots under balanced fertilization both the years. Interestingly, Aujla et al. (2005)
find that the ratio of seed cotton yield to the sum total of irrigation water, profile water used and rainfall during
Water Footprint Reduction of Cotton Farming in India / 23
the growing season of cotton production in Bathinda, India, was not affected by the quantity of water applied, but
a decrease in rate of N caused a decrease in the ratio of seed cotton yield to the sum total of irrigation water,
profile water used and rainfall during the growing season at all the quantities of water applied.
It has been shown in various studies that, while WUE will in general increase initially when the amount of applied
fertilizer is increased, there is an optimum amount and beyond that amount WUE decreases (e.g. Ayars et al.,
1999; Caviglia and Sadras, 2001; Pandey et al., 2001; Zwart and Bastiaanssen, 2004). Furthermore, overuse of
nitrogen fertilizer makes the crop more susceptible to pests and diseases (Ministry of Agriculture, 2004). Using
excessive amounts of fertilizer is inefficient from a water use efficiency point of view, causes pollution of the
environment and is an unnecessary financial burden. Furthermore, fertilizer application is in particular efficient
when „spoon-fed“ together with irrigation (fertigation). This will be discussed in the following section.
Various recommendations regarding nutrient management are provided by CICR (2015) based on extensive field
studies:
• Sulphur coated urea and neem cake coated urea improved the efficiency of applied nitrogen as compared
to normal application of urea under irrigated condition, while for the rain-fed conditions urea + farm yard
manure (FYM) followed by neem cake treated urea were found to be efficient.
• Supplementing half of the recommended dose of fertilizer N with FYM viz. N30 P30 K30 + 5 t FYM/ha
and N45 P45 K46 + 7.5 t FYM/ha significantly increased seed cotton yield over N60 P30 K30 and N90
P45 K45, apart from improving the soil organic matter status in rain-fed cotton varieties and hybrid,
respectively, grown in vertisols.
• Sulphur application of 10 kg/ha significantly increased the seed cotton yield and dry matter production
in variety LRA-5166, while in H4 (an intraspecific hybrid) a linear response up to 20 kg/ha was observed.
• Cotton under rain-fed conditions responded positively to phosphate application at 40 kg P2O5/ha placed
at 7.5 cm depth in vertisols.
• Foliar application of 2% urea or DAP at 60 and 80 DAS (days after sowing) improved the seed cotton
yield by 15% in cotton varieties and hybrids.
• In the studies on long-term effect of nutrient management, cotton-sorghum rotation out-yielded cotton
monocrop by 38%. G.arboreum out-yielded G.hirsutum by 32-35%.
• Alternate sprays of potassium of 1% and DAP of 2% concentration (two to three sprays each at 15 days
interval from first blooming) was beneficial for high yielding, high strength, and higher cotton counts.
• Seed treatment with biofertilisers (Azotobacter chrococcum and Azospirillum brasiliense) with half the
recommended nitrogen dose resulted in higher seed cotton yield than with the recommended dose of
fertilizers.
• Micronutrient application of 10kg Zn, 10 kg Mn and 3 kg B/ha with 75 % soil and 25% foliar spray
improved seed cotton yield by 25 % under two supplemental irrigations.
As most of these measures result in increased yield, the consumptive WF per unit of crop may also be lowered by
applying such practices. It must be noted that some of the above mentioned practices could have a positive effect
24 / Water Footprint Reduction of Cotton Farming in India
on the grey WF as well. For brevity these will not be repeated later on in the section on grey WF, neither in the
section on combined measures below.
2.1.8 Combined measures
Rain-fed cotton yields are generally low due to erratic and uneven rainfall. Moisture stress during critical crop
growth stages, in particular boll development, is highly detrimental to productivity and potentially also increases
the WF. Various studies have shown that there is significant scope for improving efficiency of water use in rain-
fed farming through well planned and combined measures that together form a strategy suited for the given
situation and goals.
In-situ rainwater conservation is a key measure to improve yield. Cotton cultivation on ridges on contour in
sloping terrain conserves water, reduces soil erosion, reduces runoff of nutrients and improves yield. Ridge sowing
on 0.4% slope and fusion of ridges at 6 m intervals just before the normal withdrawal of monsoon is a
recommended practice. The excess water can be collected in farm ponds and recycled at the critical boll
development stage in order to improve rain-fed cotton yields significantly (MOFF, 2006). Rockström et al. (2003)
show detailed results from two experimental investigations regarding the feasibility of improving the ratio of yield
to the sum of rainfall and irrigation through supplemental irrigation, combined with soil-fertility management at
farm level in rain-fed agriculture in semi-arid locations. During 1998–2000 the impact of supplemental irrigation,
combined with soil-fertility management at sites in Kenya (Machakos district) and Burkina Faso (Ouagouya) on
the ratio of yield to the sum of rainfall and irrigation through supplemental irrigation has been investigated. This
ratio has been reported to improve for supplemental irrigation alone by 37% on average for the site in Burkina
Faso on shallow soil with low water holding capacity, whereas the average increase for the experiments in Kenya
on deep soil with high water holding capacity was 38%. Fertilizer application alone leads to higher average yield
and higher ratio of yield to the sum of rainfall and irrigation through supplemental irrigation during years with
gentle dry spells. However, combined application of supplemental irrigation and fertilizer application resulted in
the highest yield and ratio of yield to the sum of rainfall and irrigation through supplemental irrigation.
Wisser et al. (2010) studied the effect of water harvesting using small reservoirs for irrigation purposes on
improving transpiration (green) water fluxes for cropland areas and the implications for food production. They
estimated that about one third of the volume currently supplied to contemporary irrigated areas is supplied by
water from locally stored runoff, i.e. small reservoirs or shallow groundwater. Globally, the supplemental
irrigation of existing cropland areas could increase cereal production by about 35% for a medium variant of
reservoir capacity (with a catchment command area ratio of 5, i.e. the catchment area of the reservoir at which
runoff is collected is five times bigger than the cultivated area supplied by the reservoir). Large potential increases
have been determined for low-yield regions in Africa and Asia.
In a field study at Coimbatore, India, in 2007-08, various fertilizer levels applied through fertigation were
compared to soil application of fertilizer regarding the effect on WUE. While application of 100% RDF
(recommended dose of fertilizer) resulted in the overall highest WUE, 75% RDF applied through fertigation was
Water Footprint Reduction of Cotton Farming in India / 25
at par with 100% RDF soil application, hence a 25% reduction of fertilizer is feasible without change in WUE
(CICR, 2008).
A field experiment was conducted for RCHB 708 Bt cotton production in Nagpur, India, during 2007-08 to
determine the effect of drip irrigation (40% ETc, 80% ETc), polyethylene mulch and polyethylene mulch + drip
irrigation (40% ETc, 80% ETc) compared to conventional surface irrigation (CICR, 2008). Regardless if with or
without drip irrigation, polyethylene mulched cotton production had higher ratio of seed cotton yield to the sum
of irrigation water and effective rainfall than drip alone. Drip irrigation at 40% ETc + polyethylene mulching had
the highest ratio of seed cotton yield to the sum of irrigation water and effective rainfall, with an increase from
the control treatment of 230%. It should be noted that conventional surface irrigation combined with polymulch
was roughly at par with drip irrigation at 80% ETc + polyethylenmulch (~130% increase in ratio of seed cotton
yield to the sum of irrigation water and effective rainfall compared to conventional treatment). Drip irrigation at
40% ETc alone led to an increase of the ratio of seed cotton yield to the sum of irrigation water and effective
rainfall by ~120%.
In a comprehensive field study, Kumar and Dey (2011) evaluated the effects of different mulches (no mulch, hay,
black polyethylene) and irrigation methods (rain-fed, surface irrigation, drip irrigation) on root growth, nutrient
uptake, water use efficiency and yield of strawberry in Nauni, district Solan of Himachal Pradesh, India. Drip
irrigation (levels were equivalent to 100, 80 and 60% of the crop ET based on pan evaporation), irrespective of
mulch and no mulch treatments, resulted in significantly higher yield over surface irrigation (under surface
irrigation water was applied at irrigation water to cumulative pan evaporation ratio of 1). Drip irrigation without
mulch with 1.0 crop ET, 0.8 crop ET and 0.6 crop ET volume of water increased the berry yield by 22, 8 and 1%,
respectively over surface irrigation. The corresponding values for drip irrigation and black polyethylene mulch
with these levels of irrigation exceeded those with surface irrigation by 22, 11 and 4%. Overall black polyethylene
mulch proved to be superior to hay mulch. Drip irrigation, both with and without mulch resulted in higher yield
per total water applied as compared to surface irrigation. Considering average value for all levels of irrigation,
drip irrigation without mulch gave a 60% higher yield per total water applied when compared with surface
irrigation. The corresponding values for black polyethylene mulch and hay mulch were 61% and 54%,
respectively.
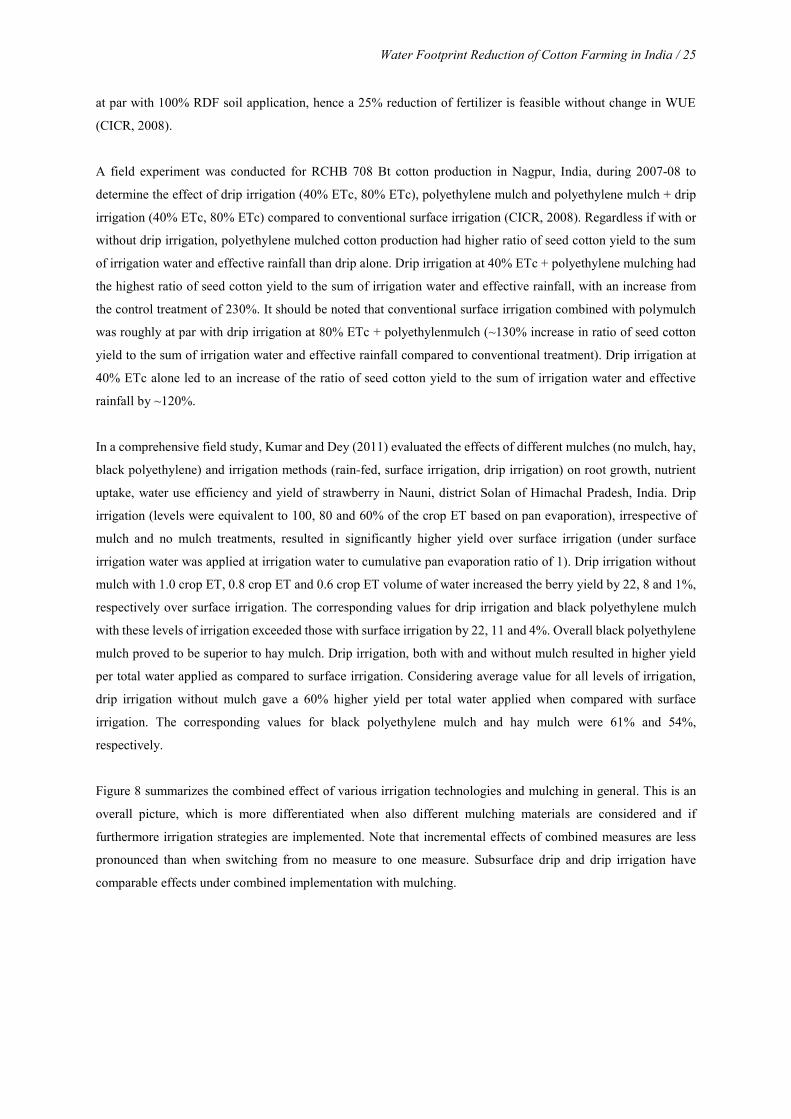
Figure 8 summarizes the combined effect of various irrigation technologies and mulching in general. This is an
overall picture, which is more differentiated when also different mulching materials are considered and if
furthermore irrigation strategies are implemented. Note that incremental effects of combined measures are less
pronounced than when switching from no measure to one measure. Subsurface drip and drip irrigation have
comparable effects under combined implementation with mulching.
26 / Water Footprint Reduction of Cotton Farming in India
Figure 8. Effect of combined application of irrigation technologies and mulching on yield and evapotranspiration (for comparison, the dotted orange lines represent the situation with mulching alone, as shown in Figure 5)
In general and in particular for the long-term sustainability, in multiple cropping systems the possibility of more
efficient use of resources like nutrients and water is higher, leading to increased biological diversity and higher
production stability (CICR, 2011). For short term effects, for cotton sown with intercrops on suitable soils with
one or two protective irrigations, the seed cotton yield can potentially be increased even on shallow soils (CICR,
2008). To that end, Singh et al. (2009) investigated in a two-year field study in New Delhi, India, from 2006-2008
the effect of groundnut as cotton intercrop in a cotton-wheat system. Groundnut as an intercrop enhanced the
productivity of cotton by 0.25 t/ha and succeeding wheat by 0.16 t/ha. These increases in productivity of cotton
and wheat coupled with additional intercrop groundnut yield (0.47 t/ha) together enhanced the productivity of
cotton + groundnut - wheat systems in seed cotton equivalent yield by 0.58 t/ha over cotton-wheat system.
Furthermore, CICR (2015) makes the following recommendations regarding efficient cotton based cropping
systems:
• Green gram, black gram and soybean were identified as suitable intercrops for varieties grown in wider
spacing (90 cm) and hybrids. For irrigated southern region, cowpea and small onion were found to be
best suited for intercropping.
• Of the several soybean genotypes, five were identified compatible for intercropping with cotton: Punjab
1, TAS 40, Pusa 16, PK 472 and PKV 1.
• Cotton intercropped with cowpea harbours more of coccinellids and in addition to higher parasitisation.
• Intercropping of green gram with cotton enhanced ratio of yield to water applied of cotton by 22%, while
black gram lead to an increase of 19% compared to the control system of sole cotton.
• Maize when grown as a rotation crop after cotton in the same polymulch sheet with zero tillage, gave 2.8
t/ha of additional yield than conventional system.
Water Footprint Reduction of Cotton Farming in India / 27
• The highest seed cotton yield (14.2 q/ha) was obtained with intercropping of one row black gram between
cotton rows which was closely followed by cotton + green gram intercropping system (14.2 q/ha) and
cotton + soybean system (13.9 q/ha) under rain-fed condition.
• Diversification of cotton by rotating with jowar (Sorghum bicolor) for both grain and fodder has
substantial benefits in terms of quantity and quality of outputs besides improvement of soils.
Lastly, spacing and plant density must be optimized for highest yield. Recommendations are given in Appendix I.
2.1.9 Other soil and crop management
There is a broad range of further management options geared towards soil and crop management, aimed at
increasing yields (increasing yields implies lowering consumptive WF per unit of crop), some of which affect
non-productive E as well (and thus total ET).
Broadly speaking there are two fundamental approaches regarding the aim of increasing yields: intensive
conventional farming (high-yielding hybrid or genetically modified cultivars, i.e. Bt cotton, full tillage, mineral
nutrient application, cultivar related pesticide application) versus conservation agriculture (selected high-
yielding, preferably locally adapted breeding, non-genetically modified cultivars, no or reduced tillage, organic
nutrients, no pesticides, alternative weed management, crop rotation, intercropping and/or surface cover). Both
methods aim at increasing yields. The consumptive WF per unit of crop is lowered with higher yields, which is
the aim of both systems. Regardless, the two methods conventional farming and conservation agriculture more
clearly differentiate in terms of their grey WF (see below).
An example is given by CICR (2008), where for Bt cotton various measures were evaluated in a field experiment
in Nagpur, India, in 2007-08, to determine the difference in yield per volume of water applied between rigde +
furrow, intercropping with green gram and intercropping with green gram + in situ mulching with sunhemp.
Highest cotton yield per water applied was found for intercropping with green gram + in situ mulch treatments
with sunhemp.
Pretty et al. (2006) identify an improvement potential in terms of water productivity through adoption of
sustainable agricultural technologies and practices of about 29% for irrigated cotton. The strategies investigated
related to cotton production were: (1) Integrated pest management, which uses ecosystem resilience and diversity
for pest, disease, and weed control, and seeks only to use pesticides when other options are ineffective. (2)
Integrated nutrient management, which seeks both to balance the need to fix nitrogen within farm systems with
the need to import inorganic and organic sources of nutrients, and to reduce nutrient losses through erosion control.
(3) Conservation tillage, which reduces the amount of tillage, sometimes to zero, so that soil can be conserved
and available moisture used more efficiently. (4) Water harvesting in dryland areas, which can mean formerly
abandoned and degraded lands can be cultivated, and additional crops can be grown on small patches of irrigated
land owing to better rainwater retention.
28 / Water Footprint Reduction of Cotton Farming in India
Further combined agronomic practices have potential to reduce the WF. In a field trial in Coimbatore, India,
during 2007-2008, the effect of chisel ploughing (used to loosen the soil without inversion, so that organic matter
decomposes slowly, and soil moisture is not turned upward), drip fertigation, and foliar sprays on water use
efficiency in ELS Bt hybrid cotton production has been studied. While the most comprehensive treatment of chisel
ploughing, drip fertigation and three foliar sprays resulted in the highest ratio of yield to water used (53% higher
than the control), it was found that less labour intensive and less costly treatments did not result in significant
yield per water used reductions (chisel+drip+2 foliar sprays: 50% higher than the control; chisel + drip: 48%
higher than control).
CICR (2005) state that undulating topography is the second most important factor in reducing the yield of rain-
fed cotton. Therefore land levelling (best: laser land levelling) and planting on contour in sloping terrain are
effective measures to achieve a reduction of the water footprint.
Soil management plays an important role to improve production, in particular for poor soils. It has been shown
that application of FYM at 5 t/ha, soil incorporation of in-situ grown legume and further addition of 10 t/ha subabul
or sesbania lopping at 45 DAS supplied available nutrients and also helped in conserving 2% additional moisture,
resulting in increasing seed cotton yields by 15-20% over the recommended N60 P30 K30 in resource poor soils
(CICR, 2015).
The role of tillage has been changing and is likely to keep on changing as the advantage of direct-drilling
techniques become more widely appreciated, not only for improving crop performance, but also for protecting the
soil (Passioura, 2006). Tillage and residue management can sustain productivity and recommendations are given
by CICR (2015):
• Reduced tillage system comprising pre-plant herbicide application and one pass of harrow and two inter-
row cultivation for early and late season weed control, respectively, was found to be a viable technology
to cotton growers of central India.
• Deep ploughing once in three years, and two shallow ploughings every year, are essential during the
summer. One to two deep ploughings once in three years are necessary to control deep-rooted weeds and
to destroy pest larvae or cocoons. For example, deep ploughing once in two years before cotton sowing
was found effective in increasing the yield of irrigated cotton wheat system.
• Conventional tillage (one time disc + two time cultivator) for irrigated wheat was found beneficial in
increasing the yield of irrigated cotton-wheat system.
• Cotton stalk and wheat straw shredded and incorporated in the soil after crop harvest was found helpful
in improving soil fertility and yield of cotton- wheat system under irrigated conditions.
Soil moisture conservation management practices are in general beneficial, yet even more so under water scarce
conditions. Soil moisture increase in different cropping systems was found to be associated with higher yield of
cotton and cotton based cropping system in each toposequence studied at Thugaon region, Pune, Maharashtra,
India (CICR, 2005). Results showed that under improved management practices, seed cotton yield increased
Water Footprint Reduction of Cotton Farming in India / 29
considerably in all the toposequences (65% in upper toposequence with very shallow soil, 46% in middle
toposequence with shallow to medium deep soil, 31% in lower toposequence with medium deep to deep soil and
51% in bottom toposequence with very deep soil) over farmer’s management practices. Furthermore,
supplemental irrigation to cotton and cotton-based cropping systems from harvested rainwater was applied in
different toposequences. Results showed that one protective irrigation to cotton crop at peak boll development
stage at 6 ha cm of stored rainwater was found very effective in increasing seed cotton yield by 69% in upper
toposequence, 75% in middle toposequence and 59% in lower toposequence over farmers management (CICR,
2005). Efforts of in-situ moisture conservation or application of protective irrigation to cotton (e.g. from harvested
rainwater) in these soils to improve moisture availability will give a boost to crop yield under rain-fed conditions.
In conclusion there is a technological yield gap that can be reduced by applying adequate management strategies.
2.2 Reduction of the grey water footprint
The grey water footprint (WF) of crop cultivation per unit of crop is defined as the volume of water required to
assimilate pollutants applied to the field (nutrients and pesticides) that leach to the groundwater or run off to
surface water divided by the yield (Y) and is often expressed in terms of m3/t (or litre/kg) (Hoekstra et al., 2011).
The grey WF can thus be reduced by applying less nutrients or pesticides, by applying chemicals that can be easier
assimilated (require less water to get assimilated), by lowering the fractions of applied chemicals that reach
ground- or surface water by leaching or runoff, or by increasing the yield.
2.2.1 Increasing yield in organic farming
In the meta-studies of De Ponti et al. (2012) - not including cotton - and Seufert et al. (2012) - including cotton -
it was found that yields from organic agriculture average 20–25% less than those from conventional agriculture,
thereby exhibiting large variations (De Ponti et al. find a standard deviation of 21%). Furthermore, although yields
of organic fruit and oilseed are only 3% and 11% less, respectively, than those of conventional agriculture, yields
of organic cereals and vegetables are 26% and 33% less, respectively (Seufert et al., 2012). Swezey et al. (2006)
carried out a six-year comparison between organic, integrated pest management (IPM) and conventional cotton
production systems in the Northern San Joaquin Valley, California. Average 6-year yields were 4.4, 5.4 and 6.7
bales per ha for organic, IPM and conventional treatments, respectively. The lower yields in organic fields were
likely due to lower plant densities and higher weed pressure.
Specifically for cotton-based farming systems, Forster et al. (2013) present results from the conversion period
(first four years after inception of the trial, i.e. 2007-2010) of cotton-soybean-wheat crop rotation under
biodynamic, organic and conventional (with and without Bt cotton), representative for vertisol soils in Madhya
Pradesh, central India. For the first crop cycle a significant yield gap between organic and conventional farming
systems for cotton (-29%) and wheat (-27%) was observed, whereas in the 2nd crop cycle (cycle 2: 2009–2010)
cotton and wheat yields were similar in all farming systems due to lower yields in the conventional systems. In
contrast, organic soybean (a nitrogen fixing leguminous plant) yields were marginally lower than conventional
yields (-1% in cycle 1, -11% in cycle 2). Foster et al. (2013) note that across all crops, conventional farming

30 / Water Footprint Reduction of Cotton Farming in India
systems achieved significantly higher gross margins in cycle 1 (+29%), whereas in cycle 2 gross margins in
organic farming systems were significantly higher (+25%) due to lower variable production costs but similar
yields.
The analysis of Safaya et al. (2015) shows for the growing season 2013 that organic cotton production systems
had overall the lowest yield. REEL farming systems exceeded the conventional systems in terms of yield for
Gujarat and Maharashtra (Table 2).
Table 2. Statewise cotton yield per agricultural practice for the growing season 2013 (Safaya et al., 2015).
Agricultural practice Yield [t/ha] State Madhya Pradesh Gujarat Maharashtra
Conventional 1.49 2.30 2.01 REEL Not applicable 3.20 3.49 Organic Not applicable 1.15 1.06
It must be noted that the organic farms considered here have only recently been converted from conventional to
certified organic production. Hence improvements similar to those found by Forster et al. (2013) could potentially
be expected for future growing seasons.
Promising measures and combinations thereof to increase yield in organic farming are (these have been discussed
earlier and are merely re-stated here): timely sowing; optimum spacing and plant density; mulching; in situ water
harvesting practices; irrigation management; levelling/contour cultivation; intercropping; crop rotation; soil
improvement; pest management; using improved varieties that thrive well in organic farming. Some of the
improved varieties, suitable for organic management in Maharashtra are (MOFF, 2005): G. hirsutum – LRA-5166,
LRK-516 (Anjali), Rajat (PKV-84635), PKV-081, DHY-286, Dhaval (JLH-168) G. arboreum – AKH-4, AKA-
8401, Y-1, PA-183, Namdeo PA-141, Savta PA-181. PKV Hy2, 3,4 hybrids, H6, 8 and 10, Ankur 651, MECH-
1,4 and NHH-44 have also been found suitable for organic management.
CICR (2015) developed and recommends a strategy for organic cotton production using organic soil amendments
and bio-control based pest management with the following key inputs:
Organic soil amendments:
• Farmyard manure of 5 t/ha
• In-situ green manure with fodder cowpea at 40 DAS
• Spreading loppings from Sesbania spp. obtained from 2 m dense rows after 10 cotton rows.
• Vermicompost prepared from farm waste including cotton stalks and weeds of 2 t/ha
• Seed inoculation of Azotobacter of 500 g/ha seed.
Biocontrol based pest management:
• Release of Chrysoperla sp of 500-1000/ha 20-25 DAS and at 35 DAS.
• Release of Trichogramma of 5 cards/ha at 45 DAS.
Water Footprint Reduction of Cotton Farming in India / 31
• Spray of H-NPV of 250 LE for young bollworms of H. armigera.
• Alternate spray with B.t formulation of 1.5 l/ha.
• Release of Bracon hebator to kill bollworm larvae. Bird perches of 4/ha.
Spotted bollworms (brown) damage the shoots. The American bollworm (green) or the pink bollworm damage
flowers and fruits when the crop is about 40–45 days old. To control these insects, the following measures are
recommended (MOFF, 2006):
a) Foliar spray of 5% NSKE (neem seed kernel extract) is quite effective.
b) Use of dashaparni and gomutra (2.5 litres dashaparni extract and 2.5 litres cow urine in 200 litres water)
can also effectively control these bollworms.
c) A garlic-chili-ginger extract has been found effective and is used by a large number of farmers in
Maharashtra.
d) In case of a severe attack of bollworm, use alternate sprays of dashaparni and garlic-chili-ginger extract.
e) A 5–10 % spray of HNPV (Helicoverpa Nuclear Polyhedrosis Virus) can also control attacks of
bollworms.
f) Some other control measures adopted successfully by farmers in Maharashtra include the following:
• Onion (20–25 kg) is crushed and applied as soil treatment through irrigation to control soil-borne
pests and diseases.
• The hairy/woolly caterpillar is controlled by spraying one litre juice of aloe vera mixed in 200 litres
of water per ha.
• In the fourth month, two litres of lemon juice and 200 litres of water are sprayed over 1 ha to reduced
bollworm incidence.
• Crush tamarind and mahua tree bark, 10 kg each, in 50 litres of water. The filtered and diluted extract
can be sprayed over one hectare area to control the worms.
• Flour spray (2 cups of fine white flour and half a cup of soap in water) and soft soap spray (15 gm
soft soap powder in 15 litres of water) have been found to be effective in control of aphids, jassids,
spider mites, thrips and white fly.
• Fermented buttermilk spray: ferment buttermilk in a bottle/can for 3–4 weeks; 300 ml fermented
buttermilk is diluted in 15 litres of water) and is effective in control of bollworms, caterpillars and
spider mites.
• Crush 5 kg lantana leaves in 5 litres of water and 10 litres of cow urine and ferment for 4 days. Dilute
thereafter with 60 litres of water and spray on 1 ha to control fungal and viral diseases. The solution
also repels white flies.
2.2.2 Type of pesticide
Cultivars are prone to damage by varied insect pests and diseases throughout the cropping period and yield losses
may be a consequence. Yet indiscriminate use of pesticides, i.e. a large number of sprays, supply of spurious
insecticides, incorrect sprayer and droplet size resulted in development of resistance in cotton pests as well as
32 / Water Footprint Reduction of Cotton Farming in India
resurgence problems (CICR, 2007). Effects of pesticide use in cotton production were reported by Franke and
Mathews (2013). They report results of a detailed study on the water pollution related to cotton production in
Gujarat and Madhya Pradesh, India, thereby comparing conventional and organic cultivation systems of 240 farms
each. Conventional production resulted in an average yield of 0.50 ton per acre and was hence higher than average
organic yield with 0.45 ton per acre Yet the average grey water footprint was about five times higher for
conventional farming (266 m3/t for conventional and 53 m3/t for organic). It was found that in particular the
pesticides Endosulphan and Cypermetrine lead to large grey water footprint values in conventional farming.
The study by Safaya et al. (2015) for 702 cotton farms in three states of India shows that for the growing season
2013 the grey WF decreased from conventional to REEL and organic production (Table 3).
In the state of Gujarat the average WF of conventional production is 3 times the WF of REEL systems, and 22
times the WF for organic systems. The average WF values for conventional systems is 5 times the WF of REEL
systems and 22 times the WF of organic systems in Maharashtra. No comparison for Madhya Pradesh is feasible
due to lack of data on REEL and organic systems.
Safaya et al. (2015) also identified the determining pollutants and the respective grey water footprint for the farms
studied. These pollutants are listed in Table 4 for the 2013 growing period for conventional, REEL and organic
farming systems, together with the Pesticide Action Network (PAN) category of toxicity (1: extremely toxic, 2:
highly toxic, 3: moderately toxic, 4: slightly toxic, 5: not acutely toxic, ni: no information available) and the
number of pests targeted. The average grey WF of nitrogen and phosphorus, the two most critical fertilizer
substances with respect to the grey water footprint, are also included and listed separately at the bottom.
Replacing pollutants that result in exceptionally large grey WFs with less harmful, but equally or even more
efficient substances in terms of number of pests targeted is of critical importance in order to significantly reduce
the grey WF. Dimethoate is a recommended insecticide targeted at jassids, aphids and thripds. among others (total
number of pests targeted: 11, see Table 4) by CICR (see Appendix III). The work by Safaya et al. (2015) shows
that this substance has a comparably high grey water footprint. Yet the evaluation to identify short term solutions
to reduce the grey WF may need to consider the efficiency and most importantly must be tailored to the issues on
a particular field. Another pesticide recommended by CICR for those pests is Methyl demeton 25 EC, also
applicable for whiteflies. Alas no information regarding its grey WF is available for a comparison. Endosulfan 35
EC is listed as a choice to be applied in case of spotted, pink and American bollworms infestations. Endosulfan-
500 was found to be a determining pollutant in the study by Franke and Mathews (2013). CICR give as an
alternative Chlorpyriphos 20 EC. There may be opportunities to replace various determining substances with
others that are equally effective, yet less polluting, less toxic, but target the same pests, or are even applicable for
a larger number of pests. Table 4 and Appendix II provide information in that respect, but detailed analyses must
be carried out in the future in order to make recommendations based on adequate data.
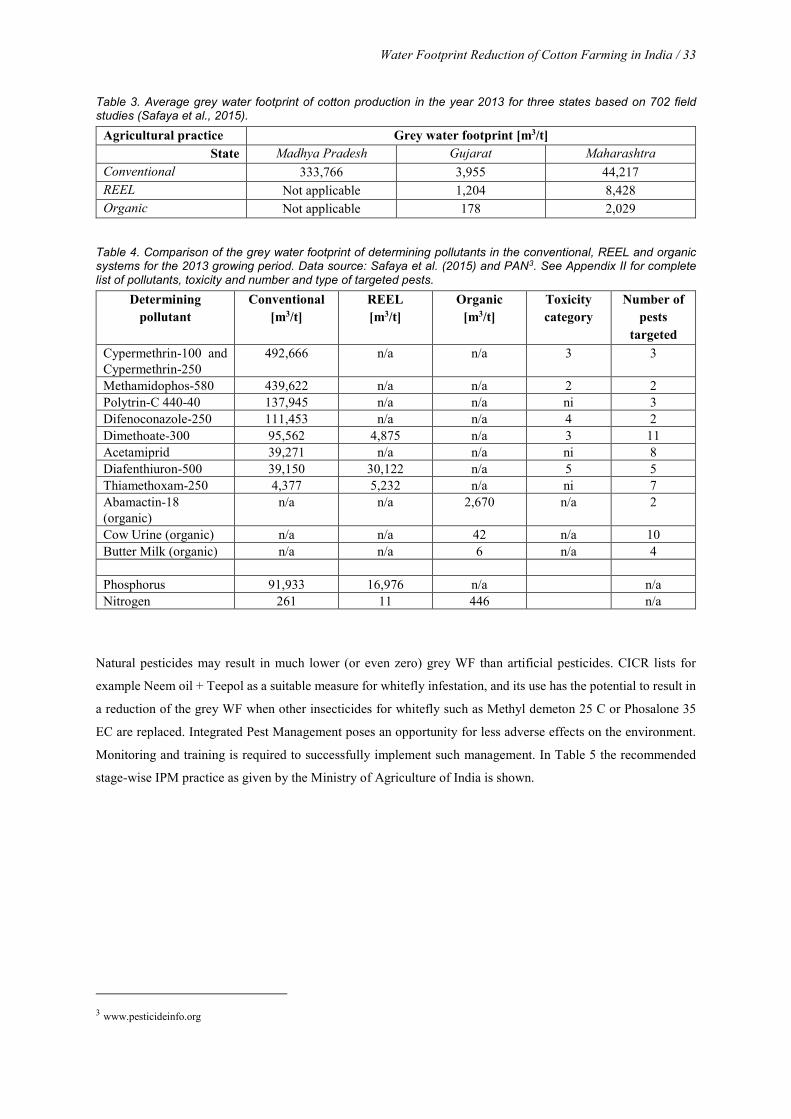
Water Footprint Reduction of Cotton Farming in India / 33
Table 3. Average grey water footprint of cotton production in the year 2013 for three states based on 702 field studies (Safaya et al., 2015).
Agricultural practice Grey water footprint [m3/t] State Madhya Pradesh Gujarat Maharashtra
Conventional 333,766 3,955 44,217 REEL Not applicable 1,204 8,428 Organic Not applicable 178 2,029
Table 4. Comparison of the grey water footprint of determining pollutants in the conventional, REEL and organic systems for the 2013 growing period. Data source: Safaya et al. (2015) and PAN3. See Appendix II for complete list of pollutants, toxicity and number and type of targeted pests.
Determining pollutant
Conventional [m3/t]
REEL [m3/t]
Organic [m3/t]
Toxicity category
Number of pests
targeted Cypermethrin-100 and Cypermethrin-250
492,666 n/a n/a 3 3
Methamidophos-580 439,622 n/a n/a 2 2 Polytrin-C 440-40 137,945 n/a n/a ni 3 Difenoconazole-250 111,453 n/a n/a 4 2 Dimethoate-300 95,562 4,875 n/a 3 11 Acetamiprid 39,271 n/a n/a ni 8 Diafenthiuron-500 39,150 30,122 n/a 5 5 Thiamethoxam-250 4,377 5,232 n/a ni 7 Abamactin-18 (organic)
n/a n/a 2,670 n/a 2
Cow Urine (organic) n/a n/a 42 n/a 10 Butter Milk (organic) n/a n/a 6 n/a 4 Phosphorus 91,933 16,976 n/a n/a Nitrogen 261 11 446 n/a
Natural pesticides may result in much lower (or even zero) grey WF than artificial pesticides. CICR lists for
example Neem oil + Teepol as a suitable measure for whitefly infestation, and its use has the potential to result in
a reduction of the grey WF when other insecticides for whitefly such as Methyl demeton 25 C or Phosalone 35
EC are replaced. Integrated Pest Management poses an opportunity for less adverse effects on the environment.
Monitoring and training is required to successfully implement such management. In Table 5 the recommended
stage-wise IPM practice as given by the Ministry of Agriculture of India is shown.
3 www.pesticideinfo.org
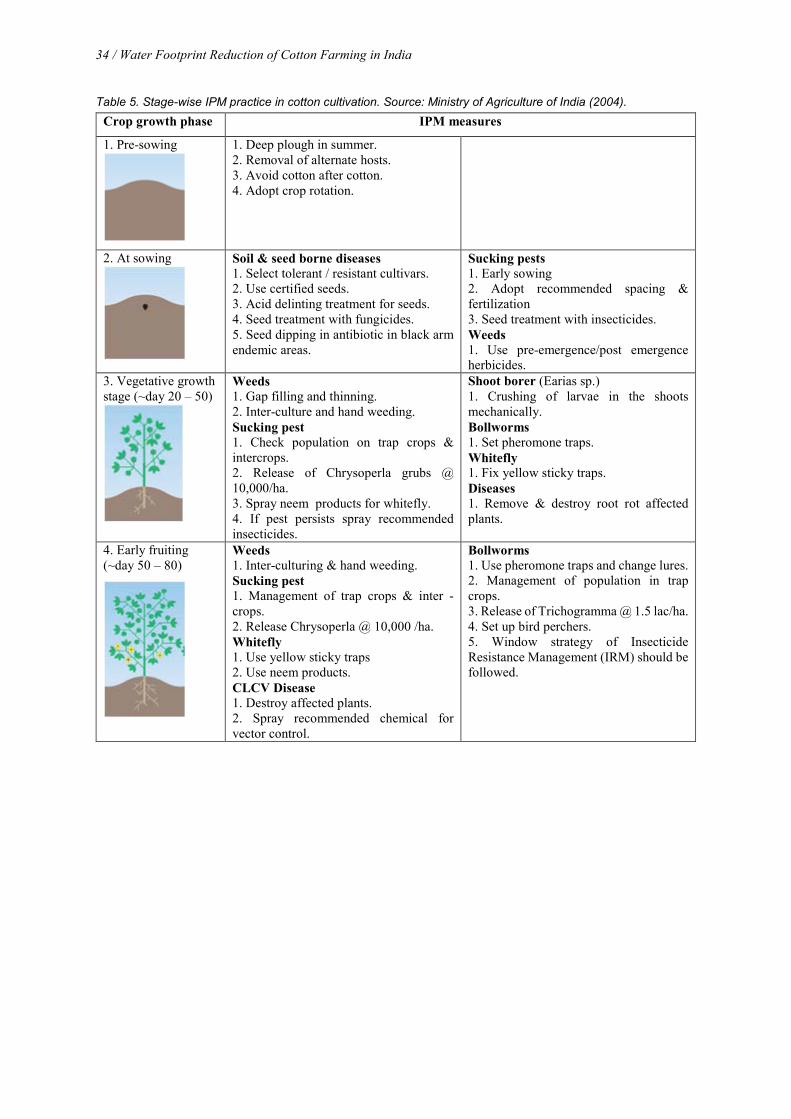
34 / Water Footprint Reduction of Cotton Farming in India
Table 5. Stage-wise IPM practice in cotton cultivation. Source: Ministry of Agriculture of India (2004). Crop growth phase IPM measures
1. Pre-sowing
1. Deep plough in summer. 2. Removal of alternate hosts. 3. Avoid cotton after cotton. 4. Adopt crop rotation.
2. At sowing
Soil & seed borne diseases 1. Select tolerant / resistant cultivars. 2. Use certified seeds. 3. Acid delinting treatment for seeds. 4. Seed treatment with fungicides. 5. Seed dipping in antibiotic in black arm endemic areas.
Sucking pests 1. Early sowing 2. Adopt recommended spacing & fertilization 3. Seed treatment with insecticides. Weeds 1. Use pre-emergence/post emergence herbicides.
3. Vegetative growth stage (~day 20 – 50)
Weeds 1. Gap filling and thinning. 2. Inter-culture and hand weeding. Sucking pest 1. Check population on trap crops & intercrops. 2. Release of Chrysoperla grubs @ 10,000/ha. 3. Spray neem products for whitefly. 4. If pest persists spray recommended insecticides.
Shoot borer (Earias sp.) 1. Crushing of larvae in the shoots mechanically. Bollworms 1. Set pheromone traps. Whitefly 1. Fix yellow sticky traps. Diseases 1. Remove & destroy root rot affected plants.
4. Early fruiting (~day 50 – 80)
Weeds 1. Inter-culturing & hand weeding. Sucking pest 1. Management of trap crops & inter -crops. 2. Release Chrysoperla @ 10,000 /ha. Whitefly 1. Use yellow sticky traps 2. Use neem products. CLCV Disease 1. Destroy affected plants. 2. Spray recommended chemical for vector control.
Bollworms 1. Use pheromone traps and change lures. 2. Management of population in trap crops. 3. Release of Trichogramma @ 1.5 lac/ha. 4. Set up bird perchers. 5. Window strategy of Insecticide Resistance Management (IRM) should be followed.
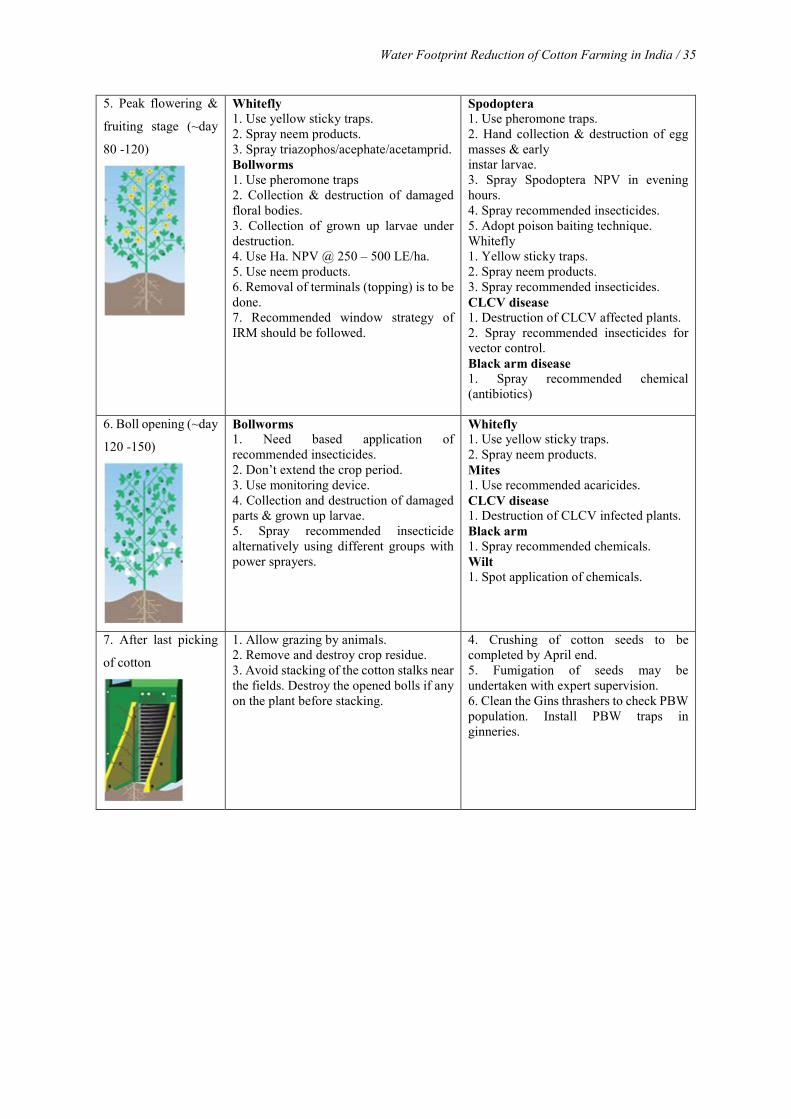
Water Footprint Reduction of Cotton Farming in India / 35
5. Peak flowering &
fruiting stage (~day
80 -120)
Whitefly 1. Use yellow sticky traps. 2. Spray neem products. 3. Spray triazophos/acephate/acetamprid. Bollworms 1. Use pheromone traps 2. Collection & destruction of damaged floral bodies. 3. Collection of grown up larvae under destruction. 4. Use Ha. NPV @ 250 – 500 LE/ha. 5. Use neem products. 6. Removal of terminals (topping) is to be done. 7. Recommended window strategy of IRM should be followed.
Spodoptera 1. Use pheromone traps. 2. Hand collection & destruction of egg masses & early instar larvae. 3. Spray Spodoptera NPV in evening hours. 4. Spray recommended insecticides. 5. Adopt poison baiting technique. Whitefly 1. Yellow sticky traps. 2. Spray neem products. 3. Spray recommended insecticides. CLCV disease 1. Destruction of CLCV affected plants. 2. Spray recommended insecticides for vector control. Black arm disease 1. Spray recommended chemical (antibiotics)
6. Boll opening (~day
120 -150)
Bollworms 1. Need based application of recommended insecticides. 2. Don’t extend the crop period. 3. Use monitoring device. 4. Collection and destruction of damaged parts & grown up larvae. 5. Spray recommended insecticide alternatively using different groups with power sprayers.
Whitefly 1. Use yellow sticky traps. 2. Spray neem products. Mites 1. Use recommended acaricides. CLCV disease 1. Destruction of CLCV infected plants. Black arm 1. Spray recommended chemicals. Wilt 1. Spot application of chemicals.
7. After last picking
of cotton
1. Allow grazing by animals. 2. Remove and destroy crop residue. 3. Avoid stacking of the cotton stalks near the fields. Destroy the opened bolls if any on the plant before stacking.
4. Crushing of cotton seeds to be completed by April end. 5. Fumigation of seeds may be undertaken with expert supervision. 6. Clean the Gins thrashers to check PBW population. Install PBW traps in ginneries.
36 / Water Footprint Reduction of Cotton Farming in India
The first 50-60 days are very important for crop growth. Weeds compete with the crop for nutrients and water,
resulting in poor crop yields if they are not removed in time. The first weeding is done 20–25 days after sowing
and the second, 55–60 days after sowing. Mulching of the field reduces weed growth (MOFF, 2006). Weeds may
potentially be managed well through other measures than herbicides alone. CICR (2013) find in a field study at
Nagpur, India, that weeds can potentially be managed by an integrated approach, thereby applying a pre-
emergence herbicide such as pendimethalin (1 kg/ha), followed by in situ cover crops around 35-40 DAS and one
hand weeding around 70-75 DAS to remove the later emerging weeds. While sunflower is not recommended as
cover crop with cotton, sorghum, sunhemp, wheat, barley were beneficial. Wheat and barley also qualified as
cover crop. Of the mulching types, black polyethylene mulch best suppresses weed growth.
Biodiversity is one of the key measures to keeping pest populations below the economic threshold limit (ETL).
Intercropping of cotton with red gram, cowpea, soybean, moong, sorghum/maize and random planting of marigold
and Hibiscus subdariffa (lal ambari) are potential means to limit the pest population to the ETL. Assassin bugs,
predatory beetles, ants, lacewing larvae, parasitic wasps (Trichogramma), among others, are some of the important
natural enemies of pests (MOFF, 2006).
Hand picking of infested buds and bolls and removal of cotton stocks help in control of bollworms. Jaggery
powder (10 kg/ha) sprayed on the soil surface will attract ants that feed on the larvae. About 10–12 bird perches
installed in one hectare attract birds that also consume cotton pests. Yellow rice (one kilo rice cooked with turmeric
powder) kept on or near perches attracts predatory birds. Yellow coloured sticky plates (up to 10/ha) and
pheromone traps or light traps (10–12/ha) can also be used for the control of insect pests. Inundated release of
5000 Chrysoperla eggs after 15 days of sowing and 50,000 Trichogramma sp. eggs (2–3 cards), 15,000 to 20,000
Trichogramma chilonis per ha and 15,000 to 20,000 Apanteles sp. per ha after 30 days of sowing can support to
keep the problem of pests below the ETL (MOFF, 2006).
2.2.3 Type of nutrient
Organic and inorganic nutrients differ in their availability and fate. Straight mineral fertilizers release their
nutrients quickly mainly due to their application in immediately available form and their high solubility. Though
soils vary in their capacities to retain inorganic nutrients, much of the major nutrient content in straight mineral
fertilizers is wasted to leaching and runoff, which contributes substantially to ground and surface water
contamination. Synthetic polymer membranes or other coatings are sometimes used to encapsulate mineral
fertilizer ingredients to artificially moderate nutrient release. Further still, some fertilizer manufacturers
incorporate the use of synthetic organically complex nutrients to provide slower nutrient release. Hence, without
the use of synthetic polymers or synthetic organic nutrients in conventional fertilizers, inorganic nutrients must
be over- and intensively applied to maintain proper plant growth, resulting in inefficient fertilizer use with a
significant environmental cost.4 Another issue with extensive and abundant use of inorganic fertilizers is that their
use does not improve soil fertility and structure over the long term. Organics take time to decompose and release
4 www.dcm-info.com/us/info/380/how-do-organic-fertilizers-differ-from-mineral-fertilizers/
Water Footprint Reduction of Cotton Farming in India / 37
nutrients. In soils, death, immobilization and mineralization, coupled with plant uptake, are constantly occurring.
Through nutrient cycling nutrients gradually become available from the decay of organic inputs, which act
essentially like timed-release fertilizers. One result of this process is that, in natural ecosystems, nutrient cycling
(particularly of nitrogen, which is most commonly a limiting nutrient) is very sparse. Not much is lost from the
soil because it is released slowly, it is taken up rapidly, and there is usually little loss of nutrients via erosion in
natural ecosystems. Some nutrients are lost, of course, as with erosion of soil, volatilization to the atmosphere,
and leaching with water, but losses are usually minor, if adequate management is practised. Natural ecosystems
also generally have a high storage capacity for nutrients. This storage capacity comes largely in and on organic
material, which is slowly decayed.5
Soil deficiencies in nutrients can best be determined through a laboratory analysis or with a portable kit, but can
also be estimated from the following symptoms (WWF, 2010).
• N deficiency: early season deficiency results in the plant with pale green yellowish leaves and stunted
growth and late season deficiency leads to reduced boll retention.
• P deficiency: reflected in the lower leaves, plants are stunted and have dark green leaves, sometimes
impart a purplish yellow colour to the leaf.
• K deficiency: reflected in the lower leaves, occurs as interveinal chlorosis, dry leaves and premature
shedding.
• S deficiency: seen on upper young leaves, first turn to light green, then to light yellow followed by a
pronounced yellowing.
• Ca deficiency: manifests as deformed and chlorotic leaves at the growing tip and stunted growth.
Successful reduction of nutrient application through adequate replacement, without sacrificing yield, has been
demonstrated. For example Singh et al. (2009) evaluated the potential for alternative nutrient management and
showed that the system productivity expressed as cotton equivalent yields (CEY) of cotton + groundnut - wheat
system was significantly higher than sole cotton and sole groundnut. This system recorded 15% and 65% higher
CEY than sole cotton-wheat and sole groundnut-wheat systems respectively. In addition N management practices
were investigated. Substitution of 25% of recommended dose of nitrogen (RDN) through farmyard manure (FYM)
in cotton gave the highest system productivity and B:C ratio when compared to replacement of 100% and 50%
RDN. However, net returns and soil N balance were in favour of 50% RDN substitution through FYM. It was
therefore inferred that integration of groundnut as intercrop along with 50% of recommended dose of nitrogen
substitution in cotton + groundnut through farm yard manure followed by wheat receiving 100 kg N/ha was the
best integrated N management from production and soil fertility aspects. Similarly, CICR (2015) demonstrated
that supplementing half of the recommended dose of fertilizer N with FYM viz. N30 P30 K30 + 5 t FYM/ha and
N45 P45 K46 + 7.5 t FYM/ha significantly increased seed cotton yield over N60 P30 K30 and N90 P45 K45,
besides improving the soil organic matter status in rain-fed cotton varieties and hybrids, respectively, grown in
vertisols.
5 http://people.oregonstate.edu/~muirp/orgmater.htm
38 / Water Footprint Reduction of Cotton Farming in India
Though, as also alluded to above, chemical fertilizers are a major source of nutrients to crops, use of chemical
fertilizers alone for a long period of time leaves unfavourable effects on soil physical, chemical and biological
property and environment. The better approach is to integrate chemical fertilizers with organic manures to avoid
ill effects on soil and environment. The integration of nutrients results in improved efficiency of chemical
fertilizers and better cost benefit relationship. Organic manures, though low nutrient carrying material, leave a
favourable effect on soil properties. Studies carried out with cereal-based cropping systems under Cropping
Systems Research project of ICAR has established that 25-50% fertiliser NPK dose to Kharif crops can be
curtailed with the use of FYM, Sesbania green manure and crop residues under different situations. Experiments
conducted on cultivators’ fields from 1990-91 to 1994-95 under Cropping Systems Research Network (ICAR)
further reveal beneficial effects of integration of chemical fertilisers with green-manuring or FYM, as the total
productivity of the systems involving cereals, oil seeds and cotton increased by 7% to 45% over farmers’ practice
in different agro-ecological zones. (Ministry of Agriculture of India, 2012).
Bio-inoculants have strong potential to enhance efficiency in production. They take nitrogen from the air and
make it available to plants - reducing the need for nitrogen fertilizer, make inorganic phosphate and micronutrients
soluble and available to plants, collect and store available nutrients, enhance plant uptake of phosphorus and zinc,
provide physical barriers against pathogens, stimulate plant growth and decompose organic residues.
The following recommendations are given by CICR (2015) with respect to bio-fertilizers:
• Application of Azotobacter, in combination with Azospirillum + phosphorus solubilizing bacteria (PSB)
without organic manure and fertilizers has been found to result in a 25 % saving of nitrogenous fertilizers
without any reduction in yield.
• Bio-inoculants tolerant against adverse climatic conditions were identified for use in cotton-
wheat/soybean based cropping systems with 11-15% improved yields.
• Pink pigmented facultative methylotroph (PPFM) isolated from cotton phyllosphere has improved the
vigour index of cotton and helped in Sulphur oxidation and P solubilization.
2.2.4 Amount and timing of application
It has been shown in field studies that synchronizing N and K supply with crop demand can result in higher seed
cotton yield and at the same time lead to reduction of total applied amount of nutrients (e.g. CICR, 2008).
Precision agriculture technology, e.g. variable-rate N application can also significantly reduce the requirement of
nutrients without yield losses. It has been shown that by using a variable rate N application strategy based on soil
electrical conductivity based zone management the average N rate dropped by 13% (IPNI, 2013). Another case
showed that switching from single to a variable rate application based on soil sampling allowed for 17% reduction
of P2O5 and 43% reduction in K2O application (IPNI, 2013).
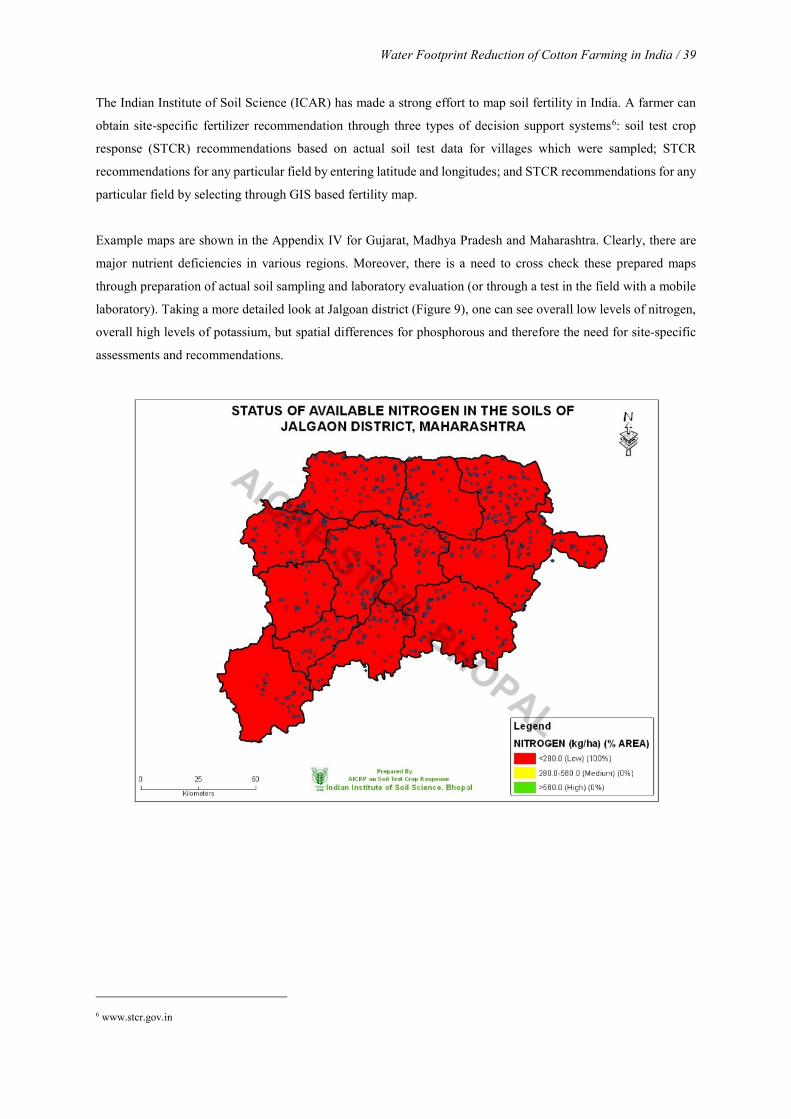
Water Footprint Reduction of Cotton Farming in India / 39
The Indian Institute of Soil Science (ICAR) has made a strong effort to map soil fertility in India. A farmer can
obtain site-specific fertilizer recommendation through three types of decision support systems6: soil test crop
response (STCR) recommendations based on actual soil test data for villages which were sampled; STCR
recommendations for any particular field by entering latitude and longitudes; and STCR recommendations for any
particular field by selecting through GIS based fertility map.
Example maps are shown in the Appendix IV for Gujarat, Madhya Pradesh and Maharashtra. Clearly, there are
major nutrient deficiencies in various regions. Moreover, there is a need to cross check these prepared maps
through preparation of actual soil sampling and laboratory evaluation (or through a test in the field with a mobile
laboratory). Taking a more detailed look at Jalgoan district (Figure 9), one can see overall low levels of nitrogen,
overall high levels of potassium, but spatial differences for phosphorous and therefore the need for site-specific
assessments and recommendations.
6 www.stcr.gov.in
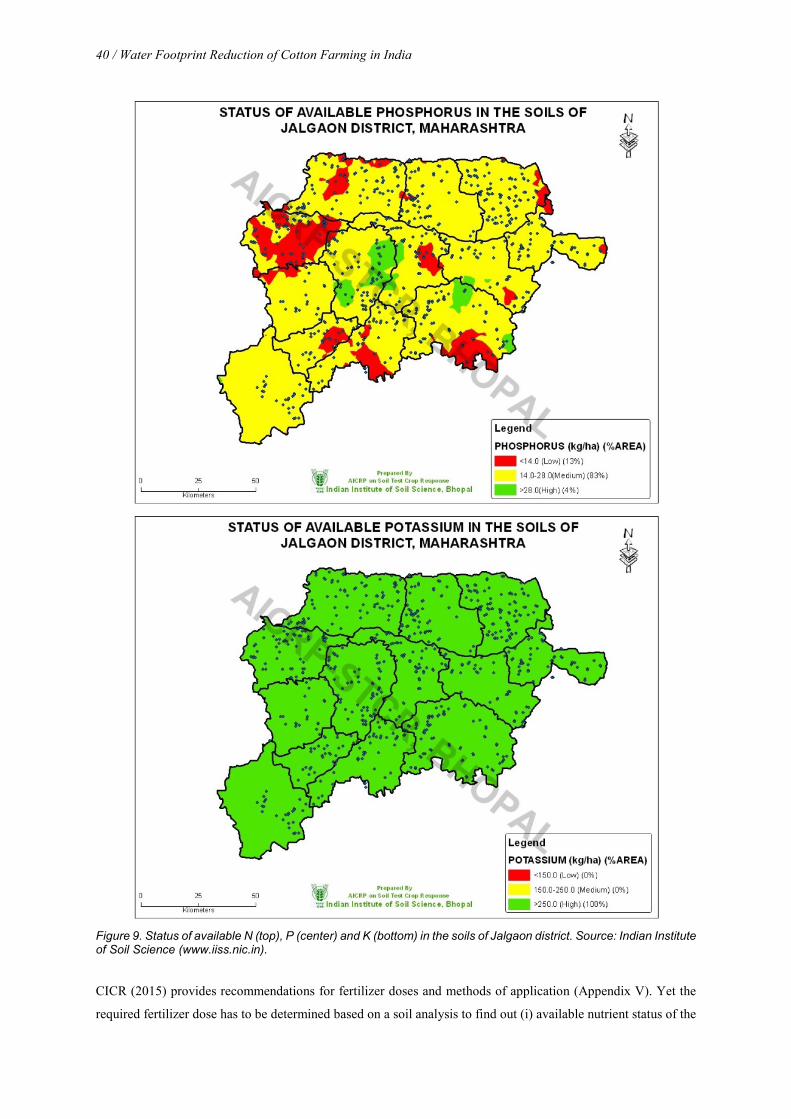
40 / Water Footprint Reduction of Cotton Farming in India
Figure 9. Status of available N (top), P (center) and K (bottom) in the soils of Jalgaon district. Source: Indian Institute of Soil Science (www.iiss.nic.in).
CICR (2015) provides recommendations for fertilizer doses and methods of application (Appendix V). Yet the
required fertilizer dose has to be determined based on a soil analysis to find out (i) available nutrient status of the
Water Footprint Reduction of Cotton Farming in India / 41
soils and (ii) the crop requirement of the nutrients; the difference of the two (ii – i) is the required fertilizer dose
for a given crop. Other factors affecting fertilizer use efficiency (e.g. type of application, soil) have to be built into
the computation of fertilizer dose. Management options must be in line with the given soil fertility conditions to
achieve highest benefit.
2.2.5 Application method
First and foremost, chemicals must not only be handled carefully during application in the field, but also during
storage, transport and disposal. Spraying of fertilizer and pesticides should be done according to best practice.
Chemicals must be applied in a controlled fashion. Whereby aerial application may result in considerable spray
drift and volatilization, letting the substances settle downwind on the soil or on foliage, soil incorporated
application methods, or application with the emitter being in proximity of the soil, lead to a reduction of losses.
Application of nutrients can best be optimized when combined with controlled irrigation methods such as sprinkle
or drip irrigation, i.e. through fertigation. CICR (2007) estimates fertilizer savings due to drip fertigation to be on
the order of 30-50%. Through controlled irrigation and simultaneous fertilizer application the applied substances
are not being flushed away from the field easily. As during heavy rain events or through (excessive) irrigation
runoff may become substantial it is to be avoided to apply substances immediately before heavy rainfall or
irrigation (National Research Council, 1993). Excess runoff from rainwater is the main cause of severe soil erosion
and loss of nutrients in the watershed area. If excess irrigation and rainwater is controlled and managed properly
within the boundary of the field, the problem of soil degradation and diffuse pollution can be minimized.
Furthermore, diffuse pollution can be mitigated through buffer/filter strips. Buffer/filter strips help to reduce the
percentage of pesticides and nutrients applied to the field that in general enters a water body or that reaches streams
(USDA, 1997).
Jayakumar et al. (2015) conducted a field experiment to assess the effects of drip fertigation with biofertilizers on
growth, yield, water, and fertilizer-use efficiency of Bt cotton. The treatments were comprised of drip fertigation
with 75, 100, 125, and 150% of recommended dose of fertilizers (RDF) combined with and without biofertilizers
as biofertigation, soil application of 100% RDF, and control. The soil fertility status was greater under drip
fertigation when compared to surface irrigation and soil application of fertilizers. The authors recommend that
drip fertigation of inorganic fertilizers in combination with biofertigation be used as a viable technique to realize
the yield potential of Bt cotton and sustenance of soil fertility.
In a study on onion production in Jalgaon district in Maharashtra state in India it was shown that using drip
irrigation instead of furrow irrigation could lead to substantial reduction of the grey WF, in this case by 90% (IFC
et al., 2010). In a comprehensive two-year field study, Mchugh et al. (2008) compared the effects of furrow and
subsurface drip irrigation at different application rates, based on a percentage of daily crop-evapotranspiration
rates (ETc), on run-off and off-site movement of suspended sediment, nutrients and pesticides from cotton crops
grown on a vertisol in Central Queensland, Australia. Their results show that furrow irrigation increased
suspended soil loss by 108% compared to that of subsurface drip irrigation at 120% of ETc. No erosion was
recorded with deficit subsurface drip irrigation. This has implications for transport of any substance applied to the
42 / Water Footprint Reduction of Cotton Farming in India
field. Off-site movement of nitrogen in furrow was five times greater than subsurface drip irrigation at 120% ETc.
It was much less with 105% ETc and 90% ETc, and absent for 75% and 50% of ETc. Phosphorus loss from furrow
irrigation was greater than for the wetter subsurface drip treatments 90% ETc and 120% ETc. No P loss was
recorded from drier subsurface drip irrigation rates. Herbicides such as atrazine and diuron were applied in the
year prior to the experiment, but considerable amounts were recorded in furrow run-off in both years, but only at
90 and 120% ETc subsurface drip irrigation in the first year. Concentrations of applied herbicide residues in the
runoff exceeded the minimum threshold level for 99% species protection and, although the total amount of
herbicide movement was higher in furrow, at times the concentration was greater for wetter subsurface drip
irrigation run-off. Residues of insecticides, such as endosulphan applied in a previous year and dimethoate applied
in the current years, were recorded in runoff from subsurface drip at 120% and furrow irrigation. Their
concentrations in each year exceeded minimum threshold level. Subsurface drip irrigation at 75% ETc offered the
best trade-off between off-site run-off, erosion and pesticide movement and yield and water use efficiency.
2.2.6 Soil and crop management
The soil, field and crop management options listed in the previous section may also affect the grey WF. Important
management aspects are:
Reduced tillage to no tillage can have a positive effect on erosion, nutrient maintenance, nutrient cycling and soil
organic matter content.
Field levelling/terracing/cropping on contour can lead to less erosion and less runoff of nutrients and pesticides.
Drainage results in more leaching of salts, but improper practice may potentially also lead to increased leaching
of nutrients and pesticides.
Crop rotation: Growing cotton after cotton should be avoided. Adoption of proper crop rotation is recommended
(Ministry of Agriculture of India, 2004). As an example, CICR (2007) shows in studies on the long-term effect of
nutrient management that cotton-sorghum rotation out-yielded cotton monocrop by 38%. Cotton-sorghum, cotton-
sunflower and cotton-red gram rotations have also been found to be effective in keeping pests below the ETL
(MOFF, 2006).
The following inter-cropping systems are recommended for Central and South Zone to colonize the bioagents
fauna such as lady bird beetles, chrysopa and syrphid flies (Ministry of Agriculture of India, 2004): Cotton +
Cowpea, Cotton + Soybean, Cotton + Groundnut, Cotton + Pulses (Green gram / Black gram).
Intercropping of cotton with red gram is a common practice in the central cotton zone. Besides red gram,
intercropping with green gram, black gram and soybean has also been found to be highly effective and beneficial.
Planting of a few rows of sorghum or maize helps in the reduction of the insect-pest problem. Multiple-crop
intercropping is extremely beneficial to keep insect-pest problems below the economic tolerance level or ETL.
Water Footprint Reduction of Cotton Farming in India / 43
Any of the following combinations can be used for optimum output, insurance against crop failure, reduced or no
pest problem and maintenance of soil fertility: One row of maize/sorghum, 2 rows of red gram, 4 rows of cotton,
2 rows of cowpea/soybean, 4 rows of cotton, 2 rows of red gram and one row of maize/sorghum. Four rows of
cotton, 2 rows of cowpea/soybean, 4 rows of cotton and one row of mixed plants of red gram, maize and sorghum.
Two rows of cotton, 2 rows of moong /cowpea, 2 rows of cotton, 2 rows of red gram. One row of maize/sorghum,
4 rows of cotton, 2 rows of red gram, 4 rows of cotton, 2 rows of red gram, 4 rows of cotton and one row of
maize/sorghum. Alternate rows of cotton and moong up to 8 rows, one row of maize followed by alternate 8 rows
of cotton and moong. One row of marigold/ambari (Hibiscus) should also be planted every 15–20 rows.
Alternatively, 100 marigold/ambari plants may be planted at random per acre (MOFF, 2006).
Soil organic matter management: Returning crop residues and animal wastes to soils helps to maintain soil organic
matter content; practices that harvest or destroy residues tend to reduce soil organic matter, leading to greater
losses from the field (USDA, 1997).
Managing soil fertility: Sanjeevak or jeevamrut – fermented liquid manures prepared from cattle dung and cow
urine are key on-farm inputs in the management of soil fertility on organic farms. Amrut pani, a soil tonic, can
also be used in place of sanjeevak or jeevamrut. Around 200 litres of sanjeevak or jeevamrut or amrut pani are
applied to the soil per acre, either along with the irrigation water or sprinkled over the soil surface during or after
mild rains. A minimum of three applications is necessary. The first after sowing; the second, 25–30 days after
sowing (after the first weeding); and the third, 50–60 days after sowing (after the second weeding). For better crop
growth, diluted jeevamrut (life tonic) is used as a foliar spray on at least three occasions, with intervals of 20 days
in between. The first application is 20 days after sowing. In the south Indian states, farmers use panchagavya in
place of jeevamrut as foliar spray (Vijayalakshmi et al., 2005). Use of diluted gomutra or vermiwash (one litre in
15 litres of water) or a mixture of gomutra + vermiwash (1:1) may be preferable in Maharashtra. Use of NSKE
(neem seed kernel extract) or neem leaf extract (if the neem seeds are not collected and stored in the summer)
with vermiwash (5% each) acts both as growth promoter and pesticide (MOFF, 2006).
Root rot, wilt and browning of leaves are common diseases of cotton. For their control, the following measures
are often adopted successfully:
• Deep ploughing during summer prevents the occurrence of soil borne pathogens.
• Use of Trichoderma viride as seed treatment can effectively control the incidence of root rot and
Fusarium wilt.
• Use of neem leaf/seed manure (10 q/ha) has also been found to be effective in the control of soil borne
pathogens.
• For the control of rust and root rot, fermented (sour) buttermilk (5 litres) in lime water (100 litres) per ha
may be sprayed.
• Foliar spray of Trichoderma viride powder (25 gm), milk (50 ml) and water (10 litres) can reduce the
incidence of brown leaf patches.

44 / Water Footprint Reduction of Cotton Farming in India
In general, conservation agriculture (reduced to no tillage, residues on field, crop rotation) has the potential to
lower grey WF. There is clear evidence that topsoil organic matter increases with conservation agriculture and
with it other soil properties and processes that reduce erosion and runoff and increase water quality (Palm et al.,
2015).
3 Recommendation
In this report, individual and combined effects of agronomic measures on yield increase, evapotranspiration
reduction and pollution reduction have been reviewed in order to evaluate their potential for water footprint
reduction. Thereby the consumptive green and blue, as well as the grey water footprint have been covered.
Based on the findings presented in this report, general recommendations regarding measures and strategies to
decrease the water footprint can be given. India has diverse agro-ecological zones and therefore it must be noted
that region-specific measures and strategies are essential to achieve best benefit. The zones deviate in climate, soil
type and financial means from each other, hence suitability and feasibility of implementation of a certain measure
may differ for a given location.
There are certain measures that can be termed 'no regret' options, as they require little or no additional investment,
yield reduction is not probable and they have water footprint reduction potential. To that end, pesticides that result
in a large grey water footprint should be replaced with substances that target the same pest, are effective, but lead
to a WF reduction. Crop rotation has a positive effect on soil fertility and supports pest control. Application of
nutrients can be optimized and potentially reduced after determination of actual soil fertility and a sequential
adjustment of the amount of fertilizer applied. Furthermore, the amount of nutrients may partially be replaced
with organic and locally available replacements such as farmyard manure without sacrificing yield. Mulching
with available crop residue is an effective means to reduce evaporation and at the same time may increase yield.
Intercropping is very efficient to that end, as the intercrop shades the soil, provides additional yield and crop
residue for additional mulching and soil improvement. Field runoff should be reduced through measures such as
field levelling, cropping on contour in sloping terrain or a ridge and furrow system. Application of irrigation water
can be reduced by applying a deficit irrigation strategy, whereby water is provided at less than full irrigation and
at those times where water is most critical for crop growth (flowering and boll formation). Note that in the case
of rain-fed farming supplemental irrigation to bridge incidental periods of drought is highly effective.
Best management practices include, but go beyond the 'no regret' options and may require substantial investment
and adequate training of the farmers. These involve the selection of cultivars best suited for the production region,
innovative and sustainable cotton-based cropping systems and precise water and fertilizer application systems.
Those practices and their potential regarding water footprint reduction are further elaborated below.
Short term recommendation: implement no-regret measures in conventional cotton farming, create market support
for organic cotton and develop a capacity building and investment programme to help farmers switch to
conservation agriculture.
Long term recommendation: Transition to less pesticide-intensive agronomic practices lead to substantial
reduction of the grey water footprint. The consumptive water footprint can be reduced significantly through best
management practices. Temporary trade-offs with respect to yield may have to be accepted.
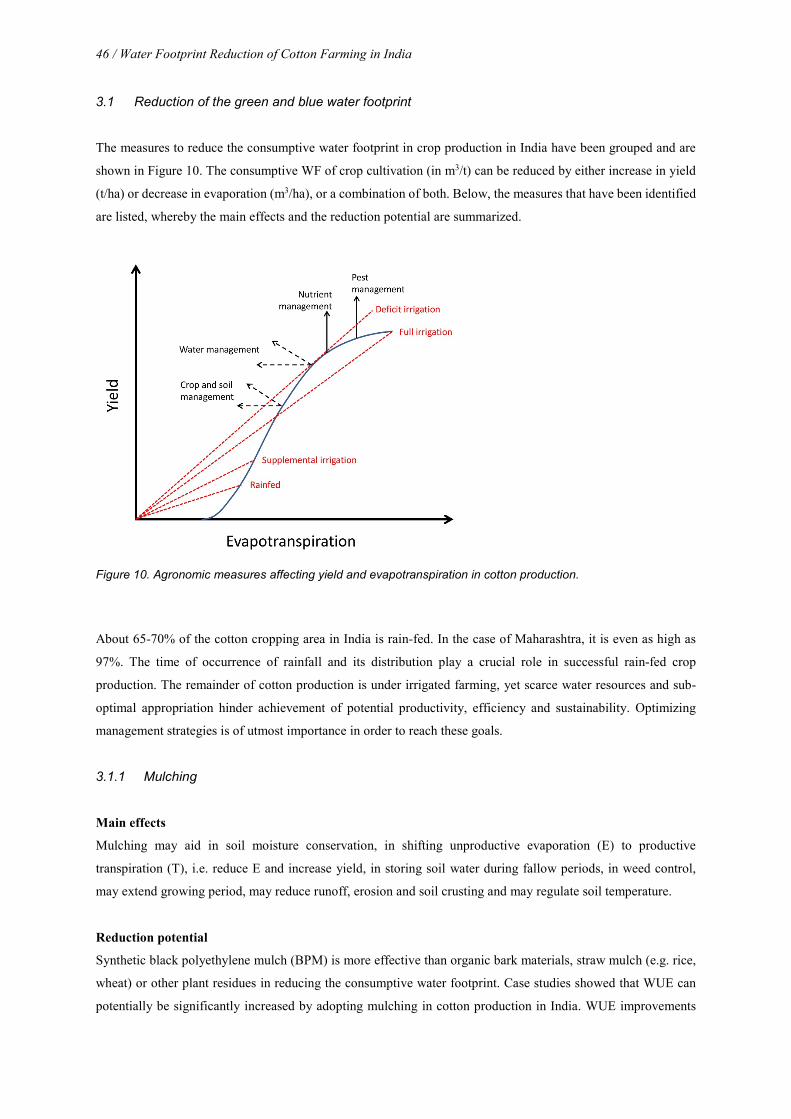
46 / Water Footprint Reduction of Cotton Farming in India
3.1 Reduction of the green and blue water footprint
The measures to reduce the consumptive water footprint in crop production in India have been grouped and are
shown in Figure 10. The consumptive WF of crop cultivation (in m3/t) can be reduced by either increase in yield
(t/ha) or decrease in evaporation (m3/ha), or a combination of both. Below, the measures that have been identified
are listed, whereby the main effects and the reduction potential are summarized.
Figure 10. Agronomic measures affecting yield and evapotranspiration in cotton production.
About 65-70% of the cotton cropping area in India is rain-fed. In the case of Maharashtra, it is even as high as
97%. The time of occurrence of rainfall and its distribution play a crucial role in successful rain-fed crop
production. The remainder of cotton production is under irrigated farming, yet scarce water resources and sub-
optimal appropriation hinder achievement of potential productivity, efficiency and sustainability. Optimizing
management strategies is of utmost importance in order to reach these goals.
3.1.1 Mulching
Main effects
Mulching may aid in soil moisture conservation, in shifting unproductive evaporation (E) to productive
transpiration (T), i.e. reduce E and increase yield, in storing soil water during fallow periods, in weed control,
may extend growing period, may reduce runoff, erosion and soil crusting and may regulate soil temperature.
Reduction potential
Synthetic black polyethylene mulch (BPM) is more effective than organic bark materials, straw mulch (e.g. rice,
wheat) or other plant residues in reducing the consumptive water footprint. Case studies showed that WUE can
potentially be significantly increased by adopting mulching in cotton production in India. WUE improvements
Water Footprint Reduction of Cotton Farming in India / 47
due to application of mulching on the order of 13-39% were found in the literature on various crops around the
world.
Notes
The amount of mulch used is important in order not to alter soil temperature in a non-beneficial way, i.e. delay
crop growth. Mulching is in particular effective in the case of water deficit stress due to increase in available soil
water. Combined with irrigation it is important to optimize irrigation schedule to obtain benefits. Using non-
natural materials such as plastic mulch may increase certain beneficial effects (weed control, reduction of soil
evaporation, increase of soil temperature, increase of soil water stored), but not support other (rainfall infiltration;
N regulation; salinity control). Compared with black polyethylene mulch, white polyethylene mulch is not as
effective in weed suppression. Also, costs of polyethylene mulch may limit its applicability. White polyethylene
mulch is less effective than black polyethylene mulch. Permeable geotextiles may pose a viable alternative to
plastic mulch in general, and for black polyethylene mulch in particular.
3.1.2 Irrigation technology
Main effects
Provision of soil moisture for crop growth. Bridging dry spells.
Reduction potential
Field and simulation studies indicate that the consumptive WF reduces from sprinkler to furrow, to surface drip,
to subsurface drip irrigation. Case studies of cotton production in India demonstrate a WF reduction potential for
switching from the most common practice of furrow irrigation to drip irrigation. WUE improvements due to
implementation of advanced irrigation technologies on the order of 35-63% were found in the literature on various
crops around the world.
Notes
LESA and MESA sprinkler irrigation may provide for lower consumptive WF compared to furrow irrigation if
the respective coverage is less than 100%. Best management practice in furrow irrigation (short furrows, ideal
slope, fast application) may lead to reduced E and hence reduced blue WF when compared to farmers’ current
practice. Also, WF reduction may be achieved through practice of alternate furrow irrigation. Existing furrow
irrigation practice may in that way be further utilized in a more resource efficient fashion. Here precision farming
has not been a strong focus. While the measures discussed will be part of any precision farming strategy, the
concept as such and highly technical solutions will require additional financial resources to be implemented at
farm level, which are likely not available at present for wide implementation.
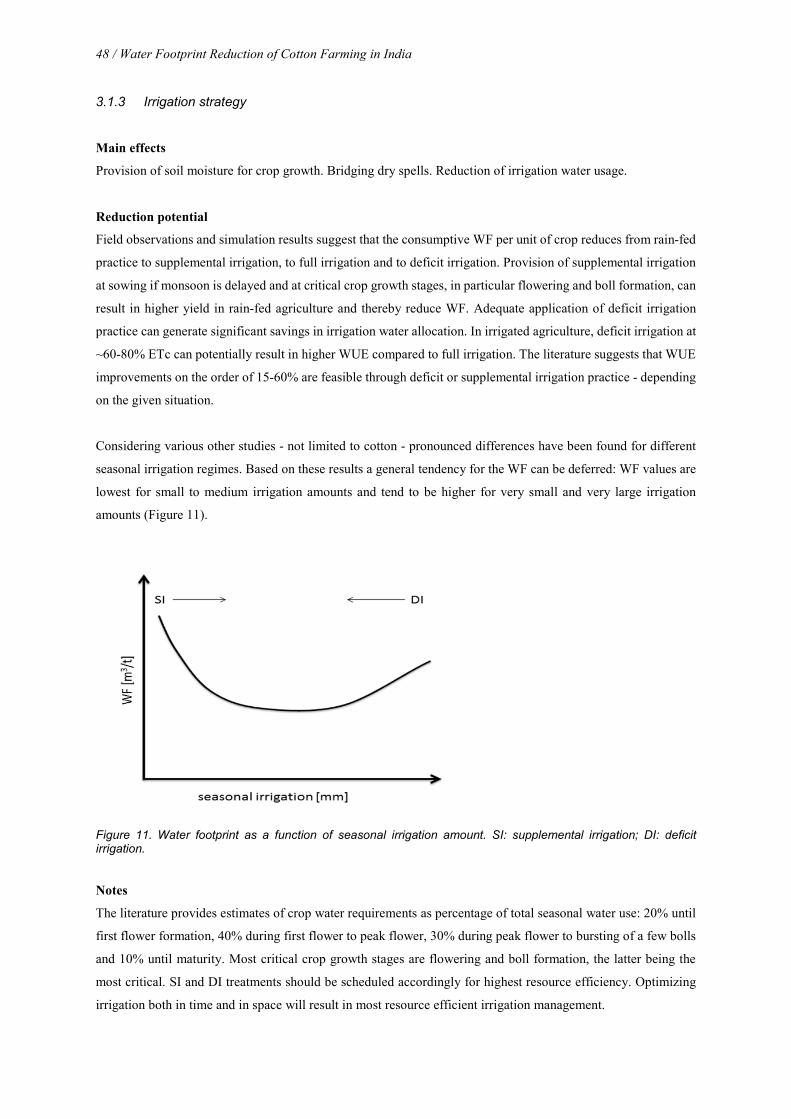
48 / Water Footprint Reduction of Cotton Farming in India
3.1.3 Irrigation strategy
Main effects
Provision of soil moisture for crop growth. Bridging dry spells. Reduction of irrigation water usage.
Reduction potential
Field observations and simulation results suggest that the consumptive WF per unit of crop reduces from rain-fed
practice to supplemental irrigation, to full irrigation and to deficit irrigation. Provision of supplemental irrigation
at sowing if monsoon is delayed and at critical crop growth stages, in particular flowering and boll formation, can
result in higher yield in rain-fed agriculture and thereby reduce WF. Adequate application of deficit irrigation
practice can generate significant savings in irrigation water allocation. In irrigated agriculture, deficit irrigation at
~60-80% ETc can potentially result in higher WUE compared to full irrigation. The literature suggests that WUE
improvements on the order of 15-60% are feasible through deficit or supplemental irrigation practice - depending
on the given situation.
Considering various other studies - not limited to cotton - pronounced differences have been found for different
seasonal irrigation regimes. Based on these results a general tendency for the WF can be deferred: WF values are
lowest for small to medium irrigation amounts and tend to be higher for very small and very large irrigation
amounts (Figure 11).
Figure 11. Water footprint as a function of seasonal irrigation amount. SI: supplemental irrigation; DI: deficit irrigation.
Notes
The literature provides estimates of crop water requirements as percentage of total seasonal water use: 20% until
first flower formation, 40% during first flower to peak flower, 30% during peak flower to bursting of a few bolls
and 10% until maturity. Most critical crop growth stages are flowering and boll formation, the latter being the
most critical. SI and DI treatments should be scheduled accordingly for highest resource efficiency. Optimizing
irrigation both in time and in space will result in most resource efficient irrigation management.
Water Footprint Reduction of Cotton Farming in India / 49
3.1.4 Crop variety
Main effects
Stronger resistance to adverse conditions, thereby potentially resulting in both higher yield and lower water
demand.
Reduction potential
Dependent on variety. Intensive research is on-going regarding breeding and genetically modifying crops to
develop varieties that are best suited for a given environment, cope with pests and are both high yielding and
optimized in terms of water use.
Notes
Recommended variety to be chosen.
3.1.5 Nutrient management
Main effects
In particular nutrient availability to enhance plant growth. Particularly primary nutrients such as nitrogen and
phosphorus, but also secondary and micronutrients are critical to high yield and water use efficiency. For example
for N, in general there will be an increase of WUE with N application. At first, N fertilization may increase the
CO2 assimilation rate capacity. In addition fertilization increases the early growth and the crop cover, protecting
the soil from evaporation and, consequently, increasing the proportion of transpired water by the plant.
Reduction potential
Experimental studies show in general a yield increase due to nutrient management. WUE will in general increase
initially when the amount of applied fertilizer is increased, there is an optimum amount and beyond that amount
WUE decreases. Fertilizer application is in particular efficient when „spoon-fed“ together with irrigation
(fertigation).
Notes
Using excessive amounts of fertilizer is inefficient from a water use efficiency point of view, it pollutes the
environment and is an unnecessary financial burden.
3.1.6 Other
Main effects
Undulating topography and sloping terrain in general can lead to losses of irrigation water. Levelling the field or
farming on contour is hence advised. Combined irrigation and fertilizer application (fertigation) reduces losses
and allows for easy plant uptake. Mulching, (deficit) (subsurface) drip irrigation and concurrent fertilizer
application combines efficient technologies for highest resource efficiency. Water harvesting and supplemental
50 / Water Footprint Reduction of Cotton Farming in India
irrigation can boost yields, in particular when combined with adequate nutrient supply. Intercropping can support
soil water management through covering the soil. Green manure, in particular N-fixing plants, provide additional
nutrients, provide soil cover and build a favourable soil structure. Residues are to be incorporated into the soil to
improve soil fertility and structure. Reduced tillage systems, comprising pre-plant herbicide application and one
pass of harrow and two inter-row cultivation for early and late season weed control, respectively, is an alternative
strategy for weed control. One to two deep ploughings once in three years are necessary to control deep-rooted
weeds and to destroy pest larvae or cocoons. Crop rotation is advised for both improved soil fertility and pest
control. Optimum plant spacing and density can improve yield.
Reduction potential
Reduction potentials have been demonstrated in various experimental studies.
Notes
Combined strategies require diligent planning and training.
3.2 Reduction of the grey water footprint
3.2.1 Increasing yield in organic farming
Main effects
Yield increase. A broad range of the measures discussed earlier may apply in this case, alone or combined. These
are timely sowing; optimum spacing and plant density; mulching; in situ water harvesting practices; irrigation
management; levelling/contour cultivation; intercropping; crop rotation; soil improvement; pest management;
using improved varieties that thrive well in organic farming.
Reduction potential
Implementation of improved practices can potentially reduce or close the current yield gap between actual and
potential yield, often encountered in organic farming.
Notes
At times lower yields are encountered during the transition period from conventional to organic farming. It was
shown in a field study that improvements are expected after the conversion period.
3.2.2 Type of pesticide
Main effects
Depending on the choice, reduction of pests, increased yields, reduction of pollution.
Water Footprint Reduction of Cotton Farming in India / 51
Reduction potential
The grey WF decreases in general from conventional to REEL and organic production. Natural pesticides result
in much lower (or even zero) grey WF than artificial pesticides. Highly toxic substances are avoided altogether in
organic farming. Replacing those pollutants that result in such exceptionally high grey water footprint values with
less harmful, but equally or even more efficient substances is of critical importance in order to significantly reduce
the grey WF. Weeds can potentially be managed by an integrated approach, whereby application of herbicides is
reduced. Integrated Pest Management poses an opportunity for less adverse effects on the environment.
Notes
Monitoring and training is required to successfully implement alternative pest management.
3.2.3 Type of nutrient
Main effects
Successful reduction of nutrient application without sacrificing yield
Reduction potential
A significant amount of fertilizer can potentially be curtailed with the use of organic nutrients and adequate soil
fertility management.
Notes
Soil deficiencies in nutrients can best be determined through a laboratory analysis or with a portable kit. Nutrient
application should be based on results from a soil test.
3.2.4 Amount and timing of application
Main effects
Synchronizing N and K supply with crop demand has the potential to result in higher seed cotton yield and at the
same time may lead to reduction of the amount of total applied nutrients. Precision agriculture technology, e.g.
variable-rate N application can also significantly reduce the requirement of nutrients without yield losses.
Reduction potential
Case studies of VRI application demonstrated that N rate dropped by 13% in one case, and that switching from
single to a variable rate application based on soil sampling allowed for 17% reduction of P2O5 and 43% reduction
in K2O application.
Notes
The required fertilizer dose has to be determined based on a soil analysis to find out (i) available nutrient status
of the soils and (ii) the crop requirement of the nutrients; the difference of the two (ii – i) is the required fertilizer
dose for a given crop. Other factors affecting fertilizer use efficiency (e.g. type of application, soil) have to be
52 / Water Footprint Reduction of Cotton Farming in India
built into the computation of fertilizer dose. Management options must be in line with the given soil fertility
conditions to achieve highest benefit.
3.2.5 Application method
Main effects
Application of nutrients can best be optimized when combined with controlled irrigation methods such as sprinkle
or drip irrigation, i.e. through fertigation. Through controlled irrigation and simultaneous fertilizer application the
applied substances are not being flushed away from the field easily.
Reduction potential
Case study examples showed that off-site movement of nitrogen in furrow was five times greater than subsurface
drip irrigation at 120% ETc. It was much less with 105% ETc and 90% ETc, and absent for 75% and 50% of ETc.
Phosphorus loss from furrow was greater than for the wetter subsurface drip treatments 90% ETc and 120% ETc.
No P loss was recorded from drier subsurface drip irrigation rates. Subsurface drip irrigation at 75% ETc offered
the best trade-off between off-site run-off, erosion and pesticide movement and yield and water use efficiency.
Reduction of nitrogen requirements on the order of 30-50% were reported for drip fertigation application without
yield reduction.
Notes
Fields should be levelled or if crop is cultivated on sloping terrain ridges on contour are recommended.
3.2.6 Other
Main effects
Biodiversity is one of the key measures to keeping pest populations below the economic threshold limit (ETL). In
general, conservation agriculture (reduced to no tillage, residues on field, crop rotation) has ample potential to
lower grey WF
Reduction potential
Intercropping of cotton with red gram, cowpea, soybean, moong, sorghum/maize and random planting of marigold
and Hibiscus subdariffa (lal ambari) are potential means to limit the pest population to the ETL. Crop rotation is
recommended to reduce pests.
References
Aggarwal P.K., K.B. Hebbar, M.V. Venugopalan, S. Rani, A. Bala, A. Biswal and S.P. Wani (2008)
Quantification of yield gaps in rain-fed rice, wheat, cotton and mustard in India. Global Theme on
Agroecosystems Report No. 43, International Crops Research Institute for the Semi-Arid Tropics,
Patancheru, Andhra Pradesh, India.
Aragüés, R., Medina, E.T., Claveria, I. (2014) Effectiveness of inorganic and organic mulching for soil salinity
and sodicity control in a grapevine orchard drip-irrigated with moderately saline waters. Span. J. Agric.
Res. 12, 501–508.
Aujla M.S., Thind H.S., Butter G.S. (2005). Cotton yield and water use efficiency at various levels of water and
N through drip irrigation under two methods of planting. Agric. Water Manag. 71: 167-179.
Awoodoyin, R.O., Ogbeide, F.L., Oluwole, O. (2007) Effects of three mulch types on the growth and yield of
tomato (Lycopersicon esculentum Mill.) and weed suppression in Ibdan; rainforest-savanna transition zone
of Nigeria. Trop. Agric. Res. Ext. 10: 53–60.
Ayars, J.E., C.J. Phene, R.B. Hutmacher, K.R. Davis, R.A. Schoneman, S.S. Vail and R.M. Mead (1999)
Subsurface drip irrigation of row crops: a review of 15 years of research at the Water Management
Research Laboratory, Agricultural Water Management, 42: 1-27.
Azevedo, P., Bezerra, J. and Silva, V. (2012) Evapotranspiration and water-use efficiency of irrigated colored
cotton cultivar in semiarid regions. Agricultural Sciences, 3: 714-722.
Bennett, J. (2003) Opportunities for increasing water productivity of CGIAR crops through plant breeding and
molecular biology. In: Kijne, J.W.,Barker, R.,Molden, D. (eds.), Water productivity in agriculture: Limits
and opportunities for improvement. CABI Publishing, Wallingford, UK & International Water
Management Institute, Colombo, Sri Lanka.
Bhaskar, K.S., M.R.K. Rao, P.N. Mendhe and M.R. Suryavanshi (2005) Micro irrigation management in cotton,
CICR Technical Bulletin No. 31, Central Institute for Cotton Research, Nagpur, India.
Bhattarai, S., A. D. Mchugh, G. Lotz and D.J. Midmore (2005) The response of cotton to subsurface drip and
furrow irrigation in a vertisol, Expl. Agric., 42, 1-21.
Caviglia, O.P., V.O. Sadras, 2001. Effect of nitrogen supply on crop conductance, water and radiation-use
efficiency of wheat. Field Crops Res., 69: 259-266.
Cetin O. and Bilgel L. (2002). Effects of different irrigation methods on shedding and yield of cotton. Agric.
Water Manag. 54: 1-15.
Chukalla, A., M.S. Krol, and A.Y. Hoekstra (2015) Green and blue water footprint reduction in irrigated
agriculture: effect of irrigation techniques, irrigation strategies and mulching, Hydrol. Earth Syst. Sci.,
19(12): 4877–4891.
CICR (2005) Rain water management techniques for cotton-based cropping systems, NATP, Technical Bulletin
33, Central Institute for Cotton Research, Nagpur, India.
CICR (2007) Vision 2025, CICR perspective plan, Central Institute for cotton research, Nagpur, India.
CICR (2008) Annual report 2007-2008, Central Institute for Cotton Research, Nagpur, India.
http://www.cicr.org.in/cicr_annual_reports.htm
54 / Water Footprint Reduction of Cotton Farming in India
CICR (2011a) Low cost drip - cost effective and precision irrigation tool in Bt cotton, Technical Bulletin No.
1/2011, Central Institute for Cotton Research, Coimbatore, India.
CICR (2011b) Multi-tier cropping system for profitability and stability in Bt cotton production, Central Institute
for Cotton Research, Technical Bulletin No. 2, Coimbatore, India.
CICR (2013) Annual report 2012-2013, Central Institute for Cotton Research, Coimbatore, India.
CICR (2015) Crop production, Central Institute for Cotton Research, Nagpur, India.
www.cicr.org.in/CropProduction.html (last accessed 07 February 2015).
Correa, J.C. and Sharma, R.D. (2004) Herbaceous cotton yield in no-till system in rainfed savannah conditions
with crop rotation. Pesquisa Agropecuária Brasileira, EMBRAPA, 29, 41-46 (in Portuguese).
Dağdelen, N., H. Başal, E. Yilmaz, T. Gürbüz and S. Akcay (2009) Different drip irrigation regimes affect cotton
yield, water use efficiency and fiber quality in western Turkey. Agricultural Water Management 96(1): 111-
120.
Deng, X.-P., L. Shan, H. Zhang and N. C. Turner (2006) Improving agricultural water use efficiency in arid and
semiarid areas of China, Agricultural Water Management, 80(1-3): 23-40.
De Ponti, T., B. Rijk, and M. K. van Ittersum (2012) The crop yield gap between organic and conventional
agriculture. Agricultural Systems, 108: 1–9.
English, M. (1990) Deficit irrigation. I: Analytical framework. J. Irrig. Drain. E.-ASCE 116, 399-412.
Falkenmark M. and J. Rockström (2004) Balancing water for humans and nature: the new approach in
ecohydrology, Earthscan, London, UK.
FAO (1986) Irrigation water management: Irrigation water needs, Training manual no. 3, FAO, Rome, Italy.
FAO (1989) Irrigation water management: Irrigation scheduling, Training manual no. 4, FAO, Rome, Italy.
FAO (2002) Deficit irrigation practices, Water Reports, 22, pp. 111, FAO, Rome, Italy.
Fereres, E. and M.A. Soriano (2007) Deficit irrigation for reducing agricultural water use, J. Exp. Bot. 58, 147-
158.
Forster D., Andres C., Verma R., Zundel C., Messmer M.M., et al. (2013) Yield and economic performance of
organic and conventional cotton-based farming systems – Results from a field trial in India. PLoS ONE
8(12): e81039.
Fox, P. and J. Rockström (2003) Supplemental irrigation for dry-spell mitigation of rainfed agriculture in the
Sahel, Agricultural Water Management, 61, 29-50.
Franke, N. and Mathews, R. (2013). Grey water footprint indicator of water pollution in the production of organic
vs. conventional cotton in India. Water Footprint Network, Enschede, the Netherlands.
Franke, N.A., Boyacioglu, H. and Hoekstra, A.Y. (2013) Grey water footprint accounting: Tier 1 supporting
guidelines, Value of Water Research Report Series No. 65, UNESCO-IHE, Delft, the Netherlands.
Gundlur, S. S., S. Rajkumara, J.K. Neelakanth, P. Ashoka and A.B. Khot (2013) Water and nutrient requirement
of Bt cotton under vertisols of Malaprabha command, Karnataka J. Agric. Sci., 26, 368-371.
Halemani, H.L., A.Y. Hugar, Y.R. Aladakatti and R.A. Nandagavi (2009) Studies on the effect of polyethylene
mulching on cotton genotypes under rainfed conditions I. Influence on growth, yield components and seed
cotton yield, Karnataka J. of Agric. Sci., 22, 280-283.
Water Footprint Reduction of Cotton Farming in India / 55
Hodgson, A.S., Constable, G.A., Duddy, G.R., Danieles, I.G. (1990) A comparison of drip and furrow irrigated
cotton on a cracking clay soil. 2. Water use efficiency, waterlogging, root distribution and soil structure,
Irrig. Sci., 11, 143-148.
Hoekstra, A.Y., Chapagain, A.K., Aldaya, M.M. and Mekonnen, M.M. (2011) The water footprint assessment
manual: Setting the global standard, Earthscan, London, UK.
Howell, T.A., Meron, M., Davis, K.R., Phene, C.J., Yamada, H., 1987. Water management of trickle and furrow
irrigated narrow row cotton in the San Joaquin Valley. Appl. Eng. Agric. 3: 222–227.
Hulugalle, N.R., Weaver, T.B., Finlay, L.A., Hare, J. and Entwistle, P.C. (2007) Soil properties and crop yields
in a dryland Vertisol sown with cotton-based crop rotations. Soil Tillage Research, 93: 356-369.
Hussain, A., Kumar, D., Dwivedi, B.S., Rana, D.S., & Gangaiah, B. (2014). Relative response of Bt cotton
(Gossypium hirsutum) to balanced fertilization in irrigated cotton-wheat cropping system. African Journal
of Agricultural Research, 9(1): 21-33.
Ibragimov N., Evet S.R., Esanbekov Y., Kamilov B., Mirzaev L., Lamers J.P.A. (2007) Water use efficiency of
irrigated cotton in Uzbekistan under drip and furrow irrigation. Agric. Water Manag. 90(1-2): 112-120.
IFC, LimnoTech, Jain Irrigation Systems and TNC (2010) Water footprint assessments − Dehydrated onion
products, Micro-irrigation systems − Jain Irrigation Systems Ltd., International Finance Corporation,
Washington, D.C., USA.
IPNI (2013) Plant nutrition today, International Plant Nutrition Institute (IPNI) Bulletin No. 5, Norcross, USA.
Jalota, S.K., Sood, A., Chahal, G.B.S. and Choudhury, B.U. (2006) Crop water productivity of cotton (Gos-
sypium hirsutum L.) and wheat (Triticum aestivum L.) system as influenced by deficit irrigation, soil texture
and precipitation. Agriculture Water Management, 84, 137- 146.
Jayakumar, M., U. Surendran and P. Manickasundaram (2015) Drip fertigation program on growth, crop
productivity, water, and fertilizer-use efficiency of Bt cotton in semi-arid tropical region of India,
Communications in Soil Science and Plant Analysis, 46(3): 293-304.
Kahlon, M.S. and R. Lal (2011) Enhancing green water in soils of South Asia. J. Crop Imp. 25: 101–133.
Kamilov, B., Ibragimov, N., Esanbekov, Y., Evett, S.R., Heng, L.K., 2003. Drip irrigated cotton: irrigation
scheduling study by use of soil moisture neutron probe. Int. Water Irrig. 1: 38–41.
Kijne, J.W., Barron. J., Hoff, H., Rockström, J., Karlberg, L., Gowing, J., Wani, S. P., and Wilchens, D. (2009)
Opportunities to increase water productivity in agriculture with special reference to Africa and South Asia,
Stockholm Environmental Institute, Stockholm.
Kumar, S. and P. Dey (2011) Effects of different mulches and irrigation methods on root growth, nutrient uptake,
water-use efficiency and yield of strawberry, Scientia Horticulturae, 127(3): 318-324.
Martin, S.W. and Hanks, J. (2009) Economic analysis of no tillage and minimum tillage cotton-corn rotations in
the Mississippi Delta. Soil Tillage Research, 102: 135- 137.
Maurya, P.R., Lal, R. (1981) Effect of different mulch materials on soil and on root growth and yield of maize
and cowpea. Field Crops Res. 4: 33–45.
Mchugh, A.D., S. Bhattarai, G. Lotz and D.J. Midmore (2008) Effects of subsurface drip irrigation rates and
furrow irrigation for cotton grown on a vertisol on off-site movement of sediments, nutrients and pesticides,
Agron. Sustain. Dev., 28: 507-519.
56 / Water Footprint Reduction of Cotton Farming in India
Mekonnen, M.M. and Hoekstra, A.Y. (2010) The green, blue and grey water footprint of crops and derived crop
products, Value of Water Research Report Series No.47, UNESCO-IHE, Delft, the Netherlands.
Ministry of Agriculture of India (2004) Integrated pest management practice for cotton, IPM Package No. 25,
Ministry of Agriculture, Department of Agriculture & Cooperation, Directorate of Plant Protection,
Quarantine & Storage, Government of India.
Ministry of Agriculture of India (2008) Guidelines on The National Project on Management of Soil Health and
Fertility, Department of Agriculture & Cooperation, Ministry of Agriculture, Government of India.
Ministry of Agriculture of India (2012) Compendium on soil health, Ministry of Agriculture, Department of
Agriculture and Cooperation, INM Division, India.
MOFF (2006) Package of organic practices from Maharashtra for cotton, rice, red gram, sugarcane and wheat,
Maharashtra Organic Farming Federation (MOFF), Pune, India.
Mukherjee, A., M. Kundu, et al. (2010) Role of irrigation and mulch on yield, evapotranspiration rate and water
use pattern of tomato (Lycopersicon esculentum L.). Agricultural Water Management 98(1): 182-189.
Nalayini, P. (2007) Poly mulching - a case study to increase cotton productivity, Model training course on
"Cultivation of Long Staple Cotton (ELS)", December 15-22, 2007, Central Institute for Cotton Research,
Regional Station, Coimbatore, India.
National Research Council (1993) Soil and water quality: an agenda for agriculture, Committee on Long-Range
Soil and Water Conservation, Board on Agriculture, National Academy Press, Washington, D.C., USA.
Nkem, J.N., Bruyn, L.A.L., Hulugalle, N.R. and Grant, C.D. (2002) Changes in invertebrate populations over the
growing cycle of an N-fertilised and unfertilised wheat crop in rotation with cotton in a grey Vertosol.
Applied Soil Ecology, 20: 69-74.
Oweis, T., M. Pala and J. Ryan (1998) Stabilizing rainfed wheat yields with supplemental irrigation and nitrogen
in a Mediterranean-type climate. Agron. J. 90: 672-681.
Oweis, T. Y. and A. Y. Hachum (2003) Improving water productivity in the dry areas of West Asia and North
Africa. Chapter 11 in Kijne, J. W., Barker R. and Molden, D. (eds.) Water productivity in agriculture: Limits
and opportunities for improvement, CAB International, pp. 179-198.
Palm, C., H. Blanco-Canqui, F. DeClerck and L. Gatere (2014) Conservation agriculture and ecosystem services:
An overview, Agriculture, Ecosystems and Environment, 187, 87–105.
Pandey, R.K., J.W. Maranville, A. Admou (2001) Tropical wheat response to irrigation and nitrogen in a Sahelian
environment. I. Grain yield, yield components and water use efficiency. Europ. J. Agron. 15: 93-105.
Passioura (2006) Increasing crop productivity when water is scarce - from breeding to field management, Agric.
Water Manage., 80: 176-196.
Pretty, J., A. Noble, D. Bossio, J. Dixon J, R.E. Hine, P. Penning de Vries and J.I.L. Morison (2006) Resource
conserving agriculture increases yields in developing countries. Environmental Science and Technology 40
(4): 1114 -1119.
Prieto, D. and Angueira, C. (1999) Water stress effect on different growing stages for cotton and its influence on
yield reduction. In: Kirda, C., Moutonnet, P., Hera, C., Nielsen, D.R. (eds.), Crop yield response to deficit
irrigation. Developments in plant and soil sciences, Vol. 84. Kluwer Academic Publishers, Dordrecht, the
Netherlands, pp. 161–179.
Water Footprint Reduction of Cotton Farming in India / 57
Ramamurthy, V., N. G. Patil, M. V. Venugopalan and O. Challa (2009) Effect of drip irrigation on productivity
and water-use efficiency of hybrid cotton (Gossypium hirsutum) in Typic Haplusterts, Indian J. Ag. Sci., 79:
118-121.
Ravindran, C.D. (2000) Use of rainfall analysis in the planning and management of rainfed cotton, Central
Institute for Cotton Research (CICR) Technical Bulletin No. 15, Nagpur, India.
Rockström, J., Hatibu, N., Oweis, T. Y., Wani, S., Barron, J., Bruggeman, A., Farahani, J., Karlberg, L., Qiang,
Z. (2007) Managing water in rainfed agriculture. In: Molden, D. (ed.). Water for food, water for life: A
Comprehensive Assessment of Water Management in Agriculture. Earthscan, London, UK & IWMI,
Colombo, Sri Lanka, pp. 315-352.
Roth, G., G. Harris, M. Gillies, J. Montgomery and D. Wigginton (2013) Water-use efficiency and productivity
trends in Australian irrigated cotton: a review, Crop & Pasture Science, 64: 1033-1048.
Sadras, V. O., P. Grassini and P. Steduto (2011) The state of the world's land and water resources for food and
agriculture (SOLAW) - Managing systems at risk. Report 7 - Status of water use efficiency of main crops,
Food and Agriculture Organization of the United Nations, Rome, Italy & Earthscan, London, UK.
Safaya, S., G. Zhang and R. Mathews (2015) Improving the sustainability of cotton production - An assessment
of the Water Footprint of agricultural practices in C&A's supply chain, Water Footprint Network, Enschede,
The Netherlands.
Sankaranarayanan, K., Praharaj, C. S. and K.K.Bandyopadhyay (2007) Water management practices to improve
cotton production, in Training Manual on “Cultivation of Long Staple Cotton (ELS)”, December 15-22,
2007 Central Institute for Cotton Research, Regional Station, Coimbatore, Tamil Nadu, India.
Seufert, V., N. Ramankutty, and J. A. Foley (2012) Comparing the yields of organic and conventional agriculture.
Nature, 485: 229–234.
Swezey, S. P. Goldman, J. Bryer, and D. Nieto. 2007. Six-year comparison between organic, IPM and
conventional cotton production systems in the Northern San Joaquin Valley, California. Renewable
Agriculture and Food Systems 22(1): 30–40.
Singh, R.J., I.P.S. Ahlawat and B. Gangaiah (2009) Direct and residual effects of nitrogen management in Bt
cotton (Gossypium hirsutum)-wheat (Triticum aestivum) cropping system, Indian Journal of Agronomy,
54(4): 401-408.
Tolk, J.A., T.A. Howell and S.R. Evett, (1999) Effect of mulch, irrigation and soil type on water use and yield of
maize. Soil Till. Res., 50: 137–147.
Unger, P. W. and J. J. Parker (1979) Evaporation reduction from soil with wheat, sorghum and cotton residues,
Soil Sci. Soc. Am. J., 40: 938-942.
USDA (1997) Water quality and agriculture: Status, conditions, and trends, Working Paper No. 16, Natural
Resources Conservation Service, United States Department of Agriculture, Washington, D.C., USA.
Vittal, K.P.R., T.P. Rajendran, G. Ravindra Chary, G.R. Maruthi Sankar, T. Srijaya, Y.S. Ramakrishna, J.S. Samra
and G. Singh. Eds. (2004). District wise Promising Technologies for Rainfed Cotton based Production
Systems in India. All India Co-ordinated Research Project for Dryland Agriculture, Central Research
Institute for Dryland Agriculture, Indian Council of Agricultural Research, Hyderabad, India.
Wanjura, D. F, D.R. Upchurch and J.R. Mahan (2006) Behavior of temperature-based water stress indicators in
BIOTIC-controlled irrigation, Irrig. Sci., 24: 223-232.
58 / Water Footprint Reduction of Cotton Farming in India
Wisser, D., Frolking, S., Douglas, E.M., Fekete, B.M., Schumann, A.H., Vörösmarty, C.J. (2010) Blue and green
water: the significance of local water resources captured in small reservoirs for crop production. Journal of
Hydrology, 384: 264–275.
WWF (2010) Better management practices for cotton cultivation - a guide on sustainable cotton production for
field and agricultural extension workers, WWF-India, New Delhi, India.
Xie Z.K., Wang Y.J., Jiang W.L., Wei X.H. (2006) Evaporation and evapotranspiration in a watermelon field
mulched with gravel of different sizes in northwest China. Agric Water Manage. 81(1-2): 173–184.
Zhang, H., (2003) Improving water productivity through deficit irrigation: examples from Syria, the North China
Plain and Oregon, USA. In: Kijne, J.W., Barker, R., Molden, D. (eds.) Water productivity in agriculture:
limits and opportunities for improvement. International Water Management Institute, Colombo, Sri Lanka,
pp. 301-309.
Zhang, S., P. Li, X. Yuang, Z. Wang and X. Chen (2011) Effects of tillage and plastic mulch on soil water, growth
and yield of spring-sown maize, Soil and Tillage Research 112(1): 92-97.
Zribi, W., R. Aragüés, E. Medina and J. M. Faci (2015) Efficiency of inorganic and organic mulching materials
for soil evaporation control, Soil and Tillage Research 148: 40-45.
Zwart, S.J. and W.G.M. Bastiaanssen (2004) Review of measured crop water productivity values for irrigated
wheat, rice, cotton and maize. Agricultural Water Management 69(2): 115-133.
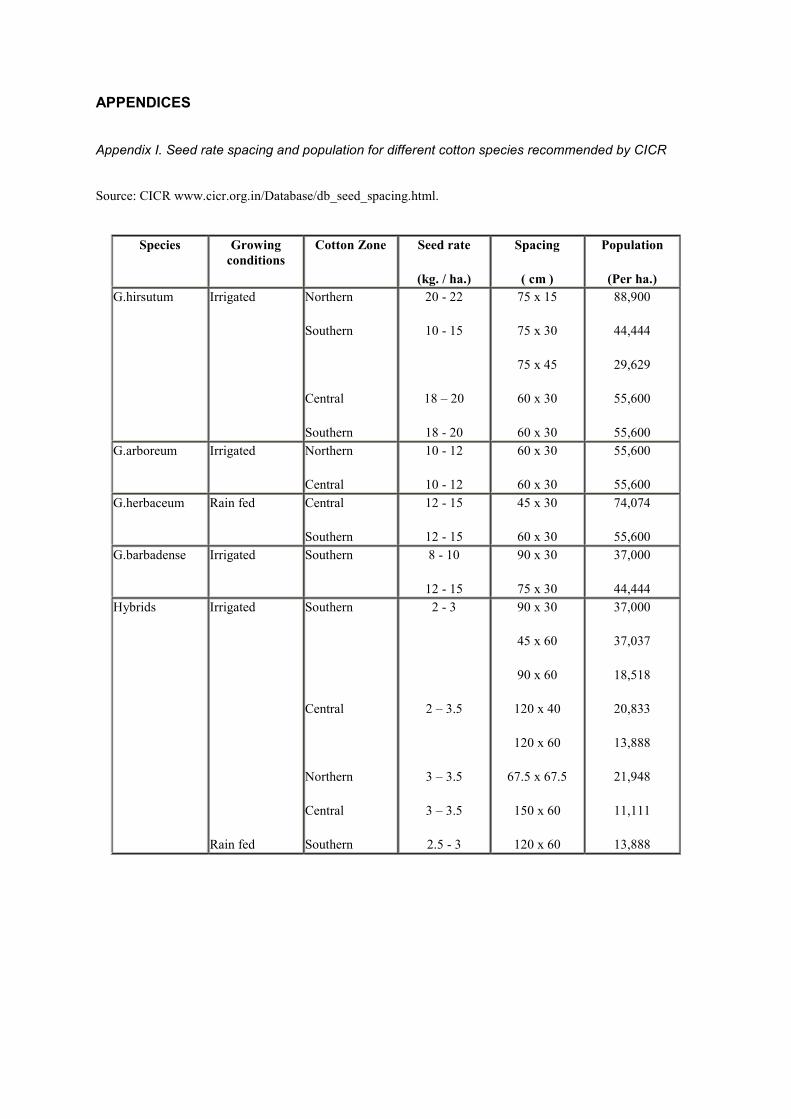
APPENDICES
Appendix I. Seed rate spacing and population for different cotton species recommended by CICR
Source: CICR www.cicr.org.in/Database/db_seed_spacing.html.
Species Growing conditions
Cotton Zone Seed rate
(kg. / ha.)
Spacing
( cm )
Population
(Per ha.) G.hirsutum Irrigated Northern
Southern
Central
Southern
20 - 22
10 - 15
18 – 20
18 - 20
75 x 15
75 x 30
75 x 45
60 x 30
60 x 30
88,900
44,444
29,629
55,600
55,600 G.arboreum Irrigated Northern
Central
10 - 12
10 - 12
60 x 30
60 x 30
55,600
55,600 G.herbaceum Rain fed Central
Southern
12 - 15
12 - 15
45 x 30
60 x 30
74,074
55,600 G.barbadense Irrigated Southern 8 - 10
12 - 15
90 x 30
75 x 30
37,000
44,444 Hybrids Irrigated
Rain fed
Southern
Central
Northern
Central
Southern
2 - 3
2 – 3.5
3 – 3.5
3 – 3.5
2.5 - 3
90 x 30
45 x 60
90 x 60
120 x 40
120 x 60
67.5 x 67.5
150 x 60
120 x 60
37,000
37,037
18,518
20,833
13,888
21,948
11,111
13,888
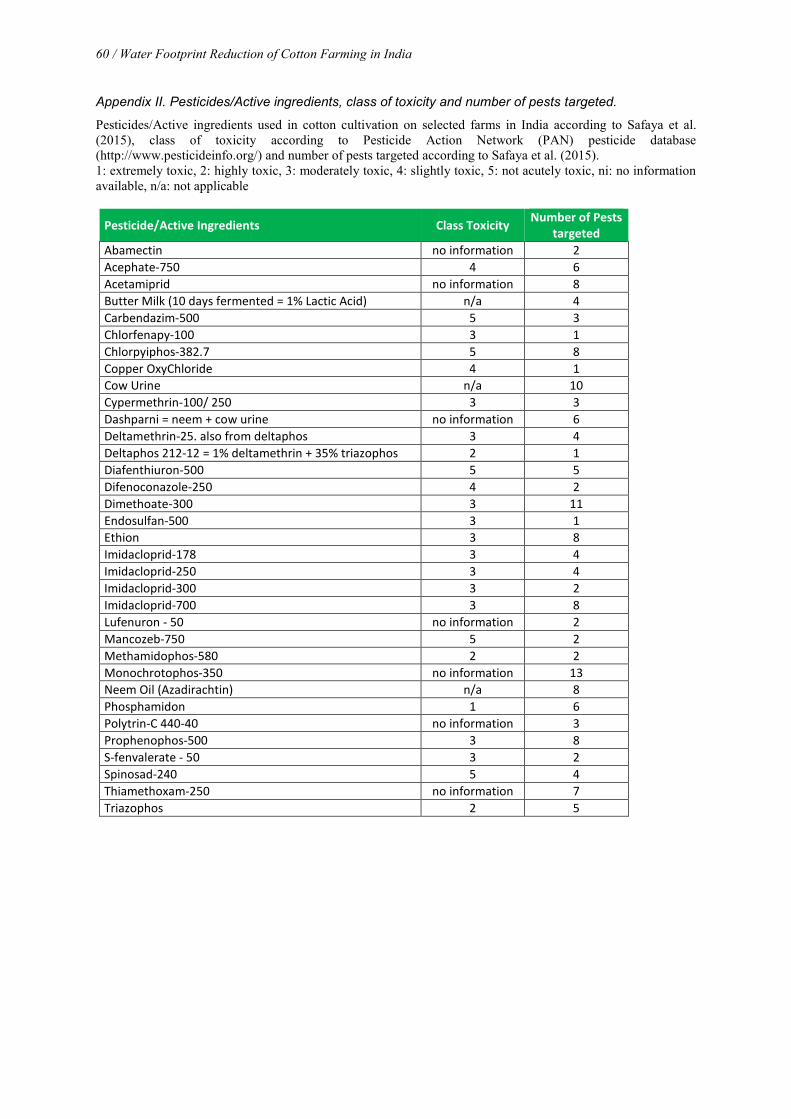
60 / Water Footprint Reduction of Cotton Farming in India
Appendix II. Pesticides/Active ingredients, class of toxicity and number of pests targeted.
Pesticides/Active ingredients used in cotton cultivation on selected farms in India according to Safaya et al. (2015), class of toxicity according to Pesticide Action Network (PAN) pesticide database (http://www.pesticideinfo.org/) and number of pests targeted according to Safaya et al. (2015). 1: extremely toxic, 2: highly toxic, 3: moderately toxic, 4: slightly toxic, 5: not acutely toxic, ni: no information available, n/a: not applicable
Pesticide/Active Ingredients Class Toxicity Number of Pests targeted
Abamectin no information 2
Acephate-750 4 6
Acetamiprid no information 8
Butter Milk (10 days fermented = 1% Lactic Acid) n/a 4
Carbendazim-500 5 3
Chlorfenapy-100 3 1
Chlorpyiphos-382.7 5 8
Copper OxyChloride 4 1
Cow Urine n/a 10
Cypermethrin-100/ 250 3 3
Dashparni = neem + cow urine no information 6
Deltamethrin-25. also from deltaphos 3 4
Deltaphos 212-12 = 1% deltamethrin + 35% triazophos 2 1
Diafenthiuron-500 5 5
Difenoconazole-250 4 2
Dimethoate-300 3 11
Endosulfan-500 3 1
Ethion 3 8
Imidacloprid-178 3 4
Imidacloprid-250 3 4
Imidacloprid-300 3 2
Imidacloprid-700 3 8
Lufenuron - 50 no information 2
Mancozeb-750 5 2
Methamidophos-580 2 2
Monochrotophos-350 no information 13
Neem Oil (Azadirachtin) n/a 8
Phosphamidon 1 6
Polytrin-C 440-40 no information 3
Prophenophos-500 3 8
S-fenvalerate - 50 3 2
Spinosad-240 5 4
Thiamethoxam-250 no information 7
Triazophos 2 5

Appendix II, continued: Pesticides/Active ingredients and pest names
Note that "All" and "Other" were counted as one pest, since these terms are too unspecific in this context.
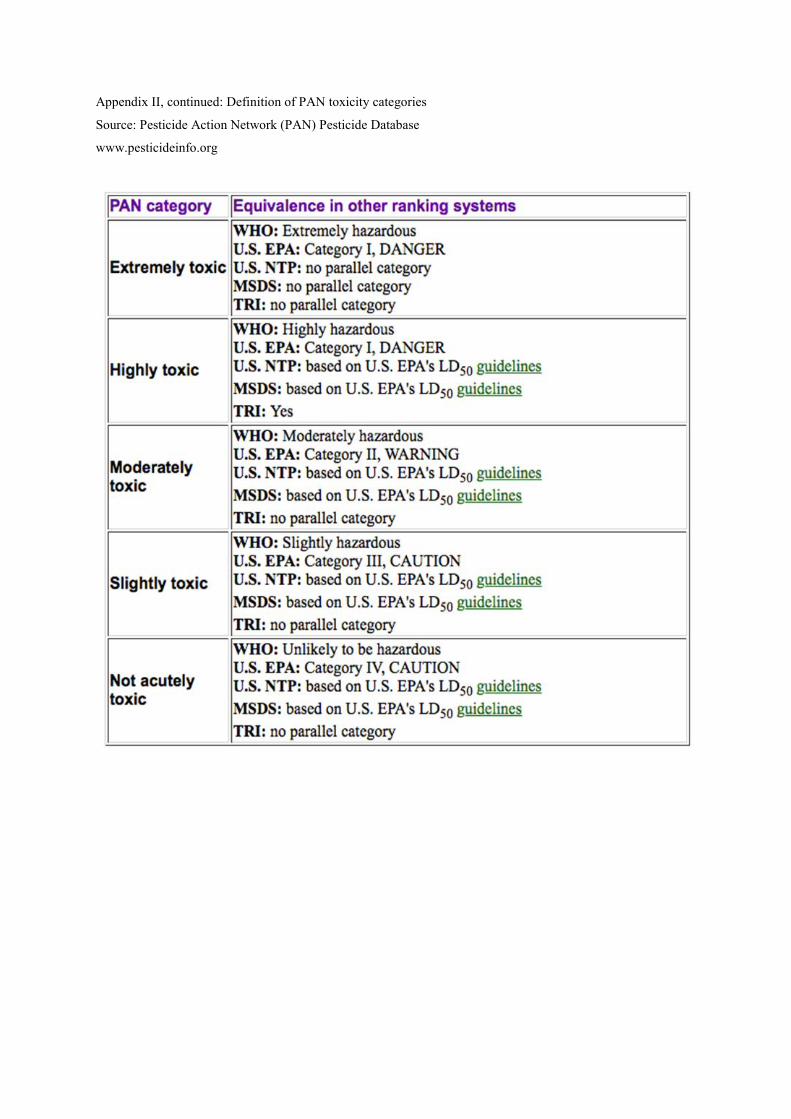
Appendix II, continued: Definition of PAN toxicity categories
Source: Pesticide Action Network (PAN) Pesticide Database
www.pesticideinfo.org
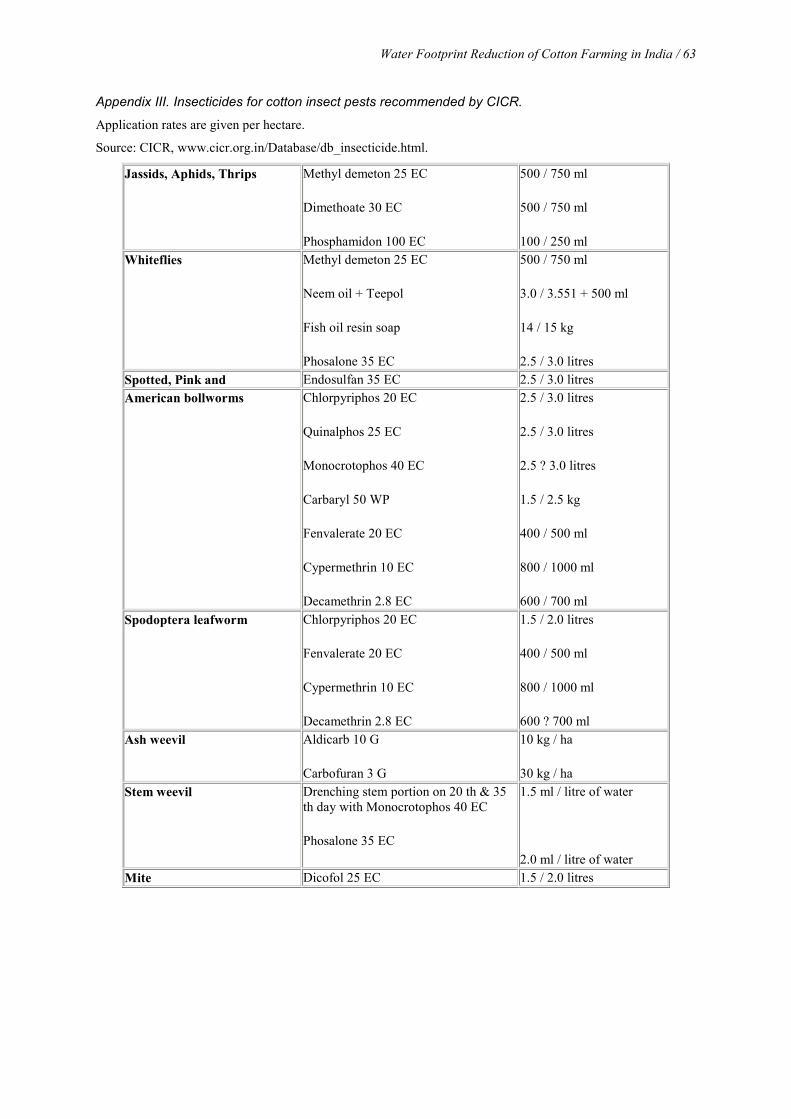
Water Footprint Reduction of Cotton Farming in India / 63
Appendix III. Insecticides for cotton insect pests recommended by CICR.
Application rates are given per hectare.
Source: CICR, www.cicr.org.in/Database/db_insecticide.html.
Jassids, Aphids, Thrips
Methyl demeton 25 EC
Dimethoate 30 EC
Phosphamidon 100 EC
500 / 750 ml
500 / 750 ml
100 / 250 ml Whiteflies Methyl demeton 25 EC
Neem oil + Teepol
Fish oil resin soap
Phosalone 35 EC
500 / 750 ml
3.0 / 3.551 + 500 ml
14 / 15 kg
2.5 / 3.0 litres Spotted, Pink and Endosulfan 35 EC 2.5 / 3.0 litres American bollworms Chlorpyriphos 20 EC
Quinalphos 25 EC
Monocrotophos 40 EC
Carbaryl 50 WP
Fenvalerate 20 EC
Cypermethrin 10 EC
Decamethrin 2.8 EC
2.5 / 3.0 litres
2.5 / 3.0 litres
2.5 ? 3.0 litres
1.5 / 2.5 kg
400 / 500 ml
800 / 1000 ml
600 / 700 ml Spodoptera leafworm Chlorpyriphos 20 EC
Fenvalerate 20 EC
Cypermethrin 10 EC
Decamethrin 2.8 EC
1.5 / 2.0 litres
400 / 500 ml
800 / 1000 ml
600 ? 700 ml Ash weevil Aldicarb 10 G
Carbofuran 3 G
10 kg / ha
30 kg / ha Stem weevil Drenching stem portion on 20 th & 35
th day with Monocrotophos 40 EC
Phosalone 35 EC
1.5 ml / litre of water
2.0 ml / litre of water Mite Dicofol 25 EC 1.5 / 2.0 litres
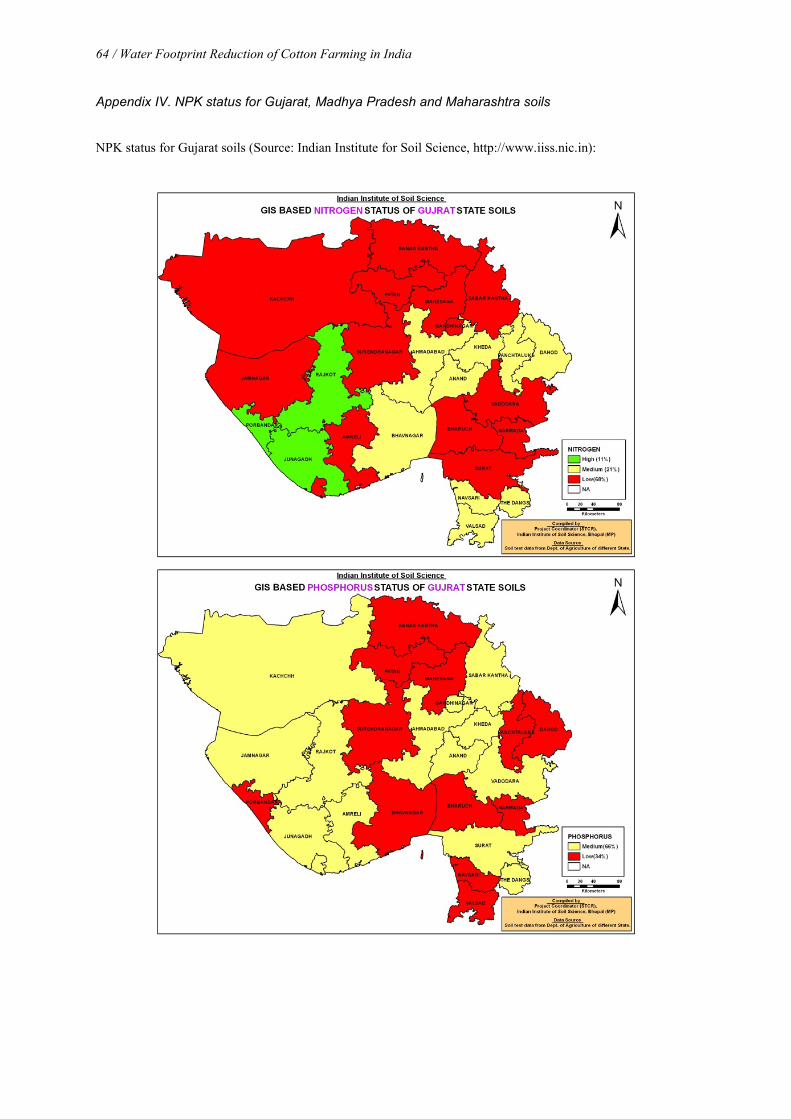
64 / Water Footprint Reduction of Cotton Farming in India
Appendix IV. NPK status for Gujarat, Madhya Pradesh and Maharashtra soils
NPK status for Gujarat soils (Source: Indian Institute for Soil Science, http://www.iiss.nic.in):
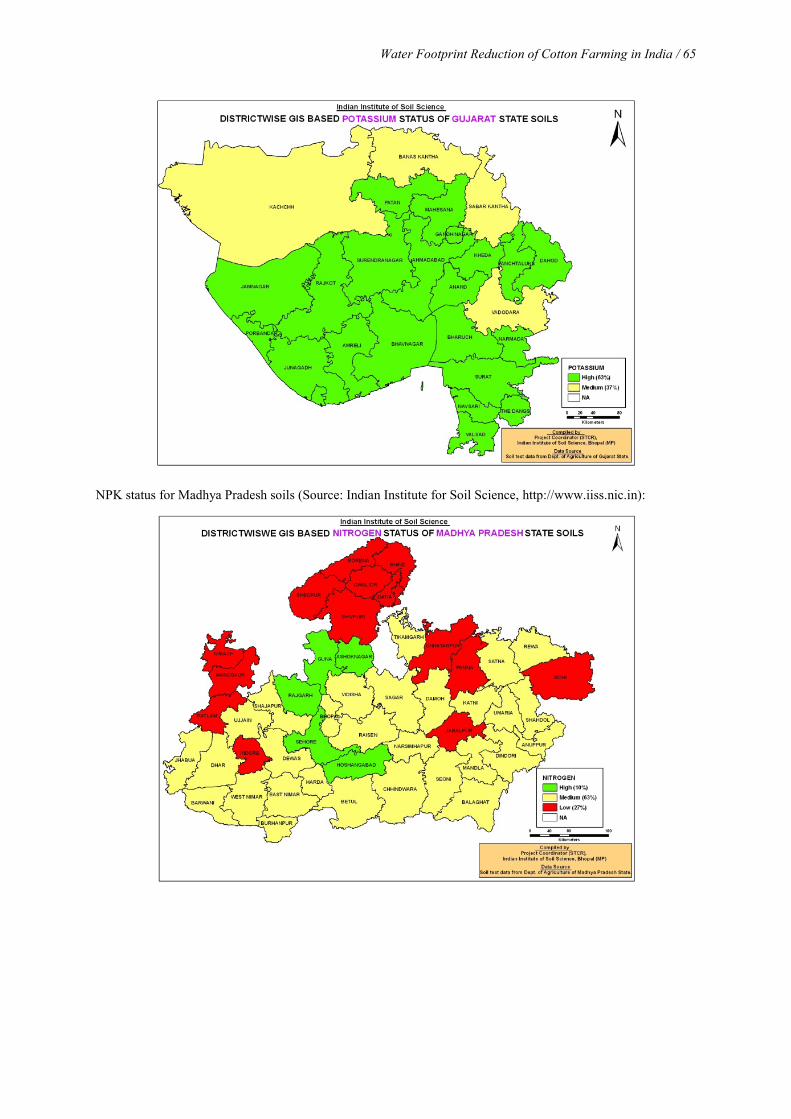
Water Footprint Reduction of Cotton Farming in India / 65
NPK status for Madhya Pradesh soils (Source: Indian Institute for Soil Science, http://www.iiss.nic.in):
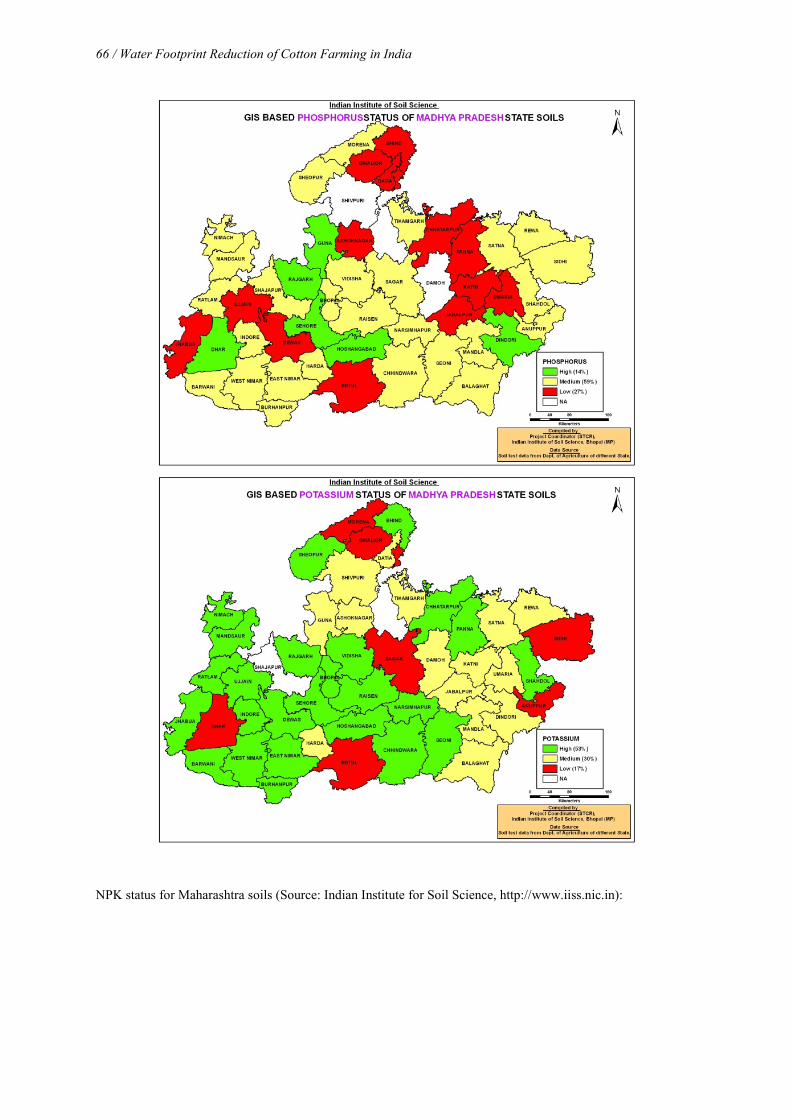
66 / Water Footprint Reduction of Cotton Farming in India
NPK status for Maharashtra soils (Source: Indian Institute for Soil Science, http://www.iiss.nic.in):
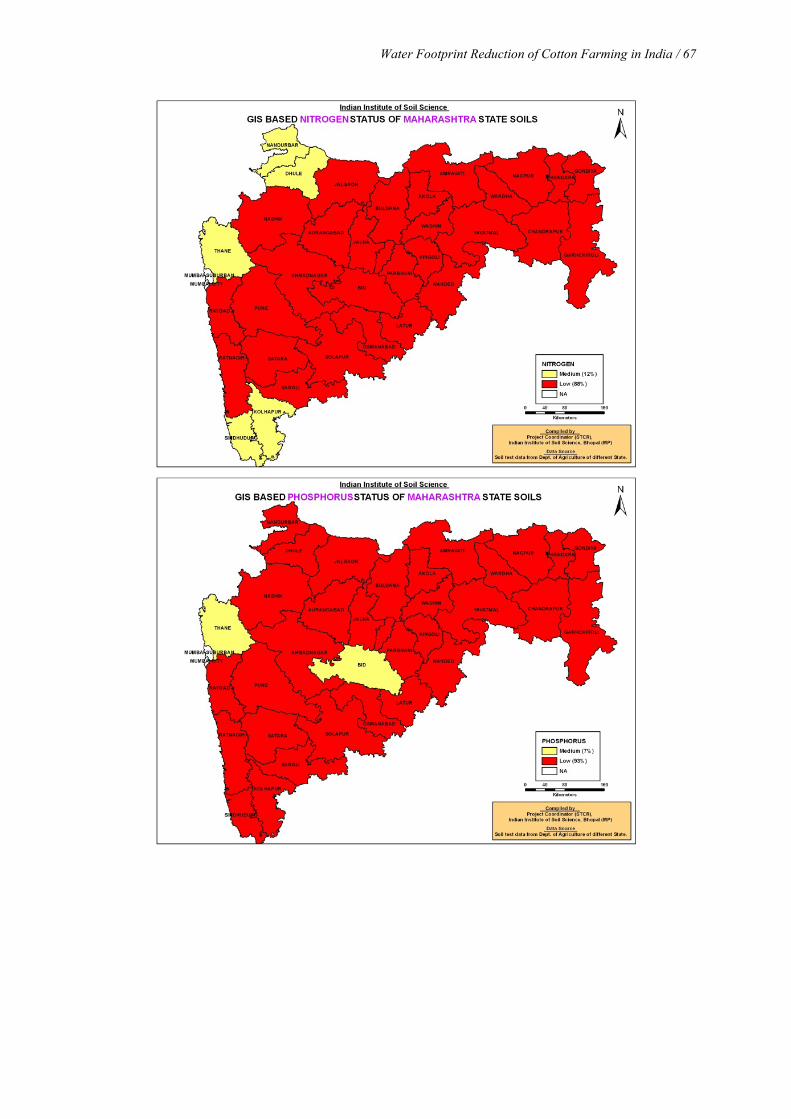
Water Footprint Reduction of Cotton Farming in India / 67
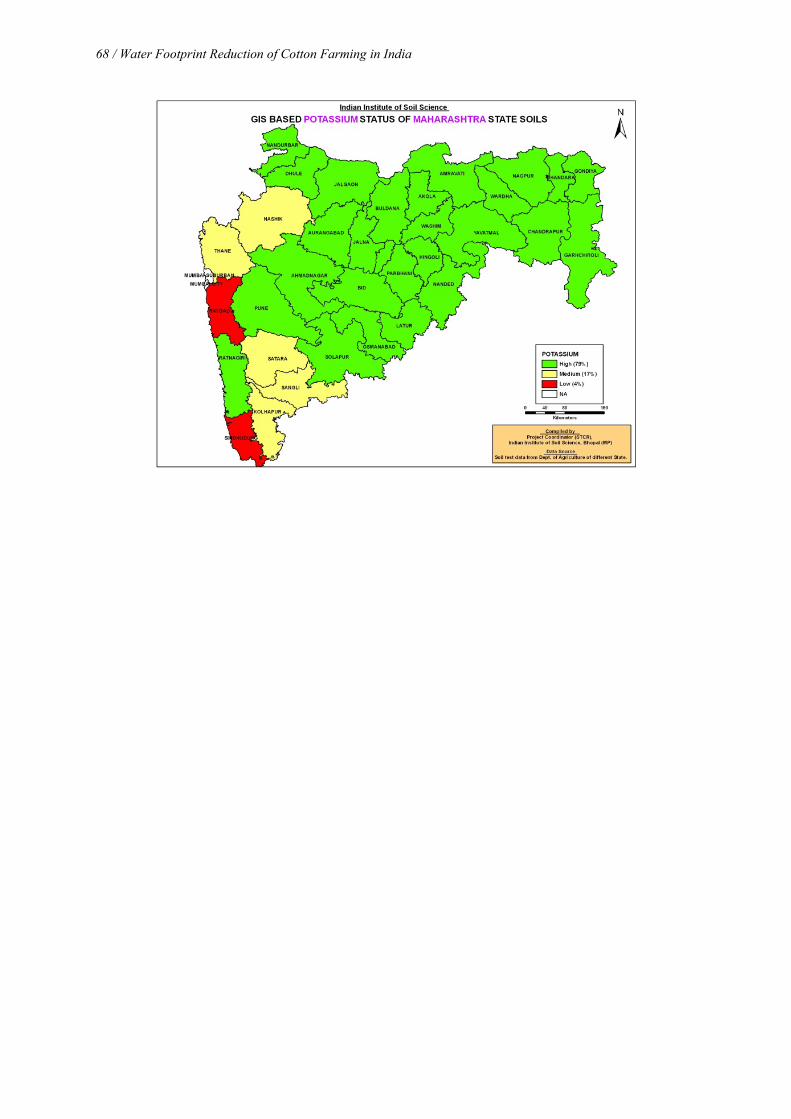
68 / Water Footprint Reduction of Cotton Farming in India
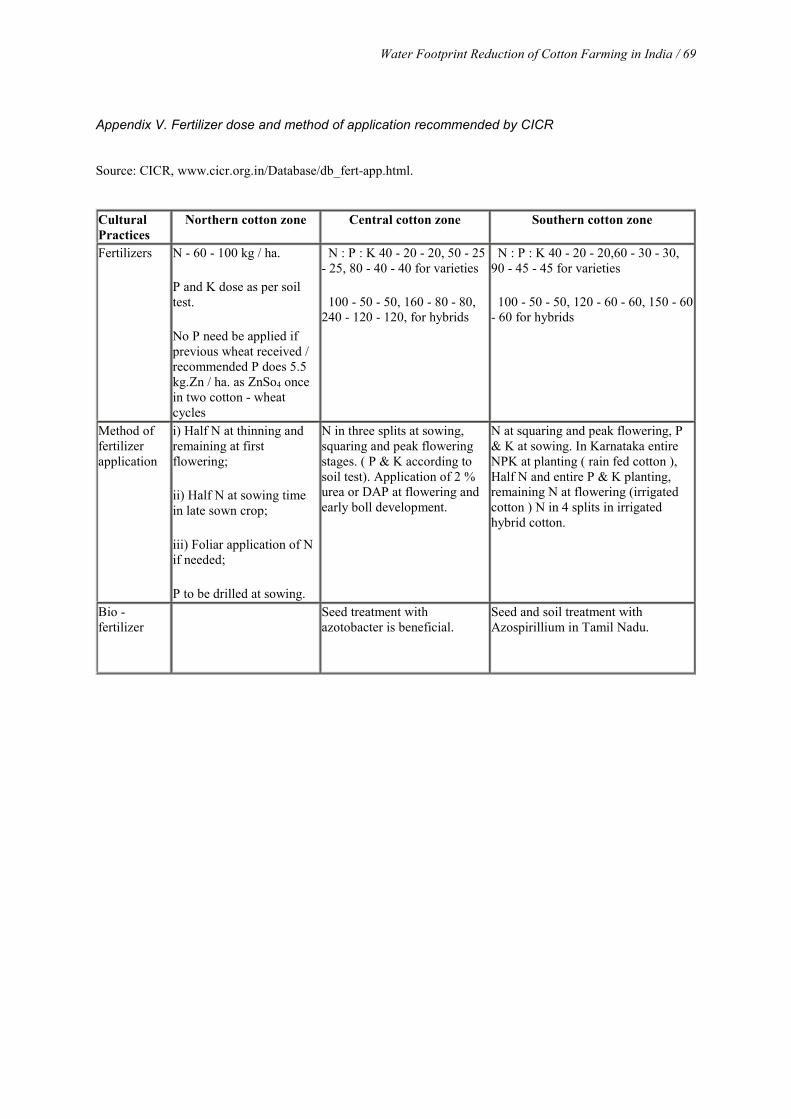
Water Footprint Reduction of Cotton Farming in India / 69
Appendix V. Fertilizer dose and method of application recommended by CICR
Source: CICR, www.cicr.org.in/Database/db_fert-app.html.
Cultural Practices
Northern cotton zone Central cotton zone Southern cotton zone
Fertilizers N - 60 - 100 kg / ha.
P and K dose as per soil test.
No P need be applied if previous wheat received / recommended P does 5.5 kg.Zn / ha. as ZnSo4 once in two cotton - wheat cycles
N : P : K 40 - 20 - 20, 50 - 25 - 25, 80 - 40 - 40 for varieties 100 - 50 - 50, 160 - 80 - 80, 240 - 120 - 120, for hybrids
N : P : K 40 - 20 - 20,60 - 30 - 30, 90 - 45 - 45 for varieties 100 - 50 - 50, 120 - 60 - 60, 150 - 60 - 60 for hybrids
Method of fertilizer application
i) Half N at thinning and remaining at first flowering;
ii) Half N at sowing time in late sown crop;
iii) Foliar application of N if needed;
P to be drilled at sowing.
N in three splits at sowing, squaring and peak flowering stages. ( P & K according to soil test). Application of 2 % urea or DAP at flowering and early boll development.
N at squaring and peak flowering, P & K at sowing. In Karnataka entire NPK at planting ( rain fed cotton ), Half N and entire P & K planting, remaining N at flowering (irrigated cotton ) N in 4 splits in irrigated hybrid cotton.
Bio - fertilizer
Seed treatment with azotobacter is beneficial.
Seed and soil treatment with Azospirillium in Tamil Nadu.


Value of Water Research Report Series Editorial board: A.Y. Hoekstra, University of Twente; H.H.G. Savenije, Delft University of Technology; P. van der Zaag, UNESCO-IHE. 1. Exploring methods to assess the value of water: A case study on the Zambezi basin A.K. Chapagain − February 2000 2. Water value flows: A case study on the Zambezi basin. A.Y. Hoekstra, H.H.G. Savenije and A.K. Chapagain − March 2000 3. The water value-flow concept I.M. Seyam and A.Y. Hoekstra − December 2000 4. The value of irrigation water in Nyanyadzi smallholder irrigation scheme, Zimbabwe G.T. Pazvakawambwa and P. van der Zaag – January 2001 5. The economic valuation of water: Principles and methods J.I. Agudelo – August 2001 6. The economic valuation of water for agriculture: A simple method applied to the eight Zambezi basin countries J.I. Agudelo and A.Y. Hoekstra – August 2001 7. The value of freshwater wetlands in the Zambezi basin I.M. Seyam, A.Y. Hoekstra, G.S. Ngabirano and H.H.G. Savenije – August 2001 8. ‘Demand management’ and ‘Water as an economic good’: Paradigms with pitfalls H.H.G. Savenije and P. van der Zaag – October 2001 9. Why water is not an ordinary economic good H.H.G. Savenije – October 2001 10. Calculation methods to assess the value of upstream water flows and storage as a function of downstream benefits I.M. Seyam, A.Y. Hoekstra and H.H.G. Savenije – October 2001 11. Virtual water trade: A quantification of virtual water flows between nations in relation to international crop trade A.Y. Hoekstra and P.Q. Hung – September 2002 12. Virtual water trade: Proceedings of the international expert meeting on virtual water trade, IHE Delft, the Netherlands, 12-13 December 2002 A.Y. Hoekstra (ed.) – February 2003 13. Virtual water flows between nations in relation to trade in livestock and livestock products A.K. Chapagain and A.Y. Hoekstra – July 2003 14. The water needed to have the Dutch drink coffee A.K. Chapagain and A.Y. Hoekstra – August 2003 15. The water needed to have the Dutch drink tea A.K. Chapagain and A.Y. Hoekstra – August 2003 16. Water footprints of nations, Volume 1: Main Report, Volume 2: Appendices A.K. Chapagain and A.Y. Hoekstra – November 2004 17. Saving water through global trade A.K. Chapagain, A.Y. Hoekstra and H.H.G. Savenije – September 2005 18. The water footprint of cotton consumption A.K. Chapagain, A.Y. Hoekstra, H.H.G. Savenije and R. Gautam – September 2005 19. Water as an economic good: the value of pricing and the failure of markets P. van der Zaag and H.H.G. Savenije – July 2006 20. The global dimension of water governance: Nine reasons for global arrangements in order to cope with local water problems A.Y. Hoekstra – July 2006 21. The water footprints of Morocco and the Netherlands A.Y. Hoekstra and A.K. Chapagain – July 2006 22. Water’s vulnerable value in Africa P. van der Zaag – July 2006 23. Human appropriation of natural capital: Comparing ecological footprint and water footprint analysis A.Y. Hoekstra – July 2007 24. A river basin as a common-pool resource: A case study for the Jaguaribe basin in Brazil P.R. van Oel, M.S. Krol and A.Y. Hoekstra – July 2007 25. Strategic importance of green water in international crop trade M.M. Aldaya, A.Y. Hoekstra and J.A. Allan – March 2008 26. Global water governance: Conceptual design of global institutional arrangements M.P. Verkerk, A.Y. Hoekstra and P.W. Gerbens-Leenes – March 2008 27. Business water footprint accounting: A tool to assess how production of goods and services impact on freshwater resources worldwide P.W. Gerbens-Leenes and A.Y. Hoekstra – March 2008 28. Water neutral: reducing and offsetting the impacts of water footprints A.Y. Hoekstra – March 2008 29. Water footprint of bio-energy and other primary energy carriers P.W. Gerbens-Leenes, A.Y. Hoekstra and Th.H. van der Meer – March 2008 30. Food consumption patterns and their effect on water requirement in China J. Liu and H.H.G. Savenije – March 2008 31. Going against the flow: A critical analysis of virtual water trade in the context of India’s National River Linking Programme S. Verma, D.A. Kampman, P. van der Zaag and A.Y. Hoekstra – March 2008 32. The water footprint of India D.A. Kampman, A.Y. Hoekstra and M.S. Krol – May 2008 33. The external water footprint of the Netherlands: Quantification and impact assessment P.R. van Oel, M.M. Mekonnen and A.Y. Hoekstra – May 2008 34. The water footprint of bio-energy: Global water use for bio-ethanol, bio-diesel, heat and electricity P.W. Gerbens-Leenes, A.Y. Hoekstra and Th.H. van der Meer – August 2008
35. Water footprint analysis for the Guadiana river basin M.M. Aldaya and M.R. Llamas – November 2008 36. The water needed to have Italians eat pasta and pizza M.M. Aldaya and A.Y. Hoekstra – May 2009 37. The water footprint of Indonesian provinces related to the consumption of crop products F. Bulsink, A.Y. Hoekstra and M.J. Booij – May 2009 38. The water footprint of sweeteners and bio-ethanol from sugar cane, sugar beet and maize P.W. Gerbens-Leenes and A.Y. Hoekstra – November 2009 39. A pilot in corporate water footprint accounting and impact assessment: The water footprint of a sugar-containing carbonated beverage A.E. Ercin, M.M. Aldaya and A.Y. Hoekstra – November 2009 40. The blue, green and grey water footprint of rice from both a production and consumption perspective A.K. Chapagain and A.Y. Hoekstra – March 2010 41. Water footprint of cotton, wheat and rice production in Central Asia M.M. Aldaya, G. Muñoz and A.Y. Hoekstra – March 2010 42. A global and high-resolution assessment of the green, blue and grey water footprint of wheat M.M. Mekonnen and A.Y. Hoekstra – April 2010 43. Biofuel scenarios in a water perspective: The global blue and green water footprint of road transport in 2030 A.R. van Lienden, P.W. Gerbens-Leenes, A.Y. Hoekstra and Th.H. van der Meer – April 2010 44. Burning water: The water footprint of biofuel-based transport P.W. Gerbens-Leenes and A.Y. Hoekstra – June 2010 45. Mitigating the water footprint of export cut flowers from the Lake Naivasha Basin, Kenya M.M. Mekonnen and A.Y. Hoekstra – June 2010 46. The green and blue water footprint of paper products: methodological considerations and quantification P.R. van Oel and A.Y. Hoekstra – July 2010 47. The green, blue and grey water footprint of crops and derived crop products M.M. Mekonnen and A.Y. Hoekstra – December 2010 48. The green, blue and grey water footprint of animals and derived animal products M.M. Mekonnen and A.Y. Hoekstra – December 2010 49. The water footprint of soy milk and soy burger and equivalent animal products A.E. Ercin, M.M. Aldaya and A.Y. Hoekstra – February 2011 50. National water footprint accounts: The green, blue and grey water footprint of production and consumption M.M. Mekonnen and A.Y. Hoekstra – May 2011 51. The water footprint of electricity from hydropower M.M. Mekonnen and A.Y. Hoekstra – June 2011 52. The relation between national water management and international trade: a case study from Kenya M.M. Mekonnen and A.Y. Hoekstra – June 2011 53. Global water scarcity: The monthly blue water footprint compared to blue water availability for the world’s major river basins A.Y. Hoekstra and M.M. Mekonnen – September 2011 54. Proceedings of the ESF Strategic Workshop on accounting for water scarcity and pollution in the rules of international trade A.Y. Hoekstra, M.M. Aldaya and B. Avril (eds.) – October 2011 55. A comparative study on the water footprint of poultry, pork and beef in different countries and production systems P.W. Gerbens-Leenes, M.M. Mekonnen and A.Y. Hoekstra – December 2011 56. The water footprint of France A.E. Ercin, M.M. Mekonnen and A.Y. Hoekstra – March 2012 57. The water footprint of Switzerland A.E. Ercin, M.M. Mekonnen and A.Y. Hoekstra – March 2012 58. Blue water footprint of agriculture, industry, households and water management in the Netherlands A.Y. Hoekstra, M.J. Booij, J.C Hunink and K.S. Meijer – June 2012 59. Water footprint scenarios for 2050: A global analysis and case study for Europe A.E. Ercin and A.Y. Hoekstra – September 2012 60. Proceedings of the session "Solving the Water Crisis: Common Action Toward a Sustainable Water Footprint", Planet under Pressure Conference, London,
26 March 2012 G.P. Zhang, A.Y. Hoekstra and D. Tickner (eds.) – October 2012 61. Water footprint of Tunisia from an economic perspective H. Chouchane, A.Y. Hoekstra, M.S. Krol and M.M. Mekonnen – November 2013 62. Sensitivity and uncertainty in crop water footprint accounting: A case study for the Yellow River Basin L. Zhuo, M.M. Mekonnen and A.Y. Hoekstra – November 2013 63. Wise freshwater allocation: Water footprint caps by river basin, benchmarks by product and fair water footprint shares by community A.Y. Hoekstra – November 2013 64. Benchmarking the water footprint of crops M.M. Mekonnen and A.Y. Hoekstra – December 2013 65. Grey water footprint accounting: Tier 1 supporting guidelines N.A. Franke, H. Boyacioglu, and A.Y. Hoekstra – December 2013 66. Water Footprint Assessment for Latin America and the Caribbean: An analysis of the sustainability, efficiency and equitability of water consumption and pollution M.M. Mekonnen, M., Pahlow, M.M. Aldaya, E. Zarate and A Y. Hoekstra – August 2014 67. The water footprint in Morocco: The added value of Water Footprint Assessment for national water policy J.F. Schyns and A Y. Hoekstra – September 2014 68. Assessment of measures to reduce the water footprint of cotton farming in India M. Pahlow, M. S. Krol and A Y. Hoekstra – December 2015

UNESCO-IHEP.O. Box 30152601 DA DelftThe Netherlands
Website www.unesco-ihe.orgPhone +31 15 2151715
University of Twente
Delft University of Technology