
Buffet-Kun e-book vol · 2021. 1. 9. · Buffet-Kun e-book vol.8 8. Created Date: 5/18/2020 10:22:44 AM

MALAYSIA
JABATAN PERANGKAAN MALAYSIADEPARTMENT OF STATISTICS, MALAYSIA
VOL. 8 / 2020


VOL. 8 / 2020
MALAYSIA
JABATAN PERANGKAAN MALAYSIADEPARTMENT OF STATISTICS, MALAYSIA
Announcement:
Please be informed that the Department of Statistics, Malaysia is conducting Population and Housing Census Malaysia 2020 (Banci Malaysia)
7.7.2020 – 21.12.2020 (e-Census)20.1.2021 – 6.2.2021 (Face to face)
Please be informed that the Government of Malaysia has declared National Statistics Day (MyStats Day) on October 20 each year.MyStats Day theme is
“Connecting the world with data we can trust”

Published and printed by:
Department of Statistics, Malaysia Block C6, Complex C, Federal Government Administrative Centre, 62514 Putrajaya, MALAYSIA
Tel. : 03-8885 7000 Fax : 03-8888 9248 Portal : http://www.dosm.gov.my Facebook : www.facebook.com/StatsMalaysia Twitter : http://twitter.com/StatsMalaysia Instagram : http://instagram.com/StatsMalaysia
Published on 24th December 2020.
All rights reserved.
No part of this publication may be reproduced or distributed in any form or by any means or stored in database without the prior written permission from Department of Statistics, Malaysia. Users reproducing content of this publication with or without adaptation should quote the following.
“Source: Department of Statistics, Malaysia”.
eISSN 2716-6813

TABLE OF CONTENTS
NOTES FROM CHIEF STATISTICIAN
MOVEMENT CONTROL ORDER
KEY REVIEW
OVERVIEW
BOX ARTICLES
AGRICULTURE
INDUSTRY AND MANUFACTURING
SERVICES
EXTERNAL SECTOR
LABOUR SCENARIO
PRICES
WAY FORWARD
ECONOMIC INDICATORS
MESR MEMBERS
ACKNOWLEDGEMENT
02
31
10
44
05
38
26
59
04
35
22
58
06
41
28

| MALAYSIAN ECONOMIC STATISTICS REVIEW - VOL. 8/20202
NOTES FROM CHIEF STATISTICIAN
The Department of Statistics, Malaysia (DOSM) would like to convey its heartfelt gratitude to all of the users for the encouragement and continuous support bestowed upon us. In realising the eighth volume of the Malaysian Economic Statistics Review (MESR), I would like to express my utmost appreciation to those who have contributed especially the dedicated team of this publication. This review focuses primarily on the economic performance based on the recent statistics released by DOSM and features two dedicated box articles entitled FDI Inflows in Malaysia’s Economy: The Role and Impact and The Impact of COVID-19 on Malaysia’s Environment.
The year 2020 started with the news of the spread of COVID-19 pandemic around the world and subsequently the World Health Organization (WHO) first declared COVID-19 as a world health emergency on 30th January 2020. Globally, countries have progressively undertaken various containment measures to curb the spread of cases which include enforcing movement restrictions and closing borders. In response, the Malaysian Government has taken similar steps with the implementation of Movement Control Order (MCO) whilst reviewing and adjusting the implemented MCO measures from time to time, based on the current COVID-19 situation in the country. Now at the end of 2020, Malaysia is still coordinating the balance between the implementation of MCO in phases and reopening the economy at a safe pace while safeguarding the health of the people and promoting economic recovery in this global crisis as the number of COVID-19 cases remained high at three to four-digit levels.
The unprecedented situation has impeded overall global economic activities with the world economy experiencing a sharp contraction and Malaysia being a highly open economy, has also been adversely affected. Based on the Asian Development Bank (ADB) economic report released in December 2020, the growth of Developing Asia countries are anticipated to rebound to 6.8 per cent in 2021, however, it is forecasted that the level of Gross Domestic Product (GDP) next year is substantially below pre-COVID-19 levels. The economy of Southeast Asia is forecasted to shrink 4.4 per cent in 2020 and grew by 5.2 per cent in 2021. As such, Malaysia’s GDP is projected to fall by 6.0 per cent this year before bouncing back to 7.0 per cent in 2021. In comparison with other countries, based on the latest GDP estimates of European Union (EU), the economy decreased 4.2 per cent in the third quarter of 2020, which represents a partial recovery after declining 13.9 per cent in the second quarter of 2020. The United Kingdom’s GDP contracted 8.2 per cent in October 2020 compared with the same month a year ago; whilst Canada’s economy declined 3.9 per cent year-on-year in September 2020. Meanwhile, China’s economy sustained a steady recovery in November 2020 with the total value added of the industrial grew 7.0 per cent year-on-year compared to 6.9 per cent in October 2020.
As at this moment, Malaysia is not poised to enter the COVID-19 Exit Strategy Phase yet as signalled by the extension of Conditional Movement Control Order (CMCO) in W.P. Kuala Lumpur, Selangor and Sabah as well as several districts in Johor, Negeri Sembilan and Perak till 31st December 2020. Nevertheless, Malaysia continues to chart economic recovery despite the challenging circumstances. The labour force has increased by 24.7 thousand persons to record 15.96 million persons in October 2020 as compared to the previous month. Employed persons registered an uptrend for five consecutive months with a marginal growth of 0.1 per cent month-on-month to record 15.21 million persons. Nonetheless, the unemployment rate in October 2020 was 4.7 per cent, increased 0.1 percentage points as against September 2020 after registering a decreasing trend for four consecutive months since June 2020.

MALAYSIAN ECONOMIC STATISTICS REVIEW - VOL. 8/2020 | 3
NOTES FROM CHIEF STATISTICIAN
Malaysia’s exports of goods in October 2020 increased slightly by 0.2 per cent year-on-year to RM91.1 billion, the second highest monthly exports value registered in 2020. The positive growth was supported by the increase in exports of Rubber gloves; Palm oil and palm oil-based products as well as Electrical and electronic products. The Manufacturing sector continues to be the saving grace of the economy with a positive growth of 2.4 per cent driven by both domestic and export-oriented industries. The largest contributors to domestic-oriented industries were Food processing; Motor vehicles & transport equipment; and Basic metals. Meanwhile, export-oriented industries were dominated by a significant increase in Rubber products, Electronic components & boards, Communication equipment and consumer electronics; and Computers & peripheral equipment. In October 2020, Malaysia’s Manufacturing sales registered RM122.0 billion, rose 2.2 per cent as compared to the same month of the previous year, driven by the Food, beverages & tobacco products; Transport equipment & other manufactures products; and Electrical & electronics products.
As we are edging towards the end of 2020, news on the development of COVID-19 vaccines sparked joy across the world, including in Malaysia, as containing the pandemic and protecting the most vulnerable remain the country’s utmost priority. The effective roll-out of the vaccination programme is expected to drive Malaysia’s economy to a rebound in 2021, which would see continuous improvements in exports and a greater momentum in consumption and higher confidence in investment activities. Hopefully, Malaysia would be able to be back on track to its pre-pandemic economic activities, albeit, at a modest pace in 2021.
Regarding the implementation of the Population and Housing Census of Malaysia 2020, the Department would like to request the cooperation of the public. Further information on the Census 2020 can be obtained through the census portal www.mycensus.gov.my or social media @MyCensus2020.
We look forward to your comments or suggestions towards the improvement of the next volume.
Thank you.
DR. MOHD UZIR MAHIDIN
December 2020

| MALAYSIAN ECONOMIC STATISTICS REVIEW - VOL. 8/20204
MOVEMENT CONTROL ORDER
CH
RON
OLO
GY
OF
MC
O
Mov
emen
t Con
trol
Ord
er
(MC
O)
Con
ditio
nal
MC
O
(CM
CO
) R
ecov
ery
MC
O
(RM
CO
) R
ecov
ery
MC
O
(RM
CO
)
Phas
e 1
18 -
31 M
arch
Phas
e 2
1 - 1
4 Ap
ril
Phas
e 3
15 -
28 A
pril
MCO
Pha
se 2
O
n 25
M
arch
20
20,
the
MC
O
was
ex
tend
ed
for
anot
her
2 w
eeks
un
til
14
Apr
il 20
20.
MCO
Pha
se 3
G
over
nmen
t ha
s ex
tend
ed
MC
O f
or a
noth
er 2
wee
ks
until
28
April
202
0.
Phas
e 4
29 A
pril
- 12
May
On
23 A
pril
2020
,
Phas
e 5
4 M
ay -
9 Ju
ne
Phas
e 6
10 J
une
- 31
Augu
st
and
com
mer
cial
activ
ities
w
ere
allo
wed
on
10 J
une
2020
exc
ept
for
the
rem
aini
ng a
reas
in t
he E
nhan
ced
MC
O.
Phas
e 7
1 Se
p - 3
1 D
ec
CM
CO
ann
ounc
emen
t by
Seni
or M
inis
ter o
f Def
ense
.
SEP
OC
T N
OV
DEC
M
AY
JUN
JU
L AU
G
MAR
AP
R
12 O
ct 2
020
14 O
ct -
6 D
ec
Klan
g Va
lley
13 O
ct -
20 D
ec S
abah
7 N
ov 2
020
9 N
ov -
6 D
ec P
erak
, Pul
au P
inan
g,
Neg
eri S
embi
lan,
Mel
aka
9 - 2
1 N
ov
Ter
engg
anu,
Ked
ah, J
ohor
20 N
ov 2
020
21 N
ov -
6 D
ec
Kela
ntan
6 D
ec 2
020
7 - 2
0 D
ec
Kual
a Lu
mpu
r and
Sel
ango
r
Gov
ernm
ent
has
impl
emen
ted
Rec
over
y M
CO
on
7 Ju
ne 2
020
whe
re in
ters
tate
trav
el
On
1 M
ay
2020
, G
over
nmen
t an
noun
ced
Con
ditio
nal M
CO
whe
re
all e
cono
mic
sec
tor a
nd b
usin
ess
activ
ity
oper
atio
n w
ere
allo
wed
on
4 M
ay 2
020.
On
28
Augu
st
2020
, G
over
nmen
t ha
s an
noun
ced
Rec
over
y M
CO
to
be
co
ntin
ued
until
31
Dec
embe
r 202
0.
Gov
ernm
ent
cont
inue
d M
CO
for
ano
ther
2 w
eeks
un
til 1
2 M
ay 2
020.
MALAYSIAN ECONOMIC STATISTICS REVIEW - VOL. 8/2020 | 5
KEY REVIEW
• Malaysia’s economic performance rose by 4.8 per cent per annum in the period of 2015 to 2019 before the COVID-19 pandemic spread this year. Based on the first nine months of 2020, the Malaysia’s economy decelerated to negative 6.4 per cent as compared to positive 4.3 per cent in 2019. On the supply side, the real GDP growth for the nine months of 2020 indicates that all 5 main sectors in the economy decreased compared to 2019.
• As for October 2020, the production of natural rubber increased by 5.4 per cent month-on-month to 48,663 tonnes (September 2020: 46,187 tonnes). Similarly, on a year-on-year basis, the production recorded an increase of 0.3 per cent as compared to 48,528 tonnes in October 2019. Meanwhile, the production of palm fresh fruit bunches in November 2020 was 7,513,250 tonnes, down 1.3 per cent year-on-year compared to 7,610,484 tonnes recorded in 2019. Month-on-month comparisons also showed a decrease of 11.8 per cent (October 2020: 8,523,164 metric tonnes).
• Malaysia’s exports grew marginally 0.2 per cent year-on-year in the current month in October 2020, after recording a significant increase in September (+13.6%). Imports maintained negative single-digit growth with a larger magnitude of 6.0 per cent compared with negative 3.6 per cent in September 2020. The larger fall in imports has contributed to the double-digit growth of the trade balance to record RM22.1 billion (+25.9%).
• Manufacturing sales registered RM122.0 billion, increased 2.2 per cent (September 2020: 3.7%) as compared to the previous year. The sales value was driven by the Food, beverages & tobacco products (13.8%); Transport equipment & other manufactures products (9.3%) and Electrical & electronics products (3.8%). Similarly, Industrial Production Index (IPI) for Manufacturing recorded a growth of 2.4 per cent as compared to 4.3 per cent in the previous month.
• The overall IPI in October 2020 recorded a decline of 0.5 per cent as compared to the same month of the previous year. IPI for the selected major trading partners of Malaysia showed a downward trend such as Singapore, -0.9 per cent (September 2020: 25.6%) and South Korea, -1.2 per cent (September 2020: 5.5%). While China’s IPI was in positive growth of 6.9 per cent year-on-year basis.
• Sales value of Wholesale & Retail Trade dropped 0.8 per cent year-on-year to record RM110.5 billion in October 2020. The sector went back to a negative growth of sales value, largely due to Retail Trade which contracted 1.5 per cent or RM0.7 billion to RM44.2 billion as compared to October 2019. Similarly, Wholesale Trade also recorded a year-on-year decrease of 0.9 per cent (RM0.5 billion) to register RM53.4 billion.
• The Consumer Price Index (CPI) in October 2020 decreased 1.5 per cent to 120.2 as against 122.0 in the same month of the preceding year. The decrease in the overall index was attributed by the decline in Transport (-10.2%), Housing, Water, Electricity, Gas & Other Fuels (-3.0%) and Clothing & Footwear (-0.4%) which contributed 41.6 per cent to the overall weight.
• The Producer Price Index (PPI) local production decreased by 3.6 per cent in October 2020 to 101.3 from 105.1 in the same month of 2019. The overall decline was driven by the Mining index (-43.5%), Electricity & gas supply (-1.2%) and Manufacturing (-1.1%). On the other hand, the Agriculture, forestry & fishing and Water supply indexes increased by 21.0 per cent and 1.0 per cent respectively.
• In October 2020, the labour force increased by 24.7 thousand persons from the previous month to 15.96 million persons. Similarly, the labour force participation rate (LFPR) in October 2020 went up by 0.1 percentage points to 68.5 per cent (September 2020: 68.4%).
• The unemployment rate in October 2020 was 4.7 per cent, an increase of 0.1 percentage points as against September 2020 after registering a decreasing trend for four consecutive months since June 2020. As for a year-on-year basis, the unemployment rate increased further by 1.5 percentage points, whereby the number of unemployed persons increased by 236.1 thousand persons to record 748.2 thousand persons (October 2019: 512.1 thousand persons).
• Malaysian economy is expected to continue its journey to recovery in the early months of 2021. This expectation is reflected by the annual change of Leading Index (LI) which acts as an indicator on the future movement of the overall economy. The annual change of LI rose 6.3 per cent in October 2020 to reach 108.7 points from 102.3 points in the same month of 2019. Nevertheless, the LI declined to negative 0.7 per cent as against the previous month. Although the LI shows a slower performance in the reference month, the growth rate of smoothed LI continued above trend. Moreover, the rollout of COVID-19 vaccine has lifted the levels of confidence to a better economic condition ahead.

| MALAYSIAN ECONOMIC STATISTICS REVIEW - VOL. 8/20206
OVERVIEW
The Asian Development Bank (ADB) forecasted that economic growth of Developing Asia to contract 0.4 per cent in 2020. The economies in all sub-regions are expected to be remained sluggish except for East Asia which is projected to grow 1.6 per cent in 2020 as China recovers more quickly than expected. In 2021, the growth of Developing Asia is forecasted to rebound to 6.8 per cent with the level of GDP will be substantially below pre-COVID-19 expectations. As for Southeast Asia, the economy is forecast to shrink 4.4 per cent in 2020 and grew 5.2 per cent in 2021. Meanwhile, Malaysia’s economy outlook is projected to fall by 6.0 per cent this year and bounce back by 7.0 per cent in 2021 (Table 1).
Table 1: GDP Growth Rate in Developing Asia by Sub-regions, 2019 - 2021
The latest GDP estimates of European Union (EU) recorded year-on-year decrease of 4.2 per cent in the third quarter of 2020. This indicates partial recovery after declined 13.9 per cent in the second quarter of 2020. All EU Member States posted smaller decline during the quarter with France registered the highest improvement of negative 3.9 per cent. In addition, GDP of Italy dropped 5.0 per cent while Spain, -8.7 per cent and Portugal, -5.7 per cent.
Besides that, National Statistics Office of United Kingdom (UK) reported that UK GDP contracted 8.2 per cent in October 2020 compared with the same month a year ago. During the month, the production improved to negative 5.5 per cent attributed by the Manufacturing sector which recorded negative 7.1 per cent while Services sector declined 8.8 per cent. Month-on-month, UK GDP grew 0.4 per cent supported by Services sector (0.2%), Production (1.3%) and Construction (1.0%).
Based on National Bureau of Statistics China, the economy sustained a steady recovery in November 2020 with the total value added of the industrial grew 7.0 per cent year-on-year as compared to 6.9 per cent in October 2020 supported by Mining sector (2.0%), Manufacturing (7.7%) and the production and supply of Electricity, thermal power, gas and water (5.4%). In addition, Index of Services Production grew 8.0 per cent year-on-year in November 2020.
According to Statistics Canada, the economy declined 3.9 per cent year-on-year in September 2020. On the other hand, the Canada economy grew marginally 0.8 per cent month-on-month. The increase for the fifth consecutive month continued to offset the sharp fall on record in Canadian economic activity observed in March and April this year. During the period, both the goods-producing and services-producing
GDP growth (%)
2019 2020 2021* Central Asia 4.9 -2.1 3.8 Kazakhstan 4.5 -3.2 2.8
East Asia 5.4 1.6 7.0 Hong Kong, China -1.2 -5.5 5.1 People’s Republic of China 6.1 2.1 7.7 Republic of Korea 2.0 -0.9 3.3 Taipei, China 3.0 1.7 3.3
South Asia 4.3 -6.1 7.2 India 4.2 -8.0 8.0
Southeast Asia 4.4 -4.4 5.2 Indonesia 5.0 -2.2 4.5 Malaysia 4.3 -6.0 7.0 Philippines 6.0 -8.5 6.5 Singapore 0.7 -6.2 5.1 Thailand 2.4 -7.8 4.0 Viet Nam 7.0 2.3 6.1
The Pacific 3.5 -6.1 1.3 Developing Asia 5.1 -0.4 6.8 Developing Asia excluding the NIEs 5.6 -0.3 7.2
Table 1: GDP growth rate in Developing Asia by Sub-regions
Source: Asian Development OutlookNote : * forecast

MALAYSIAN ECONOMIC STATISTICS REVIEW - VOL. 8/2020 | 7
OVERVIEW
industries posted a smaller negative growth of 5.6 per cent and 3.3 per cent respectively. Performance of Goods-producing industries attributed by Mining, quarrying and oil and gas extraction sector which registered negative 15.4 per cent. Manufacturing sector improved to negative 4.2 per cent in September as both durable and non-durable manufacturing increased during the month. In addition, the growth of Services-producing industries was driven by Public sector which recorded a smaller negative of 2.5 per cent.
Economy GrowthThe year 2020 comes to the end and the COVID-19 pandemic has adversely impacted the economy across the globe including Malaysia. Prior to the COVID-19 pandemic, Malaysia’s economy rose by 4.8 per cent per annum for a period of 2015 to 2019. Based on nine months performance in 2020, the country’s economy decelerated to negative 6.4 per cent as compared to a positive growth of 4.3 per cent in 2019. During the period, the share of Services and Construction sectors expanded to 57.7 per cent and 4.0 per cent respectively while the share of Mining & Quarrying and Agriculture reduced (Chart 1). The Manufacturing sector which was the second contributor to economy sustained its share above 20 per cent. On the demand side, Private Final Consumption Expenditure (PFCE) or household spending increased its share to 60.1 per cent while share of Gross Fixed Capital Expenditure (GFCE) or domestic investment hovering 20 per cent to the total economy. In terms of total trade, the share to GDP accounted for 115.6 per cent (9 months of 2020) against 120.4 per cent in 2019. Openness to trade (reflected in total trade to GDP) and investment (reflected by GFCF) has been the instrument of employment creation and income growth in Malaysia.
Chart 1: Malaysia’s Economic Structure in Decades
Notes: A total economic structure may not add up to 100 per cent due to the exclusion of FISIM (1970-2000), import duties and inventory components. The economic structure is calculated based on GDP at constant prices of various base year. (*) nine (9) months of 2020 GFCE: Government Final Consumption Expenditure GFCF: Gross Fixed Capital Formation PFCE: Private Final Consumption Expenditure
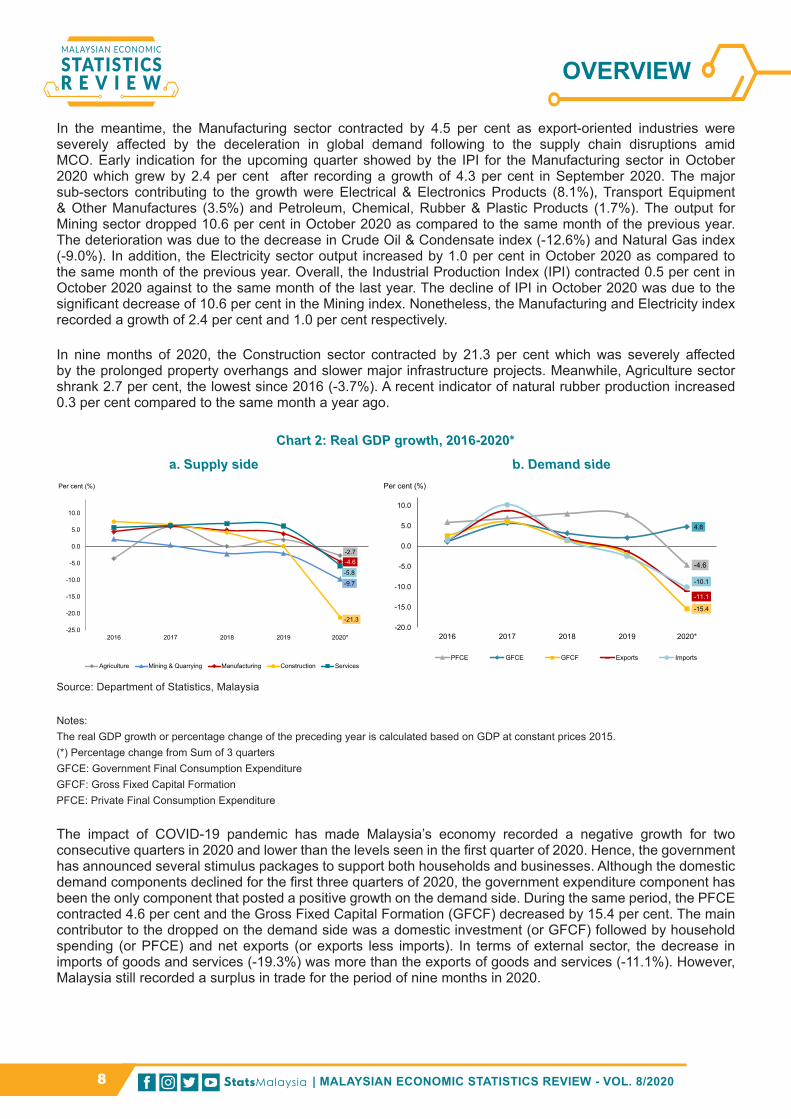
On the supply side, the real GDP growth for the nine months of 2020 shows that all five main economic sectors decreased compared to 2019 (Chart 2). During the period, Services sector contracted by 5.8 per cent due to the full impact of COVID-19 in the second quarter of 2020. The Services sector, especially the tourism-related industry, remained weak but expected to recover after inter-state travel reopened in early December 2020. Nevertheless, the Information and Communication subsector expanded as online transactions increased significantly during the MCO and shopping online promotions towards the end of the year. An early indication of Wholesale & Retail Trade in October 2020, shows that sales value decreased marginally by negative 0.8 per cent in line with the volume index of Wholesale & Retail Trade which contracted by 1.4 per cent as compared to the same month a year ago.
a. Supply side b. Demand side
28.8 22.9 16.3
8.6 10.1 7.6
6.9 10.1
9.4 10.6 10.9
6.9
14.6 19.6 24.6
30.9 23.4 22.7
3.7 4.6 3.5 3.9
3.4 4.0
42.6 40.1 46.8 49.3 51.2 57.7
1970 1980 1990 2000 2010 2020*
Agriculture Mining & Quarrying Manufacturing Construction Services
Graph 1: Malaysia’s economic structure in decades.
a. Supply side
Source: Department of Statistics, Malaysia
Graph 1: Malaysia’s economic structure in decades.
4.2
-2.9
1.1
19.2
15.9
6.4
18.3
17.4
13.4
10.2
12.6
12.6
17.5
31.3
33.9
25.3
22.4
21.3
60.0
54.9
52.2
43.8
48.1
60.1
-5.0 15.0 35.0 55.0 75.0 95.0
1970
1980
1990
2000
2010
2020*
Net Exports GFCE GFCF PFCE
b. Demand side
Percentage (%) Per cent (%)
| MALAYSIAN ECONOMIC STATISTICS REVIEW - VOL. 8/20208
In the meantime, the Manufacturing sector contracted by 4.5 per cent as export-oriented industries were severely affected by the deceleration in global demand following to the supply chain disruptions amid MCO. Early indication for the upcoming quarter showed by the IPI for the Manufacturing sector in October 2020 which grew by 2.4 per cent after recording a growth of 4.3 per cent in September 2020. The major sub-sectors contributing to the growth were Electrical & Electronics Products (8.1%), Transport Equipment & Other Manufactures (3.5%) and Petroleum, Chemical, Rubber & Plastic Products (1.7%). The output for Mining sector dropped 10.6 per cent in October 2020 as compared to the same month of the previous year. The deterioration was due to the decrease in Crude Oil & Condensate index (-12.6%) and Natural Gas index (-9.0%). In addition, the Electricity sector output increased by 1.0 per cent in October 2020 as compared to the same month of the previous year. Overall, the Industrial Production Index (IPI) contracted 0.5 per cent in October 2020 against to the same month of the last year. The decline of IPI in October 2020 was due to the significant decrease of 10.6 per cent in the Mining index. Nonetheless, the Manufacturing and Electricity index recorded a growth of 2.4 per cent and 1.0 per cent respectively.
In nine months of 2020, the Construction sector contracted by 21.3 per cent which was severely affected by the prolonged property overhangs and slower major infrastructure projects. Meanwhile, Agriculture sector shrank 2.7 per cent, the lowest since 2016 (-3.7%). A recent indicator of natural rubber production increased 0.3 per cent compared to the same month a year ago.
Chart 2: Real GDP growth, 2016-2020*
Notes: The real GDP growth or percentage change of the preceding year is calculated based on GDP at constant prices 2015. (*) Percentage change from Sum of 3 quarters GFCE: Government Final Consumption Expenditure GFCF: Gross Fixed Capital Formation PFCE: Private Final Consumption Expenditure
The impact of COVID-19 pandemic has made Malaysia’s economy recorded a negative growth for two consecutive quarters in 2020 and lower than the levels seen in the first quarter of 2020. Hence, the government has announced several stimulus packages to support both households and businesses. Although the domestic demand components declined for the first three quarters of 2020, the government expenditure component has been the only component that posted a positive growth on the demand side. During the same period, the PFCE contracted 4.6 per cent and the Gross Fixed Capital Formation (GFCF) decreased by 15.4 per cent. The main contributor to the dropped on the demand side was a domestic investment (or GFCF) followed by household spending (or PFCE) and net exports (or exports less imports). In terms of external sector, the decrease in imports of goods and services (-19.3%) was more than the exports of goods and services (-11.1%). However, Malaysia still recorded a surplus in trade for the period of nine months in 2020.
a. Supply side b. Demand side
-2.7
-9.7
-4.6
-21.3
-5.8
-25.0
-20.0
-15.0
-10.0
-5.0
0.0
5.0
10.0
2016 2017 2018 2019 2020*
Agriculture Mining & Quarrying Manufacturing Construction Services
Graph 2: Real GDP growth, 2016-2020*
a. Supply side
Per cent (%)
-4.6
4.8
-15.4
-11.1
-10.1
-20.0
-15.0
-10.0
-5.0
0.0
5.0
10.0
2016 2017 2018 2019 2020*
PFCE GFCE GFCF Exports Imports
Graph 2: Real GDP growth, 2016-2020*
a. Demand side
Per cent (%)
Source: Department of Statistics, Malaysia
OVERVIEW
MALAYSIAN ECONOMIC STATISTICS REVIEW - VOL. 8/2020 | 9
Budget 2021 highlighted three objectives with 14 strategies and 44 measures amounted to RM322.5 billion. The big chunk of the cake will be allocated under the first pillar, Rakyat’s Wellbeing which is to combat the COVID-19 pandemic, health, education and assistance to the B40 income. Under this pillar, it will induce the government expenditure and indirectly contribute to the economic growth. The second pillar would be Business continuity, which will likely boost the economy by enhancing access to financing and driving domestic investment. Lastly, the third pillar is economic resilience on major allocation for development under the 12th Malaysia plan that anticipates the major infrastructure projects which is the main driver of the construction sector.
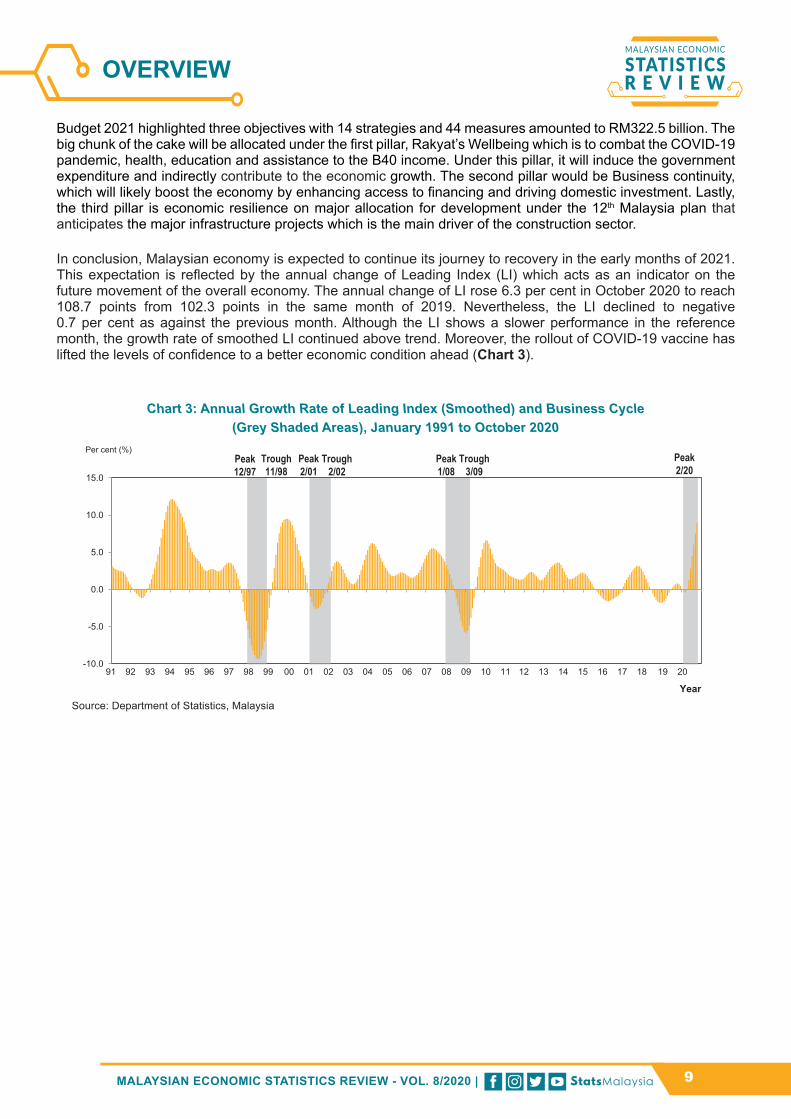
In conclusion, Malaysian economy is expected to continue its journey to recovery in the early months of 2021. This expectation is reflected by the annual change of Leading Index (LI) which acts as an indicator on the future movement of the overall economy. The annual change of LI rose 6.3 per cent in October 2020 to reach 108.7 points from 102.3 points in the same month of 2019. Nevertheless, the LI declined to negative 0.7 per cent as against the previous month. Although the LI shows a slower performance in the reference month, the growth rate of smoothed LI continued above trend. Moreover, the rollout of COVID-19 vaccine has lifted the levels of confidence to a better economic condition ahead (Chart 3).
Chart 3: Annual Growth Rate of Leading Index (Smoothed) and Business Cycle(Grey Shaded Areas), January 1991 to October 2020
Source: Department of Statistics, Malaysia
OVERVIEW
-10.0
-5.0
0.0
5.0
10.0
15.0
91 92 93 94 95 96 97 98 99 00 01 02 03 04 05 06 07 08 09 10 11 12 13 14 15 16 17 18 19 20
Percentage (%) Peak 12/97
Trough 11/98
Peak 2/01
Trough 2/02
Peak 1/08
Trough 3/09
Year
Peak 2/20
Chart 1: Annual Growth Rate of Leading Index (Smoothed) and Business Cycle (Grey Shaded Areas), January 1991 to October 2020
Per cent (%)

| MALAYSIAN ECONOMIC STATISTICS REVIEW - VOL. 8/202010
BOX ARTICLE
FDI INFLOWS IN MALAYSIA’S ECONOMY: THE ROLE AND IMPACT
Siti Sarah Che Dan1; Noraniza Ibrahim2 1,2Balance of Payments Division, Department of Statistics, Malaysia
Introduction
Malaysia is an upper middle income, a developing nation and strategically located in the Asia Pacific Rim between huge economies, China and India that offers business with easy access to more than 4.3 billion population. Looking at the country’s economic changing landscape, there was a shift from agricultural-based activities in the 1970s to manufacturing in the 1990s and followed by the services in the 2000s. There has been a noticeable shift in value-added downstream activities and more focused on technology-based investment (P.G Beaumont, 1990). As this comes along, Malaysia welcomes foreign investors to invest in Malaysia and open the door to many foreign firms. The structure of foreign investments has been influenced by various factors such as global economy, industrial and consumer demands, strategies of foreign investors and the policies formulated by the government.
As Malaysia is strategically located in the heart of South East Asia, this country has a lot to offer to foreign investors with a dynamic and vibrant business environment as well as the ideal fundamentals for growth and productive labour force; thus, considering Malaysia as a prime investment destination. According to Malaysia Investment Development Authority (MIDA), Malaysia has the best infrastructure facilities and could accommodate export-based industries’ needs by offering more than 500 industrial estates and Free Trade Zones. In recent years, Malaysia has attracted more than 5,000 foreign investors from over 40 countries to set up their operations in this country, particularly in the manufacturing sector. Most of these companies have evolved and improved their operations, reflecting their confidence in Malaysia as a strategic and best country in doing business, and enhancing country-level and positioned efficiency.
Based on the Global Investment Competitiveness Report 2017/2018 (World Bank, 2018), Foreign Direct Investment (FDI) provides high benefits to developing countries through the supplied technical knowledge, improving manpower skills, increasing productivity, generating business for local firms, and creating better jobs with a good salary and wages. In addition, human capital development could be leverage and boost overall economic growth.
Overview of FDI in Malaysia
According to Pricewaterhouse Coopers on “Doing Business in Malaysia” (2017), Malaysia welcomes and invites foreign investments actively through providing extensive incentives to foreign investors, without restriction on the repatriation of capital and profits, which has placed Malaysia as the best competitive country for investment destination in the Asian region. Furthermore, several investment policies have been introduced by the Government of Malaysia to determine the direction of investment in Malaysia as well as wide range of tax incentives for manufacturing projects under the Investment Act 1968 and Income Tax Act 1967. Subsequently, lots of incentives such as Promotion Investment Act 1986, Pioneer Status, Reinvestment Allowance and Incentives for High Technology Industries (to name a few) also have been introduced to spur the economic growth of Malaysia especially in the manufacturing sector. Special incentives were also given to promote manufacturing related, regional operations and services-based industries, that are technology-intensive and involves high technology.
According to a report entitled Global Competitiveness Report 2019 - 2020 (World Economic Forum, 2020), Malaysia ranked at 25th out of 140 countries listed. Malaysia managed to uphold its strong position at second-highest ranking country after Singapore, as a competitive economy among Asian developing countries.
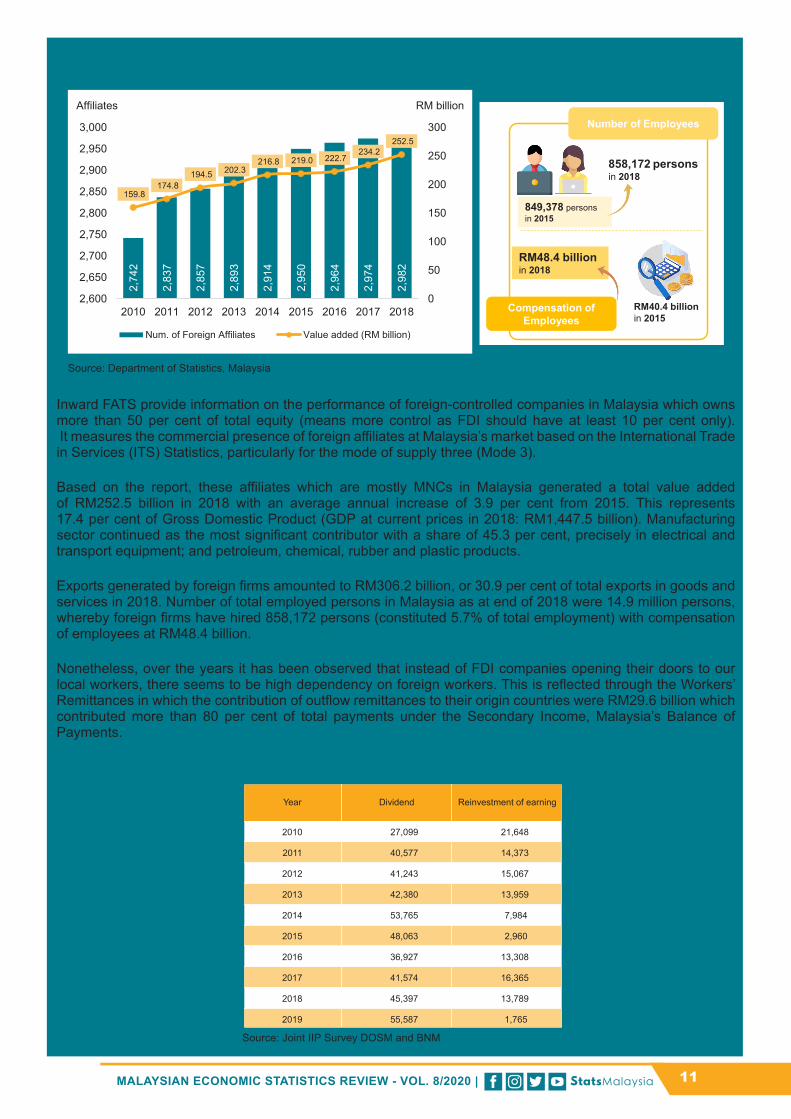
Referring to the Department of Statistics Malaysia (DOSM) records, most of the FDI companies in Malaysia are Multinational Corporations (MNCs) which contributed to the economy since the 1970s. MNCs are essential substances in the growth and development of Malaysia’s economy particularly in the manufacturing sector. MNCs significantly contributed to value-added, employment and total exports of the manufacturing industry and most of them are concentrated mainly in the export-oriented industries. This is in line with the findings of Foreign Affiliates Statistics in Malaysia (Inward FATS, 2019) published by DOSM where the number of affiliates recorded were 2,982 as depicted in Exhibit 1a.
11MALAYSIAN ECONOMIC STATISTICS REVIEW - VOL. 8/2020 | 11
Exhibit 1a: Overview of Foreign Affiliates in Malaysia
Inward FATS provide information on the performance of foreign-controlled companies in Malaysia which owns more than 50 per cent of total equity (means more control as FDI should have at least 10 per cent only). It measures the commercial presence of foreign affiliates at Malaysia’s market based on the International Trade in Services (ITS) Statistics, particularly for the mode of supply three (Mode 3).
Based on the report, these affiliates which are mostly MNCs in Malaysia generated a total value added of RM252.5 billion in 2018 with an average annual increase of 3.9 per cent from 2015. This represents 17.4 per cent of Gross Domestic Product (GDP at current prices in 2018: RM1,447.5 billion). Manufacturing sector continued as the most significant contributor with a share of 45.3 per cent, precisely in electrical and transport equipment; and petroleum, chemical, rubber and plastic products.
Exports generated by foreign firms amounted to RM306.2 billion, or 30.9 per cent of total exports in goods and services in 2018. Number of total employed persons in Malaysia as at end of 2018 were 14.9 million persons, whereby foreign firms have hired 858,172 persons (constituted 5.7% of total employment) with compensation of employees at RM48.4 billion.
Nonetheless, over the years it has been observed that instead of FDI companies opening their doors to our local workers, there seems to be high dependency on foreign workers. This is reflected through the Workers’ Remittances in which the contribution of outflow remittances to their origin countries were RM29.6 billion which contributed more than 80 per cent of total payments under the Secondary Income, Malaysia’s Balance of Payments.
Table 1a: Time Series of Dividend and Reinvestment of Earnings, 2010-2019 (RM million)
Number of Employees
858,172 persons in 2018
Compensation of Employees
849,378 persons in 2015
RM48.4 billion in 2018
RM40.4 billion in 2015
FDI Performance in 2019
FDI inflows expended to RM31.7 billion due to higher investment from Japan precisely in
Health activities
Top investors:
What happened in 2016 ?
FDI inflows registered a highest value of RM47.0 billion contributed by higher investment in Financial activities, while Hong Kong was the
main investor in 2016
Japan RM10.4b
(32.9%)
Hong Kong RM8.6b (27.2%)
Netherlands RM3.9b (12.3%)
Chart 1: Numbers of Foreign Affiliates and Value Added, Malaysia, 2010-2018
Exhibit 1: Perspectives of Foreign Affiliates, Malaysia, 2015 and 2018
Number of Employees
858,172 personsin 2018
Compensation of Employees
849,378persons in 2015
RM48.4 billionin 2018
RM40.4 billion in 2015
2,74
2
2,83
7
2,85
7
2,89
3
2,91
4
2,95
0
2,96
4
2,97
4
2,98
2
159.8 174.8
194.5 202.3 216.8 219.0 222.7
234.2 252.5
0
50
100
150
200
250
300
2,600
2,650
2,700
2,750
2,800
2,850
2,900
2,950
3,000
2010 2011 2012 2013 2014 2015 2016 2017 2018
Num. of Foreign Affiliates Value added (RM billion)
RM billionAffiliates
Year Dividend Reinvestment of earning
2010 27,099 21,648
2011 40,577 14,373
2012 41,243 15,067
2013 42,380 13,959
2014 53,765 7,984
2015 48,063 2,960
2016 36,927 13,308
2017 41,574 16,365
2018 45,397 13,789
2019 55,587 1,765
Table 1a: Time Series of Dividend and Reinvestment of Earnings, 2010-2019 (RM million)
Source: Joint IIP Survey DOSM and BNM
Source: Department of Statistics, Malaysia

| MALAYSIAN ECONOMIC STATISTICS REVIEW - VOL. 8/202012
According to the primary income statistics on Balance of Payments published by DOSM, RM55.6 billion of dividend has been declared by FDI firms, while only RM1.8 billion has been retained in Malaysia (Table 1a), signalling that 96.9 per cent of dividend from the total profit has been repatriated to their home country and shareholders in abroad.
The rate of return on FDI is higher than investing abroad (DIA), mainly attributed to more substantial profit earned by FDI companies in Malaysia as they are mostly involved in electrical & electronic, financial, health, metal and petrochemical industries that generates higher income.
By looking at the time series shown in Chart 1a, the quality of foreign investment that Malaysia requires to assist and compliment the economic growth of the country is still uncertain. Does the current FDI to Malaysia brings in the required quality, i.e. transfer of technology, management and skills enhancement as well as other opportunities? With GDP estimates to be unfavourable in 2020, government may need to find a quick solution in gaining more dynamic investments, plus the COVID-19 pandemic that had just begun late last year may make it more challenging to boost foreign investments into the country. Thus, all the relevant agencies have crucial responsibilities to bring in quality foreign investors that could assist in elevating Malaysia’s economy to be back on track.
Chart 1a: Return on Investment (ROI) for FDI and DIA, 2010 – 2019
Trend of FDI inflows and GDP in Malaysia
In Malaysia, FDI flows has been on the upward trend and recorded the lowest value in 2009 with RM5.1 billion due to Great Recession which began end of 2007, as shown in Exhibit 1b. In 2016, FDI reached a new high with a value of RM47.0 billion whereby the higher investment was contributed by Financial activity and Hong Kong was the main investor on that year. At the same time, the GDP increased steadily over the same period except in 2009. In 2019, FDI in Malaysia recorded a value of RM31.7 billion while GDP increased to RM1.51 trillion. The trend of FDI flows remained stable with the contribution of FDI to Malaysia’s GDP from 0.6 per cent in 2001 to 2.2 per cent in 2019.
Chart 2: Return On Investment (ROI) for FDI and DIA, Malaysia, 2010 – 2019
0.06
0.09
0.06
0.16
0.13
0.08
0.00
0.02
0.04
0.06
0.08
0.10
0.12
0.14
0.16
0.18
2010 2011 2012 2013 2014 2015 2016 2017 2018 2019
DIA FDI
RM
Source: Department of Statistics, Malaysia

13MALAYSIAN ECONOMIC STATISTICS REVIEW - VOL. 8/2020 | 13
Exhibit 1b: FDI Inflows and GDP Trend for Year 2001 – 2019
Numerous studies on relationship between FDI and GDP have been carried out in many countries across the world. Nevertheless, these studies did not arrive into the same conclusion. Some specific studies on Malaysia suggested that the relationship between FDI and GDP was significant. M.S. Shaari, et. Al (2012) examined the relationship of FDI on real GDP product in Malaysia from 1971 – 2010. The Vector Error Correlation Model (VECM) found that the FDI is considered as an important determinant to boost the economic growth in Malaysia. A study from W.M. Har et. al (2008) also shows there was a significant relationship between economic growth and FDI in Malaysia, whereby an increase in FDI rate by 1.0 per cent will lead to the increase of growth rate by 0.05 per cent. This study was done by using Ordinary least square (OLS) regressions. In contrary, M.S. Karimi & Z. Yusop (2009) found that FDI has indirect effect on economic growth in Malaysia using Toda-Yamamoto test for causality relationship and ARDL Bounds Test. Additionally, M. Kharroubi & O. Meddas (2018) also examined the impact of FDI on economic growth in Malaysia during the period of 1970 - 2017. The result of error estimated model shows there was no significance impact of FDI on economic growth in Malaysia and bi-directional test also suggested no granger causality between both variables. The study result from M.S. Karimi and M. Kharroubi were inconsistent as proven in many countries where foreign direct investments has a positive impact on GDP. Even though the FDI patterns has slightly changed year by year, it remains as the main contributor to GDP in most of the developing countries.
This article discussed further on the relationship between Malaysia’s FDI and economic performance for the last five decades using the latest available data. Does FDI inflows increase the GDP in Malaysia? FDI inflows and GDP at current prices from 1970 to 2019 are used to investigate the relationship between these two variables. The Simple Linear Regression will be used to examine the impact of FDI on GDP performance, while Pearson Correlation test to measure the correlation between both variables.
The result of Pearson Correlation Test which is basically to measure the correlation between FDI and GDP was 0.93 which indicated that there is a very strong correlation between FDI inflows and GDP in Malaysia. With a very strong correlation between FDI inflows and GDP, it is appropriate to see whether the relationship is significant and to examine the impact of FDI inflows towards GDP using simple linear regression. The result of regression equation using OLS as follows:
LogGDP = 1.567 + 0.882 (LogFDI)
The result suggested that with 1.0 per cent increase in FDI inflows will lead to an increase of 0.88 per cent in GDP at current prices. Thus, the results obtained are consistent with the mentioned study like M.S. Shaari, et. Al (2012) and W.M. Har et. al (2008), where FDI inflows will contribute to the GDP in Malaysia.
As FDI is widely known as a tool for economic growth that mostly benefit the recipient countries, Malaysia also gained from FDI spillovers by supporting the enhancement of domestic capital and employment besides offering transfer of technology that lead to a better economic performance. Malaysia with a dynamic, vibrant business environment and regard as one of the most competent economy in ASEAN region has attracted foreign companies to invest continuously in the country. Over the years, FDI inflows has increased steadily
Number of Employees
858,172 persons in 2018
Compensation of Employees
849,378 persons in 2015
RM48.4 billion in 2018
RM40.4 billion in 2015
FDI Performance in 2019
FDI inflows expended to RM31.7 billion due to higher investment from Japan precisely in
Health activities
Top investors:
What happened in 2016 ?
FDI inflows registered a highest value of RM47.0 billion contributed by higher investment in Financial activities, while Hong Kong was the
main investor in 2016
Japan RM10.4b
(32.9%)
Hong Kong RM8.6b (27.2%)
Netherlands RM3.9b (12.3%)
Chart 3: FDI inflows and GDP trend, Malaysia, 2001 – 2019 Exhibit 2: FDI Performance, Malaysia, 2019
FDI Performance in 2019
FDI inflows expended to RM31.7 billion due to higher investment from Japan precisely in
Health activities
Top investors:
What happened in 2016 ?
FDI inflows registered a highest value of RM47.0 billion contributed by higher investment in Financial activities, while Hong Kong was the
main investor in 2016
JapanRM10.4b (32.9%)
Hong KongRM8.6b (27.2%)
NetherlandsRM3.9b (12.3%)
352.
6
383.
2
418.
8
474.
0
543.
6
596.
8
665.
3
769.
9
712.
9
821.
4
911.
7
971.
3
1,01
8.6
1,10
6.4
1,17
6.9
1,24
9.7
1,37
2.3
1,44
7.5
1,51
0.7
2.1
12.29.4
17.615.4
22.2
29.5
23.9
5.1
29.2
37.3
28.5
38.235.6
39.4
47.0
40.4
30.7
31.7
0
5
10
15
20
25
30
35
40
45
50
0
200
400
600
800
1,000
1,200
1,400
1,600
GDP at current prices FDI Flows
GDP(RM billion)
FDI(RM billion)
Source: Department of Statistics, Malaysia

| MALAYSIAN ECONOMIC STATISTICS REVIEW - VOL. 8/202014
except for some years related to global economic crisis. In this article, it is found that the relationship between FDI and GDP in Malaysia is significantly strong positive relationship between 1970 to 2019 and suggests that with 1.0 per cent increase in FDI inflows will lead to an increase of 0.88 per cent in GDP at current prices. Moving forward, the study could be explored further by incorporating factors such as FDI by countries, industries, exchange rate and other related factors that contribute to GDP in Malaysia.
In the early 1970s, government offered various incentives to attract foreign investors and also formulates mitigation and response plans to address the current challenging scenario. Recently, the Prime Minister of Malaysia announced National Economic Recovery Plan (PENJANA) that outlined the various incentives will be given to attract FDIs in the pursuit to revive economic growth. It is aimed at attracting foreign companies to relocate their businesses to Malaysia by addressing the risk of reshoring. Among the incentives were tax incentive of zero per cent for 10 years for new investments in the manufacturing sector with capital investment of between RM300 million - RM500 million from 1st July to 31st December 2020. Malaysia’s 2021 Budget was tabled on 6th November 2020 by the Finance Minister also announced RM1.0 billion to encourage investments in technology, including R&D for the electronic and aerospace industries, among others. Besides, RM500 million were also given to support companies involved in advanced technology and innovation. The government will also set up the Project Acceleration and Coordination Unit (PACU) to expedite the implementation and coordination of approved investment project that will be led by MIDA. With these strategies and policies on the floor, it is hoped that Malaysian economy will be back on track and thriving soon.
Disclaimer
The views expressed are those of the authors and do not necessarily represent the views of the DOSM.
Acknowledgements
The authors would like to thank Balance of Payments Team especially to YBrs. Dr. Abd Latib Talib and Ms. Kanageswary Ramasamy for the effortless guidance, and Mr. Mohd Sawal Shakimon, Ms. Veronica S. Jamilat and Ms. Maizatil Elina Abdul Hamid for their hardship in assisting to complete the article.
References
Department of Statistics Malaysia, (2020). Balance of Payment Statistics Q1 2020
Department of Statistics Malaysia, (2020). International Investment Position Q1 2020
Department of Statistics Malaysia (DOSM). (2020). Labour Market Review, Malaysia First Quarter 2020.
Department of Statistics Malaysia (DOSM). (2019). Statistics on Foreign Affiliates in Malaysia (Inward FATS) 2018.
Malaysian Investment Development Authority (MIDA). Retrieved from https://www.mida.gov.my/home/invest-in-malaysia/posts/
M.A. Mohit (2009). Structural Changes of The Malaysian Economy And Its Spatial Incidence On Regional Economic Growth. Journal of the Malaysian Institute of Planners (2009) VII, 25 – 46.
M. Kharroubi & O. Meddas (2018). Impact of FDI on economic growth in Malaysia (1970-2017).
M.O., Faruk (2012). The Effect of FDI to Accelerate the Economic Growth of Bangladesh and Some Problems & Prospects of FDI. Asian Business Review, Volume 2, Numebr 2/2013 (Issue 4).
M.S., Karimi, & Zulkornain, Y. (2009). FDI and Economic Growth in Malaysia
M.S. Shaari, T.H. Hong, & S.N. Shukeri (2012). Foreign Direct Investment and Economic Growth: Evidence from Malaysia. International Business Research; Vol. 5, No. 10; 2012.
OECD Proceedings. Foreign Direct Investment and Recovery in Southeast Asia (1999).

15MALAYSIAN ECONOMIC STATISTICS REVIEW - VOL. 8/2020 | 15
P.G Beaumont (1990). Malaysia Economic Journal 21 & 22: The Role of Foreign Investment III Malaysia.
Pricewaterhouse Coopers: Doing business in Malaysia (2017).
Raman. R, (2008). Impact of Multinational Corporation in Malaysia.
Speech by Prime Minister of Malaysia, YAB Tan Sri Dato’ Haji Muhyiddin Mohd Yassin on “Pelan Jana Semula Ekonomi Negara, 5 June 2020”. Retrieved from https://www.pmo.gov.my/2020/06/teks-ucapan-pelan-jana-semula-ekonomi-negara-penjana/
W.M. Har, K.L. Teo & K.M. Yee, (2008). FDI and Economic Growth Relationship: An Empirical Study on Malaysia. International Business Research, vol.1, no.2.

| MALAYSIAN ECONOMIC STATISTICS REVIEW - VOL. 8/202016
BOX ARTICLE
IMPACT OF COVID-19 ON MALAYSIA’S ENVIRONMENTSiti Zakiah Muhamad Isa1; Ismail Abdul Rahman2; Nur Khairunniza Harun3;Nazira Abdullah4
1,2,3,4Agriculture and Environment Statistics Division, Department of Statistics, Malaysia
Introduction
In pursuing economic progress, a country cannot overlook the aspect of environmental sustainability. Thus, finding a balance between economic and environmental sustainability is vital dan should be the main agenda in formation of constructive policies. If the development activities are carried out while neglecting the environmental protection aspects, it could lead to various problems such as river pollution, soil erosion and others. The balance between the development and environment should be given extra attention from all parties. The Qur’an also stated that human beings to not causing any damage on earth as mentioned in Surah Ar-Rum verse 41 which translated as:
“Corruption has spread on land and sea as a result of what people’s hands have done, so that Allah may cause them to taste the consequences of some of their deeds and perhaps they might return to the Right Path.”
In general, the environmental scenario around the globe has been profoundly polluted before the world is being hit by the COVID-19 pandemic. This has forced world leaders to hold international cooperation which aims to address global environmental issues through multilateral agreements. Among the agreements engaged by Malaysia are the Paris Agreement and Kyoto Protocol to address global climate change issues, the Montreal Protocol to deal with the problem of ozone depletion, as well as the Basel Convention that focuses on controlling the cross-border movement of hazardous waste.
The occurrence of the COVID-19 pandemic has changed the world’s socio-economic landscape as a whole since it was first detected at the end of 2019. Malaysia was no exception to receive the impact of this pandemic when the country’s first case of COVID-19 was identified on 23rd January 2020 and continuously to increase over time. Consequently, Malaysia’s Prime Minister has announced Phase 1 of Movement Control Order (MCO) from 18th March to 2nd April 2020 and later extended to Conditional MCO (CMCO) and followed by the Recovery MCO (RMCO) which takes more than three months. To date, the government has reissued the implementation of CMCO in Wilayah Persekutuan Kuala Lumpur, Wilayah Persekutuan Putrajaya, Selangor and several other areas effective from 14th October until 6th December 2020 due to the increasing number of positive COVID-19 cases. As of 23rd December 2020, the number of positive COVID-19 cases in Malaysia was 98,737 cases while the cumulative number of deaths cases was 444 cases (0.45% of the total cases)1.
Looking at the bright side, the implementation of MCO not only to prevent the spread of this outbreak among the population in Malaysia but also indirectly led to the betterment of the environment.
River Water Quality
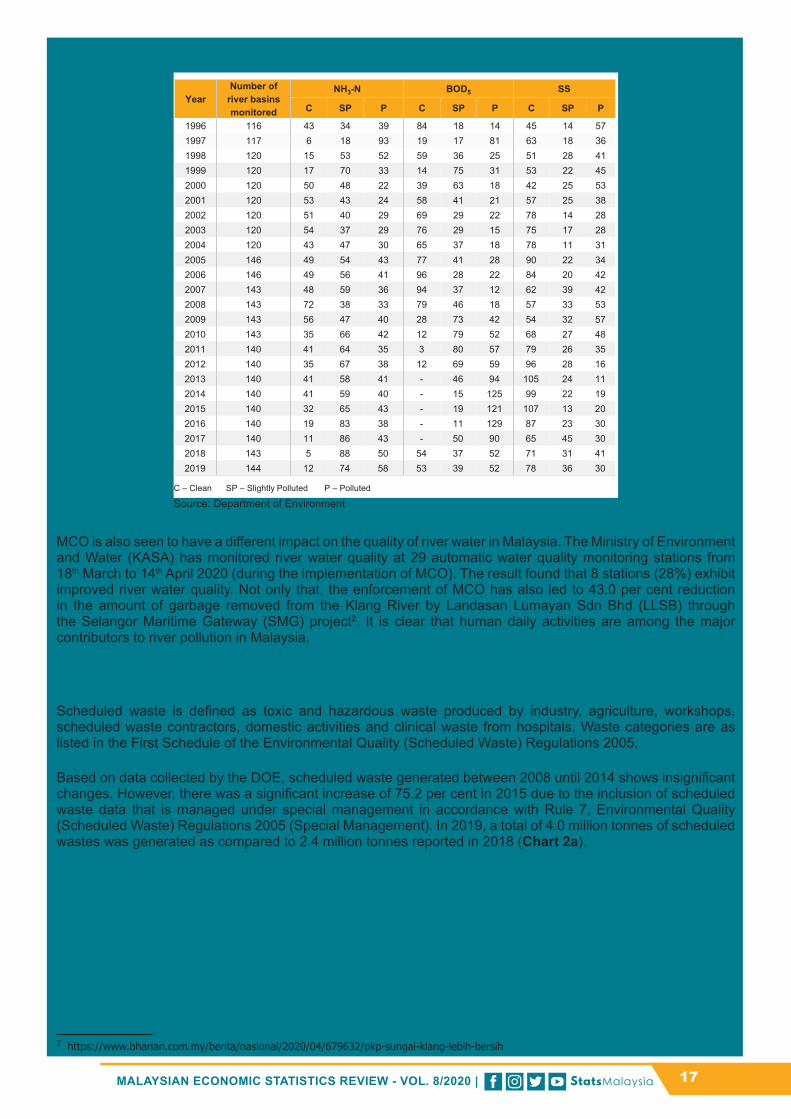
The status of river water quality in Malaysia is measured based on three main pollutants namely Ammoniacal Nitrogen (NH3-N), Biochemical Oxygen Demand (BOD5) and Suspended Solids (SS). In 2019, there were 144 river basins monitored by the Department of Environment (DOE). Out of these, the number of river basins categorized as clean based on NH3-N and SS increased from 5 to 12 and 71 to 78 respectively as compared to the previous year. In addition, the number of river basins categorized as polluted for NH3-N, BOD5 and SS were 58, 52 and 30 respectively in 2019.
1 https://kpkesihatan.com/2020/12/23/kenyataan-akhbar-kpk-23-disember-2020-situasi-semasa-jangkitan-penyakit-coronavirus-2019-COVID-19-di-malaysia/
17MALAYSIAN ECONOMIC STATISTICS REVIEW - VOL. 8/2020 | 17
Table 2a: Status of River Water Quality Based on Main Pollutants, Malaysia, 1996 - 2019
MCO is also seen to have a different impact on the quality of river water in Malaysia. The Ministry of Environment and Water (KASA) has monitored river water quality at 29 automatic water quality monitoring stations from 18th March to 14th April 2020 (during the implementation of MCO). The result found that 8 stations (28%) exhibit improved river water quality. Not only that, the enforcement of MCO has also led to 43.0 per cent reduction in the amount of garbage removed from the Klang River by Landasan Lumayan Sdn Bhd (LLSB) through the Selangor Maritime Gateway (SMG) project2. It is clear that human daily activities are among the major contributors to river pollution in Malaysia.
Scheduled Waste and dan Clinical Waste
Scheduled waste is defined as toxic and hazardous waste produced by industry, agriculture, workshops, scheduled waste contractors, domestic activities and clinical waste from hospitals. Waste categories are as listed in the First Schedule of the Environmental Quality (Scheduled Waste) Regulations 2005.
Based on data collected by the DOE, scheduled waste generated between 2008 until 2014 shows insignificant changes. However, there was a significant increase of 75.2 per cent in 2015 due to the inclusion of scheduled waste data that is managed under special management in accordance with Rule 7, Environmental Quality (Scheduled Waste) Regulations 2005 (Special Management). In 2019, a total of 4.0 million tonnes of scheduled wastes was generated as compared to 2.4 million tonnes reported in 2018 (Chart 2a).
2 https://www.bharian.com.my/berita/nasional/2020/04/679632/pkp-sungai-klang-lebih-bersih
YearNumber of
river basins monitored
NH3-N BOD5 SS
C SP P C SP P C SP P
1996 116 43 34 39 84 18 14 45 14 571997 117 6 18 93 19 17 81 63 18 361998 120 15 53 52 59 36 25 51 28 411999 120 17 70 33 14 75 31 53 22 452000 120 50 48 22 39 63 18 42 25 532001 120 53 43 24 58 41 21 57 25 382002 120 51 40 29 69 29 22 78 14 282003 120 54 37 29 76 29 15 75 17 282004 120 43 47 30 65 37 18 78 11 312005 146 49 54 43 77 41 28 90 22 342006 146 49 56 41 96 28 22 84 20 422007 143 48 59 36 94 37 12 62 39 422008 143 72 38 33 79 46 18 57 33 532009 143 56 47 40 28 73 42 54 32 572010 143 35 66 42 12 79 52 68 27 482011 140 41 64 35 3 80 57 79 26 352012 140 35 67 38 12 69 59 96 28 162013 140 41 58 41 - 46 94 105 24 112014 140 41 59 40 - 15 125 99 22 192015 140 32 65 43 - 19 121 107 13 202016 140 19 83 38 - 11 129 87 23 302017 140 11 86 43 - 50 90 65 45 302018 143 5 88 50 54 37 52 71 31 412019 144 12 74 58 53 39 52 78 36 30
C – Clean SP – Slightly Polluted P – Polluted
Table 1: Status of river water quality in based on main pollutants, Malaysia,1996 - 2019
Source: Department of Environment

| MALAYSIAN ECONOMIC STATISTICS REVIEW - VOL. 8/202018
Chart 2a: Quantity of Scheduled Wastes Generated by Industry, Malaysia, 2008 - 2019
Clinical waste is categorized as scheduled waste (code SW404) related to waste generated in the fields of medicine, nursing, dentistry, veterinary, pharmacy and related practices, treatment, teaching and information or emerging blood, toxic & etc., human/ animal tissues, blood or body fluids, medicines and pharmaceuticals, wound dressings, syringes or sharp objects or anything that may be dangerous to touch3.
The expansion of Malaysia’s population every year boosts the demand for health facilities and consequently raises the production of clinical waste. Overall, the quantity of clinical wastes generated showed an increasing trend from 2008 to 2019. The quantity of clinical wastes in 2019 was recorded at 33.8 thousand tonnes, an increase of 7.5 per cent as compared to 31.4 thousand tonnes in the previous year (Chart 2b).
According to a statement released by KASA in the first phase of MCO, the total of clinical waste disposal in Malaysia has increased to 27.0 per cent in March as compared to 17.0 per cent in February due to the spread of COVID-19. With the increase in COVID-19 cases to date, the quantity of clinical waste is expected to continue to rise. This is in line with a statement by the KASA Minister during a session in the Dewan Rakyat on 3rd November 2020 stated that clinical waste generated nationwide increased by 20.0 per cent during the COVID-19 pandemic period4.
Chart 2b: Clinical Wastes Generated, Malaysia, 2008 - 2019
Air Pollution Index
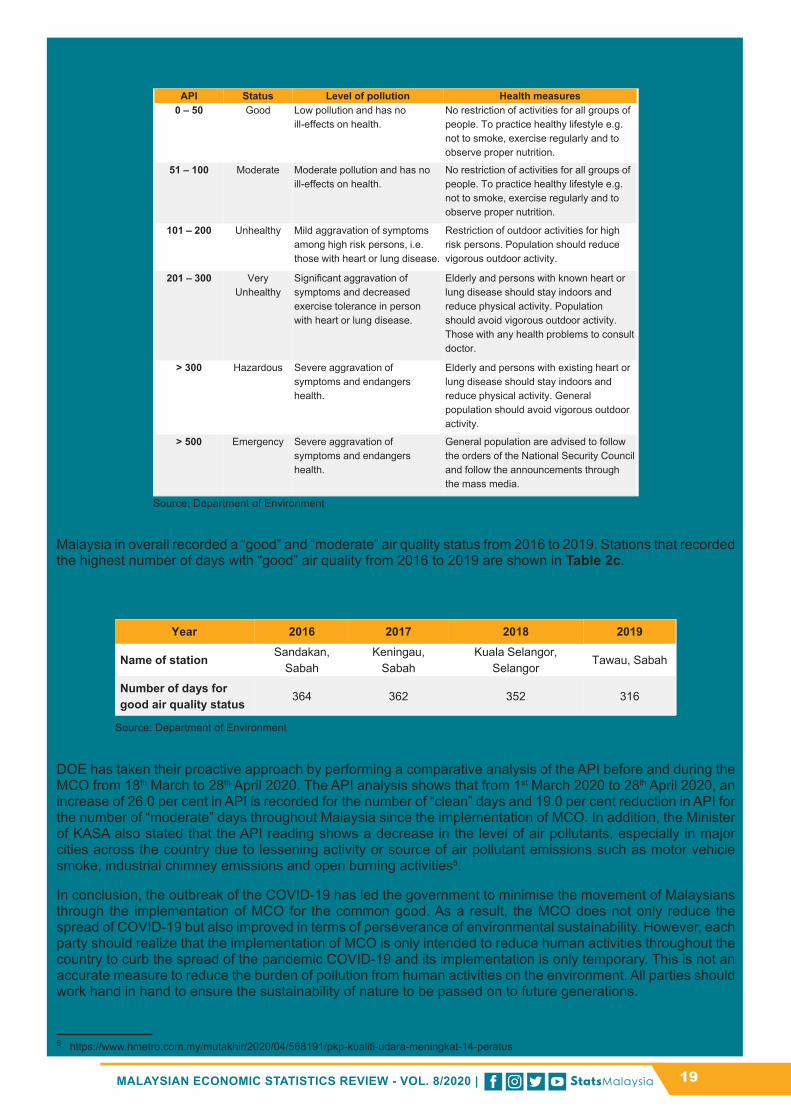
Restriction of industrial activities and human movement throughout the implementation of MCO also leads to a positive impact on air quality in Malaysia. Air quality is measured using an Air Pollution Index (API). Based on the guidelines issued by DOE, there are six levels of API in describing air quality in Malaysia, namely good, moderate, unhealthy, very unhealthy, hazardous and emergency. Table 2b describes the comparison of API values with the level of pollution and health measures.
3 Dasar dan Garis Panduan Pengurusan Sisa Klinikal di Hospital (1993)4 https://www.astroawani.com/berita-malaysia/sisa-klinikal-negara-meningkat-20-peratus-sejak-covid19-melanda-266542
1,304,8991,705,308
1,880,929
1,622,032
1,708,7081,387,861 1,665,347
2,918,4782,766,613
2,017,2812,355,085
4,013,189
0500,000
1,000,0001,500,0002,000,0002,500,0003,000,0003,500,0004,000,0004,500,000
2008 2009 2010 2011 2012 2013 2014 2015 2016 2017 2018 2019
Tonnes
Source: Department of Environment
Chart 1: Quantity of scheduled wastes generated by industry, Malaysia, 2008-2019
Source: Department of Environment
14,14016,559 16,781 17,796 18,055 19,069
21,97625,523 23,845
28,37531,398
33,757
05,000
10,00015,00020,00025,00030,00035,00040,000
2008 2009 2010 2011 2012 2013 2014 2015 2016 2017 2018 2019
Tonnes
Source: Department of Environment
Chart 2: Clinical wastes generated, Malaysia, 2008-2019
Source: Department of Environment
19MALAYSIAN ECONOMIC STATISTICS REVIEW - VOL. 8/2020 | 19
Table 2b: Comparison of API Values with Level of Pollution and Health Measures
Malaysia in overall recorded a “good” and “moderate” air quality status from 2016 to 2019. Stations that recorded the highest number of days with “good” air quality from 2016 to 2019 are shown in Table 2c.
Table 2c: Stations with the Number of Days for Good Air Quality Status, 2016 - 2019
DOE has taken their proactive approach by performing a comparative analysis of the API before and during the MCO from 18th March to 28th April 2020. The API analysis shows that from 1st March 2020 to 28th April 2020, an increase of 26.0 per cent in API is recorded for the number of “clean” days and 19.0 per cent reduction in API for the number of “moderate” days throughout Malaysia since the implementation of MCO. In addition, the Minister of KASA also stated that the API reading shows a decrease in the level of air pollutants, especially in major cities across the country due to lessening activity or source of air pollutant emissions such as motor vehicle smoke, industrial chimney emissions and open burning activities5.
In conclusion, the outbreak of the COVID-19 has led the government to minimise the movement of Malaysians through the implementation of MCO for the common good. As a result, the MCO does not only reduce the spread of COVID-19 but also improved in terms of perseverance of environmental sustainability. However, each party should realize that the implementation of MCO is only intended to reduce human activities throughout the country to curb the spread of the pandemic COVID-19 and its implementation is only temporary. This is not an accurate measure to reduce the burden of pollution from human activities on the environment. All parties should work hand in hand to ensure the sustainability of nature to be passed on to future generations.
5 https://www.hmetro.com.my/mutakhir/2020/04/568191/pkp-kualiti-udara-meningkat-14-peratus
API Status Level of pollution Health measures 0 – 50 Good Low pollution and has no
ill-effects on health. No restriction of activities for all groups of people. To practice healthy lifestyle e.g. not to smoke, exercise regularly and to observe proper nutrition.
51 – 100 Moderate Moderate pollution and has no ill-effects on health.
No restriction of activities for all groups of people. To practice healthy lifestyle e.g. not to smoke, exercise regularly and to observe proper nutrition.
101 – 200 Unhealthy Mild aggravation of symptoms among high risk persons, i.e. those with heart or lung disease.
Restriction of outdoor activities for high risk persons. Population should reduce vigorous outdoor activity.
201 – 300 Very Unhealthy
Significant aggravation of symptoms and decreased exercise tolerance in person with heart or lung disease.
Elderly and persons with known heart or lung disease should stay indoors and reduce physical activity. Population should avoid vigorous outdoor activity. Those with any health problems to consult doctor.
> 300 Hazardous Severe aggravation of symptoms and endangers health.
Elderly and persons with existing heart or lung disease should stay indoors and reduce physical activity. General population should avoid vigorous outdoor activity.
> 500 Emergency Severe aggravation of symptoms and endangers health.
General population are advised to follow the orders of the National Security Council and follow the announcements through the mass media.
Table 2: Comparison of API values with level of pollution and health measures
Source: Ministry of Health Malaysia Source: Department of Environment
Year 2016 2017 2018 2019
Name of station Sandakan,
Sabah Keningau,
Sabah Kuala Selangor,
Selangor Tawau, Sabah
Number of days for good air quality status
364 362 352 316
Table 3: Stations with the number of days for good air quality status, 2016-2019
Source: Department of Environment Source: Department of Environment

| MALAYSIAN ECONOMIC STATISTICS REVIEW - VOL. 8/202020
This page is deliberately left blank

SECTORAL PERFORMANCE

| MALAYSIAN ECONOMIC STATISTICS REVIEW - VOL. 8/202022
AGRICULTURE
Palm Oil StatisticsProduction of fresh fruit bunches in November 2020 was 7,513,250 tonnes, which is down 1.3 per cent year-on-year compared to November 2019 (7,610,484 tonnes). Month-on-month comparisons also show a decrease of 11.8 per cent (October 2020: 8,523,164 metric tonnes) as shown in Chart 4.
Chart 4: Production of Fresh Fruit Bunches, 2019 - 2020 (November)
Crude palm oil production in November 2020 was 1,491,551 tonnes, a decrease of 3.0 per cent from November of the previous year (1,538,053 tonnes) as depicted in Chart 5. The declining trend was also observed for the other three major oil palm products. Crude palm kernel oil showed the highest decline (-7.1%) compared to all major palm oil products. Palm kernel and palm kernel cake showed a decrease of 3.4 per cent and 4.7 per cent respectively for the same period. Month-on-month comparison also showed a decrease for crude palm oil (-13.5%), palm kernel (-16.3%), crude palm kernel oil (-20.1%) and palm kernel cake (-18.9%).
Chart 5: Production by Palm Oil Products, 2019 - 2020 (November)
Exports of palm oil in November 2020 amounted to 1,303,318 tonnes, a decrease of 7.3 per cent from November of the preceding year (1,405,638 tonnes). Month-on-month comparisons also showed a 22.2 per cent decline compared to October 2020 (1,674,304 metric tonnes). In November 2020, the highest exports were to China at 301,019 tonnes with a contribution of 23.1 per cent of total palm oil exports (Table 2). The second highest export was to India at 203,972 metric tonnes. However, this number decreased by 51.9 per cent compared to October 2020 where India is the main importer of palm oil from Malaysia with a contribution of 25.3 per cent. Other countries that also contributed to palm oil exports were the Netherlands (6.1%), Pakistan (5.1%) and the Philippines (3.8%).
Source: Malaysian Palm Oil Board
Chart 1: Production of fresh fruit bunches, 2019 - 2020 (November)
7,513.3
0.0
2,000.0
4,000.0
6,000.0
8,000.0
10,000.0
12,000.0
Jan Feb Mar Apr May June July Aug Sep Oct Nov Dec Jan Feb Mar Apr May June July Aug Sep Oct Nov
2019 2020
Tonnes ('000)
Chart 2: Production by palm oil products, 2019 - 2020 (November)
1,492
350
172 195
0.0
200.0
400.0
600.0
800.0
1,000.0
1,200.0
1,400.0
1,600.0
1,800.0
2,000.0
Jan Feb Mar Apr May June July Aug Sep Oct Nov Dec Jan Feb Mar Apr May June July Aug Sep Oct Nov
2019 2020
Tonnes ('000)
Crude palm oil Palm kernel Crude palm kernel oil Palm kernel cake
Source: Malaysian Palm Oil Board

MALAYSIAN ECONOMIC STATISTICS REVIEW - VOL. 8/2020 | 23
AGRICULTURE
Table 2: Exports of the Top 5 Countries of Palm Oil, January - November 2020
Exports to the European Union (EU) in November 2020 amounted to 180,886 tonnes, an increase of 50.8 per cent compared to October 2020 (119,919 tonnes). Among the EU countries, exports to Spain recorded the highest increase to 36,636 tonnes in November 2020 compared to October 2020 (108 tonnes). Year-on-year comparisons also showed an increase of 1.8 per cent in exports to the EU compared to November of the previous year (177,696 tonnes).
Imports of palm oil increased 50.9 per cent in November 2020 (112,663 tonnes) as compared with the same month from the previous year (Chart 6). Similarly, palm kernel oil showed an increase of 34.1 per cent to 36,835 tonnes for the same period. On the contrary, imports for oil palm kernel showed a decrease of 29.4 per cent to 4,442 tonnes in November 2020 compared to the previous month (6,288 tonnes).
Chart 6: Imports by Palm Oil Products, 2019 - 2020 (November)
The average production of fresh fruit bunches in November 2020 was 1.32 tonnes/ha, compared to 1.49 tonnes/ha in October 2020. By region, the average production in Peninsular Malaysia decreased to 1.36 tonnes/ha as compared to 1.54 tonnes/ha in October 2020. A similar trend was recorded for Sabah/Sarawak, which also showed a decrease to 1.29 tonnes/ha compared to the previous month (October: 1.45 tonnes/ha).
Chart 3: Exports of the top 5 countries of palm oil, January - November 2020
Countries 2020
Jan Feb Mar Apr May June July Aug Sep Oct Nov
China 176,830 156,805 148,017 199,452 225,914 351,463 288,648 295,013 249,897 189,967 301,019
India 46,876 21,130 8,804 17,333 54,961 242,045 455,299 329,827 374,553 423,718 203,972
Netherlands 110,873 77,843 114,850 133,834 70,842 73,660 88,482 76,622 89,416 78,945 79,216
Pakistan 170,802 46,910 67,157 61,970 97,074 131,546 115,899 59,737 59,160 78,651 66,974
Philippines 62,160 68,040 54,778 48,900 59,812 55,005 52,964 45,122 67,987 73,076 48,970
Source: Malaysian Palm Oil Board
Chart 4: Imports by palm oil products, 2019 - 2020 (November)
112.7
36.8
4.4 0.0
20.0
40.0
60.0
80.0
100.0
120.0
140.0
Jan Feb Mar Apr May June July Aug Sep Oct Nov Dec Jan Feb Mar Apr May June July Aug Sep Oct Nov
2019 2020
Tonnes ('000)
Palm oil Palm kernel oil Palm kernel
Source: Malaysian Palm Oil Board
| MALAYSIAN ECONOMIC STATISTICS REVIEW - VOL. 8/202024
AGRICULTURE
Performance of RubberThe rubber industry still serves as a strategic commodity crop, especially to support the rubber-based manufacturing industry and as the main income earners to smallholders.
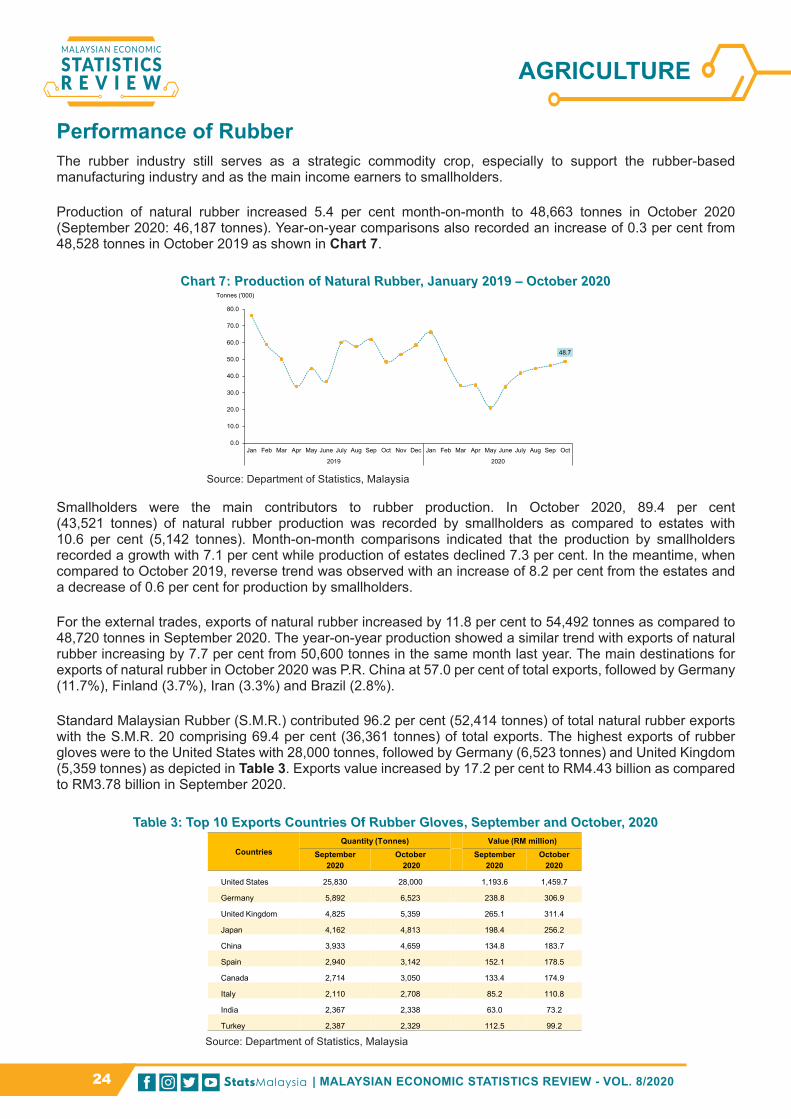
Production of natural rubber increased 5.4 per cent month-on-month to 48,663 tonnes in October 2020 (September 2020: 46,187 tonnes). Year-on-year comparisons also recorded an increase of 0.3 per cent from 48,528 tonnes in October 2019 as shown in Chart 7.
Chart 7: Production of Natural Rubber, January 2019 – October 2020
Smallholders were the main contributors to rubber production. In October 2020, 89.4 per cent (43,521 tonnes) of natural rubber production was recorded by smallholders as compared to estates with 10.6 per cent (5,142 tonnes). Month-on-month comparisons indicated that the production by smallholders recorded a growth with 7.1 per cent while production of estates declined 7.3 per cent. In the meantime, when compared to October 2019, reverse trend was observed with an increase of 8.2 per cent from the estates and a decrease of 0.6 per cent for production by smallholders.
For the external trades, exports of natural rubber increased by 11.8 per cent to 54,492 tonnes as compared to 48,720 tonnes in September 2020. The year-on-year production showed a similar trend with exports of natural rubber increasing by 7.7 per cent from 50,600 tonnes in the same month last year. The main destinations for exports of natural rubber in October 2020 was P.R. China at 57.0 per cent of total exports, followed by Germany (11.7%), Finland (3.7%), Iran (3.3%) and Brazil (2.8%).
Standard Malaysian Rubber (S.M.R.) contributed 96.2 per cent (52,414 tonnes) of total natural rubber exports with the S.M.R. 20 comprising 69.4 per cent (36,361 tonnes) of total exports. The highest exports of rubber gloves were to the United States with 28,000 tonnes, followed by Germany (6,523 tonnes) and United Kingdom (5,359 tonnes) as depicted in Table 3. Exports value increased by 17.2 per cent to RM4.43 billion as compared to RM3.78 billion in September 2020.
Table 3: Top 10 Exports Countries Of Rubber Gloves, September and October, 2020
Chart 1: Production of Natural Rubber, January 2019 – October 2020
48.7
0.0
10.0
20.0
30.0
40.0
50.0
60.0
70.0
80.0
Jan Feb Mar Apr May June July Aug Sep Oct Nov Dec Jan Feb Mar Apr May June July Aug Sep Oct
2019 2020
Tonnes ('000)
Source: Department of Statistics, Malaysia
Table 1 : Top 10 Exports Countries of Rubber Gloves, September and October, 2020
CountriesQuantity (Tonnes) Value (RM million)
September 2020
October2020
September 2020
October 2020
United States 25,830 28,000 1,193.6 1,459.7
Germany 5,892 6,523 238.8 306.9
United Kingdom 4,825 5,359 265.1 311.4
Japan 4,162 4,813 198.4 256.2
China 3,933 4,659 134.8 183.7
Spain 2,940 3,142 152.1 178.5
Canada 2,714 3,050 133.4 174.9
Italy 2,110 2,708 85.2 110.8
India 2,367 2,338 63.0 73.2
Turkey 2,387 2,329 112.5 99.2
Source: Department of Statistics, Malaysia

MALAYSIAN ECONOMIC STATISTICS REVIEW - VOL. 8/2020 | 25
AGRICULTURE
Imports of natural rubber increased 1.1 per cent to 120,876 tonnes in October 2020 (September 2020: 119,539 tonnes). Three main types of imported natural rubber were Latex Concentrated (30,931 tonnes), Standard Rubber (23,038 tonnes) and Ribbed Smoked Sheets (1,043 tonnes). Natural rubber was mainly imported from Thailand which amounted 42,557 tonnes in October 2020.
The stocks of natural rubber were higher in October 2020 with 256,724 tonnes as compared to 255,089 tonnes in September 2020 with an increase of 0.6 per cent (Chart 8).
Chart 8: Stocks of Natural Rubber, January 2019 – October 2020
Domestic consumption of natural rubber recorded 48,518 tonnes, a growth of 15.5 per cent year-on-year (October 2019: 41,989 tonnes). More than 70 per cent of the natural rubber was used by the rubber gloves industry at 76.1 per cent (36,901 tonnes), followed by rubber thread industry at 8.0 per cent (3,889 tonnes) and 7.4 per cent (3,583 tonnes) in the tyres and tubes industry.
The average price of SMR 20 was the highest price in October 2020 with an increase of 621.76 cent per kilogram compared to 558.50 cent per kilogram in September 2020. Similar trend was also observed for the average price of Latex Concentrate which increased to 576.14 cent per kilogram in October 2020 for the same period (September 2020: 484.57 cent per kilogram). For year-on-year comparison, both prices showed similar trends with an increase of double digits 35.4 per cent for latex concentrated and 15.9 per cent for S.M.R 20 (Chart 9).
Chart 9: Monthly Average Prices for Natural Rubber, January 2019 – October 2020
Based on the October 2020 report by Association of Natural Rubber Producing Countries (ANRPC), Thailand recorded the production of 441.7 thousand tonnes, Indonesia; 242.2 thousand tonnes, Vietnam; 120.0 thousand tonnes, P.R. China; 121.0 thousand tonnes, India; 67.0 thousand tonnes, Cambodia; 36.0 thousand tonnes, Philippines; 11.8 thousand tonnes and Sri Lanka; 6.0 thousand tonnes.
The continuous attention given by the government in continuing with the Rubber Production Incentive (IPG) is a measure to help the smallholders in the commodity sector, specifically in the price factor which was seen increasing since mid-2020.
Chart 2: Stocks of Natural Rubber, January 2019 – October 2020
256.7
0.0
100.0
200.0
300.0
400.0
Jan Feb Mar Apr May June July Aug Sep Oct Nov Dec Jan Feb Mar Apr May June July Aug Sep Oct
2019 2020
Tonnes ('000)
Chart 3: Monthly Average Prices for Natural Rubber, January 2019 – October 2020
622 604
576
477
250
300
350
400
450
500
550
600
650
Jan Feb Mar Apr May June July Aug Sep Oct Nov Dec Jan Feb Mar Apr May June July Aug Sep Oct
2019 2020
Cent/ Kg
Field Latex Price (Cent/ Kg) Scrap Price (Cent/ Kg) Latex Concentrate Price (Cent/ Kg) SMR 20 Price (Cent/ Kg)
Source: Department of Statistics, Malaysia
Source: Malaysian Rubber Board

| MALAYSIAN ECONOMIC STATISTICS REVIEW - VOL. 8/202026
INDUSTRY AND MANUFACTURING
Industrial Production Index (IPI)In October 2020, Selangor, Sabah, W.P. Kuala Lumpur, W.P. Putrajaya and W.P. Labuan have been placed under a Conditional Movement Control Order (CMCO). The restrictions had affected the Manufacturing sector performance resulting in slower output generation. In addition, softer demand from Malaysia’s major trading partners also effects the entire supply chain and demand for manufactured products.
The IPI in October 2020 recorded a decline of 0.5 per cent as compared to the same month of the previous year (Chart 10). The deterioration of IPI in October 2020 was influenced by the sharp decrease of 10.6 per cent in Mining index. Meanwhile, the Manufacturing and Electricity sectors recorded a growth of 2.4 per cent and 1.0 per cent respectively.
Chart 10: Industrial Production Index (Year-on-Year), October 2019 – October 2020
The Manufacturing sector which was the largest component in the IPI, posted 2.4 per cent driven by both domestic and export-oriented output. Domestic-oriented output continues to record positive growth of 0.8 per cent (September 2020: 1.0%) while export-oriented output increased 3.1 per cent (September 2020: 5.7%). The largest contributors to domestic-oriented output were food processing which grew 4.8 per cent (September 2020: 6.3%), followed by motor vehicles & transport equipment, 4.2 per cent (September 2020: 5.8%) and basic metals, 3.9 per cent (September 2020: 4.1%). Meanwhile, the performance of export-oriented output was dominated by the significant increase specifically in rubber products, 67.9 per cent (September 2020: 66.0%), followed by electronic components & boards, communication equipment & consumer electronics, 10.2 per cent (September 2020: 11.2%) and computers & peripheral equipment, 5.2 per cent (September 2020: 14.2%).
IPI for the selected major trading partners of Malaysia showed a downward trend in October 2020 as such Singapore, -0.9 per cent (September 2020: 25.6%) and South Korea, -1.2 per cent (September 2020: 5.5%). Meanwhile, Japan dropped by 3.2 per cent (September 2020: -9.0%) and United States of America (USA) declined 5.3 per cent (September 2020: -6.7%). Meanwhile, IPI for China remained a growth of 6.9 per cent for two consecutive months.
The Mining sector output dropped 10.6 per cent in October 2020 as compared to the same period of the previous year. The deterioration was due to the decrease in Crude Oil & Condensate (-12.6%) and Natural Gas (-9.0%).
0.1 2.1
1.3 0.6
6.2
-4.9
-32.0
-21.6
-0.4 1.2 0.2 1.0 -0.5
-35.0
-30.0
-25.0
-20.0
-15.0
-10.0
-5.0
0.0
5.0
10.0
Oct. Nov. Dec. Jan. Feb. Mar. Apr. May Jun. Jul. Aug. Sep. Oct.
2019 2020
Per cent (%)
Source: Department of Statistics, Malaysia

MALAYSIAN ECONOMIC STATISTICS REVIEW - VOL. 8/2020 | 27
INDUSTRY AND MANUFACTURING
Manufacturing In October 2020, Malaysia’s Manufacturing sales registered RM122.0 billion, rose 2.2 per cent (September 2020: 3.7%) as compared to the previous year (Chart 11). The rise in sales value was driven by the Food, beverages & tobacco products (13.8%); Transport equipment & other manufactures products (9.3%) and Electrical & electronics products (3.8%).
In addition, Malaysia’s exports grew marginally by 0.2 per cent year-on-year (September 2020: 13.6%) to RM91.1 billion in October 2020. The expansion was supported mainly by higher exports to the USA, China, India and the United Kingdom. Exports of manufactured goods in October 2020 which contributed to 87.8 per cent of total exports grew by 2.5 per cent to RM79.9 billion. The growth was mainly due to higher exports of rubber products, electrical and electronic (E&E) products, other manufactures especially solid-state storage devices (SSD), iron and steel products as well as wood products.
Chart 11: Sales Value of Manufacturing Sector, October 2019 - October 2020
Based on Monthly Manufacturing Survey, total employees engaged in October 2020 were 2.19 million persons, a decrease of 2.3 per cent as compared to 2.24 million persons in October 2019. The decline was mainly attributed by the Textile, wearing apparel, leather & footwear (-14.2%); Wood products, furniture, paper products, printing (-5.5%) and Transport Equipment & Other Manufactures (-5.4%). Salaries & wages paid amounted to RM7.2 billion, dropped by 1.6 per cent or RM116.1 million in October 2020 as against the same month of the preceding year. The sales value per employee rose by 4.7 per cent to record RM55,747. Meanwhile, the average salaries & wages per employee was RM3,289 (October 2019: RM3,264).
The country’s Manufacturing activity in the fourth quarter of 2020 was seen hazy as fears of the current wave of COVID-19 transmissions that continue to affect the factory operations and foresee subsequent delay in investment decisions.
118.0 111.2 110.1
75.8 89.5
116.8 119.2 118.4 121.2 122.0
2.4
7.6
-3.0
-33.0
-20.4
4.2 1.9 1.6 3.7 2.2
-40.0-35.0-30.0-25.0-20.0-15.0-10.0-5.00.05.010.0
-
20.0
40.0
60.0
80.0
100.0
120.0
140.0
Oct Nov Dec Jan Feb Mar Apr May June Jul Aug Sept Oct
2019 2020
RM billion Year-on-Year (%)
Sales value Year-on-Year
Source: Department of Statistics, Malaysia

| MALAYSIAN ECONOMIC STATISTICS REVIEW - VOL. 8/202028
SERVICES
The daily escalation of COVID-19 has resulted in CMCO being reimposed in Selangor, W.P. Kuala Lumpur and W.P. Putrajaya starting 14 October 2020. Collectively, the three states contributed about 40 per cent of the country’s economy in 2019. Even though businesses, malls and factories were still allowed to operate with stringent standard operating procedures in these three areas, there was a rising concerns on the impact of continuous uncertainties on business sentiment, labour market recovery and consumer spending. Wholesale & Retail Trade sector was among the affected subsectors as the COVID-19 cases in the country entered the third wave. According to the findings of Wholesale & Retail Trade Census, 66.1 per cent of the total sales value of Wholesale & Retail Trade in 2018 were attributed by the three states.
Performance of Sales ValueSales value of Wholesale & Retail Trade dropped 0.8 per cent year-on-year to record RM110.5 billion in October 2020. The sector went back to a negative growth of sales value, largely due to Retail Trade which contracted 1.5 per cent or RM0.7 billion to RM44.2 billion as compared to October 2019. Similarly, Wholesale Trade also recorded a year-on-year decrease of 0.9 per cent (RM0.5 billion) to register RM53.4 billion. On the other hand, Motor Vehicles continued a positive growth of 2.2 per cent or RM0.3 billion to achieve RM12.9 billion. In the meantime, month-on-month comparison saw sales of Wholesale & Retail Trade fell 0.5 per cent in October 2020 as compared to September 2020, due to the negative growth in Motor Vehicles and Retail Trade subsectors (Exhibit 2).
Exhibit 2: Performance of Wholesale & Retail Trade Sector, October 2020
Performance of Motor VehiclesFor Motor Vehicles subsector, Sales of Motor Vehicles spearheaded the growth with 6.4 per cent year-on-year to register RM7.2 billion. This was followed by Sale, Maintenance & Repair of Motorcycles which rose 4.7 per cent to record a sales value of RM1.1 billion. However, Maintenance & Repair of Motor Vehicles and Sales of Motor Vehicles Parts & Accessories contracted 4.3 per cent and 4.5 per cent respectively as compared to corresponding month of previous year (Chart 12). As the CMCO took effect, most people returned to the norm of working from home, while schools and higher learning institutions were closed. In the meantime, the CMCO also restricted inter-districts and inter-states travels except for work and emergency purposes. This led to a decline in the number of trips made, and subsequently somewhat affected the demand for maintenance of vehicles, spare parts and accessories.
% Changes
Seasonally Adjust-ed (SA)
RM billion Oct. 2020
MoM (%)
YoY (%) Sales value
Original Oct. 2020
MoM (%)
YoY (%) Volume Index
(2015=100)
130.3 133.5 135.6 105.4
110.5 53.4 44.2 12.9
Seasonally Adjusted
(SA)
MoM (SA)
129.5 129.6 138.0 106.6
-0.5
-0.8
1.7
-0.9
-1.4
-1.5
-5.8
2.2
-3.6
-0.2
-1.4
1.4
-0.8
-0.4
-2.8
-6.0
1.7
-1.4 -8.7 2.2
Wholesale & Retail Trade
Wholesale Trade
Retail Trade
Motor & Vehicle
Exhibit 1: Performance of Wholesale & Retail Trade Sector, October 2020
Source: Department of Statistics, Malaysia

MALAYSIAN ECONOMIC STATISTICS REVIEW - VOL. 8/2020 | 29
SERVICES
Chart 12: Performance of Motor Vehicles Sub-sector, October 2020
Performance of Retail TradeSales value of Retail Trade dropped 1.5 per cent due to the fall of sales for non-essential products namely Retail Sale in Specialised Stores (-7.4%), Retail Sale of Household Goods (-4.0%), Retail Sale of Cultural & Recreation Goods (-4.6%) and Retail Sale of Information & Communication Equipment (-1.9%). On the contrary, sales of essential goods recorded a positive growth where Retail Sale in Non-specialised Stores grew 4.4 per cent to RM15.9 billion as against the same month last year, followed by Retail Sale of Food, Beverages & Tobacco which rose 6.1 per cent to RM2.7 billion. Retail Trade Not in Stores, Stalls or Markets also expanded 8.3 per cent to RM0.4 billion followed by Retail Sale via Stalls & Markets which increased 7.0 per cent to RM0.1 billion (Chart 13).
Chart 13: Performance of Retail Trade Sub-sector, October 2020
Performance of Wholesale TradeIn October 2020, sales value of Wholesale Trade went down by 0.9 per cent year-on-year due to Other Specialised Wholesale and Wholesale on a Fee or Contract Basis which declined by 6.1 per cent and 3.6 per cent respectively. Nevertheless, Wholesale of Food, Beverages & Tobacco grew 3.8 per cent to register sales value of RM10.1 billion. This was followed by Wholesale of Household Goods which increased 3.1 per cent to RM11.0 billion. Similarly, Wholesale of Machinery, Equipment & Supplies also expanded 1.7 per cent year-on-year to generate sales of RM4.6 billion (Chart 14).
Chart 1: Performance of Motor Vehicles Sub-sector
6.4%
-4.3%
-4.5%
4.7%
-8.0 -6.0 -4.0 -2.0 0.0 2.0 4.0 6.0 8.0
Sales of Motor Vehicles
Maintenance & Repairof Motor Vehicles
Sale of Motor VehiclesParts & Accessories
Sale, Maintenance & Repairof Motorcycles
Source: Department of Statistics, Malaysia
Chart 2: Performance of Retail Trade Sub-sector
4.4%
6.1%
-9.6%
-1.9%
-4.0%
-4.6%
-7.4%
7.0%
8.3%
-12.0 -10.0 -8.0 -6.0 -4.0 -2.0 0.0 2.0 4.0 6.0 8.0 10.0
Retail Sale in Non-specialised Stores
Retail Sale of Food, Beverages &Tobacco in Specialised Stores
Retail Sale of Automotive Fuelin Specialised Stores
Retail Sale of Information & CommunicationEquipment in Specialised Stores
Retail Sale of Other HouseholdEquipment in Specialised Stores
Retail Sale of Cultural & RecreationGoods in Specialised Stores
Retail Sale of Other Goods inSpecialised Stores
Retail Sale Via Stalls & Markets
Retail Trade Not in Stores,Stalls or Markets
Source: Department of Statistics, Malaysia

| MALAYSIAN ECONOMIC STATISTICS REVIEW - VOL. 8/202030
SERVICES
Chart 14: Performance of Wholesale Trade Sub-sector, October 2020
Performance of Volume IndexIn terms of volume index, Wholesale & Retail Trade eased 1.4 per cent year-on-year as Retail Trade decreased 2.8 per cent while Wholesale Trade contracted 0.8 per cent. In contrast, Motor Vehicles recorded a positive growth of 1.7 per cent. As for seasonally adjusted volume index, it edged down 1.4 per cent month-on-month (Chart 15).
Chart 15: Performance of Volume Index of Wholesale & Retail Trade Sector, October 2020
Prospect for November 2020Looking ahead, November 2020 has seen the CMCO being extended in all states except Kelantan, Pahang and Perlis. Further increase in the COVID-19 daily new cases has caused the Enhanced MCO being enforced in selected high-risks areas to protect the health and lives of the people. As people continue to restrain movements and exercised the precautionary steps of working from home and limiting social, leisure and recreational activities outside the safety of home, it is expected that the performance of Wholesale & Retail Trade in November 2020 will continue to be sluggish. Apart from that, lesser trips except for business purposes will also cause slower performance of Motor Vehicles subsector. Thus, it is foreseen that the overall performance of Wholesale & Retail Trade for November 2020 will be affected. At this end, it will gradually climb up again in December as CMCO was being lifted in most areas, replaced by RMCO to encourage business recovery in the less risky areas of the country.
Chart 3: Performance of Wholesale Trade Sub-sector
-3.6%
0.8%
3.8%
3.1%
1.7%
-6.1%
6.3%
-8.0 -6.0 -4.0 -2.0 0.0 2.0 4.0 6.0 8.0
Wholesale on a Fee or Contract Basis
Wholesale of Agricultural Raw Materials & Live Animals
Wholesale of Food, Beverages & Tobacco
Wholesale of Household Goods
Wholesale of Machinery, Equipment & Supplies
Other Specialised Wholesale
Non-specialised Wholesale Trade
Source: Department of Statistics, Malaysia
Chart 4: Performance of Volume Index of Wholesale & Retail Trade Sector
-1.4
-50.0
-40.0
-30.0
-20.0
-10.0
0.0
10.0
20.0
Jan Feb Mar Apr May June July Aug Sep Oct Nov Dec Jan Feb Mar Apr May June July Aug Sep Oct
2019 2020
Per cent (%)
Source: Department of Statistics, Malaysia

MALAYSIAN ECONOMIC STATISTICS REVIEW - VOL. 8/2020 | 31
EXTERNAL SECTOR
Merchandise TradeMalaysia was under the Recovery Movement Control Order (RMCO) since 10 June 2020, resulting in better Malaysia’s trade performance in the third quarter 2020. However, Malaysia was hit by the third wave of COVID-19 towards the end of September 2020 and was the largest, resulting in the implementation of Conditional Movement Control Order (CMCO) in the affected states. At the same time, Malaysia and the world is learning to live with the pandemic and new norms. Consequently, the uncertainty impacted the Malaysia’s external sector. After recording a significant increase in September 2020 (+13.6%), exports grew marginally 0.2 per cent year-on-year in October, while imports maintained negative single-digit growth with a larger magnitude of 6.0 per cent compared with negative 3.6 per cent in September 2020. Malaysia’s merchandise trade amounted to RM160.0 billion this month, down 2.5 per cent from October 2019. The larger fall in imports contributed to the double-digit growth (+25.9%) of trade balance to RM22.1 billion.
The increase in exports was contributed from the shipments of goods to the United States of America (+RM2.3 billion), China (+RM664.6 million), India (+RM471.3 million), the European Union (+RM348.0 million) and the United Kingdom (+RM316.5 million), while exports to Taiwan and Hong Kong declined by RM1.3 billion and RM1.1 billion, respectively. Meanwhile, the decline in imports was on account of lower imports from Singapore (-RM2.9 billion), Australia (-RM1.4 billion), Thailand (-RM431.4 million), Saudi Arabia (-RM427.6 million) and Indonesia (-RM392.4 million). On the other hand, imports from China and Taiwan increased by RM815.0 million and RM506.7 million, respectively. China, Singapore, the United States of America and the European Union remained as Malaysia’s major trading partners in October 2020 with a total contribution of 49.7 per cent (October 2019: 48.0%).
Malaysia’s exports of goods in October 2020 increased slightly by 0.2 per cent year-on-year to RM91.1 billion, the second highest monthly export value registered in 2020. The positive growth was supported by the increase in exports of Rubber gloves (+ RM2.9 billion, 183.8%); Palm oil and palm oil-based products (+RM1.5 billion, +27.5%) on higher crude palm oil prices; as well as Electrical and electronic products (+RM1.1 billion, +3.0%). Meanwhile, exports of Liquefied natural gas and Refined petroleum products continued to decline by RM2.1 billion (-57.7%) and RM1.1 billion (-21.7%) respectively (Chart 16). External demand for rubber gloves to remain favourable due to the continuous global spread of COVID-19, making it one of Malaysia’s top three export products in October 2020. Electrical and electronic products; Palm oil and palm oil-based products; and Rubber gloves contributed 55.1 per cent to Malaysia’s total exports in October 2020 compared with 49.1 per cent in the same month last year.
Chart 16: Malaysia’s Exports by Top 10 Major and Selected Products, October 2020 (Percentage Change)
Chart 1: Malaysia’s Exports by Top 10 Major and Selected Products, October 2020 (Percentage Change)
3.0
27.5
183.8
-21.7
-3.7
2.3
-57.7
-44.8
159.6
9.2
-100.0 -50.0 0.0 50.0 100.0 150.0 200.0
Electrical and electronic products
Palm oil and palm oil-based products
Rubber gloves
Refined petroleum products
Professional, scientific and controlling instruments and apparatus
Timber and timber-based products
Liquefied natural gas
Crude petroleum
Iron and steel bars, rods
Articles of apparel and clothing accessories
Source: Department of Statistics, Malaysia

| MALAYSIAN ECONOMIC STATISTICS REVIEW - VOL. 8/202032
EXTERNAL SECTOR
Imports recorded a larger drop of 6.0 per cent (-RM4.4 billion) year-on-year in October 2020 compared with a negative 3.6 per cent (-RM2.5 billion) in September 2020. The contraction in imports was attributed to the decline in most major import products, especially Refined petroleum products (-RM833.7 million, -13.9%); Flat rolled products of iron or steel (-RM420.1 million, -28.3%); Crude petroleum (-RM334.9 million, -23.6%); Machinery & equipment specialized for particular industries & parts (-RM294.8 million, -24.1%); and Aircraft, associated equipment and parts (-RM291.6, -26.7%), while imports of Electrical and electronic products continued to increase RM407.9 million (+ 1.9%) as shown in Chart 17. The main products of Malaysia’s imports in October 2020 were Electrical and electronic products; Refined petroleum products; Measuring, checking, analysing and controlling instruments and apparatus; and Crude petroleum with a total contribution of 43.1 per cent (October 2019: 41.6%).
Chart 17: Malaysia’s Imports by Top 10 Major and Selected Products, October 2020 (Percentage Change)
Most of Malaysia’s major trading partners continued to record downward momentum in the current month for both exports and imports except China, the United States of America, Taiwan and Hong Kong (Chart 18).
Chart 18: Malaysia’s Top 10 Trading Partners, October 2020 (Percentage Change)
Chart 2: Malaysia’s Imports by Top 10 Major and Selected Products, October 2020 (Percentage Change)
1.9
-13.9
0.8
-23.6
5.1
-28.3
-24.1
4.5
-26.7
-17.0
-40.0 -35.0 -30.0 -25.0 -20.0 -15.0 -10.0 -5.0 0.0 5.0 10.0
Electrical and electronic product
Refined petroleum products
Measuring, checking, analysing and controlling instruments andapparatus
Crude petroleum
Parts & accessories of tractors, motor cars and other road motor vehicles
Flat rolled products of iron or steel
Machinery & equipment specialized for particular industries & parts
Gold, non monetary
Aircraft, associated equipment and parts
Copper
Source: Department of Statistics, Malaysia
4.7
-9.3
0.0
-11.7
-13.3
-1.0
-5.8
0.6
-14.3
-26.9
11.4
-8.6
-7.0
-9.0
-0.2
11.2
-3.6
-1.1
-6.7
-3.3
-30.0 -25.0 -20.0 -15.0 -10.0 -5.0 0.0 5.0 10.0 15.0 20.0
China
Singapore
United States of America
European Union
Japan
Taiwan
Republic of Korea
Hong Kong
Thailand
Indonesia
Exports change, YoY Imports change, YoY
Chart 3: Malaysia’s op 10 Trading Partners, October 2020 (Percentage Change)
Source: Official website of National Statistical Offices of the selected countries

MALAYSIAN ECONOMIC STATISTICS REVIEW - VOL. 8/2020 | 33
EXTERNAL SECTOR
International trade statistics by state for the period of October 2020 showed that the total trade fell RM4.2 billion or 2.5 per cent to RM160.0 billion, year-on-year. The decline was attributed to unfavourable performances mainly for W.P. Kuala Lumpur, fell RM6.8 billion (-72.2%), followed by Sarawak RM2.1 billion (-24.8%), Negeri Sembilan RM642.8 million (-14.4%) and Melaka RM569.8 million (-11.0%). However, Selangor recorded positive trend RM3.1 billion (+8.1%), Pulau Pinang RM1.5 billion (+3.3%), Kedah RM931.2 million (+18.4%), Perak RM839.1 million (+17.6%) and Pahang RM758.2 million (+26.2%) as shown in Exhibit 3.
Exhibit 3: Exports and Imports by State, October 2019 and 2020
Notes:1. Exports and imports activities that are taking place in the Supra area (including production activities beyond the centre of predominant
economic interest for any state) or declarations made by the agent are not included in this infographic. 2. Exports and imports value for W.P. Kuala Lumpur includes W.P. Putrajaya. Total exports increased RM190.5 million or 0.2 per cent to RM91.1 billion compared to the same period last year. The increase was driven by higher exports from Selangor (+RM2.1 billion), Pahang (+RM761.9 million), Perak (+RM693.1 million), Pulau Pinang (+RM597.5 million), Kedah (+RM570.2 million), Melaka (+RM210.6 million), Kelantan (+RM31.6 million) and Johor (+RM20.2 million). However, exports dropped for Sarawak (-RM2.1 billion), W.P. Kuala Lumpur (-RM1.7 billion), Sabah (-RM264.0 million), Terengganu (-RM258.1 million), W.P. Labuan (-RM225.6 million), Negeri Sembilan (-RM166.3 million) and Perlis (-RM49.6 million).
At the same time, imports dropped RM4.4 billion or 6.0 per cent to RM68.9 billion. Imports contracted due to lower imports from W.P. Kuala Lumpur (-RM5.1 billion), Melaka (-RM780.4 million), Negeri Sembilan (-RM476.6 million) dan Johor (-RM284.2 million), Sabah (-RM58.1 million), W.P. Labuan (-RM46.9 million), Perlis (-RM32.6 million), Sarawak (-RM30.2 million), Kelantan (-RM22.7 million) and Pahang (-RM3.8 million). However, Selangor recorded positive trend (+RM986.8 million), Pulau Pinang (+RM921.8 million), Kedah (+RM361.0 million), Terengganu (+RM189.5 million) and Perak (+RM146.0 million).
Source: Department of Statistics, Malaysia

| MALAYSIAN ECONOMIC STATISTICS REVIEW - VOL. 8/202034
Five states remained to dominate the country’s exports, accounting for 80 per cent of total exports. Pulau Pinang remained as the top exporter with a share of 34.2 per cent, followed by Selangor (20.8%), Johor (19.8%), Sarawak (5.3%) and Perak (3.6%). Meanwhile, for imports, Selangor was the largest contributor (32.3% of total imports), followed by Pulau Pinang (24.1%), Johor (20.1%), Kedah (4.9%) and Perak (3.4%).
The Economic Outlook 2021 report projected Malaysia’s exports and imports to decline in 2020 by 5.2 per cent and 6.4 per cent, respectively due to the COVID-19 pandemic. Having regards to the first ten months of 2020, exports performance exceeded expectations with a decline of 3.3 per cent. Meanwhile, imports need to achieve a better growth in November and December 2020 as the performance for the period January-October 2020 declined by 6.8 per cent. The Purchasing Managers Index (PMI) for Malaysia which is an indicator of economic health for the manufacturing sector fell from 48.5 in October 2020 to 48.4 in November 2020, recorded the lowest index points since May 2020. On the contrary, China’s PMI rose significantly to 52.1 per cent in November 2020 which is the highest index points recorded this year, indicating the improvement of the manufacturing sector in China. China is the world’s largest manufacturer and Malaysia’s main trading partner, thus the expansion is anticipated to stimulate the global supply chain and consequently increases Malaysia’s trading activities.
EXTERNAL SECTOR
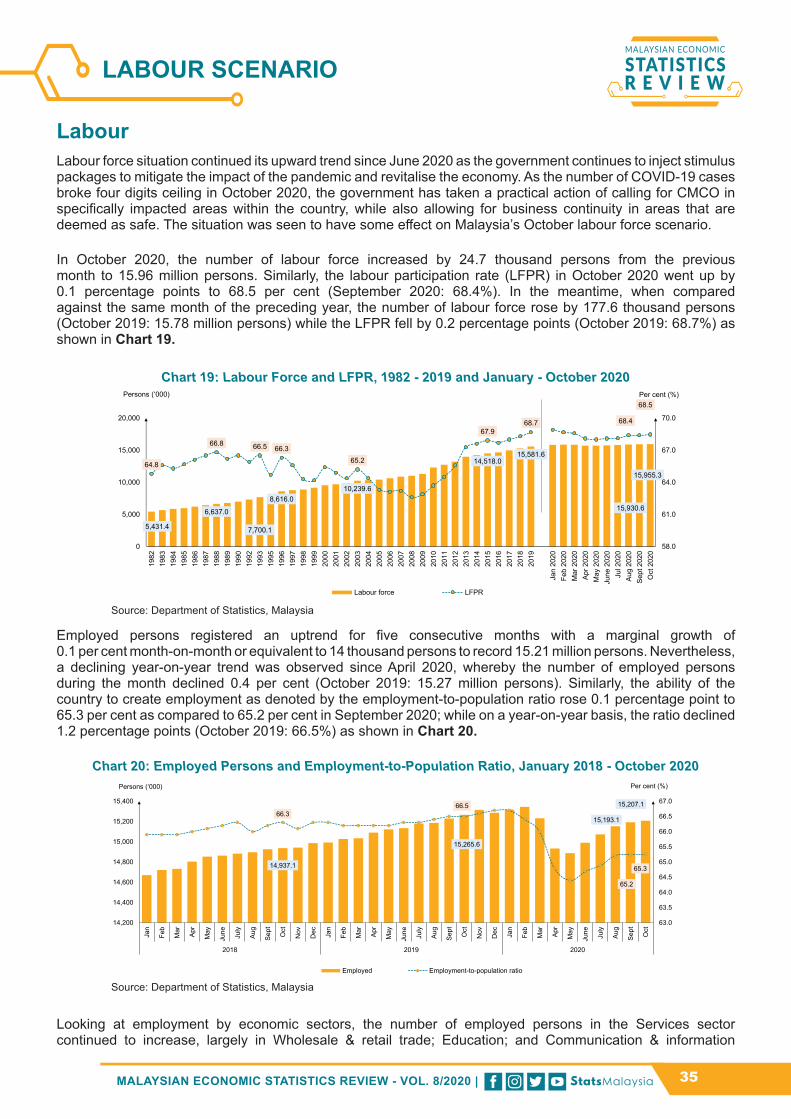
MALAYSIAN ECONOMIC STATISTICS REVIEW - VOL. 8/2020 | 35
LabourLabour force situation continued its upward trend since June 2020 as the government continues to inject stimulus packages to mitigate the impact of the pandemic and revitalise the economy. As the number of COVID-19 cases broke four digits ceiling in October 2020, the government has taken a practical action of calling for CMCO in specifically impacted areas within the country, while also allowing for business continuity in areas that are deemed as safe. The situation was seen to have some effect on Malaysia’s October labour force scenario.
In October 2020, the number of labour force increased by 24.7 thousand persons from the previous month to 15.96 million persons. Similarly, the labour participation rate (LFPR) in October 2020 went up by 0.1 percentage points to 68.5 per cent (September 2020: 68.4%). In the meantime, when compared against the same month of the preceding year, the number of labour force rose by 177.6 thousand persons (October 2019: 15.78 million persons) while the LFPR fell by 0.2 percentage points (October 2019: 68.7%) as shown in Chart 19.
Chart 19: Labour Force and LFPR, 1982 - 2019 and January - October 2020
Employed persons registered an uptrend for five consecutive months with a marginal growth of 0.1 per cent month-on-month or equivalent to 14 thousand persons to record 15.21 million persons. Nevertheless, a declining year-on-year trend was observed since April 2020, whereby the number of employed persons during the month declined 0.4 per cent (October 2019: 15.27 million persons). Similarly, the ability of the country to create employment as denoted by the employment-to-population ratio rose 0.1 percentage point to 65.3 per cent as compared to 65.2 per cent in September 2020; while on a year-on-year basis, the ratio declined 1.2 percentage points (October 2019: 66.5%) as shown in Chart 20.
Chart 20: Employed Persons and Employment-to-Population Ratio, January 2018 - October 2020
Looking at employment by economic sectors, the number of employed persons in the Services sector continued to increase, largely in Wholesale & retail trade; Education; and Communication & information
5,431.4
6,637.0
7,700.1
8,616.0 10,239.6
14,518.0 15,581.6
15,930.6
15,955.3 64.8
66.8 66.5 66.3 65.2
67.9 68.7 68.4
68.5
58.0
61.0
64.0
67.0
70.0
0
5,000
10,000
15,000
20,000
1982
1983
1984
1985
1986
1987
1988
1989
1990
1992
1993
1995
1996
1997
1998
1999
2000
2001
2002
2003
2004
2005
2006
2007
2008
2009
2010
2011
2012
2013
2014
2015
2016
2017
2018
2019
Jan
2020
Feb
2020
Mar
202
0Ap
r 202
0M
ay 2
020
June
202
0Ju
l 202
0Au
g 20
20Se
pt 2
020
Oct
202
0
Per cent (%) Persons (‘000)
Labour force LFPR
Source: Department of Statistics, Malaysia
14,937.1
15,265.6
15,193.1
15,207.1 66.3
66.5
65.2
65.3
63.0
63.5
64.0
64.5
65.0
65.5
66.0
66.5
67.0
14,200
14,400
14,600
14,800
15,000
15,200
15,400
Jan
Feb
Mar Ap
r
May
June July
Aug
Sept
Oct
Nov
Dec Jan
Feb
Mar Ap
r
May
June July
Aug
Sept
Oct
Nov
Dec Jan
Feb
Mar Ap
r
May
June July
Aug
Sept
Oct
2018 2019 2020
Per cent (%) Persons (‘000)
Employed Employment-to-population ratio
Source: Department of Statistics, Malaysia
LABOUR SCENARIO

| MALAYSIAN ECONOMIC STATISTICS REVIEW - VOL. 8/202036
activities. Nevertheless, the pandemic containment measure in the form of CMCO had caused unfavourable circumstances to the operations and employment in tourism-related industries such as Accommodation and food & beverages; Transports & storage; and Arts, entertainment & recreational activities. In the meantime, employed persons in Construction sector increased while decline was observed in Agriculture, Manufacturing and Mining & Quarrying sectors.
By status in employment, the employee’s category increased by 0.2 per cent (+28.1 thousand persons) to register 11.76 million persons as compared to the previous month. On the contrary, own-account workers decreased by 0.3 per cent to record 2.43 million persons. This group dominated by daily wage earners working in farmers’ markets, night markets, and stalls; freelancers; as well as smallholders (Chart 21).
Chart 21: Employed Persons by Status in Employment, September and October 2020
The unemployment rate in October 2020 was 4.7 per cent, an increase of 0.1 percentage points as against September 2020 after registering a decreasing trend for four consecutive months since June 2020. In line with this, the number of unemployed persons went up by 1.5 per cent to register 748.2 thousand persons (September 2020: 737.5 thousand persons). As for a year-on-year basis, the unemployment rate increased further by 1.5 percentage points, whereby the number of unemployed persons increased by 236.1 thousand persons (October 2019: 512.1 thousand persons) as shown in (Chart 22).
Chart 22: Unemployed Persons and Unemployment Rate, 1982 - 2019 and January - October 2020
More than 80 per cent of unemployed persons were actively unemployed. Persons who were unemployed for less than three months made up the largest composition with 48.9 per cent. In the meantime, persons who were in long-term unemployment for more than a year registered 62.2 thousand persons or 10.0 per cent of the total unemployed person. Meanwhile, the inactively unemployed during the month recorded a decrease of 0.5 percentage points to 125.1 thousand persons as against 127.1 thousand persons in September 2020 (Chart 23).
77.3%
September 2020
77.4%
October 2020
77.30%
15.80%
4.00% 2.90%
77.40%
15.90%
3.80% 2.90%
Employee Own account worker Unpaid family worker Employer
Source: Department of Statistics, Malaysia
3.4
7.4
3.7
3.3
4.6
4.7
0.0
2.0
4.0
6.0
8.0
0
200
400
600
800
1,000
1982
1983
1984
1985
1986
1987
1988
1989
1990
1992
1993
1995
1996
1997
1998
1999
2000
2001
2002
2003
2004
2005
2006
2007
2008
2009
2010
2011
2012
2013
2014
2015
2016
2017
2018
2019
Jan
2020
Feb
2020
Mar
202
0Ap
r 202
0M
ay 2
020
June
202
0Ju
l 202
0Au
g 20
20Se
pt 2
020
Oct
202
0
Per cent (%) Persons (‘000)
Unemployed Unemployment rate
Source: Department of Statistics, Malaysia
LABOUR SCENARIO

MALAYSIAN ECONOMIC STATISTICS REVIEW - VOL. 8/2020 | 37
Chart 23: Unemployed Category and Duration of Unemployment, September and October 2020
In October 2020, the number of persons outside labour force was down by 0.2 per cent (-12.1 thousand persons) to 7.35 million persons as against 7.36 million persons in September 2020. In the meantime, a year-on-year comparison showed that the outside labour force rose by 2.4 per cent (+172.7 thousand persons). The largest composition of outside labour force was due to schooling/ training which contributed 43.4 per cent followed by housework/ family responsibility with a share of 41.1 per cent (Chart 24).
Chart 24: Share of Outside Labour Force by Reasons for Not Seeking Work, September and October 2020
In spite of the volatility and uncertainty of the COVID-19 cases in the country, Malaysia’s labour market situation has seen gradual improvement. The government’s policies and initiatives will continue to support the stabilisation of the labour market condition. Nevertheless, it is foreseen that more challenges will hit the labour market in the upcoming months amid the escalating numbers of new daily cases of COVID-19. Hence, as we go through this challenging period, Budget 2021 has introduced initiatives such as Employment Generation Guarantee Scheme (JanaKerja) and Short-Term Employment Programme (MyStep) which is expected to create jobs; while the extension of Wage Subsidy Programme is an effort to retain employment and ensure business sustainability.
49.2
26.8
14.4
9.5
48.9
26.9
14.3
10.0
Less than 3 months
3 - less than 6 months
6 - less than 12 months
More than 1 year
Duration of unemployment
Percentage share (%)
September 2020 October 2020
September 2020
82.8%
17.2%
82.8%
October 2020
83.3%
16.7%
83.3%
Unemployed category
Inactively unemployed Actively unemployedSource: Department of Statistics, Malaysia
14.7
40.2
45.1
15.5
43.4
41.1
0.0 5.0 10.0 15.0 20.0 25.0 30.0 35.0 40.0 45.0 50.0
Others
Schooling
Housework/Familyresponsibilities
Percentage share (%)
September 2020 October 2020
Source: Department of Statistics, Malaysia
LABOUR SCENARIO
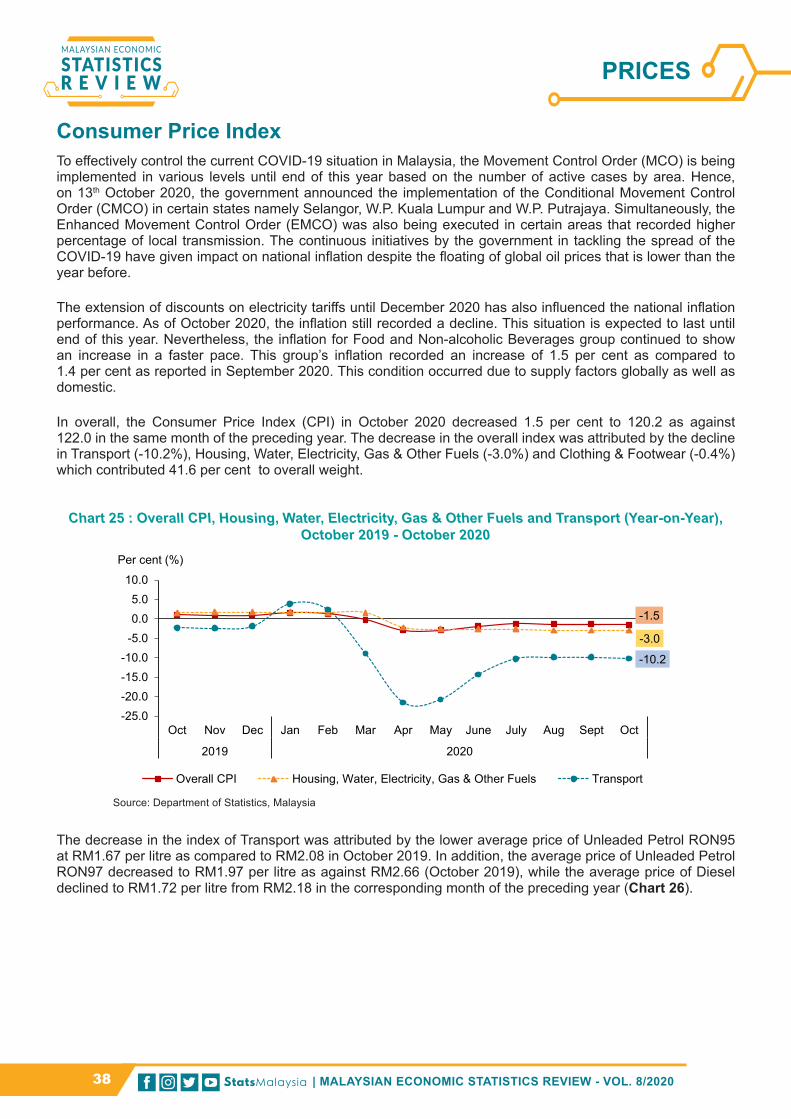
| MALAYSIAN ECONOMIC STATISTICS REVIEW - VOL. 8/202038
Consumer Price IndexTo effectively control the current COVID-19 situation in Malaysia, the Movement Control Order (MCO) is being implemented in various levels until end of this year based on the number of active cases by area. Hence, on 13th October 2020, the government announced the implementation of the Conditional Movement Control Order (CMCO) in certain states namely Selangor, W.P. Kuala Lumpur and W.P. Putrajaya. Simultaneously, the Enhanced Movement Control Order (EMCO) was also being executed in certain areas that recorded higher percentage of local transmission. The continuous initiatives by the government in tackling the spread of the COVID-19 have given impact on national inflation despite the floating of global oil prices that is lower than the year before.
The extension of discounts on electricity tariffs until December 2020 has also influenced the national inflation performance. As of October 2020, the inflation still recorded a decline. This situation is expected to last until end of this year. Nevertheless, the inflation for Food and Non-alcoholic Beverages group continued to show an increase in a faster pace. This group’s inflation recorded an increase of 1.5 per cent as compared to 1.4 per cent as reported in September 2020. This condition occurred due to supply factors globally as well as domestic.
In overall, the Consumer Price Index (CPI) in October 2020 decreased 1.5 per cent to 120.2 as against 122.0 in the same month of the preceding year. The decrease in the overall index was attributed by the decline in Transport (-10.2%), Housing, Water, Electricity, Gas & Other Fuels (-3.0%) and Clothing & Footwear (-0.4%) which contributed 41.6 per cent to overall weight.
Chart 25 : Overall CPI, Housing, Water, Electricity, Gas & Other Fuels and Transport (Year-on-Year), October 2019 - October 2020
The decrease in the index of Transport was attributed by the lower average price of Unleaded Petrol RON95 at RM1.67 per litre as compared to RM2.08 in October 2019. In addition, the average price of Unleaded Petrol RON97 decreased to RM1.97 per litre as against RM2.66 (October 2019), while the average price of Diesel declined to RM1.72 per litre from RM2.18 in the corresponding month of the preceding year (Chart 26).
Chart 1 : Overall CPI, Housing, Water, Electricity, Gas & Other Fuels and Transport (Year on Year), October 2019 - October 2020
-1.5
-3.0
-10.2
-25.0-20.0-15.0-10.0
-5.00.05.0
10.0
Oct Nov Dec Jan Feb Mar Apr May June July Aug Sept Oct
2019 2020
Overall CPI Housing, Water, Electricity, Gas & Other Fuels Transport
Per cent (%)
Source: Department of Statistics, Malaysia
PRICES

MALAYSIAN ECONOMIC STATISTICS REVIEW - VOL. 8/2020 | 39
Chart 26 : Average Price of Fuel, October 2019 - October 2020
Similarly, the decrease in the index of Housing, Water, Electricity, Gas & Other Fuels was due to the effect of discounts given on electricity bills for domestic consumption as announced by the Government.
In contrast, Food & Non-Alcoholic Beverages which contributed 29.5 per cent of CPI weight increased by 1.5 per cent to 135.3 as against 133.3 in corresponding month of the preceding year (Table 4). The increase was driven by the incline in subgroup of Vegetables (4.2%) and Food Products not elsewhere classified (2.6%). At the same time, other subgroups that also increased were Fruits (2.3%), Oil & Fats (1.9%), Meat (1.7%) and Fish & Seafood (1.6%).
Table 4 : Subgroup of Food & Non-Alcoholic Beverages, October 2020 (Percentage Change)
Although CPI showed a continuous decline, it is expected that the CPI in the coming months will improve and be in a recovery phase. This is in line with the projection of CPI by Bank Negara Malaysia where the average headline inflation in 2021 is expected to be between 1.0 per cent to 3.0 per cent. This projection takes into consideration the expected recovery in global oil prices and increase in domestic demand.
Chart 2 : Average Price of Fuel, October 2019 - October 2020
1.97
1.67
1.72
1.00
1.50
2.00
2.50
3.00
Oct Nov Dec Jan Feb Mar Apr May June July Aug Sep Oct
2019 2020
Ron97 Ron95 Diesel
RM
Source: Department of Statistics, Malaysia
Table 1 : Subgroup of Food & Non-Alcoholic Beverages, October 2020 (Percentage Change)
Main Groups Weight Year-on-Year (%) October 2020
Food & Non-Alcoholic Beverages 29.5 1.5
Food 28.4 1.5
Food at Home 16.9 1.4
Rice Bread & Other Cereals 3.5 0.8
Meat 2.5 1.7
Fish & Seafood 4.0 1.6
Milk, Cheese & Eggs 1.5 -2.7
Oil & Fats 0.6 1.9
Fruits 1.2 2.3
Vegetables 2.1 4.2 Sugar, Jam, Honey, Chocolate & Confectionery
0.6 -0.7
Food Products n.e.c 1.0 2.6
Food Away From Home 11.5 1.8
Coffee, Tea, Cocoa & Non-Alcoholic Beverages 1.1 0.3
Source : Department of Statistics, Malaysia Source: Department of Statistics, Malaysia
PRICES

| MALAYSIAN ECONOMIC STATISTICS REVIEW - VOL. 8/202040
Producer Price Index (PPI) Local ProductionIn October 2020, the PPI local production decreased by 3.6 per cent to 101.3 from 105.1 in the same month of last year. The decline in the overall index was driven by the Mining index (-43.5%), Electricity & gas supply (-1.2%) and Manufacturing (-1.1%). On the other hand, the Agriculture, forestry & fishing and Water supply indexes increased by 21.0 per cent and 1.0 per cent respectively.
For the monthly comparison, the PPI local production recorded a marginal increase of 0.1 per cent in October of this year. The smaller increase was due to the increase in the Agriculture, forestry & fishing index of 1.1 per cent and Manufacturing 0.3 per cent. This was also supported by the continued growth in prices of rubber products, motor vehicles, electrical & electronics and food products. Meanwhile, the Mining and Electricity & gas supply index declined by 3.1 per cent and 0.4 per cent respectively while the Water supply remained unchanged (Chart 27).
Chart 27: PPI Local Production, October 2019 - October 2020
By stage of processing, the PPI local production covers Crude materials for further processing (weight: 16.4%), Intermediate materials, supplies and components (weight: 56.1%) and Finished goods (weight: 27.5%). As compared to the same month last year, all stages of processing showed a decrease in October 2020. Crude materials for further processing decreased 13.2 per cent followed by Intermediate materials, supplies & components (-1.6%) and Finished goods (-0.8%) as shown in (Chart 28).
Chart 28 : PPI Local Production by Stage of Processing (Year-on-Year),
October 2019 - October 2020
In overall, although the Conditional Movement Control Order enforcement could affect the economic activities coupled with crude oil prices falling globally, the PPI local production is expected to increase particularly in the Agriculture and Manufacturing sector.
Chart 1 : Producer Price Index October 2019 – October 2020
-3.6
0.1
101.3
-8.0
-6.0
-4.0
-2.0
0.0
2.0
4.0
94.096.098.0
100.0102.0104.0106.0108.0
Oct Nov Dec Jan Feb Mar Apr May June July Aug Sep Oct
2019 2020
Index Year-on-Year Month-on-Month
Index Per cent (%)
Source: Department of Statistics, Malaysia
Chart 2 : Producer Price Index by Stage of Processing (Year on Year) October 2019 – October 2020
-13.2
-0.8
-1.6
-40.0
-30.0
-20.0
-10.0
0.0
10.0
20.0
Oct Nov Dec Jan Feb Mar Apr May June July Aug Sep Oct
2019 2020
Per cent (%)
Crude Materials for Futher ProcessingIntermediate Materials, Supplies and ComponentsFinished Goods
Source: Department of Statistics, Malaysia
PRICES

MALAYSIAN ECONOMIC STATISTICS REVIEW - VOL. 8/2020 | 41
As we are moving towards the end of 2020, the prolonged COVID-19 pandemic has caused uncertainty. The higher number of cases has led to the extension of CMCO and implementation of Enhanced Movement Control Order (EMCO) at specific localities which were identified as high risk. Consequently, the economic scenario was adversely impacted, as reflected in the recently released economic and social indicators. The unfavourable scenario was also observed during the first month of the final quarter of 2020 whereby sales value and volume of Wholesale & Retail Trade declined while Motor Vehicles continued to post positive growth. As for the Agriculture sector, the production of oil palm also fell in October 2020 as against the previous month.
On the brighter side, Malaysia’s labour market situation has seen a gradual improvement. The government’s policies and initiatives have continued to support the stabilisation of the labour market condition. Nonetheless, it is foreseen that more challenges will hit the labour market in the upcoming months as Malaysia saw a sudden rise in number of new cases and the active numbers of COVID-19 cases still remained high. In this regards, the recent Budget 2021 has proposed several initiatives to ensure continuous employment prospects such as Employment Generation Guarantee Scheme (JanaKerja) and Short-Term Employment Programme (MyStep) which aimed to boost the job creation in the market. Besides, the extension of Wage Subsidy Programme is also among the efforts to retain employment and ensure business sustainability. Nevertheless, more strategized efforts are also encouraged to promote entrepreneurship as a mean of income opportunities, producing job creators as opposed to job seekers especially among youth. Simultaneously, to increase employability, youth must always be ready to update and upgrade knowledge and skills to ensure they remain agile and adaptable to the ever-changing labour market prerequisites.
Since CMCO are being gradually lifted in phases and replaced with RMCO, the government had recently permitted inter-district and interstate travel except in and between EMCO areas. This serves as positive news to augment the domestic tourism activities. The end of the year period will usually be bustling with tourism activities as people take advantage of the long Christmas and New Year public holidays and school holidays. Thus, this will directly contribute to the significant growth of the tourism-based industries nationwide, such as Transportation, Accommodation as well as Food and beverages; and subsequently bring indirect effect for the progress of the other tourism related industries.
Interestingly, the COVID-19 pandemic has also led to positive circumstances in the businesses. Physical distancing nudged businesses to transition to simplest and most obvious digital solution to enable business continuity, that is the social media. This can be observed by the increase in online purchases which has directly surged the revenue in the post and courier services. At the same time, these online businesses have contributed to the increase in the use of telecommunications tools whereby traders actively utilised the digital platforms for the survival of their businesses.
Given the restrictions on movement and social distancing guidelines, the expansion of online platforms offering payments, food deliveries and online education was not only key to providing basic goods and services to the general public, but also a necessity for companies looking to adapt to the rapidly changing demands. Entrepreneurs who are involved in the informal sector such as selling food, clothes and handcrafted items have actively adapted using this platform in creative ways through the social media which attributed to the mushrooming of these activities. In the recent budget announcement, the government has allocated budget to provide assistance to the informal entrepreneurs. Nevertheless, more proactive approaches need to be executed for the sustainability of their livelihood. Thus, on 21st December 2020, The National Entrepreneur Group Economic Fund (TEKUN Nasional) has launched the Informal Financing Scheme (SPIN) with an allocation of RM50 million to help informal sector entrepreneurs affected by the COVID-19 pandemic to obtain funding. This funding is expected to benefit 10,000 entrepreneurs who are not registered with the Companies Commission of Malaysia (SSM). This targeted group will be eligible for financing of between RM1,000 and RM5,000 with a repayment period of up to three years based on a profit rate of four per cent per annum. Considering the informal entrepreneurs are usually task-based and demand-driven, it is also pertinent to protect this group from uncertainties and ensure their long-term sustainability by ensuring their proper registration to facilitate easy identification as well as safeguarding their social safety nets.
To conclude the prospect for the near future, Malaysia’s economy is expected to continue its journey to recovery in the early months of 2021 as reflected by the Leading Index (LI) of October 2020. It is vital for the activities in the economy to continue in providing jobs for the people and it is crucial to find the right solution and targeted approach to curb the COVID-19 without a huge consequence to the industry players who are the backbones of the economy.
WAY FORWARD

| MALAYSIAN ECONOMIC STATISTICS REVIEW - VOL. 8/202042
This page is deliberately left blank

ECONOMIC INDICATORS

44MALAYSIAN ECONOMIC STATISTICS REVIEW - VOL. 8/2020 | 44
ECONOMIC INDICATORS - MONTHLY
Note:p preliminary1 latest data until September 20202 published data from January 2020# provisional data based on External Trade Publications October 2020n.a. not available- not applicable
INDICATORS(Value) Oct Nov Dec Jan Feb Mar Apr May Jun Jul Aug Sep Oct
GROSS DOMESTIC PRODUCTConstant 2015 Prices 2 RM Million - - - - - - - - - - - - - Department of Statistics, Malaysia
COMMODITIESRUBBER
ProductionRubber Tonne 48,528.0 53,019.0 58,437.0 66,259.0 49,894.0 34,506.0 34,616.0 21,044.0 33,531.0 41,801.0 44,543.0 46,187.0 48,663.0 Department of Statistics, Malaysia
PricesSMR 20 RM/Kg 5.37 5.66 5.96 5.90 5.50 5.17 4.73 4.70 4.84 4.98 5.39 5.59 6.22 Malaysian Rubber BoardScrap RM/Kg 4.00 4.21 4.52 4.51 4.15 3.88 3.29 3.27 3.41 3.55 3.96 4.20 4.77 Malaysian Rubber BoardField Latex RM/Kg 4.39 4.60 4.84 4.96 4.76 4.64 4.33 4.28 4.83 4.92 4.87 5.06 6.04 Malaysian Rubber BoardLatex Concentrate RM/Kg 4.26 4.41 4.55 4.60 4.57 4.36 4.13 4.32 4.80 4.67 4.68 4.85 5.76 Malaysian Rubber Board
ExportsNatural Rubber # Tonne 50,599.8 47,487.6 50,515.5 45,826.6 51,852.0 45,198.0 40,596.5 33,780.0 38,586.8 45,386.0 42,657.9 48,720.2 54,492.4 Department of Statistics, Malaysia
OIL PALMExports
Palm Oil Product Tonne 2,512,368.0 2,157,349.0 2,194,976.0 1,962,191.0 1,708,574.0 1,983,012.0 1,856,866.0 2,034,810.0 2,579,725.0 2,581,993.0 2,445,087.0 2,467,933.0 2,542,294.0 Malaysian Palm Oil BoardPalm Oil Tonne 1,641,973.0 1,405,638.0 1,398,049.0 1,213,539.0 1,082,417.0 1,184,702.0 1,236,478.0 1,369,351.0 1,706,597.0 1,783,284.0 1,578,034.0 1,612,155.0 1,674,304.0 Malaysian Palm Oil BoardPalm Kernel Oil Tonne 101,382.0 89,886.0 92,431.0 97,331.0 73,898.0 77,481.0 84,118.0 75,049.0 96,201.0 100,584.0 102,379.0 134,714.0 140,640.0 Malaysian Palm Oil Board
CRUDE PETROLEUMPrices
Crude Oil, Brent USD/Barrel 59.37 62.74 65.85 63.60 55.00 32.98 23.34 31.02 39.93 42.81 44.26 41.09 40.47 World BankCrude Oil, WTI USD/Barrel 53.98 57.06 59.80 57.52 50.53 29.88 16.52 28.56 38.30 40.75 42.36 39.60 39.53 World Bank
ExportsCrude Petroleum # '000 Tonne 895.4 1,070.5 1,156.7 976.8 785.2 1,200.5 799.2 777.4 931.4 1,552.1 1,626.2 1,249.8 778.0 Department of Statistics, MalaysiaPetroleum Products # '000 Tonne 2,275.8 2,440.0 2,779.6 2,695.3 2,279.4 3,704.7 3,397.2 2,856.1 3,097.4 3,581.5 2,602.0 2,022.7 2,676.1 Department of Statistics, Malaysia
ImportsCrude Petroleum # '000 Tonne 762.8 532.4 1,266.1 1,769.1 1,041.9 2,158.0 766.2 695.4 678.3 1,449.3 846.2 534.2 919.0 Department of Statistics, MalaysiaPetroleum Products # '000 Tonne 2,582.2 3,488.9 2,499.3 2,554.5 2,968.9 3,155.1 2,762.0 1,972.2 3,606.0 3,210.2 2,581.2 5,026.9 3,401.2 Department of Statistics, Malaysia
LIQUIFIED NATURAL GAS (LNG)Exports
Liquified Natural Gas # '000 Tonne 2,300.5 2,101.3 2,320.8 2,587.2 2,182.5 2,213.9 1,884.6 1,553.0 1,721.7 1,977.1 2,046.1 1,938.4 1,883.3 Department of Statistics, Malaysia
SECTORMANUFACTURING
Industrial Production Index Point 124.5 121.3 122.7 123.1 115.0 113.8 73.1 92.8 127.1 127.4 124.7 127.3 127.5 Department of Statistics, MalaysiaSales RM '000 119,356,904.3 117,361,545.1 119,150,932.2 117,991,922.2 111,240,489.3 110,091,395.0 75,754,208.7 89,477,287.8 116,788,910.8 119,161,841.4 118,446,194.1 121,220,212.8 122,003,536.7 Department of Statistics, MalaysiaExports # RM '000 78,022,297.7 68,755,048.4 72,922,901.1 71,034,031.0 63,116,465.2 67,621,737.1 55,374,761.6 54,208,078.5 72,475,135.7 80,978,664.0 68,555,693.1 77,984,975.0 79,936,576.4 Department of Statistics, Malaysia
CONSTRUCTIONIssuance of Developer License, Sales Permit and Housing Advertisement (New Permit)
Unit 122 125 83 98 107 58 9 26 77 67 91 71 82 National Housing Department
Issuance of Developer License, Sales Permit and Housing Advertisement (Renewals Permit) Unit 219 190 146 229 183 191 113 182 225 268 221 201 231 National Housing Department
PricesSteel RM per Tonne 2,379.41 2,379.41 2,379.41 2,379.41 2,387.04 2,387.04 2,387.04 2,387.04 2,384.01 2,384.01 2,376.60 2,376.60 2,376.60 Ministry of WorksCement RM per 50 Kg Bag 17.32 17.32 17.35 17.50 17.62 17.65 17.66 17.75 17.78 17.83 17.83 17.80 17.74 Ministry of Works
MINING AND QUARRYINGIndustrial Production Index Point 99.2 104.1 103.1 103.9 96.1 98.6 79.8 80.1 82.0 85.7 85.9 82.4 88.6 Department of Statistics, Malaysia
UTILITIESElectricityLocal Generation
Public Installations pMillion Kilowatt-Hours 13,916.0 13,530.6 13,605.0 13,848.6 13,226.5 13,186.2 11,376.8 12,947.4 12,976.7 13,544.2 13,937.5 13,427.6 13,983.7
Tenaga Nasional Berhad, Sabah Electricity Sdn. Bhd., Sarawak Energy Berhad, Independent Power Producer
Private Installations pMillion Kilowatt-Hours 183.5 191.6 191.9 198.0 188.5 194.9 185.7 176.9 174.2 177.8 175.5 183.2 195.8
Tenaga Nasional Berhad, Sabah Electricity Sdn. Bhd., Sarawak Energy Berhad, Independent Power Producer
UNIT2019 2020
DATA SOURCE
Notep preliminary1 latest data until September 20202 published data from January 2020# provisional data based on External Trade Publications October 2020n.a. not available- not applicable

45MALAYSIAN ECONOMIC STATISTICS REVIEW - VOL. 8/2020 | 45
ECONOMIC INDICATORS - MONTHLY
Note:p preliminary1 latest data until September 20202 published data from January 2020# provisional data based on External Trade Publications October 2020n.a. not available- not applicable
Oct Nov Dec Jan Feb Mar Apr May Jun Jul Aug Sep OctGROSS DOMESTIC PRODUCT
Constant 2015 Prices 2 - - - 3.0 6.2 -6.6 -28.7 -19.5 -3.4 -2.7 -3.6 -1.6 n.a Department of Statistics, Malaysia
COMMODITIESRUBBER
ProductionRubber -5.2 1.6 6.2 -12.9 -15.5 -31.1 2.0 -52.7 -8.9 -30.4 -22.7 -25.2 0.3 Department of Statistics, Malaysia
PricesSMR 20 -1.2 11.1 14.9 7.6 -1.5 -12.7 -23.0 -24.9 -22.4 -14.3 -0.7 1.3 15.9 Malaysian Rubber BoardScrap -1.1 14.9 22.9 12.4 0.9 -14.3 -29.4 -31.4 -29.2 -21.3 -3.5 1.9 19.4 Malaysian Rubber BoardField Latex 4.9 18.1 29.4 22.2 13.4 -5.4 -21.5 -18.0 -9.3 -3.0 3.0 9.8 37.7 Malaysian Rubber BoardLatex Concentrate 6.0 15.7 20.7 17.0 11.2 -8.0 -16.7 -10.7 -3.4 -1.8 6.5 10.6 35.2 Malaysian Rubber Board
ExportsNatural Rubber # -6.6 -10.3 4.8 -8.0 26.2 -15.1 -27.4 -40.6 -29.3 -32.5 -23.7 1.4 7.7 Department of Statistics, Malaysia
OIL PALMExports
Palm Oil Product 5.7 3.8 5.2 -18.6 -16.4 -19.8 -19.6 -21.1 19.8 10.2 -3.5 13.7 1.2 Malaysian Palm Oil BoardPalm Oil 4.0 2.2 1.1 -27.8 -18.3 -26.9 -25.3 -20.2 22.1 20.0 -9.1 14.4 2.0 Malaysian Palm Oil BoardPalm Kernel Oil 31.0 -9.9 51.0 16.5 -23.5 -4.0 -6.4 -22.2 9.5 15.8 9.5 54.6 38.7 Malaysian Palm Oil Board
CRUDE PETROLEUMPrices
Crude Oil, Brent -26.2 -3.7 16.6 7.3 -14.2 -50.3 -67.2 -56.0 -36.9 -33.1 -25.3 -34.1 -31.8 World BankCrude Oil, WTI -23.7 0.7 22.2 11.6 -8.0 -48.6 -74.1 -53.1 -30.0 -29.2 -22.8 -30.5 -26.8 World Bank
ExportsCrude Petroleum # -40.8 -5.7 -23.2 -22.0 -19.1 2.0 -10.0 -29.6 -31.9 68.6 73.6 75.8 -13.1 Department of Statistics, MalaysiaPetroleum Products # -13.0 -4.3 35.3 51.1 26.9 60.4 24.0 14.7 29.3 46.6 3.7 -6.9 17.6 Department of Statistics, Malaysia
ImportsCrude Petroleum # -18.2 -14.9 41.8 47.9 -4.1 96.2 -42.9 -42.2 -26.5 5.5 4.5 -54.7 20.5 Department of Statistics, MalaysiaPetroleum Products # -25.9 4.8 0.0 2.5 75.6 11.8 -6.9 -30.8 47.7 32.7 13.6 83.5 31.7 Department of Statistics, Malaysia
LIQUIFIED NATURAL GAS (LNG)Exports
Liquified Natural Gas # 1.2 -16.6 3.3 -5.6 25.9 0.0 -17.3 -20.6 -10.2 -8.2 11.7 -0.7 -18.1 Department of Statistics, Malaysia
SECTORMANUFACTURING
Industrial Production Index 2.3 2.7 3.4 2.2 6.2 -4.1 -37.2 -22.6 4.7 2.9 2.2 4.3 2.4 Department of Statistics, MalaysiaSales 1.6 2.1 3.9 2.4 7.6 -3.0 -33.0 -20.4 4.2 1.9 1.6 3.7 2.2 Department of Statistics, MalaysiaExports # -4.2 -2.7 4.2 0.4 11.6 -6.2 -24.4 -23.8 13.1 4.7 -0.1 16.3 2.5 Department of Statistics, Malaysia
CONSTRUCTIONIssuance of Developer License, Sales Permit and Housing Advertisement (New Permit)
50.6 81.2 38.3 -10.1 75.4 -32.6 -90.6 -72.3 32.8 -44.6 -9.0 2.9 -32.8 National Housing Department
Issuance of Developer License, Sales Permit and Housing Advertisement (Renewals Permit) 18.4 24.2 -7.6 42.2 16.6 29.9 -5.8 31.9 81.5 43.3 8.3 51.1 5.5 National Housing Department
PricesSteel -0.8 -0.8 -0.6 -0.4 0.1 0.2 0.3 0.3 0.2 0.2 -0.1 -0.1 -0.1 Ministry of WorksCement -0.9 -0.9 -0.6 0.6 2.2 3.0 3.0 3.5 3.7 3.7 3.4 2.9 2.4 Ministry of Works
MINING AND QUARRYINGIndustrial Production Index -6.9 0.5 -4.9 -3.9 6.1 -6.5 -19.6 -22.2 -17.1 -3.0 -6.7 -9.6 -10.6 Department of Statistics, Malaysia
UTILITIESElectricityLocal Generation
Public Installations p 0.1 1.2 0.5 -0.6 6.2 -8.7 -19.8 -10.8 -2.9 -5.4 -1.7 -2.6 0.5
Tenaga Nasional Berhad, Sabah Electricity Sdn. Bhd., Sarawak Energy Berhad, Pengeluar Tenaga Bebas
Private Installations p 3.5 7.1 -1.4 9.0 17.8 7.2 3.4 -4.5 -4.8 -0.1 -0.6 3.4 6.7
Tenaga Nasional Berhad, Sabah Electricity Sdn. Bhd., Sarawak Energy Berhad, Pengeluar Tenaga Bebas
2020DATA SOURCE
2019Annual Percentage Change (%)
INDICATORS
Notep preliminary1 latest data until September 20202 published data from January 2020# provisional data based on External Trade Publications October 2020n.a. not available- not applicable
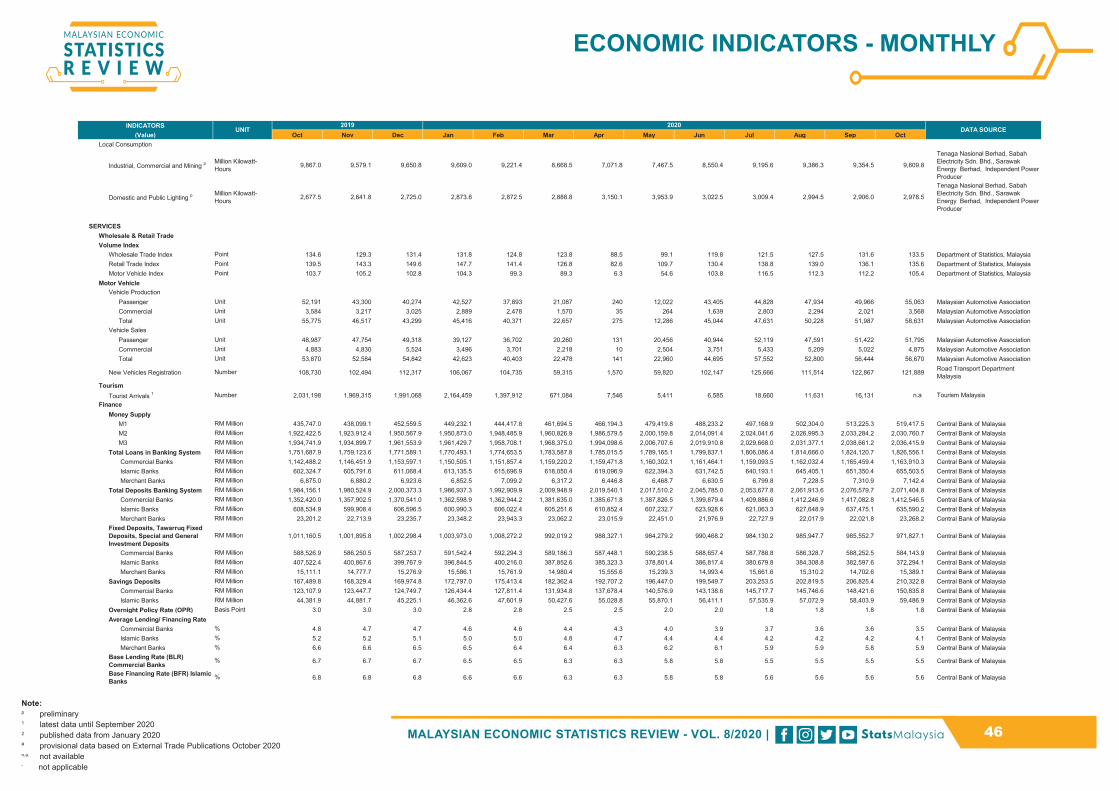
46MALAYSIAN ECONOMIC STATISTICS REVIEW - VOL. 8/2020 | 46
ECONOMIC INDICATORS - MONTHLY
Note:p preliminary1 latest data until September 20202 published data from January 2020# provisional data based on External Trade Publications October 2020n.a. not available- not applicable
INDICATORS(Value) Oct Nov Dec Jan Feb Mar Apr May Jun Jul Aug Sep Oct
UNIT2019 2020
DATA SOURCE
Local Consumption
Industrial, Commercial and Mining pMillion Kilowatt-Hours 9,867.0 9,579.1 9,650.8 9,609.0 9,221.4 8,668.5 7,071.8 7,467.5 8,550.4 9,195.6 9,386.3 9,354.5 9,609.8
Tenaga Nasional Berhad, Sabah Electricity Sdn. Bhd., Sarawak Energy Berhad, Independent Power Producer
Domestic and Public Lighting pMillion Kilowatt-Hours 2,677.5 2,641.8 2,725.0 2,873.8 2,872.5 2,888.8 3,150.1 3,953.9 3,022.5 3,009.4 2,994.5 2,906.0 2,978.5
Tenaga Nasional Berhad, Sabah Electricity Sdn. Bhd., Sarawak Energy Berhad, Independent Power Producer
SERVICESWholesale & Retail TradeVolume Index
Wholesale Trade Index Point 134.6 129.3 131.4 131.8 124.8 123.8 88.5 99.1 119.8 121.5 127.5 131.6 133.5 Department of Statistics, MalaysiaRetail Trade Index Point 139.5 143.3 149.6 147.7 141.4 126.8 82.6 109.7 130.4 138.8 139.0 136.1 135.6 Department of Statistics, MalaysiaMotor Vehicle Index Point 103.7 105.2 102.8 104.3 99.3 89.3 6.3 54.6 103.8 116.5 112.3 112.2 105.4 Department of Statistics, Malaysia
Motor VehicleVehicle Production
Passenger Unit 52,191 43,300 40,274 42,527 37,893 21,087 240 12,022 43,405 44,828 47,934 49,966 55,063 Malaysian Automotive AssociationCommercial Unit 3,584 3,217 3,025 2,889 2,478 1,570 35 264 1,639 2,803 2,294 2,021 3,568 Malaysian Automotive AssociationTotal Unit 55,775 46,517 43,299 45,416 40,371 22,657 275 12,286 45,044 47,631 50,228 51,987 58,631 Malaysian Automotive Association
Vehicle SalesPassenger Unit 48,987 47,754 49,318 39,127 36,702 20,260 131 20,456 40,944 52,119 47,591 51,422 51,795 Malaysian Automotive AssociationCommercial Unit 4,883 4,830 5,524 3,496 3,701 2,218 10 2,504 3,751 5,433 5,209 5,022 4,875 Malaysian Automotive AssociationTotal Unit 53,870 52,584 54,842 42,623 40,403 22,478 141 22,960 44,695 57,552 52,800 56,444 56,670 Malaysian Automotive Association
New Vehicles Registration Number 108,730 102,494 112,317 106,067 104,735 59,315 1,570 59,820 102,147 125,666 111,514 122,867 121,889 Road Transport Department Malaysia
TourismTourist Arrivals 1 Number 2,031,198 1,969,315 1,991,068 2,164,459 1,397,912 671,084 7,546 5,411 6,585 18,660 11,631 16,131 n.a Tourism Malaysia
FinanceMoney Supply
M1 RM Million 435,747.0 438,099.1 452,559.5 449,232.1 444,417.8 461,694.5 466,194.3 479,419.8 488,233.2 497,168.9 502,304.0 513,225.3 519,417.5 Central Bank of MalaysiaM2 RM Million 1,922,422.5 1,923,912.4 1,950,567.9 1,950,873.0 1,948,485.9 1,960,826.9 1,986,579.5 2,000,159.8 2,014,091.4 2,024,041.6 2,026,995.3 2,033,284.2 2,030,760.7 Central Bank of MalaysiaM3 RM Million 1,934,741.9 1,934,899.7 1,961,553.9 1,961,429.7 1,958,708.1 1,968,375.0 1,994,098.6 2,006,707.6 2,019,910.8 2,029,668.0 2,031,377.1 2,038,661.2 2,036,415.9 Central Bank of Malaysia
Total Loans in Banking System RM Million 1,751,687.9 1,759,123.6 1,771,589.1 1,770,493.1 1,774,653.5 1,783,587.8 1,785,015.5 1,789,165.1 1,799,837.1 1,806,086.4 1,814,666.0 1,824,120.7 1,826,556.1 Central Bank of Malaysia Commercial Banks RM Million 1,142,488.2 1,146,451.9 1,153,597.1 1,150,505.1 1,151,857.4 1,159,220.2 1,159,471.8 1,160,302.1 1,161,464.1 1,159,093.5 1,162,032.4 1,165,459.4 1,163,910.3 Central Bank of Malaysia Islamic Banks RM Million 602,324.7 605,791.6 611,068.4 613,135.5 615,696.9 618,050.4 619,096.9 622,394.3 631,742.5 640,193.1 645,405.1 651,350.4 655,503.5 Central Bank of Malaysia Merchant Banks RM Million 6,875.0 6,880.2 6,923.6 6,852.5 7,099.2 6,317.2 6,446.8 6,468.7 6,630.5 6,799.8 7,228.5 7,310.9 7,142.4 Central Bank of Malaysia
Total Deposits Banking System RM Million 1,984,156.1 1,980,524.9 2,000,373.3 1,986,937.3 1,992,909.9 2,009,948.9 2,019,540.1 2,017,510.2 2,045,785.0 2,053,677.8 2,061,913.6 2,076,579.7 2,071,404.8 Central Bank of Malaysia Commercial Banks RM Million 1,352,420.0 1,357,902.5 1,370,541.0 1,362,598.9 1,362,944.2 1,381,635.0 1,385,671.8 1,387,826.5 1,399,879.4 1,409,886.6 1,412,246.9 1,417,082.8 1,412,546.5 Central Bank of Malaysia Islamic Banks RM Million 608,534.9 599,908.4 606,596.5 600,990.3 606,022.4 605,251.6 610,852.4 607,232.7 623,928.6 621,063.3 627,648.9 637,475.1 635,590.2 Central Bank of Malaysia Merchant Banks RM Million 23,201.2 22,713.9 23,235.7 23,348.2 23,943.3 23,062.2 23,015.9 22,451.0 21,976.9 22,727.9 22,017.9 22,021.8 23,268.2 Central Bank of Malaysia
Fixed Deposits, Tawarruq Fixed Deposits, Special and General Investment Deposits
RM Million 1,011,160.5 1,001,895.8 1,002,298.4 1,003,973.0 1,008,272.2 992,019.2 988,327.1 984,279.2 990,468.2 984,130.2 985,947.7 985,552.7 971,827.1 Central Bank of Malaysia
Commercial Banks RM Million 588,526.9 586,250.5 587,253.7 591,542.4 592,294.3 589,186.3 587,448.1 590,238.5 588,657.4 587,788.8 586,328.7 588,252.5 584,143.9 Central Bank of Malaysia Islamic Banks RM Million 407,522.4 400,867.6 399,767.9 396,844.5 400,216.0 387,852.6 385,323.3 378,801.4 386,817.4 380,679.8 384,308.8 382,597.6 372,294.1 Central Bank of Malaysia Merchant Banks RM Million 15,111.1 14,777.7 15,276.9 15,586.1 15,761.9 14,980.4 15,555.6 15,239.3 14,993.4 15,661.6 15,310.2 14,702.6 15,389.1 Central Bank of Malaysia
Savings Deposits RM Million 167,489.8 168,329.4 169,974.8 172,797.0 175,413.4 182,362.4 192,707.2 196,447.0 199,549.7 203,253.5 202,819.5 206,825.4 210,322.8 Central Bank of Malaysia Commercial Banks RM Million 123,107.9 123,447.7 124,749.7 126,434.4 127,811.4 131,934.8 137,678.4 140,576.9 143,138.6 145,717.7 145,746.6 148,421.6 150,835.8 Central Bank of Malaysia Islamic Banks RM Million 44,381.9 44,881.7 45,225.1 46,362.6 47,601.9 50,427.6 55,028.8 55,870.1 56,411.1 57,535.9 57,072.9 58,403.9 59,486.9 Central Bank of Malaysia
Overnight Policy Rate (OPR) Basis Point 3.0 3.0 3.0 2.8 2.8 2.5 2.5 2.0 2.0 1.8 1.8 1.8 1.8 Central Bank of MalaysiaAverage Lending/ Financing Rate
Commercial Banks % 4.8 4.7 4.7 4.6 4.6 4.4 4.3 4.0 3.9 3.7 3.6 3.6 3.5 Central Bank of Malaysia Islamic Banks % 5.2 5.2 5.1 5.0 5.0 4.8 4.7 4.4 4.4 4.2 4.2 4.2 4.1 Central Bank of Malaysia Merchant Banks % 6.6 6.6 6.5 6.5 6.4 6.4 6.3 6.2 6.1 5.9 5.9 5.8 5.9 Central Bank of Malaysia
Base Lending Rate (BLR) Commercial Banks % 6.7 6.7 6.7 6.5 6.5 6.3 6.3 5.8 5.8 5.5 5.5 5.5 5.5 Central Bank of Malaysia
Base Financing Rate (BFR) Islamic Banks % 6.8 6.8 6.8 6.6 6.6 6.3 6.3 5.8 5.8 5.6 5.6 5.6 5.6 Central Bank of Malaysia
Notep preliminary1 latest data until September 20202 published data from January 2020# provisional data based on External Trade Publications October 2020n.a. not available- not applicable

47MALAYSIAN ECONOMIC STATISTICS REVIEW - VOL. 8/2020 | 47
ECONOMIC INDICATORS - MONTHLY
Note:p preliminary1 latest data until September 20202 published data from January 2020# provisional data based on External Trade Publications October 2020n.a. not available- not applicable
Oct Nov Dec Jan Feb Mar Apr May Jun Jul Aug Sep Oct2020
DATA SOURCE2019
Annual Percentage Change (%)INDICATORS
Local Consumption
Industrial, Commercial and Mining p -0.7 0.5 -0.5 -2.0 5.2 -13.3 -29.2 -25.0 -8.3 -7.3 -5.1 -2.8 -2.6
Tenaga Nasional Berhad, Sabah Electricity Sdn. Bhd., Sarawak Energy Berhad, Pengeluar Tenaga Bebas
Domestic and Public Lighting p 3.6 4.1 1.7 4.7 2.4 5.1 6.5 39.6 6.7 5.9 5.3 6.3 11.2
Tenaga Nasional Berhad, Sabah Electricity Sdn. Bhd., Sarawak Energy Berhad, Pengeluar Tenaga Bebas
SERVICESWholesale & Retail TradeVolume Index
Wholesale Trade Index 4.4 4.9 5.4 5.3 4.9 -2.5 -27.5 -23.3 -7.7 -4.0 -3.4 -3.2 -0.8 Department of Statistics, MalaysiaRetail Trade Index 6.6 7.1 7.0 6.7 6.4 -7.5 -36.0 -18.0 -11.2 -5.2 -2.5 1.0 -2.8 Department of Statistics, MalaysiaMotor Vehicle Index 3.3 3.2 4.4 0.9 3.6 -14.4 -93.6 -49.9 -4.6 1.8 0.9 15.1 1.7 Department of Statistics, Malaysia
Motor VehicleVehicle Production
Passenger 10.1 -7.9 5.1 -15.9 3.2 -54.4 -99.5 -75.2 24.9 -2.0 8.0 17.9 5.5 Malaysian Automotive AssociationCommercial -17.6 -1.6 -25.6 -25.1 -22.3 -54.3 -99.0 -91.1 -29.4 -11.4 -13.0 -26.0 -0.4 Malaysian Automotive AssociationTotal 7.7 -7.5 2.1 -16.6 1.1 -54.4 -99.5 -76.1 21.5 -2.6 6.9 15.3 5.1 Malaysian Automotive Association
Vehicle SalesPassenger 15.6 10.1 16.2 -11.6 -0.1 -59.6 -99.7 -63.4 6.1 12.8 1.7 27.7 5.7 Malaysian Automotive AssociationCommercial -0.5 -1.7 -4.1 -16.5 19.9 -52.6 -99.8 -48.5 -6.5 16.5 19.9 14.2 -0.2 Malaysian Automotive AssociationTotal 14.0 8.9 13.8 -12.0 1.5 -59.0 -99.7 -62.2 5.0 13.2 3.2 26.4 5.2 Malaysian Automotive Association
New Vehicles Registration 6.2 11.6 16.8 -7.4 -46.9 -47.0 -98.6 -49.9 26.6 11.2 3.4 28.0 12.1 Road Transport Department Malaysia
TourismTourist Arrivals 1 -3.5 -1.0 -15.4 -1.4 -35.5 -71.3 -99.7 -99.7 -99.7 -99.2 -99.5 -99.2 n.a Tourism Malaysia
FinanceMoney Supply
M1 4.8 4.7 5.8 4.9 5.2 7.9 9.6 10.3 13.1 15.7 17.8 18.2 19.2 Central Bank of MalaysiaM2 3.2 2.8 3.5 3.8 3.7 3.8 4.5 4.9 6.1 6.5 6.9 6.8 5.6 Central Bank of MalaysiaM3 3.4 2.8 3.5 3.9 3.7 3.7 4.4 4.7 5.6 6.1 6.4 6.4 5.3 Central Bank of Malaysia
Total Loans in Banking System 3.7 3.7 3.9 3.5 3.9 4.0 4.0 3.9 4.1 4.5 4.4 4.4 4.3 Central Bank of Malaysia Commercial Banks 1.4 1.4 1.6 1.2 1.7 2.3 2.6 2.4 2.3 2.2 2.0 2.0 1.9 Central Bank of Malaysia Islamic Banks 8.4 8.3 8.3 8.0 8.2 7.4 7.0 6.9 7.7 8.8 8.8 8.8 8.8 Central Bank of Malaysia Merchant Banks 1.7 0.5 3.7 1.6 7.0 -5.1 -3.3 -2.7 -0.8 2.0 6.9 8.9 3.9 Central Bank of Malaysia
Total Deposits Banking System 3.5 2.6 2.9 2.9 2.8 2.7 2.8 2.8 4.4 4.5 4.5 5.2 4.4 Central Bank of Malaysia Commercial Banks 0.3 0.1 1.0 1.4 1.4 2.0 2.4 2.7 4.4 5.1 4.8 5.4 4.4 Central Bank of Malaysia Islamic Banks 12.4 10.0 8.2 7.2 6.9 4.9 4.4 3.9 5.2 3.7 4.4 5.0 4.4 Central Bank of Malaysia Merchant Banks -12.5 -17.6 -13.6 -14.1 -12.5 -11.8 -11.6 -14.8 -15.7 -7.5 -7.9 -3.4 0.3 Central Bank of Malaysia
Fixed Deposits, Tawarruq Fixed Deposits, Special and General Investment Deposits
5.3 4.0 2.8 2.5 2.2 -0.3 -1.5 -1.3 -1.0 -1.5 -2.1 -2.7 -3.9 Central Bank of Malaysia
Commercial Banks -0.1 -0.7 -1.1 -0.2 -0.1 -0.9 -1.1 -0.2 -0.1 0.4 -0.3 0.1 -0.7 Central Bank of Malaysia Islamic Banks 14.3 12.2 9.4 7.1 6.0 1.1 -2.3 -2.9 -2.1 -4.4 -4.8 -6.8 -8.6 Central Bank of Malaysia Merchant Banks -0.2 -7.6 -5.1 -4.1 -3.6 -7.3 -0.9 -4.9 -7.0 0.9 3.5 -0.7 1.8 Central Bank of Malaysia
Savings Deposits 7.0 7.1 8.0 6.6 8.0 12.8 17.3 18.0 21.0 22.6 21.4 23.8 25.6 Central Bank of Malaysia Commercial Banks 6.5 6.5 7.3 6.0 7.3 11.1 14.3 15.4 18.0 19.4 18.8 21.0 22.5 Central Bank of Malaysia Islamic Banks 8.4 8.9 9.9 8.4 9.9 17.3 25.7 25.2 29.6 31.3 28.5 31.5 34.0 Central Bank of Malaysia
Overnight Policy Rate (OPR) -0.3 -0.3 -0.3 -0.5 -0.5 -0.8 -0.8 -1.0 -1.0 -1.3 -1.3 -1.3 -1.3 Central Bank of MalaysiaAverage Lending/ Financing Rate
Commercial Banks -0.2 -0.3 -0.3 -0.4 -0.4 -0.6 -0.8 -0.9 -1.0 -1.1 -1.2 -1.1 -1.2 Central Bank of Malaysia Islamic Banks -0.1 -0.2 -0.2 -0.3 -0.4 -0.5 -0.7 -0.8 -0.9 -1.0 -1.0 -1.0 -1.1 Central Bank of Malaysia Merchant Banks 0.0 0.0 -0.1 0.3 -0.1 -0.2 -0.2 -0.3 -0.3 -0.5 -0.7 -0.7 -0.7 Central Bank of Malaysia
Base Lending Rate (BLR) Commercial Banks -0.2 -0.2 -0.2 -0.4 -0.4 -0.7 -0.7 -0.9 -1.0 -1.2 -1.2 -1.2 -1.2 Central Bank of Malaysia
Base Financing Rate (BFR) Islamic Banks -0.2 -0.2 -0.2 -0.5 -0.5 -0.7 -0.8 -1.0 -1.0 -1.2 -1.2 -1.2 -1.2 Central Bank of Malaysia
Notep preliminary1 latest data until September 20202 published data from January 2020# provisional data based on External Trade Publications October 2020n.a. not available- not applicable

48MALAYSIAN ECONOMIC STATISTICS REVIEW - VOL. 8/2020 | 48
ECONOMIC INDICATORS - MONTHLY
Note:p preliminary1 latest data until September 20202 published data from January 2020# provisional data based on External Trade Publications October 2020n.a. not available- not applicable
INDICATORS(Value) Oct Nov Dec Jan Feb Mar Apr May Jun Jul Aug Sep Oct
UNIT2019 2020
DATA SOURCE
Savings Deposits Interest Rate Commercial Banks % 1.0 1.0 1.0 0.9 0.9 0.8 0.8 0.6 0.6 0.5 0.5 0.5 0.5 Central Bank of Malaysia Islamic Banks % 0.7 0.7 0.6 0.6 0.6 0.5 0.5 0.5 0.4 0.4 0.4 0.4 0.4 Central Bank of Malaysia
Loans Approved by Sector Primary Agriculture RM Million 729.0 1,206.8 776.2 628.0 349.6 287.8 205.6 349.5 146.5 292.1 388.7 238.6 183.2 Central Bank of MalaysiaMining & Quarrying RM Million 132.2 246.7 69.0 224.5 475.6 92.9 46.7 500.8 159.2 35.4 37.2 246.4 30.0 Central Bank of MalaysiaManufacturing RM Million 3,161.4 2,660.6 4,924.6 2,956.2 2,618.4 3,134.1 2,388.0 2,115.7 3,363.8 2,433.1 1,556.1 1,831.5 2,633.0 Central Bank of MalaysiaServices RM Million 5,866.0 8,517.1 6,860.5 6,546.2 6,315.4 6,554.6 8,727.1 6,331.4 8,797.0 6,140.9 6,421.1 8,512.9 6,354.9 Central Bank of MalaysiaConstruction RM Million 2,184.2 2,764.2 1,777.6 1,623.0 1,856.8 1,746.8 824.0 1,198.9 1,581.4 2,270.0 1,999.5 2,309.6 2,041.9 Central Bank of MalaysiaReal Estate RM Million 1,982.4 2,037.6 2,902.2 1,618.7 1,656.7 1,737.4 1,334.5 1,060.6 1,714.9 996.8 1,026.5 874.0 1,857.1 Central Bank of MalaysiaHousehold Sector RM Million 19,573.8 17,798.8 16,267.9 15,737.9 15,860.9 13,870.6 4,321.9 6,602.6 13,862.2 19,311.3 19,215.9 21,158.9 21,072.2 Central Bank of MalaysiaOther Sector RM Million 298.6 420.1 157.1 204.0 691.7 104.8 344.7 26.4 618.7 511.2 57.3 120.7 21.7 Central Bank of MalaysiaTotal RM Million 33,927.6 35,651.8 33,735.1 29,538.5 29,825.2 27,529.1 18,192.5 18,185.8 30,243.7 31,990.8 30,702.4 35,292.6 34,194.0 Central Bank of Malaysia
Loans Disbursed by SectorPrimary Agriculture RM Million 2,969.1 3,405.2 6,270.1 3,628.9 3,279.8 3,391.6 3,060.1 2,832.6 3,137.6 3,364.9 2,964.2 3,080.0 2,895.9 Central Bank of MalaysiaMining & Quarrying RM Million 430.6 874.2 1,374.4 374.2 1,045.7 662.4 543.7 442.1 285.5 354.8 289.1 365.2 514.8 Central Bank of MalaysiaManufacturing RM Million 21,762.0 21,454.8 28,435.0 21,365.4 20,342.0 21,756.5 20,858.2 19,559.7 22,116.2 20,496.8 18,274.7 20,562.8 20,859.1 Central Bank of MalaysiaServices RM Million 30,742.7 31,799.9 36,291.1 34,787.3 31,585.6 38,586.1 27,876.1 27,255.5 37,287.1 32,867.2 27,403.0 32,189.2 32,660.3 Central Bank of MalaysiaConstruction RM Million 7,247.2 7,085.2 8,665.0 7,708.2 6,276.5 7,172.5 5,020.9 4,710.7 6,614.0 6,040.1 5,075.7 7,026.4 6,535.7 Central Bank of MalaysiaReal Estate RM Million 3,708.3 4,448.3 6,655.7 3,852.7 3,857.2 4,700.2 2,796.5 2,635.0 3,784.2 3,434.2 3,112.0 3,821.7 4,221.3 Central Bank of MalaysiaHousehold Sector RM Million 30,477.9 28,940.3 30,439.1 30,795.4 27,043.4 24,454.7 11,606.7 16,702.0 25,547.5 30,985.9 29,398.5 30,235.8 29,868.7 Central Bank of MalaysiaOther Sector RM Million 2,399.6 1,916.6 2,583.4 2,041.6 1,844.4 2,943.1 2,723.8 2,458.7 3,783.9 2,460.1 2,676.9 3,613.0 3,697.3 Central Bank of MalaysiaTotal RM Million 99,737.3 99,924.4 120,714.0 104,553.7 95,274.6 103,667.1 74,486.0 76,596.2 102,556.1 100,004.1 89,194.1 100,894.1 101,253.0 Central Bank of Malaysia
Loans Disbursed by Purpose Purchase of Passenger Cars RM Million 3,762.7 3,631.3 3,552.2 3,834.7 3,093.9 2,431.1 147.8 1,143.0 2,424.6 4,135.3 3,825.6 4,224.8 4,390.7 Central Bank of MalaysiaPersonal Uses RM Million 3,257.2 3,177.2 3,128.7 3,000.0 3,017.4 2,978.0 1,107.8 1,312.8 2,388.4 2,848.0 2,815.1 2,998.7 3,230.8 Central Bank of MalaysiaCredit Cards RM Million 12,945.4 12,960.3 14,392.9 13,525.0 11,467.7 10,103.2 6,543.8 9,116.9 10,738.3 11,980.2 12,037.2 11,889.8 11,078.1 Central Bank of MalaysiaPurchase of Consumer Durable Goods RM Million 1.7 1.9 2.3 4.3 2.2 1.7 1.5 1.4 2.3 1.4 2.0 2.9 2.9 Central Bank of Malaysia
Household Sector RM Million 30,477.9 28,940.3 30,439.1 30,795.4 27,043.4 24,454.7 11,606.7 16,702.0 25,547.5 30,985.9 29,398.5 30,235.8 29,868.7 Central Bank of MalaysiaOutstanding Loans to the Construction Sector RM Million 94,569.6 92,496.2 92,040.7 92,178.3 91,934.1 93,176.8 92,886.7 93,075.0 93,253.8 92,093.1 92,284.1 93,085.6 93,147.5 Central Bank of Malaysia
Non-Performing/Impaired Loans by SectorPrimary Agriculture RM Million 1,139.0 1,149.4 1,099.9 1,096.5 1,197.3 1,223.0 1,235.8 1,243.1 1,225.5 1,219.8 1,412.5 1,392.2 1,383.6 Central Bank of MalaysiaMining & Quarrying RM Million 468.7 454.6 449.7 446.4 271.6 274.1 267.0 267.5 264.8 263.6 262.6 261.0 131.5 Central Bank of MalaysiaManufacturing (Including Agro-Based) RM Million 3,917.2 3,793.1 3,504.7 3,452.3 3,707.6 3,880.8 3,910.6 4,264.8 3,873.4 3,856.0 3,849.0 3,995.6 4,008.0 Central Bank of Malaysia
Electricity, Gas and Water Supply RM Million 168.3 168.5 135.6 135.6 136.6 123.1 121.4 121.1 110.6 96.6 96.4 96.4 187.6 Central Bank of Malaysia
Wholesale & Retail Trade, and Restaurants & Hotels RM Million 2,418.2 2,390.3 2,180.8 2,226.6 2,229.6 2,233.7 2,274.6 2,315.5 2,297.7 2,307.5 2,218.5 2,129.5 2,155.2 Central Bank of Malaysia
Construction RM Million 2,712.8 2,673.0 2,723.2 2,852.0 2,757.0 2,640.5 2,639.5 2,559.3 2,374.8 2,358.9 2,339.6 2,386.0 2,392.5 Central Bank of MalaysiaTransport, Storage and Communication RM Million 2,238.8 2,229.5 1,935.0 1,935.0 2,030.9 2,034.5 2,026.4 1,742.6 1,807.2 1,868.1 1,821.5 1,887.9 1,814.7 Central Bank of Malaysia
Finance, Insurance and Business Activities RM Million 3,359.5 3,340.3 3,367.7 3,338.8 3,356.8 3,355.8 3,560.0 3,547.0 3,562.9 3,512.9 3,524.4 3,472.7 3,533.2 Central Bank of Malaysia
Education, Health & Others RM Million 382.6 384.6 461.1 464.1 468.7 470.6 485.5 519.7 510.2 519.2 519.4 509.2 510.1 Central Bank of MalaysiaHousehold Sector RM Million 10,848.3 10,936.5 10,728.1 11,065.9 11,151.5 11,458.4 11,014.9 10,594.8 9,892.7 9,384.1 9,019.1 8,713.9 9,554.2 Central Bank of MalaysiaOther Sector n.e.c RM Million 651.5 551.2 529.9 525.1 551.9 581.6 584.0 577.0 398.6 396.0 404.4 397.2 384.0 Central Bank of MalaysiaTotal Non-Performing/ Impaired Loans RM Million 28,304.9 28,071.0 27,115.6 27,538.3 27,859.4 28,275.9 28,119.7 27,752.4 26,318.4 25,782.7 25,467.5 25,241.5 26,054.7 Central Bank of Malaysia
OTHERSLABOUR
Labour Force ('000) 15,777.7 15,828.9 15,803.0 15,829.3 15,869.8 15,842.9 15,712.2 15,714.0 15,763.5 15,818.5 15,895.1 15,930.6 15,955.3 Department of Statistics, MalaysiaEmployed ('000) 15,265.6 15,315.0 15,286.0 15,317.6 15,344.5 15,232.4 14,933.4 14,887.9 14,990.2 15,073.4 15,153.5 15,193.1 15,207.1 Department of Statistics, MalaysiaUnemployed ('000) 512.1 513.9 517.0 511.7 525.2 610.5 778.8 826.1 773.2 745.1 741.6 737.5 748.2 Department of Statistics, Malaysia
Labour Force Participaton Rate % 68.7 68.8 68.9 68.9 68.7 68.6 68.1 68.0 68.1 68.1 68.4 68.4 68.5 Department of Statistics, MalaysiaUnemployment Rate % 3.2 3.2 3.3 3.2 3.3 3.9 5.0 5.3 4.9 4.7 4.7 4.6 4.7 Department of Statistics, Malaysia
Loss of Employment 2 Number of Cases n.a n.a n.a 5,778 4,562 5,262 6,143 10,084 18,579 16,660 9,261 7,388 7,416 Social Security OrganisationCOMPANIES REGISTRATION
Local Number 4,274 3,945 3,623 3,600 3,805 2,375 895 1,937 3,416 5,522 4,228 4,925 4,366 Companies Commission of MalaysiaForeign Number 3 2 3 3 2 0 0 0 2 4 1 5 2 Companies Commission of Malaysia
Notep preliminary1 latest data until September 20202 published data from January 2020# provisional data based on External Trade Publications October 2020n.a. not available- not applicable

49MALAYSIAN ECONOMIC STATISTICS REVIEW - VOL. 8/2020 | 49
ECONOMIC INDICATORS - MONTHLY
Note:p preliminary1 latest data until September 20202 published data from January 2020# provisional data based on External Trade Publications October 2020n.a. not available- not applicable
Oct Nov Dec Jan Feb Mar Apr May Jun Jul Aug Sep Oct2020
DATA SOURCE2019
Annual Percentage Change (%)INDICATORS
Savings Deposits Interest Rate Commercial Banks -0.1 -0.1 -0.1 -0.2 -0.2 -0.3 -0.3 -0.4 -0.4 -0.5 -0.5 -0.5 -0.5 Central Bank of Malaysia Islamic Banks -0.1 -0.1 -0.1 -0.2 -0.2 -0.2 -0.3 -0.3 -0.3 -0.4 -0.4 -0.4 -0.3 Central Bank of Malaysia
Loans Approved by Sector Primary Agriculture -60.8 8.7 95.9 -42.3 11.6 -56.2 -68.7 -84.2 -70.2 -37.3 18.9 -63.0 -74.9 Central Bank of MalaysiaMining & Quarrying 70.7 -43.2 75.6 -54.2 432.1 243.2 -76.8 -20.5 -56.4 -92.1 -73.1 -14.9 -77.3 Central Bank of MalaysiaManufacturing 4.2 -4.3 85.0 38.8 32.5 22.6 16.3 -60.6 103.0 -36.3 -51.6 -42.8 -16.7 Central Bank of MalaysiaServices -30.3 -8.2 -12.5 32.7 36.6 -29.1 4.0 -7.1 -14.9 -8.4 -11.4 26.9 8.3 Central Bank of MalaysiaConstruction -18.3 55.7 48.4 -13.6 -29.3 -44.0 -59.1 -42.7 -37.7 -15.0 -4.1 -14.3 -6.5 Central Bank of MalaysiaReal Estate -22.7 6.4 -14.8 -12.0 79.5 8.5 -36.0 -53.1 -5.9 -52.9 -57.4 -72.7 -6.3 Central Bank of MalaysiaHousehold Sector -3.0 3.3 4.6 -13.2 16.8 -23.2 -77.9 -67.7 -20.1 -7.8 -3.4 24.9 7.7 Central Bank of MalaysiaOther Sector 286.2 187.7 -40.7 -67.3 681.5 -59.7 17.6 -57.5 890.1 244.4 39.8 780.2 -92.7 Central Bank of MalaysiaTotal -12.8 2.8 7.6 -5.0 23.2 -22.5 -48.4 -54.4 -12.7 -14.3 -13.2 4.8 0.8 Central Bank of Malaysia
Loans Disbursed by SectorPrimary Agriculture -27.8 -7.1 61.2 -9.8 10.6 4.0 -10.3 -25.7 -18.7 8.4 -22.9 -11.4 -2.5 Central Bank of MalaysiaMining & Quarrying -46.8 163.1 43.5 -1.7 310.8 -38.3 -21.6 -16.2 -41.6 -26.8 -45.0 -61.8 19.6 Central Bank of MalaysiaManufacturing -0.2 10.0 34.9 -2.6 13.7 -2.2 5.2 -9.9 16.6 -12.6 -10.1 -0.3 -4.1 Central Bank of MalaysiaServices -20.2 -16.8 -20.8 -6.5 13.3 12.5 -18.8 -12.2 28.4 -2.7 -19.0 1.6 6.2 Central Bank of MalaysiaConstruction -10.5 4.5 8.4 4.7 16.6 -8.6 -32.8 -45.7 -17.4 -16.6 -35.7 -2.1 -9.8 Central Bank of MalaysiaReal Estate -23.9 21.7 6.0 -24.1 40.5 -35.8 -44.9 -47.9 -30.4 -5.2 -6.4 -32.1 13.8 Central Bank of MalaysiaHousehold Sector 5.9 4.8 0.8 -1.1 9.7 -18.4 -60.4 -43.2 -0.9 4.8 -0.2 12.2 -2.0 Central Bank of MalaysiaOther Sector -1.6 -38.9 -29.3 -37.3 -24.0 -11.7 -15.5 -22.5 14.7 6.6 -8.7 18.6 54.1 Central Bank of MalaysiaTotal -8.9 -2.9 0.7 -5.3 13.2 -5.2 -27.9 -25.9 8.1 -3.4 -12.7 1.4 1.5 Central Bank of Malaysia
Loans Disbursed by Purpose Purchase of Passenger Cars 6.4 16.2 14.1 5.6 6.5 -34.8 -95.9 -71.1 -23.8 6.9 4.8 34.8 16.7 Central Bank of MalaysiaPersonal Uses 4.6 14.9 3.6 4.3 33.0 4.2 -59.0 -55.1 -3.6 -10.6 -12.5 2.0 -0.8 Central Bank of MalaysiaCredit Cards 6.7 6.6 7.3 3.1 8.0 -18.1 -45.9 -28.2 -8.7 -5.4 -5.6 -3.7 -14.4 Central Bank of MalaysiaPurchase of Consumer Durable Goods -37.6 -10.9 -1.5 140.1 0.9 -12.0 -29.2 -58.9 8.1 -46.4 -11.2 53.9 72.6 Central Bank of Malaysia
Household Sector 5.9 4.8 0.8 -1.1 9.7 -18.4 -60.4 -43.2 -0.9 4.8 -0.2 12.2 -2.0 Central Bank of MalaysiaOutstanding Loans to the Construction Sector 8.0 4.3 3.2 3.7 3.0 2.7 3.8 1.9 -0.9 -1.0 -2.1 -1.6 -1.5 Central Bank of Malaysia
Non-Performing/Impaired Loans by SectorPrimary Agriculture 586.4 598.3 554.3 352.1 295.1 381.8 5.9 4.7 -1.5 -1.8 17.5 21.8 21.5 Central Bank of MalaysiaMining & Quarrying -31.1 -28.7 -16.2 -17.0 -49.8 -51.4 -50.8 -50.6 -49.3 -49.3 -48.6 -48.2 -71.9 Central Bank of MalaysiaManufacturing (Including Agro-Based) 36.4 45.7 40.1 36.9 51.3 55.2 60.5 71.7 12.9 6.2 -2.2 2.7 2.3 Central Bank of Malaysia
Electricity, Gas and Water Supply -12.5 -12.8 27.3 27.6 21.6 9.4 9.8 7.8 -24.9 -34.0 -42.9 -43.0 11.5 Central Bank of Malaysia
Wholesale & Retail Trade, and Restaurants & Hotels -5.1 -4.1 -5.4 -5.4 -6.5 -5.3 -5.4 0.2 2.3 2.4 -5.2 -11.8 -10.9 Central Bank of Malaysia
Construction 16.4 15.5 11.6 15.5 -9.2 5.8 6.9 9.3 -2.2 -5.9 -8.7 -4.6 -11.8 Central Bank of MalaysiaTransport, Storage and Communication -7.9 -6.0 -15.8 -11.0 -7.4 -7.3 -9.9 -25.4 -22.4 -18.7 -20.4 -16.4 -18.9 Central Bank of Malaysia
Finance, Insurance and Business Activities -6.8 -6.4 -10.3 -10.5 -9.9 -7.1 -4.9 -6.7 0.5 1.4 5.3 0.5 5.2 Central Bank of Malaysia
Education, Health & Others -0.8 -1.5 -4.4 -2.0 -2.0 0.6 1.6 9.5 37.7 39.6 42.3 33.7 33.3 Central Bank of MalaysiaHousehold Sector 5.7 5.2 8.1 10.8 9.1 14.2 11.1 4.9 -3.6 -10.1 -14.1 -19.5 -11.9 Central Bank of MalaysiaOther Sector n.e.c -10.2 -24.3 -27.0 -28.2 -24.0 -18.2 -17.1 -18.5 -43.5 -45.4 -43.6 -37.5 -41.1 Central Bank of MalaysiaTotal Non-Performing/ Impaired Loans 8.0 8.5 7.4 8.7 6.5 11.8 7.3 5.1 -3.3 -6.6 -8.8 -10.4 -8.0 Central Bank of Malaysia
OTHERSLABOUR
Labour Force 2.1 2.4 2.0 2.1 2.1 1.8 0.6 0.5 0.7 0.7 1.2 1.1 1.1 Department of Statistics, MalaysiaEmployed 2.2 2.5 2.0 2.2 2.1 1.3 -1.0 -1.6 -1.0 -0.7 -0.2 -0.2 -0.4 Department of Statistics, MalaysiaUnempolyed -0.2 -0.4 0.5 -0.8 1.7 17.1 48.8 58.9 48.3 42.0 42.6 41.4 46.1 Department of Statistics, Malaysia
Labour Force Participaton Rate - - - - - - - - - - - - - Department of Statistics, MalaysiaUnemployment Rate - - - - - - - - - - - - - Department of Statistics, Malaysia
Loss of Employment 2 n.a n.a n.a 15.6 60.2 67.4 72.0 221.5 649.8 316.6 218.6 135.9 117.0 Social Security OrganisationCOMPANIES REGISTRATION
Local -9.2 0.1 5.5 -12.5 37.3 -39.8 -81.2 -52.5 9.1 30.7 -2.8 31.1 2.2 Companies Commission of MalaysiaForeign 50.0 -60.0 0.0 -62.5 -50.0 -100.0 -100.0 -100.0 100.0 33.3 -50.0 0.0 -33.3 Companies Commission of Malaysia
Notep preliminary1 latest data until September 20202 published data from January 2020# provisional data based on External Trade Publications October 2020n.a. not available- not applicable

50MALAYSIAN ECONOMIC STATISTICS REVIEW - VOL. 8/2020 | 50
ECONOMIC INDICATORS - MONTHLY
Note:p preliminary1 latest data until September 20202 published data from January 2020# provisional data based on External Trade Publications October 2020n.a. not available- not applicable
INDICATORS(Value) Oct Nov Dec Jan Feb Mar Apr May Jun Jul Aug Sep Oct
UNIT2019 2020
DATA SOURCE
STOCK MARKETKuala Lumpur Composite Index Point 1,598.0 1,561.7 1,588.8 1,531.1 1,482.6 1,350.9 1,407.8 1,473.3 1,501.0 1,603.8 1,525.2 1,504.8 1,466.9 Bursa MalaysiaValue Traded RM Billion 41.9 43.6 45.4 44.2 52.8 65.6 58.6 70.4 98.1 121.9 136.9 100.6 91.7 Bursa MalaysiaMarket Capitalisation RM Billion 1,691.5 1,668.2 1,711.8 1,646.4 1,590.7 1,379.2 1,470.3 1,574.8 1,579.6 1,703.4 1,676.2 1,638.7 1,622.2 Bursa Malaysia
EXCHANGE RATEUSD - U.S. Dollar RM per Unit 4.1879 4.1590 4.1485 4.0797 4.1634 4.2964 4.3553 4.3418 4.2755 4.2657 4.1907 4.1507 4.1527 Central Bank of MalaysiaGBP - U.K. Pound RM per Unit 5.2824 5.3593 5.4393 5.3343 5.3995 5.3174 5.4047 5.3357 5.3522 5.3901 5.4980 5.3870 5.3884 Central Bank of MalaysiaSDR - Special Drawing Right RM per Unit 5.7434 5.7188 5.7145 5.6315 5.7058 5.9022 5.9400 5.9192 5.8954 5.9272 5.9075 5.8614 5.8724 Central Bank of MalaysiaSGD - Singapore Dollar RM per Unit 3.0542 3.0545 3.0566 3.0204 2.9959 3.0329 3.0586 3.0615 3.0667 3.0722 3.0579 3.0390 3.0548 Central Bank of MalaysiaEUR - EURO RM per Unit 4.6260 4.5978 4.6096 4.5321 4.5408 4.7594 4.7354 4.7335 4.8120 4.8790 4.9537 4.8946 4.8876 Central Bank of MalaysiaCHF - Swiss Franc RM per 100 Units 421.5200 418.9805 421.7354 420.6020 426.3317 449.0410 448.8177 447.8378 449.1644 455.8067 459.9745 453.7500 454.9800 Central Bank of MalaysiaJPY - Japanese Yen RM per 100 Units 3.8734 3.8216 3.8010 3.7321 3.7834 4.0015 4.0398 4.0505 3.9774 3.9914 3.9508 3.9301 3.9448 Central Bank of MalaysiaHKD - Hong Kong Dollar RM per 100 Units 53.4041 53.1203 53.1472 52.4788 53.5511 55.3300 56.1859 56.0110 55.1642 55.0346 54.0714 53.5560 53.5820 Central Bank of Malaysia
SELECTED COUNTRIES TRADE
ExportsMalaysia # RM Billion 90.9 80.9 86.4 84.1 74.5 80.1 64.8 62.6 82.8 92.6 79.1 88.9 91.1 Department of Statistics, MalaysiaSingapore SGD Billion 46.8 45.8 45.1 42.1 40.8 43.8 38.5 35.5 39.7 41.7 43.0 42.6 42.8 Statistics SingaporeChina USD Billion 212.9 221.5 238.3 n.a 292.4 185.2 200.3 206.8 213.6 237.6 235.3 239.8 237.2 National Bureau of Statistics of ChinaJapan JPY Billion 6,577.1 6,379.0 6,577.1 5,431.2 6,321.3 6,358.1 5,202.3 4,184.8 4,862.0 5,368.9 5,232.7 6,055.1 6,566.1 Statistics Bureau of JapanEU USD Billion 199.4 172.7 172.8 166.5 170.7 167.4 125.4 129.8 154.4 168.5 139.7 171.0 178.9 European StatisticsUSA USD Billion 142.4 136.9 135.3 129.0 132.2 134.6 95.8 90.5 105.1 112.8 118.0 121.5 132.5 United States Census Bureau
ImportsMalaysia # RM Billion 73.3 74.3 73.9 72.1 61.8 67.8 68.4 52.3 62.0 67.4 65.9 67.0 68.9 Department of Statistics, MalaysiaSingapore SGD Billion 42.3 42.5 41.6 41.2 39.5 40.4 35.9 31.5 35.1 37.8 36.5 38.8 38.3 Statistics SingaporeChina USD Billion 169.9 183.9 191.1 n.a 299.5 165.2 154.9 143.9 167.2 175.3 176.3 202.8 178.7 National Bureau of Statistics of ChinaJapan JPY Billion 6,564.2 6,464.2 6,729.6 6,744.4 5,214.7 6,352.6 6,132.7 5,018.2 5,130.9 5,357.2 4,984.4 5,380.1 5,693.2 Statistics Bureau of JapanEU USD Billion 175.9 170.1 149.4 169.0 148.3 145.2 125.1 122.6 133.7 142.6 128.3 146.5 150.8 European StatisticsUSA USD Billion 219.4 199.5 202.3 196.4 178.3 194.4 165.5 163.9 179.7 200.8 203.5 206.4 219.5 United States Census Bureau
INDUSTRIAL PRODUCTION INDEX Malaysia Point 117.8 116.6 117.4 118.1 110.2 110.0 76.5 90.9 114.8 116.2 114.7 115.3 117.3 Department of Statistics, Malaysia
Singapore Point 106.7 89.4 97.8 110.5 87.7 117.2 117.4 88.6 98.4 102.7 109.0 127.4 105.7 Singapore Economic Development Board (EDB)
South Korea Point 111.6 111.1 114.8 102.3 99.7 113.8 101.5 97.7 105.0 107.5 100.3 112.5 109.2 Moody's Analytics, South Korea
Japan Point 100.4 99.4 100.7 93.5 94.6 105.3 85.8 72.2 82.9 90.4 80.0 95.6 97.2 Ministry of Economy, Trade and Industry, Japan
USA Point 109.0 110.0 109.7 109.2 109.3 104.5 91.3 91.9 97.6 101.7 102.5 102.1 103.2 Federal Reserve Board, USA
RETAIL TRADE INDEX Malaysia Point 139.5 143.3 149.6 147.7 141.4 126.8 82.6 109.7 130.4 138.8 139.0 136.1 135.6 Department of Statistics, MalaysiaSingapore Point 97.6 100.3 116.5 109.9 80.6 85.9 61.0 53.1 70.8 88.3 89.9 83.0 86.8 Singapore Department of Statistics
Hong Kong Point 72.9 72.5 88.5 92.3 54.2 55.0 57.9 65.1 64.5 64.3 61.9 63.1 66.1 Census and Statistics Department, Hong Kong Special Administrative Region
United Kingdom Point 103.7 112.6 128.4 93.5 94.9 92.6 77.4 88.2 99.9 105.6 103.2 104.0 110.2 Office for National Statistics
CONSUMER PRICE INDEX Malaysia Point 122.0 122.1 122.3 122.4 122.4 120.9 117.6 117.9 119.1 119.9 120.1 120.1 120.2 Department of Statistics, MalaysiaThailand Point 102.7 102.6 102.6 102.8 102.7 101.8 99.8 99.8 101.3 102.0 102.3 102.2 102.2 Trading EconomicsIndonesia Point 103.4 103.6 103.9 104.3 104.6 104.7 104.8 104.9 105.1 105.0 104.9 104.9 104.9 Trading EconomicsPhilippines Point 120.8 121.1 121.9 122.6 122.4 122.3 122.2 122.3 122.9 123.5 123.3 123.4 123.8 Trading EconomicsSingapore Point 99.9 100.3 100.4 100.2 100.3 99.9 99.0 99.5 99.5 99.2 99.8 100.1 99.7 Trading Economics
PRODUCER PRICE INDEXMalaysia Point 105.1 106.5 107.4 107.3 105.9 102.7 99.9 99.7 100.3 100.7 101.7 101.2 101.3 Department of Statistics, MalaysiaPhilippines Point 133.6 133.2 132.9 132.4 132.4 132.4 131.5 131.0 130.5 130.6 129.6 129.6 129.2 Trading EconomicsSingapore Point 96.8 95.9 95.2 95.6 95.2 89.3 82.6 84.0 86.4 88.6 88.1 88.5 88.8 Trading EconomicsSouth Korea Point 103.6 103.4 103.7 104.1 103.7 102.8 101.9 102.0 102.5 102.7 103.2 103.4 102.9 Trading EconomicsChina Point 108.3 108.3 108.2 108.2 107.7 106.6 105.2 104.8 105.2 105.6 105.9 106.0 106.0 Trading EconomicsJapan Point 102.0 102.1 102.3 102.3 101.9 101.0 99.4 98.9 99.6 100.2 100.3 100.1 99.9 Trading EconomicsUSA Point 118.7 118.6 118.9 119.2 118.6 118.1 116.6 117.2 117.5 118.2 118.4 118.9 119.3 Trading Economics
Notep preliminary1 latest data until September 20202 published data from January 2020# provisional data based on External Trade Publications October 2020n.a. not available- not applicable

51MALAYSIAN ECONOMIC STATISTICS REVIEW - VOL. 8/2020 | 51
ECONOMIC INDICATORS - MONTHLY
Note:p preliminary1 latest data until September 20202 published data from January 2020# provisional data based on External Trade Publications October 2020n.a. not available- not applicable
Oct Nov Dec Jan Feb Mar Apr May Jun Jul Aug Sep Oct2020
DATA SOURCE2019
Annual Percentage Change (%)INDICATORS
STOCK MARKETKuala Lumpur Composite Index -6.5 -7.0 -6.0 -9.1 -13.2 -17.8 -14.3 -10.8 -10.2 -1.9 -5.4 -5.0 -8.2 Bursa MalaysiaValue Traded -15.4 -2.1 30.8 0.3 37.2 9.4 12.0 56.5 177.6 165.5 240.8 203.9 118.9 Bursa MalaysiaMarket Capitalisation -2.0 -2.6 0.7 -4.8 -9.5 -20.3 -15.9 -8.8 -9.9 -1.3 -0.8 -2.1 -4.1 Bursa Malaysia
EXCHANGE RATEUSD - U.S. Dollar -0.7 0.7 0.6 0.9 -2.1 -5.1 -5.5 -3.9 -2.7 -3.3 -0.1 0.8 0.8 Central Bank of MalaysiaGBP - U.K. Pound 2.5 0.8 -2.8 -0.5 -1.9 1.1 -0.8 0.6 -1.5 -4.4 -7.4 -4.0 -2.0 Central Bank of MalaysiaSDR - Special Drawing Right 0.7 1.3 1.1 1.8 -0.7 -3.8 -3.8 -2.6 -2.2 -3.8 -2.6 -2.4 -2.2 Central Bank of MalaysiaSGD - Singapore Dollar -1.3 -0.4 -0.4 0.5 0.4 -0.7 -0.8 -0.6 -0.4 -1.3 -1.1 -0.2 0.0 Central Bank of MalaysiaEUR - EURO 3.3 3.5 3.0 3.8 1.8 -3.1 -2.4 -1.4 -2.3 -5.1 -6.0 -5.9 -5.4 Central Bank of MalaysiaCHF - Swiss Franc -0.6 -0.2 -0.3 -1.0 -4.6 -9.2 -9.0 -7.9 -6.3 -8.3 -7.1 -6.9 -7.4 Central Bank of MalaysiaJPY - Japanese Yen -4.9 -3.4 -2.3 1.3 -2.5 -8.3 -8.8 -6.4 -3.1 -4.5 -0.3 -0.9 -1.8 Central Bank of MalaysiaHKD - Hong Kong Dollar -0.7 0.7 0.4 0.0 -3.0 -6.1 -6.7 -5.1 -3.6 -4.0 -1.2 -0.3 -0.3 Central Bank of Malaysia
SELECTED COUNTRIES TRADE
ExportsMalaysia # -6.4 -5.4 2.8 -2.6 10.0 -6.5 -24.9 -26.0 8.0 3.1 -2.9 13.6 0.2 Department of Statistics, MalaysiaSingapore -9.3 -6.0 3.6 -5.4 2.4 -1.0 -12.8 -24.0 -4.3 -8.1 -4.8 -2.1 -8.6 Statistics SingaporeChina -0.9 -1.3 7.6 n.a 116.3 -6.8 3.5 -3.3 0.6 7.2 9.5 9.9 11.4 National Bureau of Statistics of ChinaJapan -9.2 -7.9 -6.3 -2.6 -1.0 -11.7 -21.9 -28.3 -26.2 -19.2 -14.8 -4.9 -0.2 Statistics Bureau of JapanEU 5.6 -0.1 6.2 0.4 1.0 -10.2 -28.2 -29.7 -9.6 -11.3 -14.0 -3.8 -10.3 European StatisticsUSA -3.2 -2.0 0.8 -0.5 1.7 -9.4 -29.0 -36.3 -23.8 -15.3 -14.7 -9.5 -7.0 United States Census Bureau
ImportsMalaysia # -8.7 -3.6 1.0 -2.5 11.3 -2.7 -8.0 -30.4 -5.6 -8.7 -6.5 -3.6 -6.0 Department of Statistics, MalaysiaSingapore -10.3 -5.8 -2.3 -0.9 9.4 0.2 -13.1 -26.2 -9.9 -10.0 -11.0 -1.6 -9.3 Statistics SingaporeChina -6.4 0.3 16.3 n.a -4.0 -0.9 -14.2 -16.7 2.7 -0.9 -2.1 13.2 5.2 National Bureau of Statistics of ChinaJapan -14.8 -15.7 -4.9 -3.5 -13.9 -5.0 -7.2 -26.2 -14.4 -22.3 -20.8 -17.2 -13.3 Statistics Bureau of JapanEU -0.1 -3.8 1.0 -0.2 -2.8 -12.2 -22.7 -26.2 -12.8 -16.0 -15.6 -8.9 -14.3 European StatisticsUSA -7.1 -6.8 -2.3 -4.0 -4.0 -6.5 -20.9 -25.7 -13.3 -8.2 -5.7 -0.2 0.0 United States Census Bureau
INDUSTRIAL PRODUCTION INDEX Malaysia 0.1 2.1 1.3 0.6 6.2 -4.9 -32.0 -21.6 -0.4 1.2 0.2 1.0 -0.5 Department of Statistics, Malaysia
Singapore 3.9 -12.3 -3.7 3.4 -1.0 21.1 11.7 -8.3 -6.4 -7.6 15.5 25.6 -0.9 Singapore Economic Development Board (EDB)
South Korea -2.1 -0.3 6.2 -2.8 11.3 7.7 -5.0 -9.7 -0.6 -2.4 -2.6 8.1 -2.2 Moody's Analytics, South Korea
Japan -7.7 -8.2 -3.1 -2.3 -5.7 -5.2 -15.0 -26.3 -18.2 -15.5 -13.8 -9.0 -3.2 Ministry of Economy, Trade and Industry, Japan
USA -0.8 -0.5 -0.9 -0.8 -0.3 -4.7 -16.3 -15.8 -10.7 -6.8 -6.7 -6.8 -5.3 Federal Reserve Board, USA
RETAIL TRADE INDEX Malaysia 6.6 7.1 7.0 6.7 6.4 -7.5 -36.0 -18.0 -11.2 -5.2 -2.5 1.0 -2.8 Department of Statistics, MalaysiaSingapore -1.1 -2.3 -1.0 -1.0 -11.1 -11.4 -33.9 -45.9 -24.9 -8.5 -9.0 -12.8 -11.1 Singapore Department of Statistics
Hong Kong -26.4 -25.5 -21.1 -23.1 -46.7 -44.0 -37.5 -34.0 -25.3 -23.8 -13.3 -13.4 -9.3Census and Statistics Department, Hong Kong Special Administrative Region
United Kingdom -1.5 -4.4 0.6 2.9 1.7 -3.0 -18.9 -8.8 1.7 0.6 2.4 4.4 6.3 Office for National Statistics
CONSUMER PRICE INDEX Malaysia 1.1 0.9 1.0 1.6 1.3 -0.2 -2.9 -2.9 -1.9 -1.3 -1.4 -1.4 -1.5 Department of Statistics, MalaysiaThailand 0.1 0.2 0.9 1.1 0.7 -0.5 -3.0 -3.4 -1.6 -1.0 -0.5 -0.7 -0.5 Trading EconomicsIndonesia 3.1 3.0 2.7 2.7 3.0 3.0 2.7 2.2 2.0 1.5 1.3 1.4 1.4 Trading EconomicsPhilippines 0.8 1.3 2.5 2.9 2.6 2.5 2.2 2.1 2.5 2.7 2.4 2.3 2.5 Trading EconomicsSingapore 0.5 0.6 0.8 0.8 0.3 0.0 -0.7 -0.8 -0.5 -0.4 -0.4 0.0 -0.2 Trading Economics
PRODUCER PRICE INDEXMalaysia -2.9 1.2 3.5 2.8 0.9 -1.9 -5.1 -5.5 -4.0 -3.5 -2.8 -3.9 -3.6 Department of Statistics, MalaysiaPhilippines -0.9 0.4 0.6 -5.3 -4.6 -5.1 -3.3 -3.7 -3.9 -3.0 -4.7 -3.9 n.a Trading EconomicsSingapore -7.7 -5.0 -1.1 0.6 -1.5 -9.3 -15.0 -14.6 -9.6 -8.4 -9.3 -10.5 -9.6 Trading EconomicsSouth Korea -0.7 -0.1 0.7 1.1 0.7 -0.5 -1.7 -1.8 -0.9 -0.8 -0.5 -0.4 -0.6 Trading EconomicsChina -1.6 -1.4 -0.5 0.1 -0.4 -1.5 -3.1 -3.7 -3.0 -2.4 -2.0 -2.1 -2.1 Trading EconomicsJapan -0.3 0.2 0.9 1.5 0.8 -0.4 -2.4 -2.7 -1.6 -0.9 -0.6 -0.8 -2.1 Trading EconomicsUSA 1.0 1.0 1.4 2.0 1.1 0.3 -1.5 -0.8 -0.8 -0.4 -0.2 0.4 0.5 Trading Economics
Notep preliminary1 latest data until September 20202 published data from January 2020# provisional data based on External Trade Publications October 2020n.a. not available- not applicable
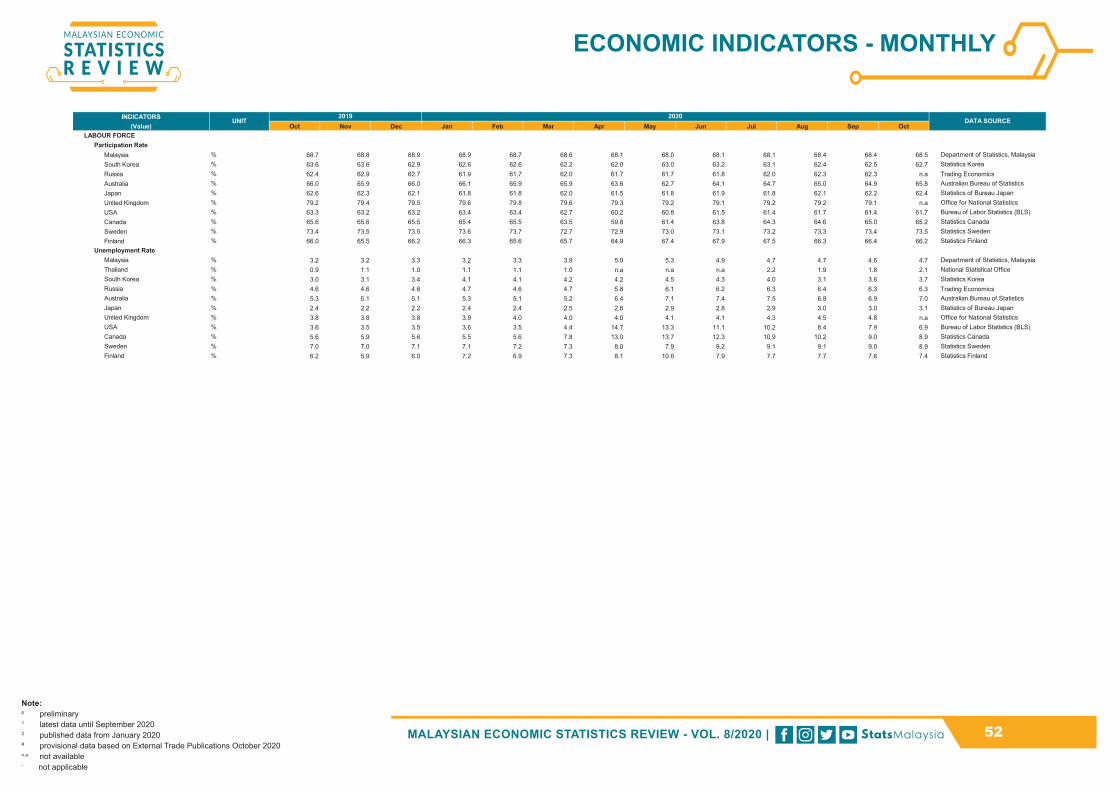
52MALAYSIAN ECONOMIC STATISTICS REVIEW - VOL. 8/2020 | 52
ECONOMIC INDICATORS - MONTHLY
Note:p preliminary1 latest data until September 20202 published data from January 2020# provisional data based on External Trade Publications October 2020n.a. not available- not applicable
INDICATORS(Value) Oct Nov Dec Jan Feb Mar Apr May Jun Jul Aug Sep Oct
UNIT2019 2020
DATA SOURCE
LABOUR FORCEParticipation Rate
Malaysia % 68.7 68.8 68.9 68.9 68.7 68.6 68.1 68.0 68.1 68.1 68.4 68.4 68.5 Department of Statistics, MalaysiaSouth Korea % 63.6 63.6 62.9 62.6 62.6 62.2 62.0 63.0 63.2 63.1 62.4 62.5 62.7 Statistics Korea Russia % 62.4 62.9 62.7 61.9 61.7 62.0 61.7 61.7 61.8 62.0 62.3 62.3 n.a Trading EconomicsAustralia % 66.0 65.9 66.0 66.1 65.9 65.9 63.6 62.7 64.1 64.7 65.0 64.9 65.8 Australian Bureau of StatisticsJapan % 62.6 62.3 62.1 61.8 61.8 62.0 61.5 61.8 61.9 61.8 62.1 62.2 62.4 Statistics of Bureau JapanUnited Kingdom % 79.2 79.4 79.5 79.6 79.8 79.6 79.3 79.2 79.1 79.2 79.2 79.1 n.a Office for National StatisticsUSA % 63.3 63.2 63.2 63.4 63.4 62.7 60.2 60.8 61.5 61.4 61.7 61.4 61.7 Bureau of Labor Statistics (BLS)Canada % 65.6 65.6 65.5 65.4 65.5 63.5 59.8 61.4 63.8 64.3 64.6 65.0 65.2 Statistics CanadaSweden % 73.4 73.5 73.5 73.6 73.7 72.7 72.9 73.0 73.1 73.2 73.3 73.4 73.5 Statistics SwedenFinland % 66.0 65.5 66.2 66.3 65.6 65.7 64.9 67.4 67.9 67.5 66.3 66.4 66.2 Statistics Finland
Unemployment Rate Malaysia % 3.2 3.2 3.3 3.2 3.3 3.9 5.0 5.3 4.9 4.7 4.7 4.6 4.7 Department of Statistics, MalaysiaThailand % 0.9 1.1 1.0 1.1 1.1 1.0 n.a n.a n.a 2.2 1.9 1.8 2.1 National Statistical OfficeSouth Korea % 3.0 3.1 3.4 4.1 4.1 4.2 4.2 4.5 4.3 4.0 3.1 3.6 3.7 Statistics Korea Russia % 4.6 4.6 4.6 4.7 4.6 4.7 5.8 6.1 6.2 6.3 6.4 6.3 6.3 Trading EconomicsAustralia % 5.3 5.1 5.1 5.3 5.1 5.2 6.4 7.1 7.4 7.5 6.8 6.9 7.0 Australian Bureau of StatisticsJapan % 2.4 2.2 2.2 2.4 2.4 2.5 2.6 2.9 2.8 2.9 3.0 3.0 3.1 Statistics of Bureau JapanUnited Kingdom % 3.8 3.8 3.8 3.9 4.0 4.0 4.0 4.1 4.1 4.3 4.5 4.8 n.a Office for National StatisticsUSA % 3.6 3.5 3.5 3.6 3.5 4.4 14.7 13.3 11.1 10.2 8.4 7.9 6.9 Bureau of Labor Statistics (BLS)Canada % 5.6 5.9 5.6 5.5 5.6 7.8 13.0 13.7 12.3 10.9 10.2 9.0 8.9 Statistics CanadaSweden % 7.0 7.0 7.1 7.1 7.2 7.3 8.0 7.9 9.2 9.1 9.1 9.0 8.9 Statistics SwedenFinland % 6.2 5.9 6.0 7.2 6.9 7.3 8.1 10.6 7.9 7.7 7.7 7.6 7.4 Statistics Finland
Notep preliminary1 latest data until September 20202 published data from January 2020# provisional data based on External Trade Publications October 2020n.a. not available- not applicable

53MALAYSIAN ECONOMIC STATISTICS REVIEW - VOL. 8/2020 | 53
ECONOMIC INDICATORS - MONTHLY
Note:p preliminary1 latest data until September 20202 published data from January 2020# provisional data based on External Trade Publications October 2020n.a. not available- not applicable
Oct Nov Dec Jan Feb Mar Apr May Jun Jul Aug Sep Oct2020
DATA SOURCE2019
Annual Percentage Change (%)INDICATORS
LABOUR FORCEParticipation Rate
Malaysia - - - - - - - - - - - - - Department of Statistics, MalaysiaSouth Korea - - - - - - - - - - - - - Statistics Korea Russia - - - - - - - - - - - - - Trading EconomicsAustralia - - - - - - - - - - - - - Australian Bureau of StatisticsJapan - - - - - - - - - - - - - Statistics of Bureau JapanUnited Kingdom - - - - - - - - - - - - - Office for National StatisticsUSA - - - - - - - - - - - - - Bureau of Labor Statistics (BLS)Canada - - - - - - - - - - - - - Statistics CanadaSweden - - - - - - - - - - - - - Statistics SwedenFinland - - - - - - - - - - - - - Statistics Finland
Unemployment Rate Malaysia - - - - - - - - - - - - - Department of Statistics, MalaysiaThailand - - - - - - - - - - - - - National Statistical OfficeSouth Korea - - - - - - - - - - - - - Statistics Korea Russia - - - - - - - - - - - - - Trading EconomicsAustralia - - - - - - - - - - - - - Australian Bureau of StatisticsJapan - - - - - - - - - - - - - Statistics of Bureau JapanUnited Kingdom - - - - - - - - - - - - - Office for National StatisticsUSA - - - - - - - - - - - - - Bureau of Labor Statistics (BLS)Canada - - - - - - - - - - - - - Statistics CanadaSweden - - - - - - - - - - - - - Statistics SwedenFinland - - - - - - - - - - - - - Statistics Finland
Notep preliminary1 latest data until September 20202 published data from January 2020# provisional data based on External Trade Publications October 2020n.a. not available- not applicable

54MALAYSIAN ECONOMIC STATISTICS REVIEW - VOL. 8/2020 | 54
ECONOMIC INDICATORS - QUARTERLY
Note:p preliminary1 latest data until Third Quarter 2020 # provisional data based on External Trade Publications October 2020n.a. not available- not applicable
Q3 Q4 Q1 Q2 Q3 Q3 Q4 Q1 Q2 Q3
GROSS DOMESTIC PRODUCTConstant 2015 Prices RM Million 360,513.0 370,128.0 344,142.5 289,434.3 350,940.2 4.4 3.6 0.7 -17.1 -2.7 Department of Statistics, Malaysia
COMMODITIESRUBBER
ExportsNatural Rubber # Tonne 171,210.0 148,604.0 142,877.0 112,963.0 136,764.0 2.8 -4.3 -0.9 -32.5 -20.1 Department of Statistics, Malaysia
OIL PALMExports
Oil Palm Product Tonne 7,047,278.0 6,864,693.0 5,653,777.0 6,471,401.0 7,495,013.0 17.1 5.0 -18.4 -8.1 6.4 Malaysian Palm Oil Board Palm Oil Tonne 4,631,790.0 4,445,660.0 3,480,658.0 4,312,426.0 4,973,473.0 18.3 2.5 -24.8 -9.5 7.4 Malaysian Palm Oil Board Palm Kernel Tonne 267,467.0 283,699.0 248,710.0 255,368.0 337,677.0 23.5 19.0 -4.7 -6.9 26.2 Malaysian Palm Oil Board
CRUDE PETROLEUMPrices
Crude Oil, Brent USD/Barrel 61.86 62.65 50.53 31.43 42.72 -18.0 -7.0 -20.1 -54.0 -30.9 World BankCrude Oil, WTI USD/Barrel 56.44 56.95 45.98 27.79 40.90 -19.0 -3.1 -16.2 -53.5 -27.5 World Bank
ExportsCrude Petroleum # '000 Tonne 2,568,253.8 3,122,635.4 2,962,372.0 2,508,004.0 4,428,156.6 -39.5 -24.8 -12.9 -25.4 72.4 Department of Statistics, MalaysiaPetroleum Products # '000 Tonne 7,125,312.4 7,495,369.4 8,679,432.8 9,350,694.1 8,206,238.5 4.7 3.8 47.4 22.7 15.2 Department of Statistics, Malaysia
ImportsCrude Petroleum # '000 Tonne 3,363,741.5 2,561,314.0 4,968,985.1 2,139,904.5 2,829,702.3 26.0 4.5 46.9 -38.3 -15.9 Department of Statistics, MalaysiaPetroleum Products # '000 Tonne 7,432,420.9 8,570,407.2 8,678,445.0 8,340,166.8 10,818,238.5 -5.4 -8.0 23.9 1.0 45.6 Department of Statistics, Malaysia
LIQUIFIED NATURAL GAS (LNG)Exports
Liquified Natural Gas # '000 Tonne 5,938,257.7 6,722,665.8 6,983,599.0 5,159,392.0 5,961,644.0 18.9 -4.5 4.4 -16.1 0.4 Department of Statistics, Malaysia
SECTORMANUFACTURING
Industrial Production Index Point 122.6 122.8 117.3 97.7 126.5 3.4 2.8 1.3 -18.1 3.1 Department of Statistics, MalaysiaSales RM '000 350,417,736.1 355,869,381.6 339,323,806.5 282,020,407.3 358,828,248.3 2.6 2.5 2.2 -16.5 2.4 Department of Statistics, MalaysiaExports # RM '000 213,032,544.2 219,700,247.2 201,772,233.4 182,057,975.8 227,519,332.1 0.5 -1.0 1.2 -12.6 6.8 Department of Statistics, MalaysiaManufacturing Project
InvestmentProjects Number Number 268 319 226 187 327 49.7 25.6 4.6 1.1 22.0 Malaysian Investment Development AuthorityProjects Domestics RM Million 8,413.3 10,486.6 15,408.0 3,279.5 7,213.6 63.5 -45.2 198.7 -31.4 -14.3 Malaysian Investment Development AuthorityProjects Foreign RM Million 10,813.9 16,229.4 10,786.2 7,216.2 26,621.5 -67.6 51.3 -46.7 9.2 146.2 Malaysian Investment Development AuthorityTotal RM Million 19,227.2 26,716.1 26,194.2 10,495.7 33,835.1 -50.1 -10.6 3.1 -7.8 76.0 Malaysian Investment Development Authority
CONSTRUCTIONQuarterly Construction RM 36,076.6 36,978.5 35,040.2 19,780.1 31,367.0 -0.6 1.3 -6.3 -44.9 -13.1 Department of Statistics, MalaysiaUnit Price Index of Construction Materials 2015=100 Point 107.5 107.6 107.9 108.1 108.3 2.4 1.5 2.0 0.9 0.7 Department of Statistics, MalaysiaIssuance of Developer License, Sales Permit and Housing Advertisement (New Permit) Unit 290 330 263 112 229 63.8 57.1 2.7 -54.8 -21.0 National Housing Department
Issuance of Developer License, Sales Permit and Housing Advertisement (Renewals Permit) Unit 524 555 603 520 690 12.0 11.9 29.7 36.1 31.7 National Housing Department
PricesSteel RM per Metric Tonne 2,379.41 2,379.41 2,384.50 2,386.03 2,379.07 -1.1 -0.8 0.0 0.3 0.0 Ministry of WorksCement RM per 50 Kg Bag 17.25 17.33 17.59 17.73 17.82 -1.6 -0.8 1.9 3.4 3.3 Ministry of Works
MINING AND QUARRYINGMining Index (Base 2015 = 100) Point 90.5 102.1 99.5 80.6 84.6 -4.4 -3.8 -1.8 -19.6 -6.5 Department of Statistics, Malaysia
UTILITIESElectricityLocal Generation
Public Installations p Million Kilowatt-Hours 42,287.8 41,051.6 40,261.3 37,300.8 40,909.4 1.9 0.6 -1.4 -11.3 -3.3Tenaga Nasional Berhad, Sabah Electricity Sdn. Bhd., Sarawak Energy Berhad, Independent Power Producer
Private Installations p Million Kilowatt-Hours 531.7 567.0 581.5 536.8 536.5 12.8 2.9 11.1 -2.0 0.9Tenaga Nasional Berhad, Sabah Electricity Sdn. Bhd., Sarawak Energy Berhad, Independent Power Producer
DATA SOURCEValue Annual Percentage Change (%)
INDICATORS UNIT2019 2020 2019 2020

55MALAYSIAN ECONOMIC STATISTICS REVIEW - VOL. 8/2020 | 55
ECONOMIC INDICATORS - QUARTERLY
Note:p preliminary1 latest data until Third Quarter 2020 # provisional data based on External Trade Publications October 2020n.a. not available- not applicable
Q3 Q4 Q1 Q2 Q3 Q3 Q4 Q1 Q2 Q3 DATA SOURCEValue Annual Percentage Change (%)
INDICATORS UNIT2019 2020 2019 2020
Local Consumption
Industrial, Commercial and Mining p Million Kilowatt-Hours 29,435.2 29,096.9 27,498.8 23,089.7 27,936.4 1.4 -0.2 -3.8 -21.1 -5.1Tenaga Nasional Berhad, Sabah Electricity Sdn. Bhd., Sarawak Energy Berhad, Independent Power Producer
Domestic and Public Lighting p Million Kilowatt-Hours 8,421.1 8,044.3 8,635.0 10,126.6 8,909.9 5.4 3.1 4.1 17.4 5.8Tenaga Nasional Berhad, Sabah Electricity Sdn. Bhd., Sarawak Energy Berhad, Independent Power Producer
SERVICESWholesale & Retail TradeVolume Index
Wholesale Trade Index Point 131.5 131.8 126.8 102.5 126.8 5.4 4.9 2.5 -19.3 -3.5 Department of Statistics, MalaysiaRetail Trade Index Point 141.2 144.2 138.6 107.6 137.6 7.8 6.9 1.8 -21.2 -2.6 Department of Statistics, MalaysiaMotor Vehicle Index Point 107.7 103.9 97.6 54.9 113.7 1.9 3.6 -3.5 -48.0 5.5 Department of Statistics, Malaysia
Motor VehicleVehicle Production
Passenger Unit 132,480 135,765 101,507 55,667 142,728 3.9 2.2 -24.0 -57.8 7.7 Malaysian Automotive AssociationCommercial Unit 8,533 9,826 6,937 1,938 7,118 -28.9 -15.9 -33.8 -77.7 -16.6 Malaysian Automotive AssociationTotal Unit 141,013 145,591 108,444 57,605 149,846 1.0 0.8 -24.7 -59.0 6.3 Malaysian Automotive Association
Vehicle SalesPassenger Unit 133,258 146,059 96,089 61,531 151,132 -7.5 14.0 -26.7 -56.0 13.4 Malaysian Automotive AssociationCommercial Unit 13,410 15,237 9,415 6,265 15,664 -36.9 -2.2 -21.2 -53.6 16.8 Malaysian Automotive AssociationTotal Unit 146,668 161,296 105,504 67,796 166,796 -11.2 12.2 -26.2 -55.8 13.7 Malaysian Automotive Association
New Vehicles Registration Number 316,857 323,541 270,117 163,537 360,047 -6.7 11.4 -36.2 -47.1 13.6 Road Transport Department MalaysiaTourism
Index of Services Point 131.3 133.9 115.8 26.0 61.0 6.7 7.1 -4.1 -78.8 -53.6 Department of Statistics, MalaysiaTourist Arrivals 1 Number 6,754,628 5,991,581 4,233,455 19,542 46,422 1.5 -6.5 -36.8 -99.7 -99.3 Tourism Malaysia
TransportIndex of Services Point 126.1 132.5 116.6 67.1 104.5 6.5 6.4 -3.2 -45.4 -17.1 Department of Statistics, Malaysia
Information & CommunicationIndex of Services Point 137.8 134.6 140.0 142.2 144.8 6.0 6.6 6.4 4.5 5.1 Department of Statistics, MalaysiaPenetration Rate
Mobile Cellular per 100 Inhabitants % 134.2 135.4 133.7 132.8 n.a -1.0 4.0 1.8 0.3 n.a Malaysian Communications and Multimedia Commission
Fixed Telephone per 100 Inhabitants % 19.6 19.7 19.8 n.a n.a -2.0 -0.5 0.5 n.a n.a Malaysian Communications and Multimedia Commission
Broadband per 100 Inhabitants % 129.4 131.7 127.4 n.a n.a 9.1 8.8 0.2 n.a n.a Malaysian Communications and Multimedia Commission
FinanceIndex of Services Point 119.0 121.7 116.2 100.2 128.2 4.2 5.7 4.0 -9.2 7.7 Department of Statistics, MalaysiaMoney Supply
M1 RM Million 434,260.0 452,559.5 461,694.5 488,233.2 513,225.3 4.8 5.8 7.9 13.1 18.2 Central Bank of MalaysiaM2 RM Million 1,904,683.4 1,950,567.9 1,960,826.9 2,014,091.4 2,033,284.2 3.8 3.5 3.8 6.1 6.8 Central Bank of MalaysiaM3 RM Million 1,916,354.0 1,961,553.9 1,968,375.0 2,019,910.8 2,038,661.2 3.9 3.5 3.7 5.6 6.4 Central Bank of Malaysia
Total Loans in Banking System RM Million 1,747,492.1 1,771,589.1 1,783,587.8 1,799,837.1 1,824,120.7 3.8 3.9 4.0 4.1 4.4 Central Bank of Malaysia Commercial Banks RM Million 1,142,054.6 1,153,597.1 1,159,220.2 1,161,464.1 1,165,459.4 1.5 1.6 2.3 2.3 2.0 Central Bank of Malaysia Islamic Banks RM Million 598,726.6 611,068.4 618,050.4 631,742.5 651,350.4 8.7 8.3 7.4 7.7 8.8 Central Bank of Malaysia Merchant Banks RM Million 6,711.0 6,923.6 6,317.2 6,630.5 7,310.9 -3.3 3.7 -5.1 -0.8 8.9 Central Bank of Malaysia
Total Deposits Banking System RM Million 1,974,751.5 2,000,373.3 2,009,948.9 2,045,785.0 2,076,579.7 4.2 2.9 2.7 4.4 5.2 Central Bank of Malaysia Commercial Banks RM Million 1,344,629.8 1,370,541.0 1,381,635.0 1,399,879.4 1,417,082.8 1.3 1.0 2.0 4.4 5.4 Central Bank of Malaysia Islamic Banks RM Million 607,320.3 606,596.5 605,251.6 623,928.6 637,475.1 12.5 8.2 4.9 5.2 5.0 Central Bank of Malaysia Merchant Banks RM Million 22,801.4 23,235.7 23,062.2 21,976.9 22,021.8 -17.1 -13.6 -11.8 -15.7 -3.4 Central Bank of Malaysia
Fixed Deposits RM Million 1,013,147.4 1,002,298.4 992,019.2 990,468.2 985,552.7 5.9 2.8 -0.3 -1.0 -2.7 Central Bank of Malaysia Commercial Banks RM Million 587,610.8 587,253.7 589,186.3 588,657.4 588,252.5 0.9 -1.1 -0.9 -0.1 0.1 Central Bank of Malaysia Islamic Banks RM Million 410,731.9 399,767.9 387,852.6 386,817.4 382,597.6 14.5 9.4 1.1 -2.1 -6.8 Central Bank of Malaysia Merchant Banks RM Million 14,804.7 15,276.9 14,980.4 14,993.4 14,702.6 -7.3 -5.1 -7.3 -7.0 -0.7 Central Bank of Malaysia
Savings Deposits RM Million 167,115.6 169,974.8 182,362.4 199,549.7 206,825.4 7.1 8.0 12.8 21.0 23.8 Central Bank of Malaysia Commercial Banks RM Million 122,706.0 124,749.7 131,934.8 143,138.6 148,421.6 6.4 7.3 11.1 18.0 21.0 Central Bank of Malaysia Islamic Banks RM Million 44,409.6 45,225.1 50,427.6 56,411.1 58,403.9 9.2 9.9 17.3 29.6 31.5 Central Bank of Malaysia
Overnight Policy Rate (OPR) Basis Point 3.0 3.0 2.5 2.0 1.8 -0.3 -0.3 -0.8 -1.0 -1.3 Central Bank of MalaysiaAverage Lending Rate CFM
Commercial Banks % 4.8 4.7 4.5 4.1 3.7 -0.2 -0.3 -0.5 -0.9 -1.1 Central Bank of Malaysia Islamic Banks % 5.2 5.2 5.0 4.5 4.2 -0.1 -0.2 -0.4 -0.8 -1.0 Central Bank of Malaysia Merchant Banks % 6.5 6.5 6.4 6.2 5.9 -0.1 0.0 0.0 -0.3 -0.6 Central Bank of Malaysia
Base Lending Rate (BLR) Commercial Banks % 6.7 6.7 6.4 5.9 5.5 -0.2 -0.2 -0.5 -0.8 -1.2 Central Bank of MalaysiaBase Financing Rate (BFR) Islamic Banks % 6.8 6.8 6.5 6.0 5.6 -0.2 -0.2 -0.6 -0.9 -1.2 Central Bank of Malaysia

56MALAYSIAN ECONOMIC STATISTICS REVIEW - VOL. 8/2020 | 56
ECONOMIC INDICATORS - QUARTERLY
Note:p preliminary1 latest data until Third Quarter 2020 # provisional data based on External Trade Publications October 2020n.a. not available- not applicable
Q3 Q4 Q1 Q2 Q3 Q3 Q4 Q1 Q2 Q3 DATA SOURCEValue Annual Percentage Change (%)
INDICATORS UNIT2019 2020 2019 2020
Savings Deposits Interest Rate Commercial Banks % 1.0 1.0 0.8 0.7 0.5 -0.1 -0.1 -0.2 -0.4 -0.5 Central Bank of Malaysia Islamic Banks % 0.7 0.7 0.6 0.5 0.4 -0.1 -0.1 -0.2 -0.3 -0.4 Central Bank of Malaysia
Loans Approved by Sector Primary Agriculture RM Million 1,437.3 2,712.0 1,265.4 701.6 919.4 -43.7 -19.4 -38.6 -79.1 -36.0 Central Bank of MalaysiaMining & Quarrying RM Million 878.8 447.8 793.0 706.7 319.1 566.0 -18.7 30.6 -40.9 -63.7 Central Bank of MalaysiaManufacturing RM Million 10,238.0 10,746.5 8,708.7 7,867.5 5,820.7 15.9 26.8 30.7 -13.4 -43.1 Central Bank of MalaysiaServices RM Million 20,665.3 21,243.6 19,416.2 23,855.4 21,074.9 -12.7 -16.8 3.3 -6.6 2.0 Central Bank of MalaysiaConstruction RM Million 7,450.6 6,726.0 5,226.7 3,604.2 6,579.1 19.5 19.1 -31.4 -45.7 -11.7 Central Bank of MalaysiaReal Estates RM Million 7,721.5 6,922.1 5,012.8 4,110.0 2,897.2 15.9 -12.2 14.9 -33.4 -62.5 Central Bank of MalaysiaHousehold Sector RM Million 57,781.5 53,640.6 45,469.4 24,786.7 59,686.2 1.8 1.3 -8.6 -56.8 3.3 Central Bank of MalaysiaOther Sectors RM Million 203.2 875.8 1,000.5 989.8 689.2 -78.4 79.3 3.0 137.1 239.2 Central Bank of MalaysiaTotal RM Million 106,376.2 103,314.5 86,892.7 66,622.0 97,985.7 0.5 -1.5 -4.4 -39.3 -7.9 Central Bank of Malaysia
Loans Disbursed by SectorPrimary Agriculture RM Million 10,426.5 12,644.4 10,300.2 9,030.3 9,409.2 -5.0 8.4 0.5 -18.5 -9.8 Central Bank of MalaysiaMining & Quarrying RM Million 1,966.8 2,679.3 2,082.3 1,271.3 1,009.0 12.0 27.6 21.8 -25.7 -48.7 Central Bank of MalaysiaManufacturing RM Million 64,397.2 71,651.8 63,463.9 62,534.2 59,334.4 6.8 14.9 2.3 3.4 -7.9 Central Bank of MalaysiaServices RM Million 99,294.9 98,833.7 104,959.1 92,418.7 92,459.4 -3.2 -19.4 5.6 -2.1 -6.9 Central Bank of MalaysiaConstruction RM Million 22,315.4 22,997.4 21,157.3 16,345.5 18,142.3 8.2 0.6 2.8 -32.3 -18.7 Central Bank of MalaysiaReal Estates RM Million 12,574.5 14,812.3 12,410.1 9,215.7 10,367.9 -17.9 0.0 -18.1 -40.8 -17.5 Central Bank of MalaysiaForeign RM Million 85,972.4 89,857.3 82,293.6 53,856.2 90,620.1 2.1 3.8 -4.0 -36.2 5.4 Central Bank of MalaysiaOther Sectors RM Million 8,285.6 6,899.6 6,829.1 8,966.4 8,749.9 -23.7 -25.3 -24.3 -7.5 5.6 Central Bank of MalaysiaTotal RM Million 305,233.3 320,375.7 303,495.4 253,638.4 290,092.3 -0.5 -3.6 -0.1 -15.9 -5.0 Central Bank of Malaysia
Loans Disbursed by Purpose Purchase of Passenger Cars RM Million 10,652.6 10,946.3 9,359.8 3,715.4 12,185.7 -17.5 12.0 -8.8 -65.3 14.4 Central Bank of MalaysiaPersonal Uses RM Million 9,341.2 9,563.0 8,995.4 4,809.0 8,661.8 5.2 7.5 12.4 -40.7 -7.3 Central Bank of MalaysiaCredit Cards RM Million 37,769.2 40,298.5 35,095.9 26,399.0 35,907.1 5.3 6.9 -2.7 -27.8 -4.9 Central Bank of MalaysiaPurchase of Consumer Durable Goods RM Million 6.8 5.9 8.1 5.2 6.3 -8.7 -17.8 39.0 -31.7 -7.2 Central Bank of MalaysiaLoan Disbursed to Household Sector RM Million 85,972.4 89,857.3 82,293.6 53,856.2 90,620.1 2.1 3.8 -4.0 -36.2 5.4 Central Bank of Malaysia
Outstanding Loans to the Construction Sector RM Million 94,581.7 92,044.1 93,172.2 93,250.8 93,086.0 8.2 0.6 2.8 -32.3 -18.7 Central Bank of MalaysiaOwner Occupied Dwelling
Loan Approved (for Residential) RM Million 30,529.1 28,104.8 20,680.4 12,161.0 29,738.8 10.5 2.7 -10.7 -60.5 -2.6 Ministry of Housing and Local GovernmentLoan Disbursed (for Residential) RM Million 23,160.8 25,428.7 22,104.3 12,406.9 23,650.7 8.7 9.3 -1.5 -42.3 2.1 Ministry of Housing and Local Government
Real EstateIndex of Services Point 123.4 124.8 119.4 82.8 101.1 5.2 5.6 0.3 -32.0 -18.1 Department of Statistics, Malaysia
HealthIndex of Services - Private Health Point 125.0 125.4 123.3 103.1 118.8 5.8 5.6 1.8 -18.5 -5.0 Department of Statistics, Malaysia
EducationIndex of Services - Private Education Point 132.8 131.4 120.8 104.8 120.3 4.9 5.3 3.9 -12.4 -9.4 Department of Statistics, Malaysia
OTHERSLABOUR
Labour SupplyWorking Age (15-64) ('000) 22,763.0 22,832.8 22,953.2 23,026.0 23,165.2 1.4 1.4 1.6 1.5 1.8 Department of Statistics, MalaysiaLabour Force ('000) 15,674.3 15,766.7 15,790.1 15,675.5 15,840.6 1.9 2.1 1.7 0.5 1.1 Department of Statistics, Malaysia
Employed ('000) 15,162.1 15,254.5 15,243.5 14,883.7 15,095.6 2.1 2.2 1.6 -1.3 -0.4 Department of Statistics, MalaysiaUnemployed ('000) 512.1 512.2 546.6 791.8 745.0 -2.3 -0.8 5.8 52.1 45.5 Department of Statistics, Malaysia
Actively Unemployed ('000) 371.3 363.0 356.9 485.7 592.2 6.8 6.9 -4.4 26.7 59.5 Department of Statistics, MalaysiaInactively Unemployed ('000) 140.8 149.2 189.7 306.1 152.8 -20.3 -15.7 32.3 122.9 8.5 Department of Statistics, Malaysia
Outside Labour Force ('000) 7,088.7 7,066.1 7,163.1 7,350.5 7,324.6 0.2 -0.1 1.4 3.7 3.3 Department of Statistics, MalaysiaLabour Force Participaton Rate % 68.9 69.1 68.8 68.1 68.4 - - - - - Department of Statistics, MalaysiaUnemployment Rate % 3.3 3.2 3.5 5.1 4.7 - - - - - Department of Statistics, Malaysia
Labour DemandJobs ('000) 8,651.6 8,661.4 8,566.5 8,383.4 8,471.2 1.4 1.4 0.2 -2.7 -2.1 Department of Statistics, MalaysiaFilled Jobs ('000) 8,448.9 8,463.5 8,400.6 8,213.9 8,291.9 1.4 1.4 0.6 -2.2 -1.9 Department of Statistics, Malaysia
Rate % 97.7 97.7 98.1 98.0 97.9 - - - - - Department of Statistics, MalaysiaVacancies ('000) 202.6 198.0 166.0 169.5 179.3 - - - - - Department of Statistics, Malaysia
Rate % 2.3 2.3 1.9 2.0 2.1 - - - - - Department of Statistics, MalaysiaJobs Created ('000) 28.1 25.2 21.9 13.7 21.0 - - - - - Department of Statistics, Malaysia

57MALAYSIAN ECONOMIC STATISTICS REVIEW - VOL. 8/2020 | 57
ECONOMIC INDICATORS - QUARTERLY
Note:p preliminary1 latest data until Third Quarter 2020 # provisional data based on External Trade Publications October 2020n.a. not available- not applicable
Q3 Q4 Q1 Q2 Q3 Q3 Q4 Q1 Q2 Q3 DATA SOURCEValue Annual Percentage Change (%)
INDICATORS UNIT2019 2020 2019 2020
Labour ProductivityValue Added per Hour Worked RM 41.0 42.0 40.0 46.4 41.0 2.6 1.4 2.1 15.5 0.1 Department of Statistics, Malaysia
By Economic ActivityAgriculture RM 28.2 25.2 23.0 28.8 28.4 2.1 -5.8 -7.1 16.1 0.6 Department of Statistics, MalaysiaMining & Quarrying RM 480.4 614.0 564.6 602.2 458.8 -3.2 -1.1 3.8 6.9 -4.5 Department of Statistics, MalaysiaManufacturing RM 52.4 52.6 50.9 59.9 56.0 2.8 1.2 2.2 15.2 6.9 Department of Statistics, MalaysiaConstruction RM 19.7 18.6 18.6 18.0 17.9 1.7 4.3 -1.6 -3.2 -9.0 Department of Statistics, MalaysiaServices RM 38.9 40.5 38.2 44.2 38.3 2.9 2.6 3.7 17.1 -1.4 Department of Statistics, Malaysia
Value Added per Employment RM 23,777.0 24,263.0 22,577.0 19,446.0 23,248.0 2.3 1.4 -0.8 -16.0 -2.2 Department of Statistics, MalaysiaBy Economic Activity
Agriculture RM 14,812.0 13,229.0 11,948.0 13,244.0 14,849.0 2.3 -6.1 -8.9 1.6 0.3 Department of Statistics, MalaysiaMining & Quarrying RM 292,278.0 379,347.0 339,032.0 280,302.0 278,831.0 -5.2 -4.0 -0.4 -17.1 -4.6 Department of Statistics, MalaysiaManufacturing RM 31,344.0 31,580.0 29,788.0 25,739.0 32,485.0 1.5 0.8 -0.2 -17.3 3.6 Department of Statistics, MalaysiaConstruction RM 11,791.0 11,102.0 10,776.0 6,536.0 10,583.0 2.2 3.2 -5.3 -40.8 -10.2 Department of Statistics, MalaysiaServices RM 22,642.0 23,463.0 21,655.0 18,413.0 21,749.0 2.7 2.9 0.5 -15.7 -3.9 Department of Statistics, Malaysia
Share of Registered Candidates by QualificationNon Tertiary % 17.0 17.0 17.0 17.0 17.0 - - - - - JobstreetTertiary % 75.0 75.0 75.0 75.0 75.0 - - - - - JobstreetPostgraduate % 8.0 8.0 8.0 8.0 7.0 - - - - - Jobstreet
Share of Registered Candidates by Year of Experience<1 year % 27.0 26.0 26.0 26.0 26.0 - - - - - Jobstreet1-4 years % 15.0 12.0 12.0 13.0 13.0 - - - - - Jobstreet5-9 years % 22.0 22.0 22.0 22.0 22.0 - - - - - Jobstreet10-14 years % 15.0 17.0 16.0 16.0 16.0 - - - - - Jobstreet15-19 years % 11.0 11.0 11.0 11.0 11.0 - - - - - Jobstreet=>20 years % 11.0 12.0 12.0 20.0 12.0 - - - - - Jobstreet
STOCK MARKETKuala Lumpur Composite Index Point 1,583.9 1,588.8 1,350.9 1,501.0 1,504.8 -11.7 -6.0 -17.8 -10.2 -5.0 Bursa MalaysiaValue Traded RM Billion 119.2 131.0 162.6 227.0 359.4 -19.6 1.7 14.1 71.2 201.5 Bursa Malaysia
EXCHANGE RATEUSD - U.S. Dollar RM per Unit 4.1660 4.1651 4.1798 4.3242 4.2024 -1.7 0.2 -2.2 -4.1 -0.9 Central Bank of MalaysiaGBP - U.K. Pound RM per Unit 5.1383 5.3603 5.3504 5.3642 5.4250 3.8 0.1 -0.4 -0.6 -5.3 Central Bank of MalaysiaSDR - Special Drawing Right RM per Unit 5.7255 5.7256 5.7465 5.9182 5.8987 -1.4 1.1 -0.9 -2.9 -2.9 Central Bank of MalaysiaSGD - Singapore Dollar RM per Unit 3.0298 3.0551 3.0164 3.0622 3.0564 -1.2 -0.7 0.1 -0.6 -0.9 Central Bank of MalaysiaEUR - EURO RM per Unit 4.6325 4.6111 4.6108 4.7603 4.9092 2.8 3.3 0.8 -2.0 -0.1 Central Bank of MalaysiaCHF - Swiss Franc RM per 100 Units 422.5395 420.7453 431.9916 448.6066 456.5091 -1.5 -0.4 -5.0 -7.7 -7.4 Central Bank of MalaysiaJPY - Japanese Yen RM per 100 Units 3.8816 3.8320 3.8390 4.0226 3.9575 -5.4 -3.5 -3.3 -6.1 -1.9 Central Bank of MalaysiaHKD - Hong Kong Dollar RM per 100 Units 53.2135 53.2238 53.7867 55.7871 54.2207 -1.9 0.1 -3.1 -5.1 -1.9 Central Bank of Malaysia

| MALAYSIAN ECONOMIC STATISTICS REVIEW - VOL. 8/202058
MESR MEMBERS
Kanageswary RamasamyJamia Aznita JamalNoraliza Mohamad AliWan Siti Zaleha Wan ZakariaHerzie Mohamed NordinRozita MisranRusnani Hussin @ IsaMalathi PonnusamyMohd Sawal Shakimon Maizatil Elina Abdul HamidSiti Salwani IsmailNoor Masayu Mohd KhaliliNur Layali Mohd Ali KhanKhairul Aidah SamahAhmad Redzuan Abdul HadiSiti Sarah Che Dan
Zainuddin Ahmad Siti Asiah AhmadNorhayati Jantan Siti Haslinda Mohd DinKanageswary RamasamyJamia Aznita JamalNoraliza Mohamad AliSiti Zakiah Muhamad AliAb. Rahman MohamadMohd Yazid KasimFuziah Md AminWan Siti Zaleha Wan ZakariaHerzie Mohamed Nordin Rozita MisranRazaman RidzuanKhairul Aidah Samah Nur Layali Mohd Ali KhanManisah OthmanMaizatil Elina Abdul HamidMalathi Ponnusamy
EDITORIAL BOARD
AUTHORS
Farrahlizawati Mohd IsaZuradi JusohK Megala KumarranWan Rahifah Wan RamliSiti Norfadillah Md SaatLim Kok HwaNoraniza IbrahimKumutha ShanmuganAhmad Shafique MohamedMohd Syahidi Alfee Mohamad MoharDiyana Amalina FadzilAhmad Najmi Arifin Nur Aseken Md Ya’cobSyazwani Aliah Abd RahmanNurul Effa Farhana HalimRahidah Mohd Nor
Mohd Sawal ShakimonNan Hasnani Long PadangSiti Faizah Hanim Md MatarAhmad Redzuan Abdul HadiLiang Hung ShanIsmail Abdul RahmanHasnah MatMohammad Darahim IbrahimSharifah Rahimah Wan ZainNurulhuda Abdul SamarudinNazirah IbrahimSiti Sarah Che DanK Megala KumarranNahdhatul Akmal Abu BakarSuria Azlin KasimFarrah Hanim Fawziah Johary Nazira AbdullahSiti Noraini Rusli Noraniza IbrahimNurul Ainie Hamid
Syed Omar Faizal Syed Mohd Yusof Nor Hasnida Mahyudin Masitah Kamaludin Siti Hawa SaadunSitie Suria ZakariaNur Khairunniza Binti HarunNur Fathin Mohd Khalil Md Sobri Md Yusoff Mohammad Luqman Humaidi Nurul Fadhillah Mohd AsmadeeMohd Azhari Ghazali Nor Rizwan Abu Bakar

MALAYSIAN ECONOMIC STATISTICS REVIEW - VOL. 8/2020 | 59
National Accounts Statistics Division
Services Statistics Division
Industrial Production & Construction Statistics Division
International Trade Statistics Division
Balance of Payments Statistics Division
Economic Indicators Division
Malaysian Bureau of Labour Statistics
Agriculture and Environment Statistics Division
Prices, Income and Expenditure Statistics Division
Methodology and Research Division
Core Team Big Data Analytic
Integration & Data Management Division
ACKNOWLEDGEMENT

#Stat Mala ys ia || #MyStatsDa y
#MyCensus20 20 || # L ea veNoO neB eh i nd