UNIVERSITY OF CALGARY FLOW CYTOMETRY FACILITY ‘Efficient and reliable flow cytometry services with...
72
UNIVERSITY OF CALGARY FLOW CYTOMETRY FACILITY ‘Efficient and reliable flow cytometry services with the highest standards of quality and productivity’
-
Upload
herbert-sherman -
Category
Documents
-
view
218 -
download
1
Transcript of UNIVERSITY OF CALGARY FLOW CYTOMETRY FACILITY ‘Efficient and reliable flow cytometry services with...

UNIVERSITY OF CALGARY FLOW CYTOMETRY FACILITY
‘Efficient and reliable flow cytometry
services with the highest standards
of quality and productivity’

Flow cytometry is a technique for measuring physical and chemical properties of individual cells
as they travel in suspension one by one past a sensing point.

• The cells in suspension are forced to pass in a fluid stream through a flow cell.
• The fluid stream intersects the focus of a laser.
• The laser light is scattered and, if the cells are fluorescent, they produce fluorescent signals.
• These light signals are then converted to electronic signals (voltages).
BASICS OF FLOW CYTOMETRY

1. Fluidics2. Optics3. Electronics
INSTRUMENTATION

FLUIDICS
•The purpose of the fluidics system is to transport cells in a fluid stream to the laser beam for
interogation.

The optics system consist of a laser to illuminate the cells in the sample stream and optical filters to direct the resulting light signals to the appropriate detectors
(I.e . to resolve different colors).
OPTICS

1. The flow of sheath fluid restricts the cells to the center of the sample core for optimal illumination (hydrodynamic focusing).
2. Only one cell should move through the laser beam at a given moment.

“THE LASER”“THE LASER”
• Lasers emit coherent light, in a fine, straight beam at a specified wavelength.
• The use of a laser allows the beam of light to be focused on single cells so that basic measurements based on beam disturbance can be taken (FSC, SSC) .
LASER: Acronym for Light Amplification by Stimulated Emission of
Radiation

ELECTRONICSELECTRONICS
• Processing of signals from detectors
-Cells passing through the laser beam generate light signals.These light signals are then converted
to electronic signals (voltages).
-The electrical voltage generated will be proportional to the number of photons (amount of light) emitted
by the cell/particle.
-The voltages are processed by the computer.

The sample is injected into a stream of sheath fluid within the flow chamber; the sample core remains separate but coaxial
within the sheath fluid.

•Light is bent (diffracted) depending on the size and refractive index of the cell
•Detected along the axis of incident light (0-100)
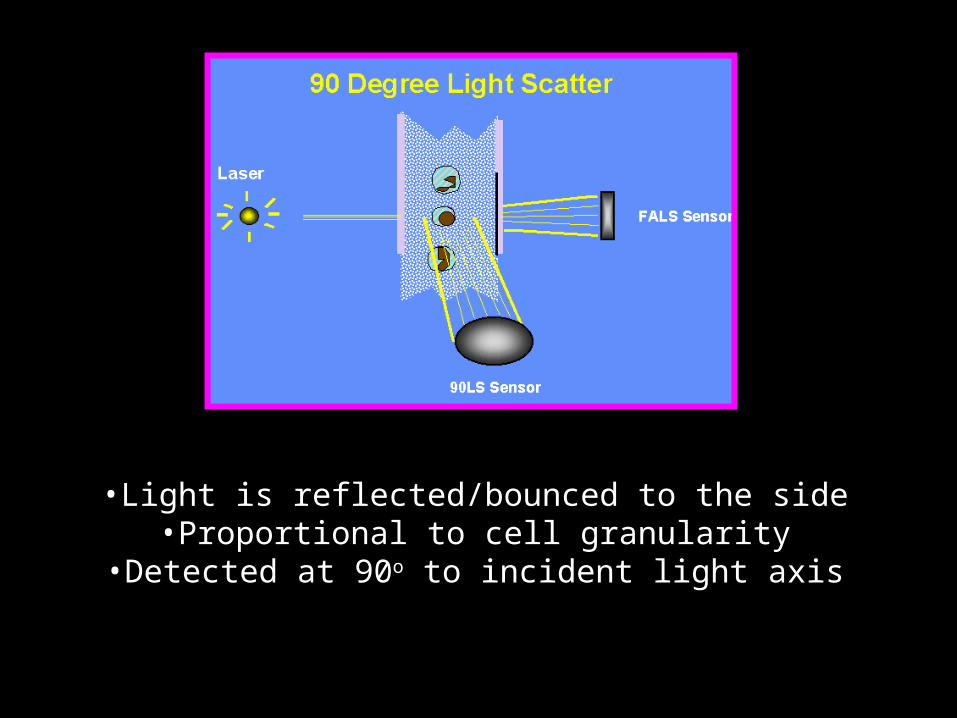
•Light is reflected/bounced to the side•Proportional to cell granularity
•Detected at 90o to incident light axis
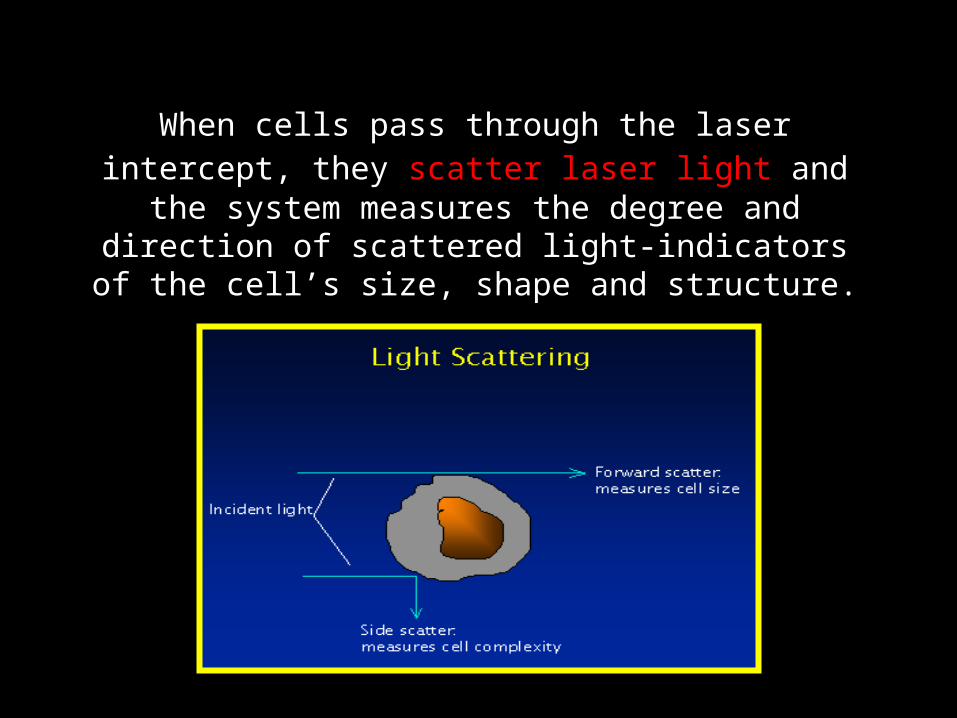
When cells pass through the laser intercept, they scatter laser light and the system
measures the degree and direction of scattered light-indicators of the cell’s size, shape and
structure.


What do the scatter signals tell us?
• Together the forward and side scatter signals can provide useful ways to characterize different cell types.
• Example: Leucocytes (white blood cells).


FLUOROSCENCE
•Fluorescent compounds absorb light energy over a range of wavelengths, which causes an electron in the compound to be raised to a higher energy level.
•The excited electron emits this excess energy as a photon of light.
•While each fluorochrome will have an optimal, or peak emission wavelength, the spectra will actually be distributed over a number of wavelengths.

Any fluorescent molecules present on the cell fluoresce.

Injector Tip
Fluorescencesignals
Focused laserbeam
Sheath fluid
• The cells are forced to pass in a fluid stream through a flow cell where the fluid stream intersects the focus of the laser.

Detector Fluorochrome Emission
FL1 FITC, GFP, Alexa 488, CFSE, Fluo 3
525 nm
FL2 PE, PI 575 nm
FL3 PER-CP, Cychrome, 7-AAD
660-675 nm
More than one fluorochrome can be used simultaneously if each is excited at 488 nm and if the peak emission wavelengths are not extremely close to each other.
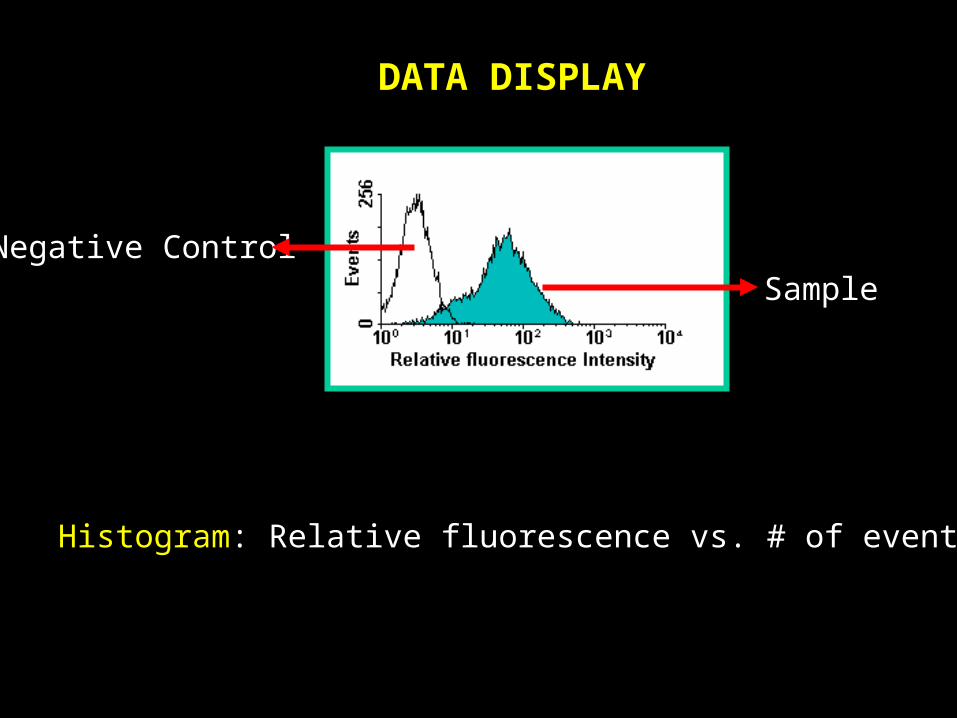
DATA DISPLAY
Negative ControlSample
Histogram: Relative fluorescence vs. # of events

DATA DISPLAY
Quadrants can be applied to any 2 parameter display.

IMMUNOPHENOTYPING
Antibody-fluorescent dye conjugates bind to antigens and the quantity of the fluorescent light emitted is correlated with the cellular marker in question.

DATA DISPLAY

Activation: Surface Receptor Expression
Up Regulation of IL-2 Receptor on Mouse B Cells

CELL ADHESION MOLECULES
Expression of P-selectin is up-regulated on activated peripheral blood platelets.
A. Unstimulated
B. Thrombin-activated
--- Isotype__ Anti-P-Selectin
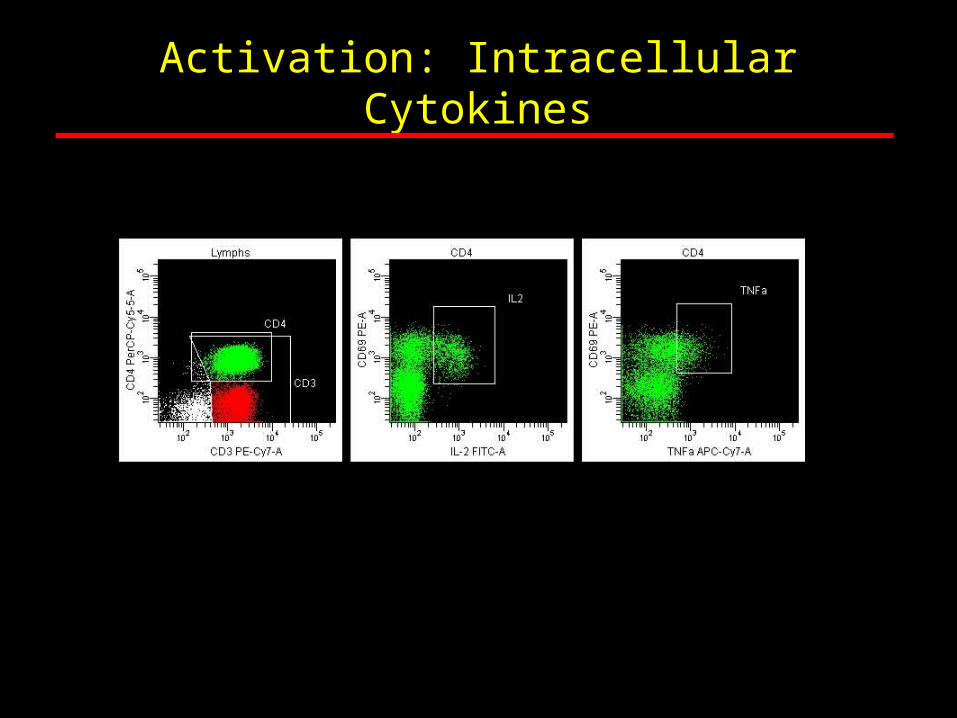
Activation: Intracellular Cytokines
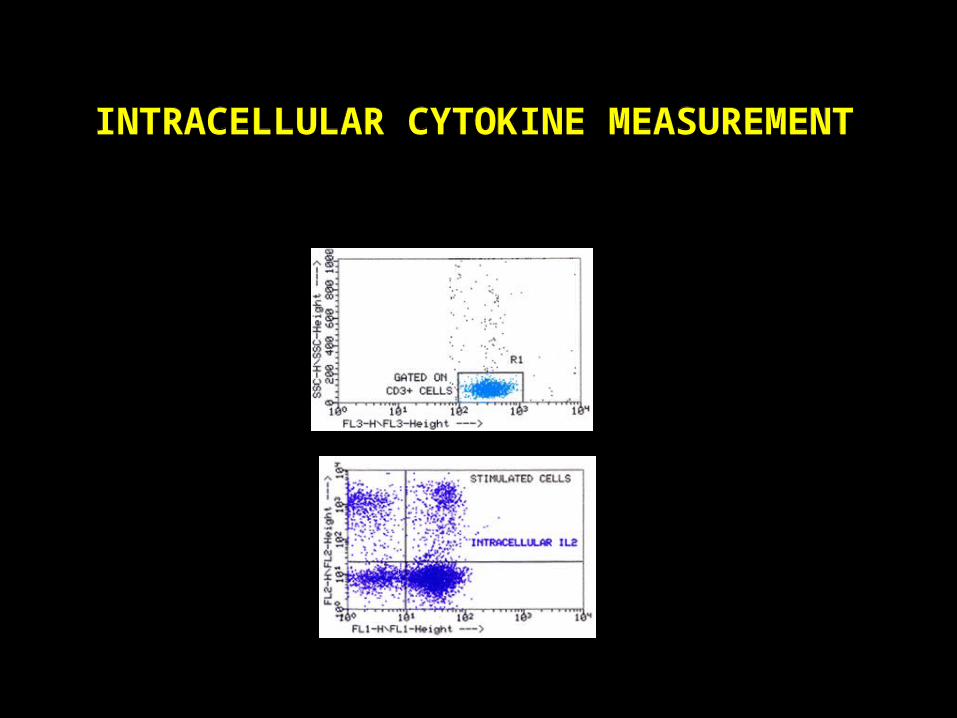
INTRACELLULAR CYTOKINE MEASUREMENTINTRACELLULAR CYTOKINE MEASUREMENT
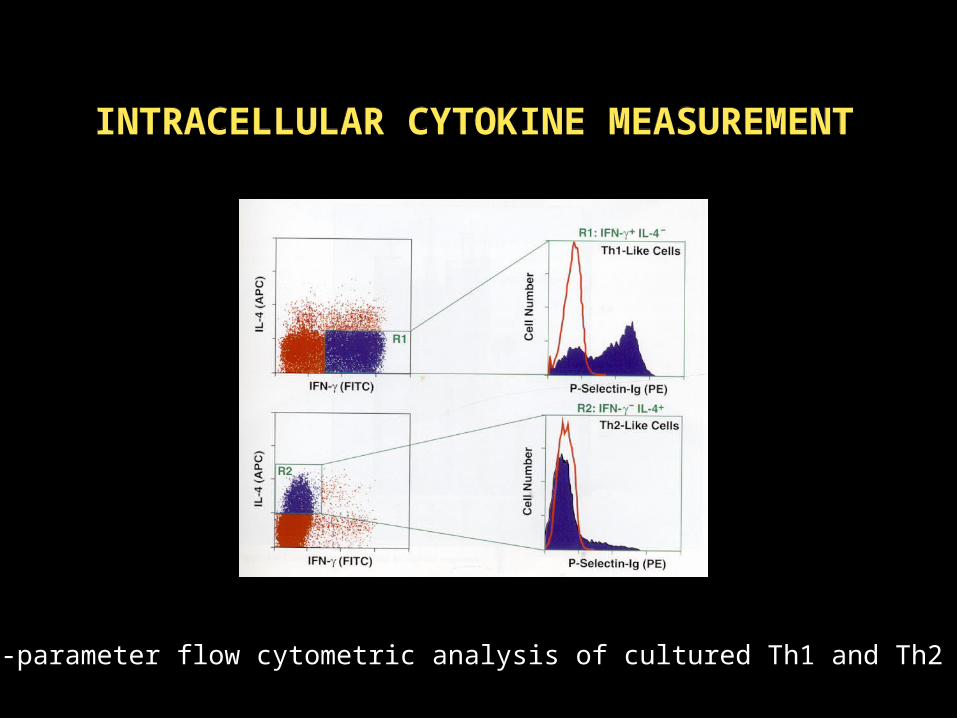
INTRACELLULAR CYTOKINE MEASUREMENTINTRACELLULAR CYTOKINE MEASUREMENT
Multi-parameter flow cytometric analysis of cultured Th1 and Th2 cells

APOPTOSIS

METHODS FOR DETECTING APOPTOSIS:Annexin V assay

Apoptosis: Annexin V Assay
Annexin V
Jurkat Cells Treated for 6 hours with IgM Anti Fas Antibody

PI vs. ANNEXINPI vs. ANNEXIN
• One of the more common uses of DNA-based dyes is to identify apoptotic cells.
• Necrotic cells are widely permeable to a number of cell labels (usually PI) whereas apoptotic cells are impermeable.
• Staining for apoptotic markers (i.e., Annexin V) will identify apoptotic cells, whereas necrotic cells will also stain with PI.

PI vs. ANNEXINPI vs. ANNEXIN
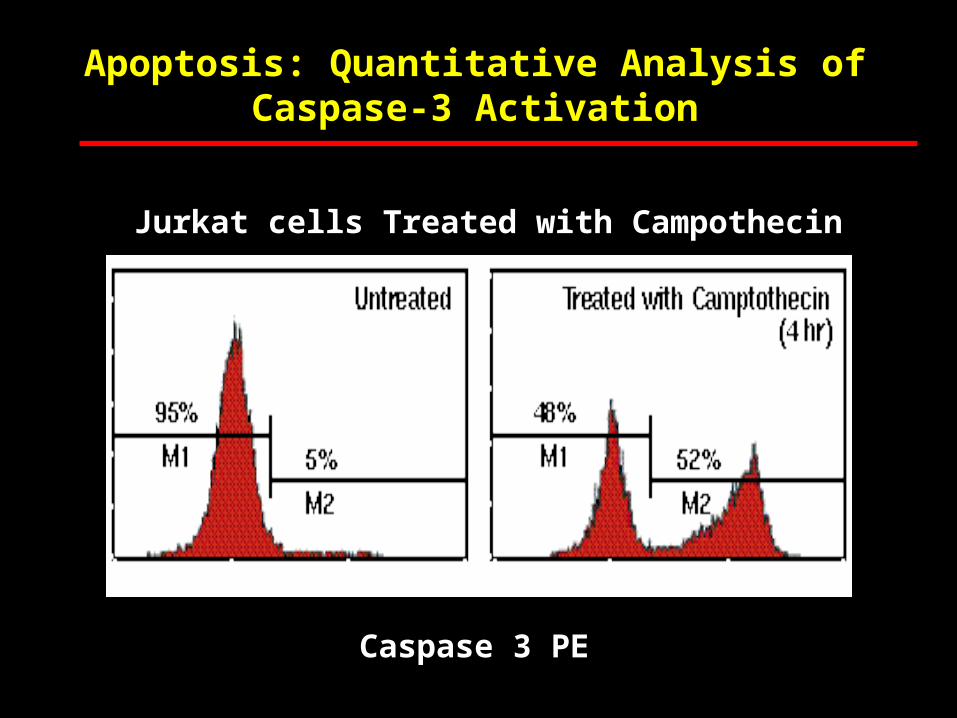
Apoptosis: Quantitative Analysis of Caspase-3 Activation
Jurkat cells Treated with Campothecin
Caspase 3 PE
0 Hours 6 Hours
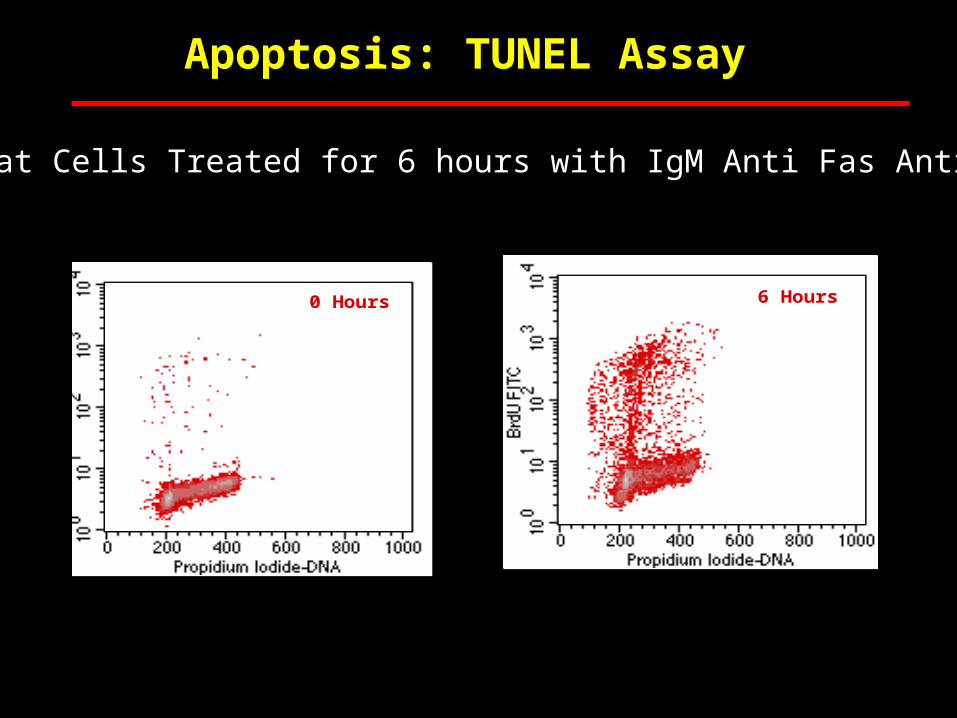
APO-BRDU
Apoptosis: TUNEL Assay
Jurkat Cells Treated for 6 hours with IgM Anti Fas Antibody

Apoptosis: bcl-2 Regulation
Mitochondrial Protein bcl-2Blocks Apoptosis
Bcl-2 Is Down RegulatedDuring Apoptosis
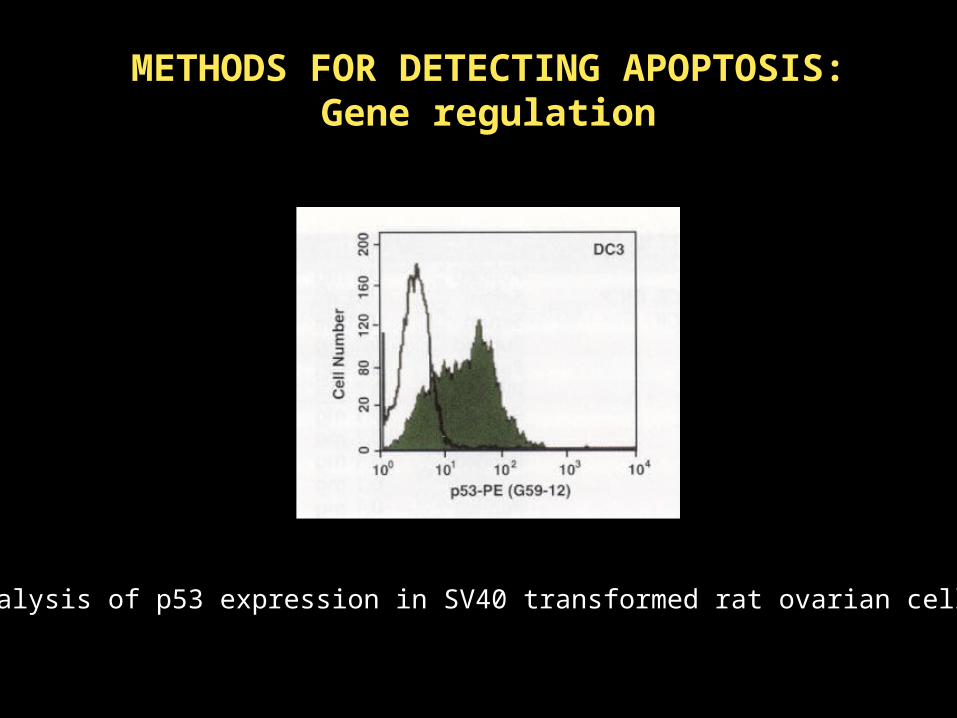
METHODS FOR DETECTING APOPTOSIS:Gene regulation
Analysis of p53 expression in SV40 transformed rat ovarian cells

METHODS FOR DETECTING APOPTOSIS:Histone Phosphorylation

Proliferation: Nucleotide Analogs
Bromodeoxyuridine Is Incorporated Into Cellular DNABy Pulsing Proliferating Cells
The Nucleotide May Be Conjugated With FluorochromeOr Detected By Antibodies

Carboxyfluorescein succinimidyl ester
The amount of CFSE in the cell in themembrane of proliferating cells
halves with each successive division and therefore, the
fluorescence can be used to monitor the number of cell divisions.
PROLIFERATION: CFSE

Ploidy: Nucleic Acid Dyes
DAPI is one of many non-vital dyes that binds DNA on an equimolar basis
This allows the precise quantitation of a cell populations proliferative index

DNA & CELL CYCLE ANALYSIS
PI: Key feature of DNA probes is that they are STOICHIOMETRIC.
Total nuclear content and the fraction of cells in each phase of the cell cycle can be measured.

G2
M G0
G1
s
0 200 400 600 800 1000
G0G1
s G2M
DNA Analysis
DNA content
Count
2N 4N
Normal Cell Cycle Normal Cell Cycle

INTRACELLULAR CYTOKINE MEASUREMENTINTRACELLULAR CYTOKINE MEASUREMENT
• The production of cytokines by specific cell types can be determined as opposed to measuring the amount of secreted cytokine present in the serum or supernatant.

APOPTOSIS: SUBGENOMIC DNA PEAKS

TRANSFECTION EFFICIENCY
Using Green Fluorescent Protein (GFP) as a co-transformation marker is one of the most
common applications of GFP-expressing vectors

0 100 200 300 400 500 600 700
CE
LL
NU
MB
ER
FLUORESCENCE
TRANSGENICCELL LINE
CONTROL

ESTIMATING CELL VIABILITY
PROPIDIUM IODIDE (PI)-Excluded by viable cells and when taken up by dying cells, binds to nucleic acids and fluoresces
orange.

Viability: Fluorescein Diacetate & PI
FDA converted to fluorescent compound in live cells

Oxidative Burst
Conversion of nonfluorescent dichlorofluorescein diacetate to the fluorescent compound 2',7'-dichlorofluorescein can be used to monitor the oxidative burst in polymorphonuclear leukocytes.

Many stimuli can cause mobilization of calcium either as an influx from the extracellular medium or the release of intracellular stores.
A number of dyes that fluoresce when bound to calcium are used to “pre-load” cells prior to calcium mobilization and the cells will “glow” as calcium streams into the cells.
CALCIUM FLUX MEASUREMENTS

Fluo-3 is a Ca+2 sensitive fluorescent probe. Its emission intensity changes with the Ca+2
concentration.

CALCIUM INFLUX
Ca++ Bound Indo-1 at 390 nm to Free Indo-1 at 495 nm

PHOSPHOPROTEIN PROFILING WITH FLOW CYTOMETRY
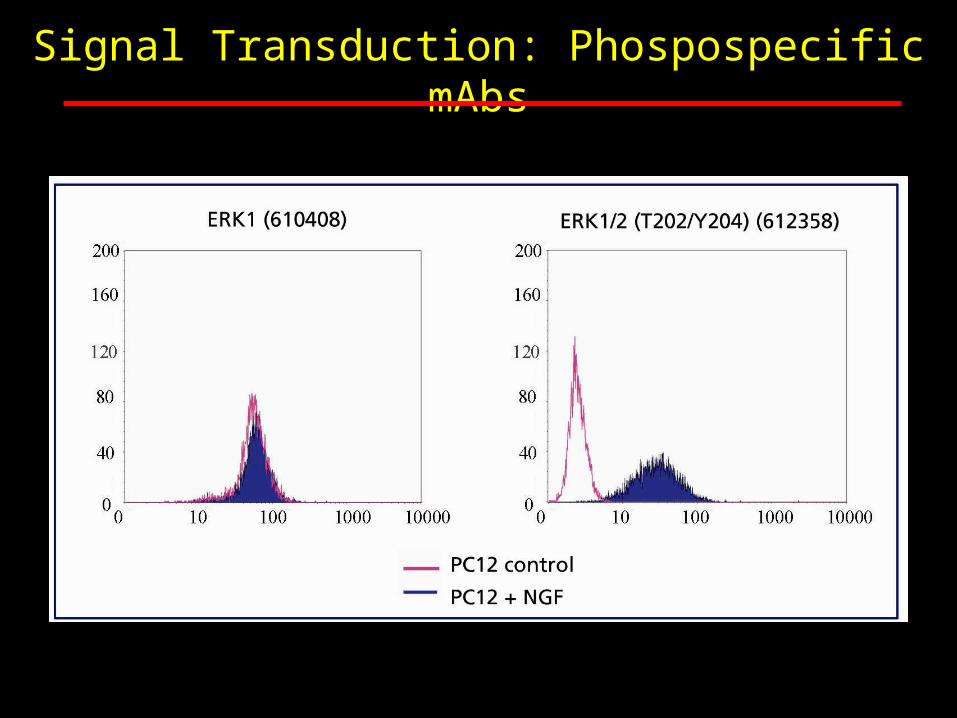
Signal Transduction: Phospospecific mAbs

Signal Transduction: Phosphospecific mAbs

PHAGOCYTOSIS
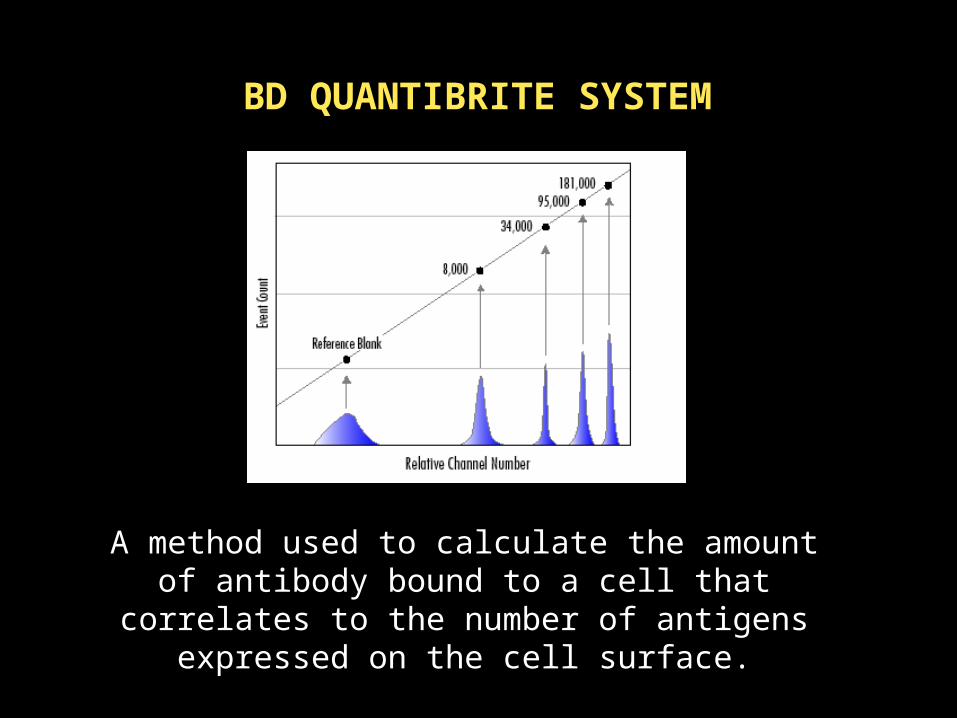
BD QUANTIBRITE SYSTEM
A method used to calculate the amount of antibody bound to a cell that correlates to
the number of antigens expressed on the cell surface.

BD CYTOMETRIC BEAD ARRAY SYSTEM
WASH
1. Add unknowns or standards to capture bead array
2. Add detection reagents and incubate
3.Acquire samples

Cell SortingCell Sorting
• The population of interest can be separated during flow and deposited into a tube for later analysis (>95% purity).
• Any combination of analytical parameters can be used to set the criteria for sorting as opposed to single parameter methods (I.e. separating the negatives from the positives).

488 nm laser
+-
Fluorescence Activated Cell Sorting
Charged Plates
Single cells sortedinto test tubes
FALS Sensor
Fluorescence detector

0 100 200 300 400 500
CE
LL
NU
MB
ER
FLUORESCENCE
TRANSGENICCELL LINE
POST-SORT
0 100 200 300 400 500 600 700

-Evaluating large number of cells quantitatively and reproducibly increases the statistical confidence and
precision of data.
-The ability to measure several parameters on thousands of single cells within minute (10,000
cells/second).
-Measurements are made separately on each cell.
-Simultaneous, multiparameter analyses in complex cell populations.
ADVANTAGES

The power of flow cytometry lies in the
ability to measure several parameters on
thousands of single cells within minutes
(1000 cells/second).

BD FACScan is a 3-colour, fixed alignment bench top analyzer, equipped with a 488 nm air-cooled argon laser. It is capable of simultaneously measuring and analyzing FSC, SSC, and 3 spectral regions of fluorescence.

BD LSR: Expands the range of multicolor analysis applications you can run on a benchtop
cytometer, with up to six fluorescence and two scatter parameters.
The LSR also provides high resolution DNA ploidy and pulse processing technology that allows the
measurement of area, width and ratio of detector pulses.

BD FACS Vantage SE: The FACS Vantage SE is an analytical flow cytometer with sorting
capabilities. This instrument has 6-color capability and can sort up to 20,000
cells/sec. The FACS Vantage is equipped with high speed and turbo sorting, as well as pulse processing and automated single-
cell deposition unit.

U OF C FLOW CYTOMETRY USER FACILITY
For more information please contact Laurie Kennedy (210-8598) ([email protected])
QuickTime™ and aPhoto - JPEG decompressor
are needed to see this picture.
We offer individual training on basic flow cytometry on an BD FACScan (488 laser)
Future courses will include: Analysis of flow cytometric data FLOWJO Measurement of Apoptosis DNA and Cell Cycle Analysis

PROVIDING FLOW CYTOMETRY & CELL SORTING SERVICES FEATURING
THE MOST ADVANCED FLOW TECHNOLOGY
•Multi-color immunofluorescence•DNA/Cell cycle analysis
•Intracellular cytokine measurements•Fluorescence quantitation
•Multi-color, rare event and single cell sorting•Comprehensive computer analysis
Flow Cytometry Core Facility, The University of Calgary
Rm 2580 - 3330 Hospital Drive NW, Calgary, AB T2N 4N1tel. 403.220.7502
e-mail [email protected]
www.flowlab.ucalgary.ca

PERSONNEL
Director: John D. Reynolds ([email protected])
Operator: Laurie Robertson, HSC 2580
Tel: 220-7502 e-mail: [email protected]
Operator and Instructor: Laurie Kennedy, HSC 2802
Tel: 210-8598 e-mail: [email protected]

Please visit our website:
www.flowlab.ucalgary.ca