Flow Cytometry Basics
70
Introduction to Flow Cytometry: A Learning Guide Manual Part Number: 11-11032-01 April, 2000 BD Bioscien ces 2350 Qume Drive San Jose, CA 95131-1807 1- 800-448-2347
description
Basics of flow cytometry
Transcript of Flow Cytometry Basics
Introduction to Flow Cytometry:A Learning Guide
Manual Part Number: 11-11032-01April, 2000
BD Biosciences 2350Qume DriveSan Jose, CA 95131-1807 1-800-448-2347
Introduction to Flow Cytometry: A Learning Guide
Copyright
© 2000 Becton, Dickinson and Company. All rights reserved. No part of this publication may be reproduced, transmitted, transcribed, stored in retrieval systems, or translated into any language or computer language, in any form or by any means: electronic, mechanical, magnetic, optical, chemical, manual, or otherwise, without the prior written permission of BD Biosciences, 2350 Qume Drive, San Jose, CA 95131, United States of America.
Disclaimer
BD Biosciences reserves the right to change its products and services at any time to incorporate the latest technological developments. This guide is subject to change without notice. BD Biosciences welcomes customer input on corrections and suggestions for improvement.
Although this guide has been prepared with every precaution to ensure accuracy, BD Biosciences assumes no liability for any errors or omissions, nor for any damages resulting from the application or use of this information.
Trademarks
Apple, the Apple logo, Mac, Macintosh, and Power Macintosh are trademarks of Apple Computer, Inc., registered in the U.S. and other countries. Finder is a trademark of Apple Computer, Inc.
Modfit LT and QuantiCALC are trademarks of Verity Software House, Inc.
CellQuest, FACS, FACSCalibur, FACScan, FACSort, FACStarPLUS
, and FACS Vantage are trademarks of Becton, Dickinson and Company.
Contents
Preface iii
Chapter 1: Overview 5
Chapter 2: Fluidics 9
Chapter 3: Generation of Scatter and Fluorescence 13
3.1 Light Scatter . . . . . . . . . . . . . . . . . . . . . . . . . . . . . . . . . . . . . . . . . . . . . . . . . . . . . . . . . .13
3.2 Fluorescence . . . . . . . . . . . . . . . . . . . . . . . . . . . . . . . . . . . . . . . . . . . . . . . . . . . . . . . . . .16
Chapter 4: Optical System 19
4.1 Optical Bench . . . . . . . . . . . . . . . . . . . . . . . . . . . . . . . . . . . . . . . . . . . . . . . . . . . . . . . . 19
4.2 Optical Filters . . . . . . . . . . . . . . . . . . . . . . . . . . . . . . . . . . . . . . . . . . . . . . . . . . . . . . . . .22
4.3 Signal Detection . . . . . . . . . . . . . . . . . . . . . . . . . . . . . . . . . . . . . . . . . . . . . . . . . . . . . . .24
4.4 Threshold . . . . . . . . . . . . . . . . . . . . . . . . . . . . . . . . . . . . . . . . . . . . . . . . . . . . . . . . . . . . 26
Chapter 5: Data Analysis 27
5.1 Data Collection and Display . . . . . . . . . . . . . . . . . . . . . . . . . . . . . . . . . . . . . . . . . . . . . .27
5.2 Gating . . . . . . . . . . . . . . . . . . . . . . . . . . . . . . . . . . . . . . . . . . . . . . . . . . . . . . . . . . . . . . 29
5.3 Data Analysis for Subsetting Applications . . . . . . . . . . . . . . . . . . . . . . . . . . . . . . . . . . . . 30
5.4 Data Analysis for Other Applications . . . . . . . . . . . . . . . . . . . . . . . . . . . . . . . . . . . . . . . 34
Chapter 6: Sorting 39

6.1 Sorting . . . . . . . . . . . . . . . . . . . . . . . . . . . . . . . . . . . . . . . . . . . . . . . . . . . . . . . . . . . . . . 39
Chapter 7: Lasers and Alignment 43
i

Introduction to Flow Cytometry: A Learning Guide
7.1 How Lasers Work . . . . . . . . . . . . . . . . . . . . . . . . . . . . . . . . . . . . . . . . . . . . . . . . . . . . . .43
7.2 Laser Alignment . . . . . . . . . . . . . . . . . . . . . . . . . . . . . . . . . . . . . . . . . . . . . . . . . . . . . . . 44
Chapter 8: Answer Key 47
ii
Preface
Learning to operate a flow cytometer is best achieved by using the instrument. However, understanding the principles underlying this technology greatly facilitates the process.
This document contains basic information on flow cytometry. Differences between flow cell–based benchtop cytometers (FACScan™, FACSort™, FACSCalibur™, and BD LSR) and stream-in-air cytometers (FACS Vantage™, FACSVantage™ SE,
and FACStarPLUS™
) are described in relevant sections. Reading this material and answering the questions at the end of each section will enhance your hands-on training experience during Operator Training at BD Biosciences.
This assignment will take approximately 2.5 hours to complete. Please reviewit before you attend the training session. An answer key is provided.
If you have any questions or problems in the US, call 1-800-448-2347, Option4. In Europe, contact your local application specialist.
For More Information
For more information on general flow cytometry, review the following:
1• Givan AL. Flow Cytometry: First Principles. New York, NY: Wiley-Liss; 1992 (ISBN 0-471-56095-2).
2• Melamed MR. Flow Cytometry and Sorting. New York, NY: Wiley-Liss;1990 (ISBN 0-471-56235-1).
3• Shapiro H. Practical Flow Cytometry. 3rd ed. New York, NY: Alan R. Liss;1994 (ISBN 0-471-30376-3).
iii

Introduction to Flow Cytometry: A Learning Guide
iv

1
Overview
Flow cytometry is a technology that simultaneously measures and then analyzes multiple physical characteristics of single particles, usually cells, as they flow in a fluid stream through a beam of light. The properties measured include a particle’s relative size, relative granularity or internal complexity, and relative fluorescence intensity. These characteristics are determined using an optical-to-electronic coupling system that records how the cell or particle scatters incident laser light and emits fluorescence.
A flow cytometer is made up of three main systems: fluidics, optics, and electronics.
1• The fluidics system transports particles in a stream to the laser beamfor interrogation.
2• The optics system consists of lasers to illuminate the particles in the sample streamand optical filters to direct the resulting light signals to the appropriate detectors.
3• The electronics system converts the detected light signals into electronic signals that can be processed by the computer. For some instruments equipped with a sorting feature, the electronics system is also capable of initiating sorting decisions to charge and deflect particles.
In the flow cytometer, particles are carried to the laser intercept in a fluid stream. Any suspended particle or cell from 0.2–150 micrometers in size is suitable for analysis. Cellsfrom solid tissue must be disaggregated before analysis. The portion of the fluid stream where particles are located is called the sample core. When particles pass through the laser intercept, they scatter laser light. Any fluorescent molecules present

5
Introduction to Flow Cytometry: A Learning Guide
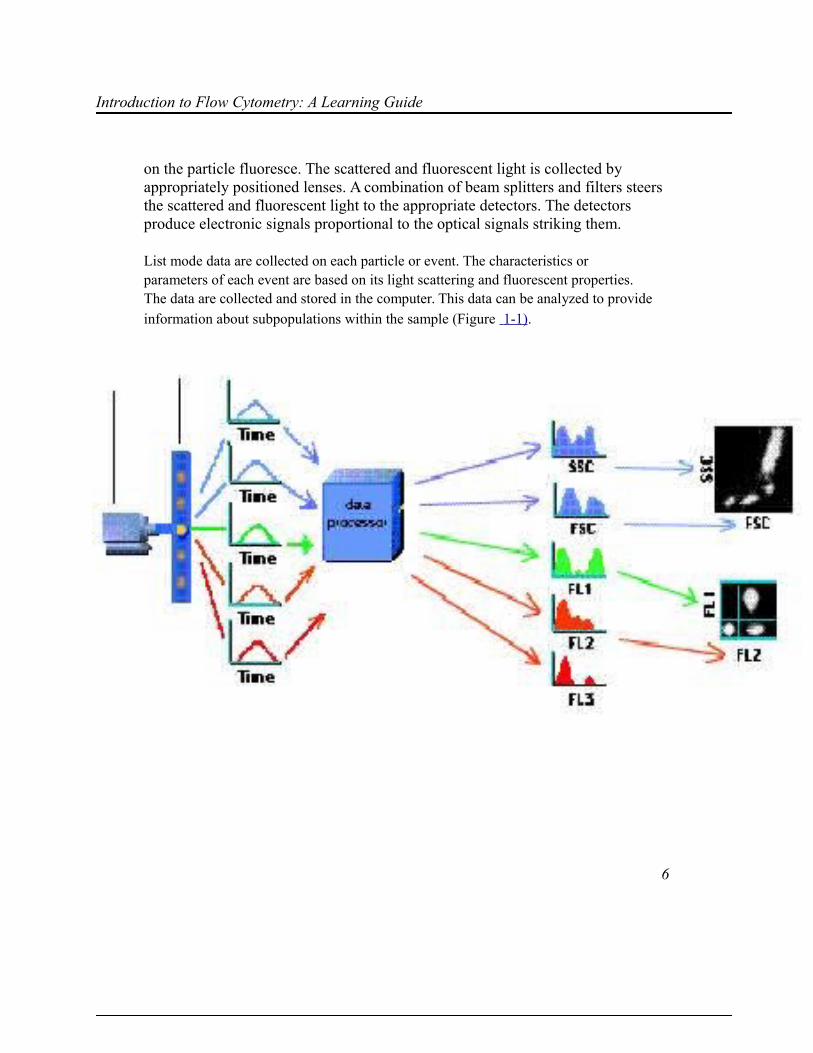
on the particle fluoresce. The scattered and fluorescent light is collected by appropriately positioned lenses. A combination of beam splitters and filters steersthe scattered and fluorescent light to the appropriate detectors. The detectors produce electronic signals proportional to the optical signals striking them.
List mode data are collected on each particle or event. The characteristics or parameters of each event are based on its light scattering and fluorescent properties. The data are collected and stored in the computer. This data can be analyzed to provide
information about subpopulations within the sample (Figure 1-1).
sample corelaser
data displays
electronic pulses
Figure 1-1 Scattered and emitted light signals are converted to electronic pulses that canbe processed by the computer
6
Chapter 1: Overview
Review Questions: Overview
1 What properties of a cell or particle can be measured by a flow cytometer?
2 What light source is used in most flow cytometers?
3 What are the three main systems in a flow cytometer?
4 What type of biological sample is best suited for flow cytometric analysis?
5 What is the name given to the portion of the fluid stream where the cellsare located?
6 When cells labeled with fluorescent molecules pass through the focusedlaser beam, what two types of light signals are generated?
7 Light emitted from a particle is collected by: ___________________________
8 The electronic signal produced by the detectors is proportional to:
9 All flow cytometric measurements can be made simultaneously on a single cell.
T F
10 Particles must be in single-cell suspension before flow cytometric
analysis. T F
7

Introduction to Flow Cytometry: A Learning Guide
8

2
Fluidics
The purpose of the fluidics system is to transport particles in a fluid stream to the laser beam for interrogation. For optimal illumination, the stream transporting theparticles should be positioned in the center of the laser beam. In addition, only one cell or particle should move through the laser beam at a given moment.
To accomplish this, the sample is injected into a stream of sheath fluid within the flow chamber. The flow chamber in a benchtop cytometer is called a flow cell and the flow chamber in a stream-in-air cytometer is called a nozzle tip. The design of the flow chamber causes the sample core to be focused in the center of the sheath fluid where the laser beam will then interact with the particles.
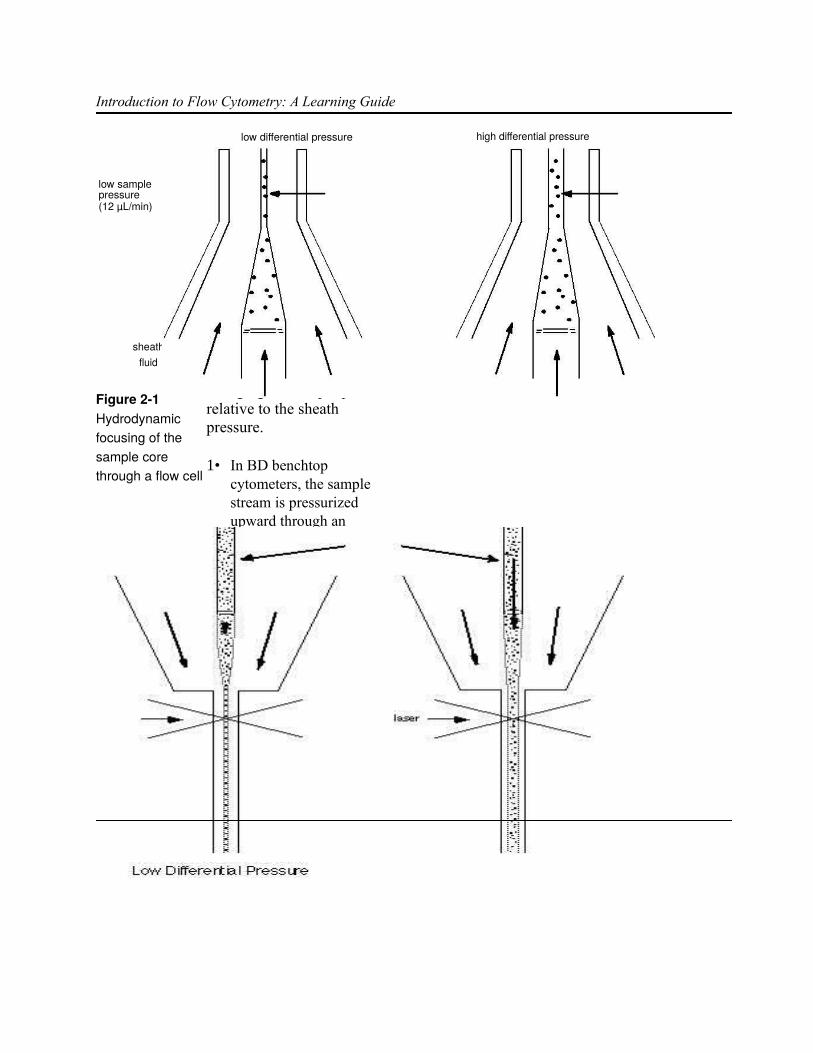
Based on principles relating to laminar flow, the sample core remains separate but coaxial within the sheath fluid. The flow of sheath fluid accelerates the particles and restricts them to the center of the sample core. This process is known as hydrodynamic focusing. For an illustration of hydrodynamic focusing in each type of flow cell, see Figure 2-1 and Figure 2-2.
9
Introduction to Flow Cytometry: A Learning Guide
low samplepressure(12 µL/min)
sheathfluid
Figure 2-1 Hydrodynamic focusing of the sample core through a flow cell
sample
sheath
laser
high differential pressurelow differential pressure
Figure 2-2 Hydrodynamic focusing of the sample core through a nozzle tip
The sample pressure and the sheath fluid pressure are different from each other. Thesample pressure is always greater than the sheath fluid pressure. The sample pressure regulator controls the sample flow rate by changing the sample pressurerelative to the sheath pressure.
1• In BD benchtop cytometers, the sample stream is pressurized upward through an optically clear region of the flow cell or cuvette; particles pass through the laser beam while they are still within this flow cell (Figure 2-1). Most benchtop cytometers have fixed sample pressure settings (LO, MED, and HI). The benchtop BD LSR also has a “fine” adjustment knob for intermediate settings.
10
Chapter 2: Fluidics
1• In stream-in-air cytometers, the sample stream passes through a small orifice in anozzle tip before being intersected by the light beam in the open air (Figure 2-2). Sample pressure settings can be adjusted within a dynamic range.
Increasing the sample pressure increases the flow rate by increasing the width of the sample core. This, in turn, allows more cells to enter the stream within a given moment. With a wider sample core, some cells could pass through the laserbeam off-center and intercept the laser beam at a less optimal angle. However, this might be appropriate for your application.
1• A higher flow rate is generally used for qualitative measurements such as immunophenotyping. The data are less resolved, since the cells are less in line in the wider core stream, but are acquired more quickly.
2• A lower flow rate decreases the width of the sample core and restricts theposition of the cells to a smaller area. The majority of cells passes through thecenter of the laser beam; thus the light illuminating the cells and emitted fromthe cells is more uniform. A lower rate is generally used in applications wheregreater resolution is critical, such as DNA analysis.
Proper operation of fluidic components is critical for particles to properly intercept the laser beam. Therefore, the operator must always ensure that the fluidics system is free of air bubbles and debris and is properly pressurized at all times.
11
Introduction to Flow Cytometry: A Learning Guide
Review Questions: Fluidics
1 The purposeof thefluidicssystem in aflowcytometer is:
2 What twofactors canaffectilluminationof theparticleswithin thelaser beam?
3 How manycells orparticlesshould passthrough thelaser beam at agiven time?
_______________________
4 The particlesuspension isinjected into_________________within the
_________________.
5 The process
of centering the samplecore within the sheathfluid is known as:
6 Which regulator controlsthe diameter of thesample core?
7 What are the threepossible pressure settingsfor a benchtop flowcytometer?
8 Increasing samplepressure______________ thesample flow rate and the
________________ ofthe sample core.
9 Good dataresolution isrequired forDNA studies.What flowrate isrecommended?
10 A wider sample coredecreases resolution.
T F
11 A high flow rate
can be used when
performing
qualitative
measurements. T F

12
3
Generation of Scatter andFluorescence
In the last section, we learned how particles or cells are aligned to pass single filethrough the sample core. Before describing how the flow cytometer detects and processes signals, it is useful to understand what happens to the laser light as it strikes the single-file particles.
3.1 Light Scatter
Light scattering occurs when a particle deflects incident laser light. The extent to which this occurs depends on the physical properties of a particle, namely its sizeand internal complexity. Factors that affect light scattering are the cell's membrane, nucleus, and any granular material inside the cell. Cell shape and surface topography also contribute to the total light scatter.
Forward-scattered light (FSC) is proportional to cell-surface area or size. FSC is a measurement of mostly diffracted light and is detected just off the axis of the incident laser beam in the forward direction by a photodiode (Figure 3-1 on page14). FSC provides a suitable method of detecting particles greater than a given size independent of their fluorescence and is therefore often used in immunophenotyping to trigger signal processing.

13

Introduction to Flow Cytometry: A Learning Guide
Side-scattered light (SSC) is proportional to cell granularity or internal complexity. SSCis a measurement of mostly refracted and reflected light that occurs at any interface within the cell where there is a change in refractive index (Figure 3-1). SSC is collected at approximately90 degrees to thelaser beam by a collection lens and then redirected by a beam splitter to the appropriate detector.
side scatterdetector
light source forward scatter detector
Figure 3-1 Light-scattering properties of a cell
Correlated measurements ofFSC and SSC can allow fordifferentiation of cell types ina heterogeneous cellpopulation. Major leucocytesubpopulations can bedifferentiated using FSC andSSC (Figure 3-2).
neutrophils
lysed whole blood
monocytes
lymphocytes
Figure 3-2 Cell subpopulations based on FSC vs SSC
14

Chapter 3: Generation of Scatter and Fluorescence
Review Questions: Light Scatter
1 When does light scattering occur?
2 Which key cell components contribute to light scatter?
3 Light scattered in the same direction as the laser beam is called:
4 FSC is proportional to: ____________________________________________
5 Light scatter collected at 90 degrees to the laser beam is called:
6 SSC is proportional to the ___________ or _____________ of the cell.
7 Correlated measurements of both _______________ and _____________
can allow differentiation of cells types in a heterogeneous cell population.
15
Introduction to Flow Cytometry: A Learning Guide
3.2 Fluorescence
A fluorescent compound absorbs light energy over a range of wavelengths that is characteristic for that compound. This absorption of light causes an electron in the fluorescent compound to be raised to a higher energy level. The excited electron quickly decays to its ground state, emitting the excess energy as a photonof light. This transition of energy is called fluorescence.
The range over which a fluorescent compound can be excited is termed its absorption spectrum. As more energy is consumed in absorption transitions than is emitted in fluorescent transitions, emitted wavelengths will be longer than those absorbed. The range of emitted wavelengths for a particular compound is termed its emission spectrum.
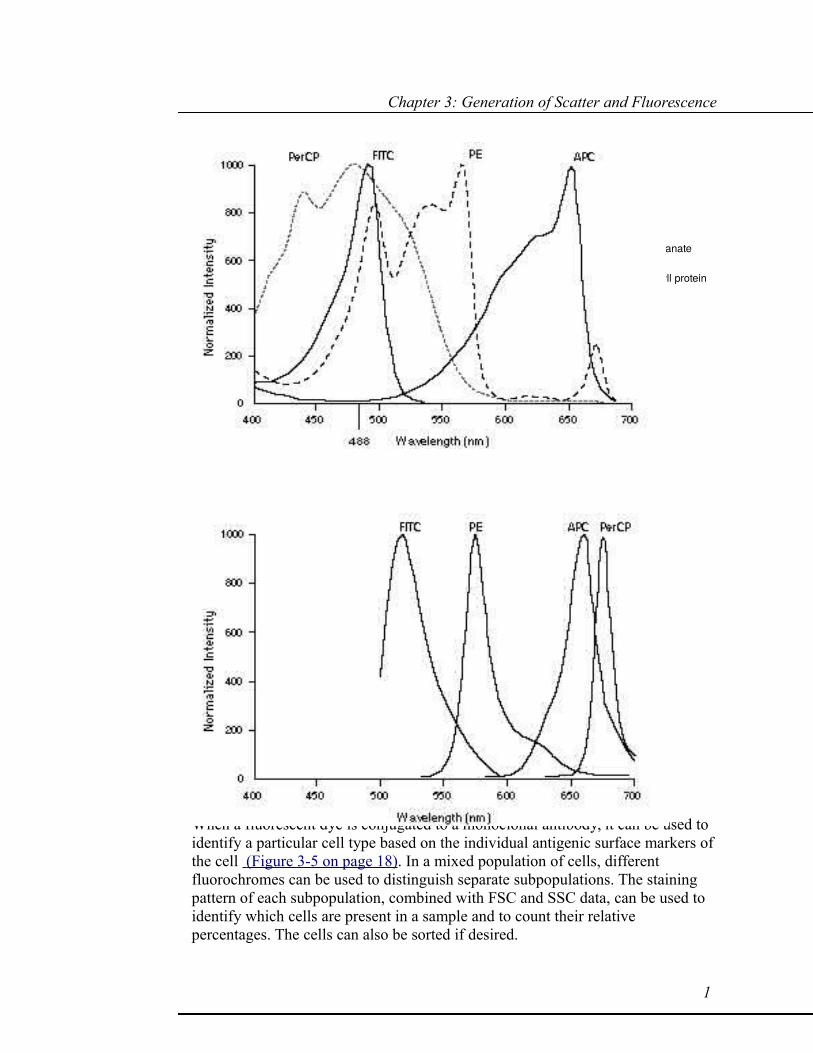
The argon ion laser is commonly used in flow cytometry because the 488-nm light that it emits excites more than one fluorochrome. (See Chapter 7 for more information about lasers.) One of these fluorochromes is fluorescein isothiocyanate (FITC). In the absorption spectrum of FITC (Figure 3-3 on page 17), the 488-nm line is close to the FITC absorption maximum. Excitation with this wavelength will result in a high FITC emission. If the fluorochrome were excited by another wavelength within its absorption spectrum, light emission of the same spectrum would occur but it would not be of the same intensity.
More than one fluorochrome can be used simultaneously if each is excited at 488 nmand if the peak emission wavelengths are not extremely close to each other. The combination of FITC and phycoerythrin (PE) satisfies these criteria. The emission spectrum of each of these fluorochromes is shown in Figure 3-4 on page 17. Although the absorption maximum of PE is not at 488 nm, the fluorochrome is excited enough at this wavelength to provide adequate fluorescence emission for detection. More important, the peak emission wavelength is 530 nm for FITC and 570 nm for PE. These peak emission wavelengths are far enough apart so that each signal can be detected by a separate detector. The amount of fluorescent signal detected is proportional to the number of fluorochrome molecules on the particle.
16
Chapter 3: Generation of Scatter and Fluorescence
FITC = fluorescein isothiocyanatePE = phycoerythrinPerCP = peridinin chlorophyll proteinAPC = allophycocyanin
Figure 3-3 Absorption spectra of four common fluorochromes
Figure 3-4 Emission spectra of the fluorochromes shown in Figure 3-3
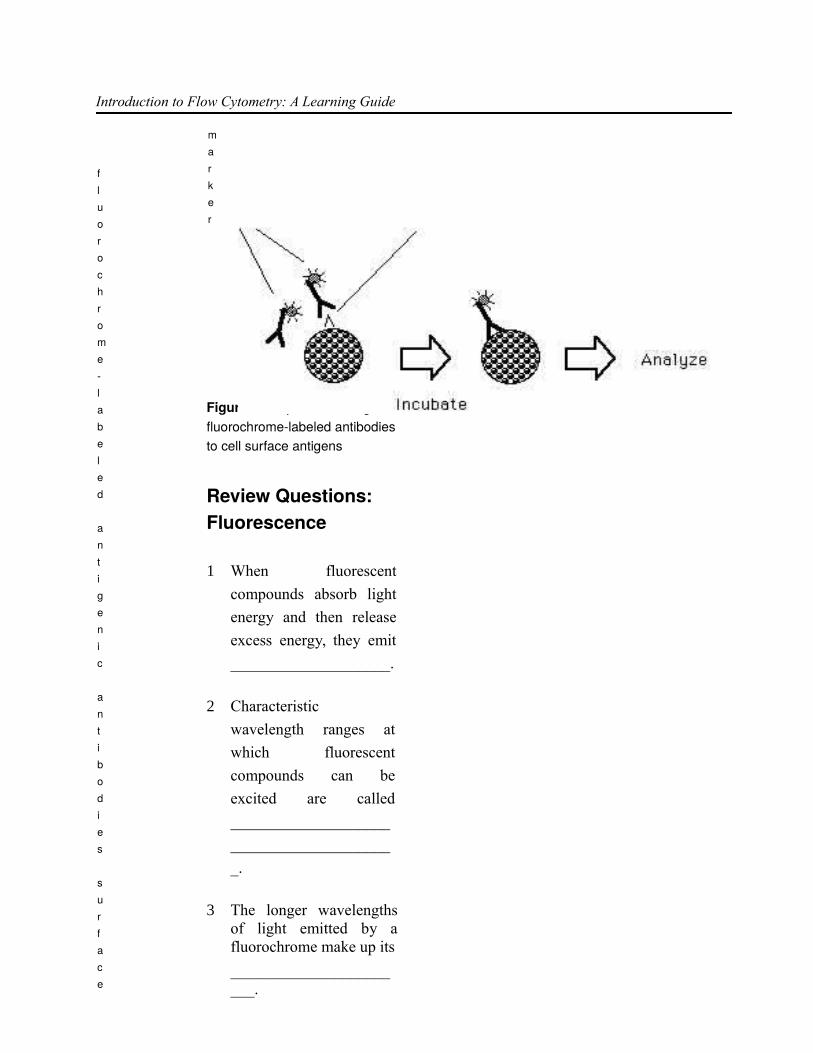
When a fluorescent dye is conjugated to a monoclonal antibody, it can be used to identify a particular cell type based on the individual antigenic surface markers ofthe cell (Figure 3-5 on page 18). In a mixed population of cells, different fluorochromes can be used to distinguish separate subpopulations. The staining pattern of each subpopulation, combined with FSC and SSC data, can be used to identify which cells are present in a sample and to count their relative percentages. The cells can also be sorted if desired.
1

7
Introduction to Flow Cytometry: A Learning Guide
fluorochrome-labeled antigenic antibodies surface
marker
Figure 3-5 Specific binding of fluorochrome-labeled antibodiesto cell surface antigens
Review Questions: Fluorescence
1 When fluorescent
compounds absorb light
energy and then release
excess energy, they emit
____________________.
2 Characteristic
wavelength ranges at
which fluorescent
compounds can be
excited are called
____________________
____________________
_.
3 The longer wavelengthsof light emitted by afluorochrome make up its
_______________________.

4 Which laseris mostcommonlyused in flowcytometry?_________________
5 The FITC
and PE
fluorochro
mes are
excited by
this
emission wavelength of
an argon-ion laser:
_________________
6 Two fluorescent dyescommonly used in flowcytometry are___________ and
____________.
7 Fluorochrome-labeledantibodies are used todetect______________________.
18
4
Optical System
The optical system consists of excitation optics and collection optics. The excitation optics consist of the laser and lenses that are used to shape and focus the laser beam. The collections optics consist of a collection lens to collect light emitted from the particle–laser beam interaction and a system of optical mirrors and filters to route specified wavelengths of the collected light to designated optical detectors. The design of the optical bench allows for these functions to occur.
4.1 Optical Bench
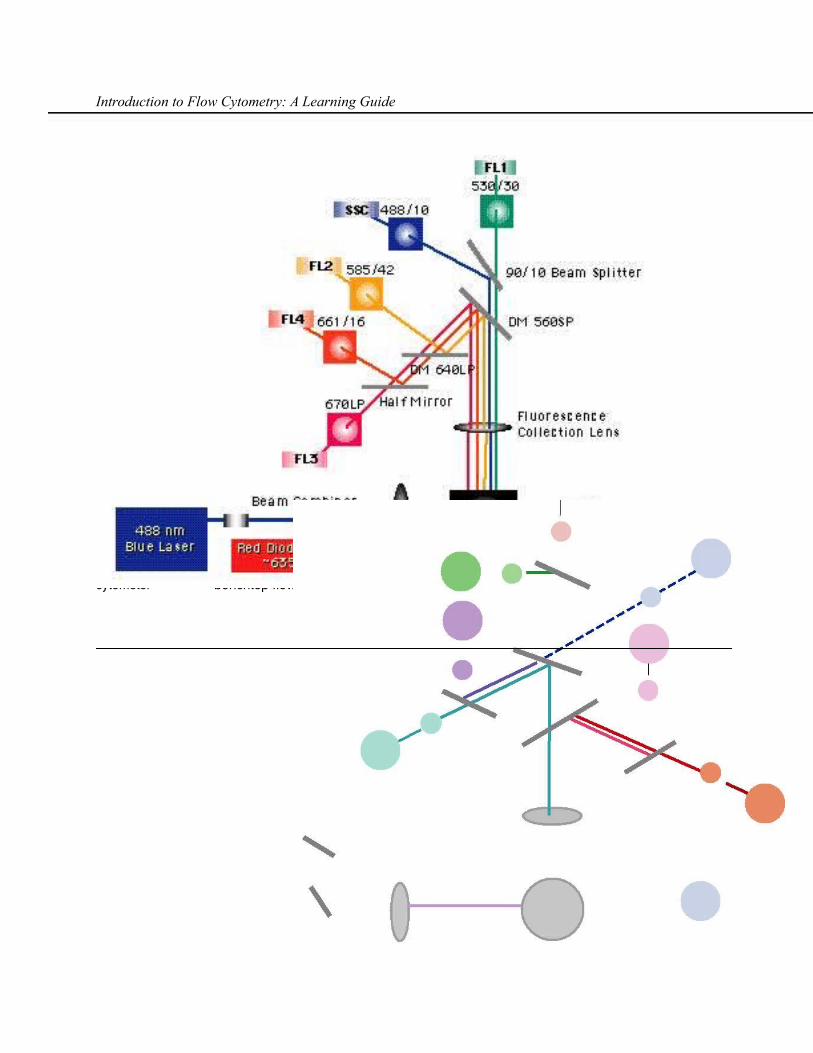
The optical bench in a flow cytometer provides a stable surface that holds the light source and the excitation and collection optics in fixed positions. The alignment of a benchtop analyzer is very stable because the flow cell is fixed in its alignment with the laser beam. This ensures that the laser intercepts the samplestream consistently from day to day. The optical bench for two benchtop cytometers is shown in Figure 4-1 and Figure 4-2 on page 20.
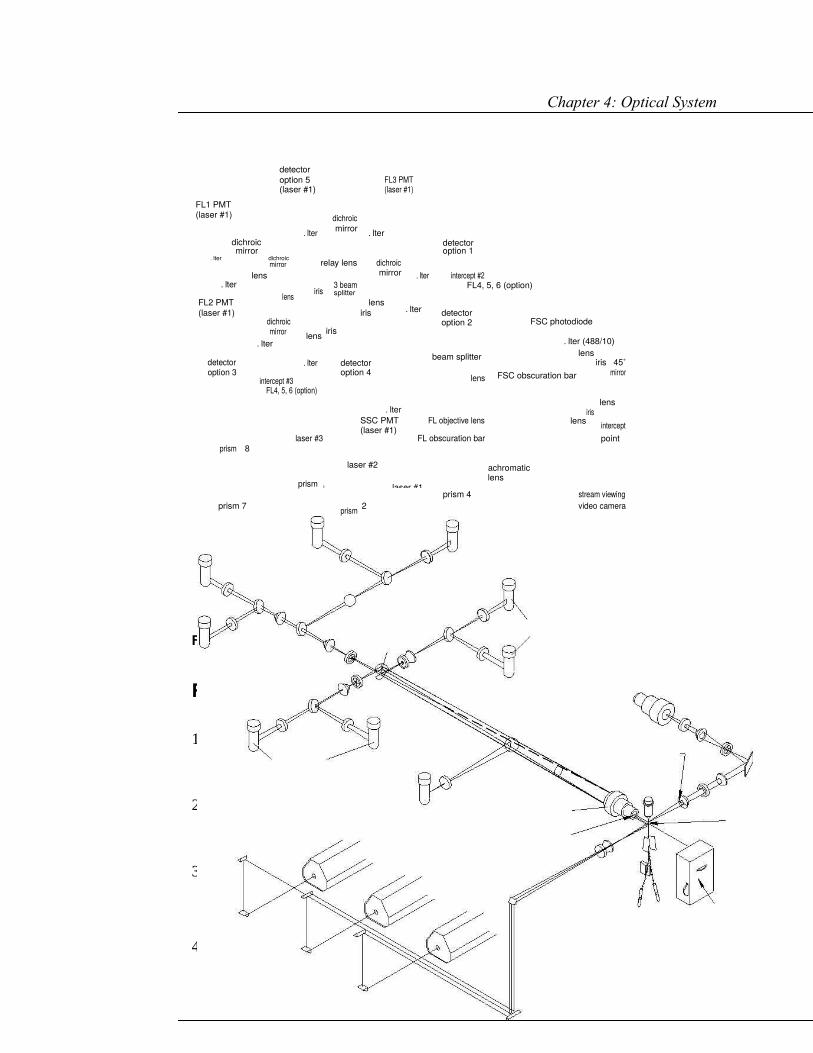
In a stream-in-air cytometer, the laser beam is focused through an achromatic lens tointercept the fluid stream at an optimal angle and position after the stream exits the nozzle. Because of variations in focusing and in the position of the stream, the alignment of a stream-in-air cytometer is less stable than that of a benchtop analyzer and needs to be optimized on a daily basis. Misalignment of the laser beam with the stream can result in uneven illumination of the particles and increased variability in the signals emitted. This results in decreased precision. The optical bench for a stream-in-air cytometer is shown in Figure 4-3 on page 21.

19
Introduction to Flow Cytometry: A Learning Guide
Figure 4-1 Optical bench diagram of the FACSCalibur benchtop flow cytometer
FL2
575/25
530/28
488/25SSC
FL1 555 LP
FL5
380 LP510 LP
FL6
470 LP 620 SP 660/13
670 LP
FL4 510/20 670 LP
488 nm FL3laser fluorescence
collection lens
633 nm 488 pass/laser 633 reflect
325 nm FSClaser
flow cell
UV pass/focusing lens488 & 633 reflect
Figure 4-2 Optical bench diagram of the BD LSR benchtop flow cytometer
20
Chapter 4: Optical System
detectoroption 5 FL3 PMT(laser #1) (laser #1)
FL1 PMT(laser #1) dichroic
filter mirror filterdichroic detectormirror option 1
filter dichroic relay lens dichroicmirrorlens mirror filter intercept #2
filter 3 beamiris FL4, 5, 6 (option)
lens splitterFL2 PMT lens
filter(laser #1) iris detectordichroic FSC photodiode
irisoption 2
mirror lensfilter filter (488/10)
lensdetector beam splitter iris 45˚filter detectoroption 3 option 4 lens FSC obscuration bar mirror
intercept #3FL4, 5, 6 (option)
filter irislens
SSC PMT FL objective lens lens intercept(laser #1)laser #3 FL obscuration bar point
prism 8
laser #2 achromatic
prism 6
lenslaser #1
prism 4 stream viewingprism 7 prism 2 video camera
prism 5
prism 1
prism 3
Figure 4-3 Optical bench diagram of the FACSVantage SE stream-in-air flow cytometer
Review Questions: Optical Bench
1 The optical bench provides a stable surface for the interaction of the laser
light with the ___________________________.
2 Which two components of the flow cytometer must be perfectly aligned to
illuminate cells uniformly? _____________________________________
3 The alignment of a stream-in-air cytometer requires daily optimization.
T F
4 For benchtop flow cytometers, the fixed _________________ ensures that
the laser intercepts the _________________ consistently from day to day.

21
Introduction to Flow Cytometry: A Learning Guide
4.2
Optical Filters
Once a cell or particle passes through the laser light, emitted SSC and fluorescence signals are diverted to the photomultiplier tubes (PMTs) and a photodiode collects the FSC signals. All of thesignals are routed to their detectorsvia a system of mirrors and optical filters.
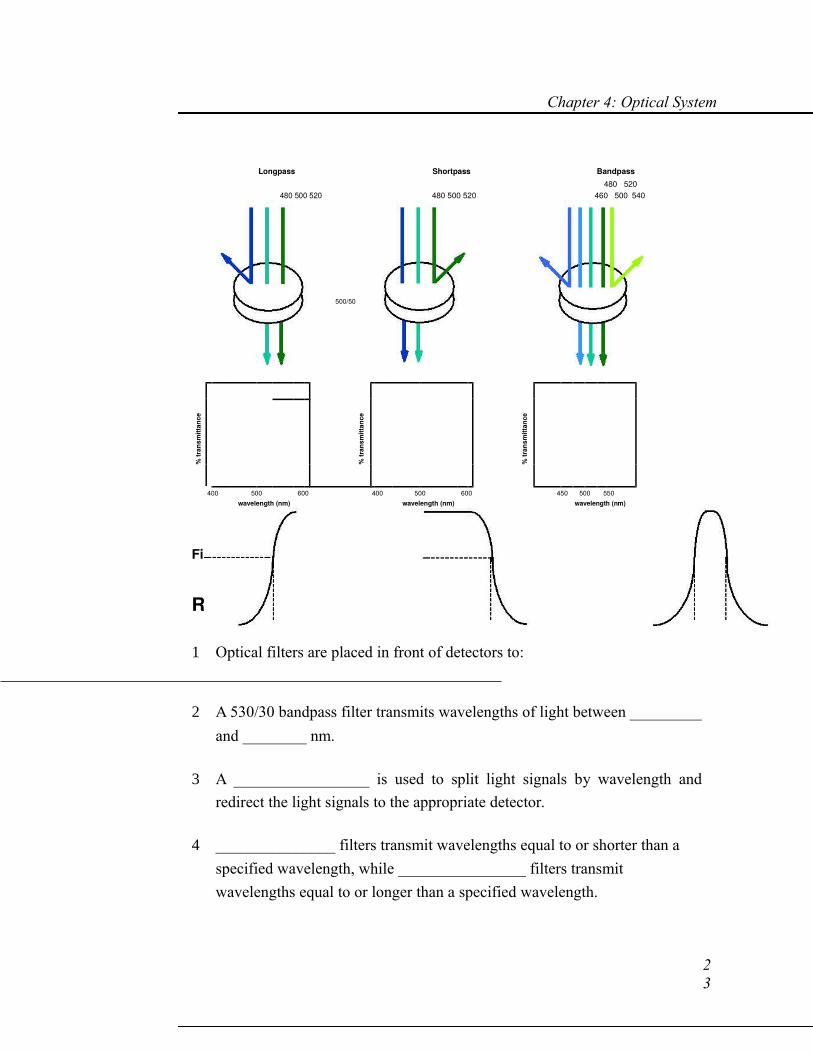
PMTs detect fluorescence signals, which are often weak. The specificity of a detector for a particular fluorescent dye is optimized by placing a filter in front of the PMT,which allows only a narrow range of wavelengths to reach the detector. This spectral band of light is close to the emission peak of the fluorescent dye. Such filters are called bandpass (BP) filters. For example, the filter used in front of the FITCdetector is labeled 530/30. This number gives the characteristics of the spectral band transmitted: 530 ±15 nm,or wavelengths of light that are between 515 nm and545 nm.
Other filters used in the flow cytometer are shortpass (SP) filters, which transmit wavelengths of light equal to or shorter thana specified wavelength, and longpass (LP) filters, which transmit wavelengths of light equal to or longer than a specified wavelength(Figure 4-4 on page 23).
Beam splitters are devices that direct lightof different
wavelengths in differentdirections. Dichroicmirrors are a type of
beam splitter. The 560 SP dichroic mirror shown in Figure 4-1 transmits wavelengths of light 560 nm or shorter. Wavelengths of light longer than 560 nm are reflected at45 degrees.
22
Chapter 4: Optical System
Longpass Shortpass Bandpass
480 500 520 480 500 520480 520
460 500 540
LP500SP500 500/50
% tr
ansm
ittan
ce
% tr
ansm
ittan
ce
% tr
ansm
ittan
ce
400 500 600 400 500 600 450 500 550wavelength (nm) wavelength (nm) wavelength (nm)
Figure 4-4 Light transmittance through longpass, shortpass, and bandpass filters
Review Questions: Optical Filters
1 Optical filters are placed in front of detectors to:
2 A 530/30 bandpass filter transmits wavelengths of light between _________
and ________ nm.
3 A _________________ is used to split light signals by wavelength and
redirect the light signals to the appropriate detector.
4 _______________ filters transmit wavelengths equal to or shorter than a
specified wavelength, while ________________ filters transmit
wavelengths equal to or longer than a specified wavelength.
23
Introduction to Flow Cytometry: A Learning Guide
4.3 Signal Detection
Light signals are generated as particles pass through the laser beam in a fluid stream. These light signals are converted to electronic signals (voltages) by photodetectors and then assigned a channel number on a data plot. There are two types of photodetectors in BD flow cytometers: photodiodes and photomultiplier tubes (PMTs). The photodiode is less sensitive to light signals than the PMTs and thus is used to detect the stronger FSC signal. PMTs are used to detect the weakersignals generated by SSC and fluorescence.
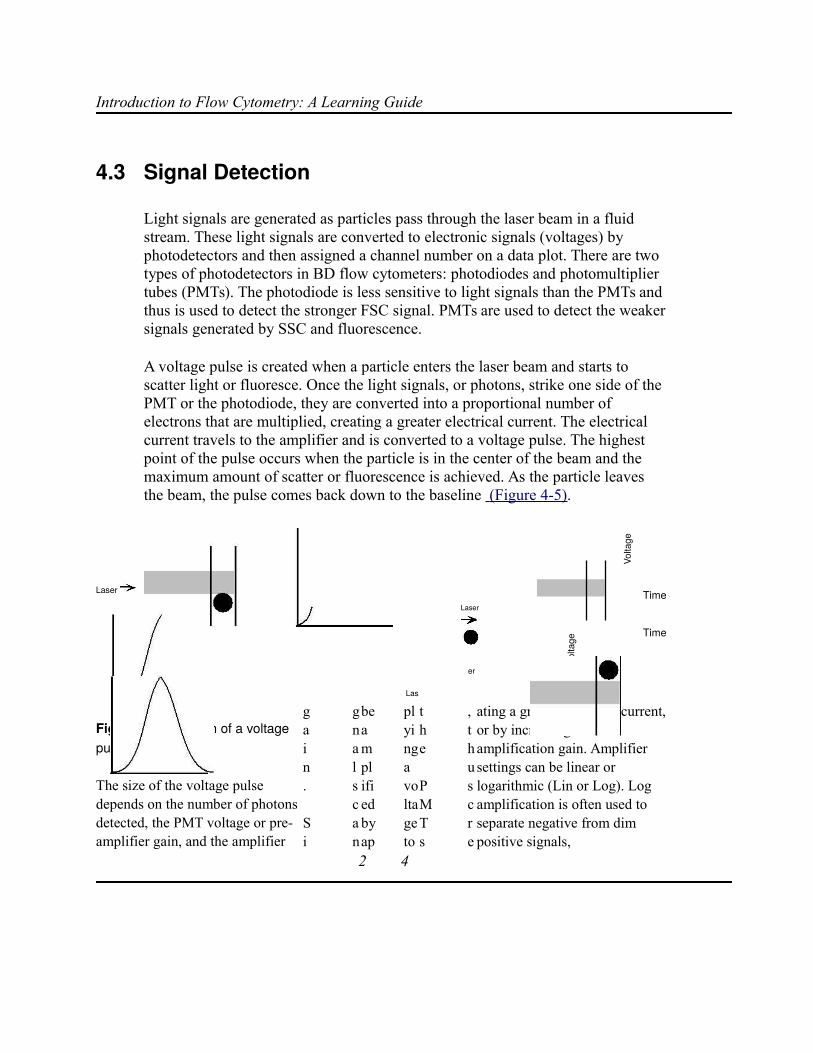
A voltage pulse is created when a particle enters the laser beam and starts to scatter light or fluoresce. Once the light signals, or photons, strike one side of the PMT or the photodiode, they are converted into a proportional number of electrons that are multiplied, creating a greater electrical current. The electrical current travels to the amplifier and is converted to a voltage pulse. The highest point of the pulse occurs when the particle is in the center of the beam and the maximum amount of scatter or fluorescence is achieved. As the particle leaves the beam, the pulse comes back down to the baseline (Figure 4-5).
Laser
Volta
ge
TimeLaser
Volta
ge
Time
Las
er
Volta
ge
Time
Figure 4-5 Creation of a voltage pulse
The size of the voltage pulse depends on the number of photons detected, the PMT voltage or pre-amplifier gain, and the amplifier
gain. Si
gnalscan
beamplifiedbyap
plyinga voltageto
the PMTs
, thuscre
ating a greater electrical current,or by increasing the amplification gain. Amplifier settings can be linear or logarithmic (Lin or Log). Log amplification is often used to separate negative from dim positive signals,
2 4
Chapter 4: Optical System
whereas linear amplification is often used to amplify scatter and fluorescent parameters.
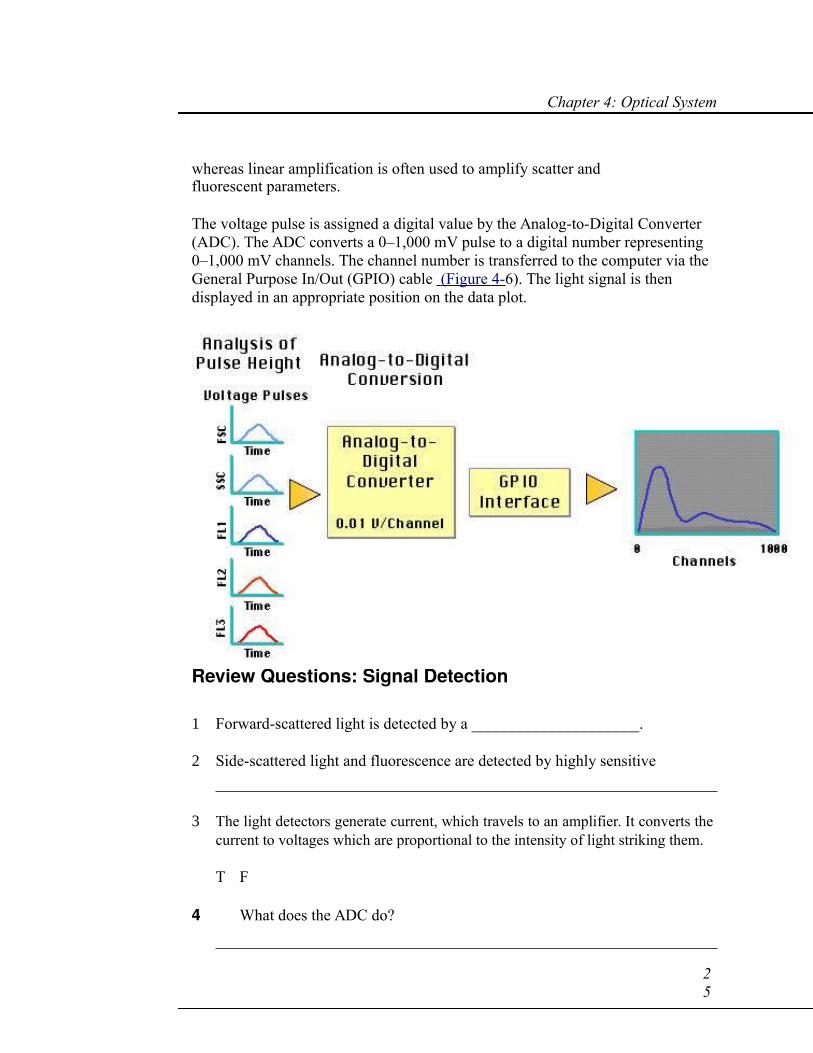
The voltage pulse is assigned a digital value by the Analog-to-Digital Converter (ADC). The ADC converts a 0–1,000 mV pulse to a digital number representing 0–1,000 mV channels. The channel number is transferred to the computer via the General Purpose In/Out (GPIO) cable (Figure 4-6). The light signal is then displayed in an appropriate position on the data plot.
Figure 4-6 Voltage pulses converted to channel values by ADC converter
Review Questions: Signal Detection
1 Forward-scattered light is detected by a _____________________.
2 Side-scattered light and fluorescence are detected by highly sensitive
3 The light detectors generate current, which travels to an amplifier. It converts thecurrent to voltages which are proportional to the intensity of light striking them.
T F
4 What does the ADC do?
25
Introduction to Flow Cytometry: A Learning Guide
4.4 Threshold
An electronic threshold can be used to limit the number of events that the flow cytometer acquires. A threshold is set on one parameter. When a threshold value is defined, only signals with an intensity greater than or equal to the threshold channel value will be processed and sent to the computer. For example, when running immunophenotyping samples, the threshold can be set on FSC to eliminate events such as debris that are smaller than the threshold channel number. Other parameters can be used to set the threshold depending on the application.
A second threshold parameter is available on some benchtop analyzers equipped with the second-laser option. If two threshold parameters are chosen, then the particle must meet the values of both thresholds to be processed as an event.
Review Questions: Threshold
1 FSC threshold can be used to eliminate signals generated from:
2 If two threshold parameters are chosen, the event must meet the values ofone or the other parameter to be processed.
T F
26
5
Data Analysis
5.1 Data Collection and Display
Once light signals have been converted to electronic pulses and then converted tochannel numbers by the ADC, the data must be stored by the computer system.
Flow cytometric data is stored according to a standard format, the flow cytometry
standard (FCS) format, developed by the Society for Analytical Cytology.*
According to the FCS standard, a data storage file includes a description of the sample acquired, the instrument on which the data was collected, the data set, andthe results of data analysis.
A single cell analyzed for four parameters (FSC, SSC, FITC, and PE fluorescence) generates 8 bytes of data. When multiplied by the approximately 10,000 events collected for a single sample, an FCS data file typically contains 80 kB of data.
Once a data file has been saved, cell populations can be displayed in several differentformats. A single parameter such as FSC or FITC (FL1) can be displayed as a single-parameter histogram, where the horizontal axis represents the parameter’s signal value inchannel numbers and the vertical axis represents the number of events per channelnumber (Figure 5-1). Each event is placed in the channel that corresponds to its signal
1* Data file standard for flow cytometry. Data File Standards Committee of the Society for Analytical Cytology.Cytome-try. 1990;11(3):323-332.

27
Introduction to Flow Cytometry: A Learning Guide
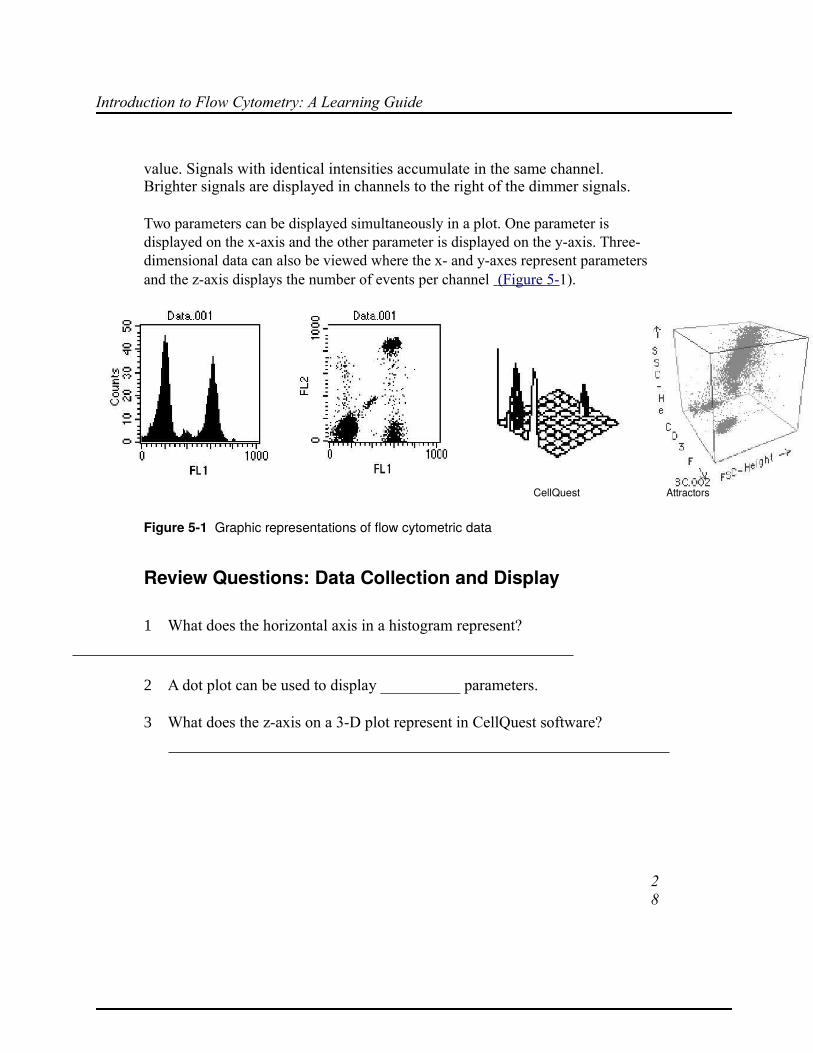
value. Signals with identical intensities accumulate in the same channel. Brighter signals are displayed in channels to the right of the dimmer signals.
Two parameters can be displayed simultaneously in a plot. One parameter is displayed on the x-axis and the other parameter is displayed on the y-axis. Three-dimensional data can also be viewed where the x- and y-axes represent parameters and the z-axis displays the number of events per channel (Figure 5-1).
Histogram 2-D plot 3-D plot 3-D plotCellQuest Attractors
Figure 5-1 Graphic representations of flow cytometric data
Review Questions: Data Collection and Display
1 What does the horizontal axis in a histogram represent?
2 A dot plot can be used to display __________ parameters.
3 What does the z-axis on a 3-D plot represent in CellQuest software?
28
Chapter 5: Data Analysis
5.2 Gating
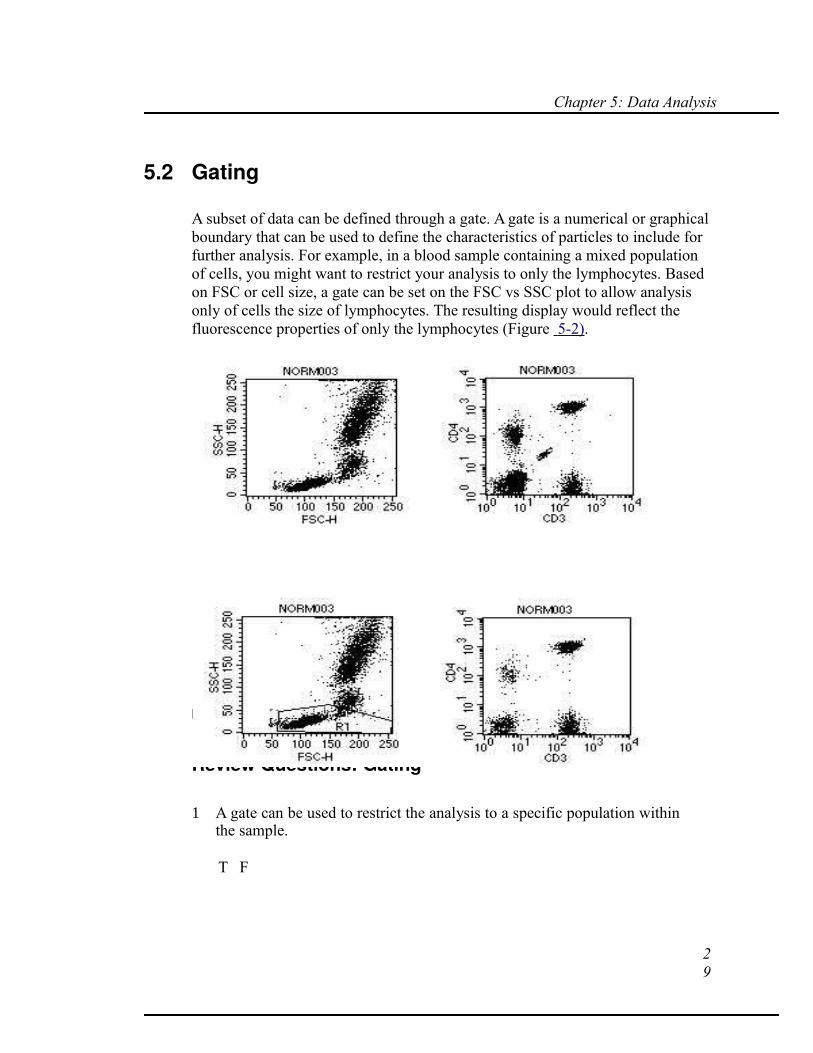
A subset of data can be defined through a gate. A gate is a numerical or graphical boundary that can be used to define the characteristics of particles to include for further analysis. For example, in a blood sample containing a mixed population of cells, you might want to restrict your analysis to only the lymphocytes. Based on FSC or cell size, a gate can be set on the FSC vs SSC plot to allow analysis only of cells the size of lymphocytes. The resulting display would reflect the fluorescence properties of only the lymphocytes (Figure 5-2).
ungated data
gated data
Figure 5-2 Use of gating to restrict analysis to one population
Review Questions: Gating
1 A gate can be used to restrict the analysis to a specific population withinthe sample.
T F
29
Introduction to Flow Cytometry: A Learning Guide
5.3 Data Analysis for Subsetting Applications
Data analysis consists of displaying the data from a list-mode file in a plot, then measuring the distribution of the events within the plots. As mentioned earlier, several types of plots can be used to present the data. Data can also be subdividedby gating upon specific populations.
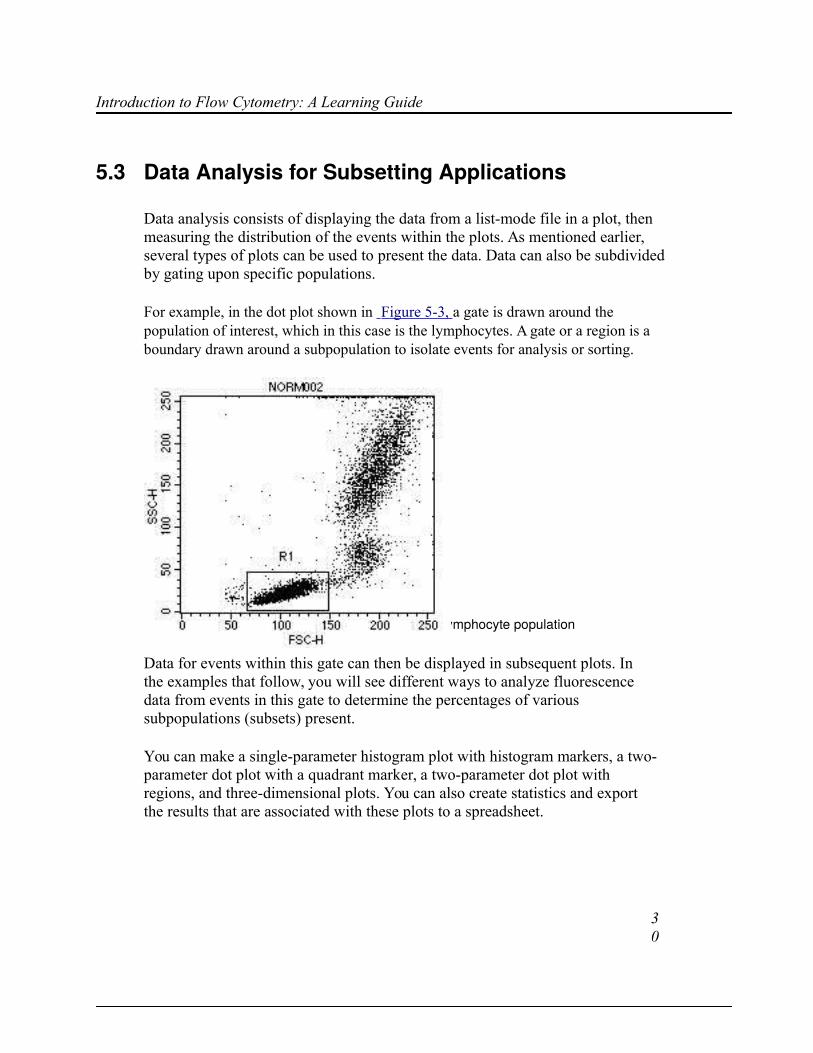
For example, in the dot plot shown in Figure 5-3, a gate is drawn around the population of interest, which in this case is the lymphocytes. A gate or a region is aboundary drawn around a subpopulation to isolate events for analysis or sorting.
Figure 5-3 Dot plot with a gate encompassing the lymphocyte population
Data for events within this gate can then be displayed in subsequent plots. In the examples that follow, you will see different ways to analyze fluorescence data from events in this gate to determine the percentages of various subpopulations (subsets) present.
You can make a single-parameter histogram plot with histogram markers, a two-parameter dot plot with a quadrant marker, a two-parameter dot plot with regions, and three-dimensional plots. You can also create statistics and export the results that are associated with these plots to a spreadsheet.
30
Chapter 5: Data Analysis
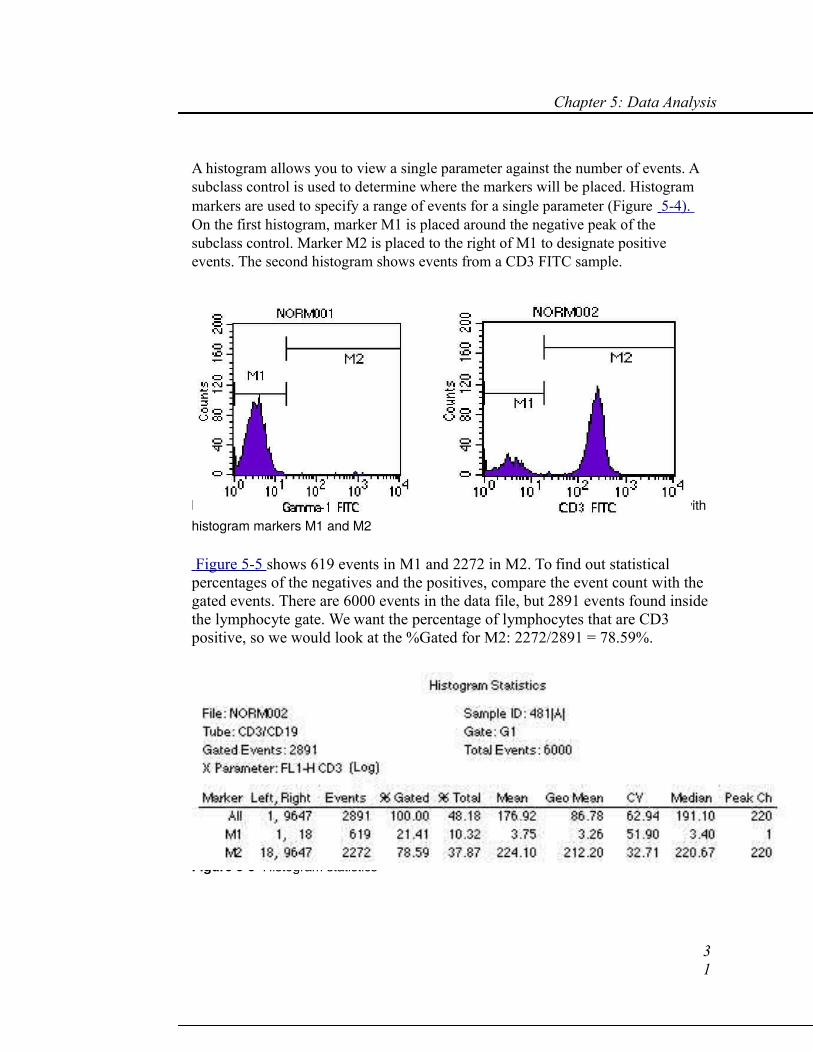
A histogram allows you to view a single parameter against the number of events. A subclass control is used to determine where the markers will be placed. Histogram markers are used to specify a range of events for a single parameter (Figure 5-4). On the first histogram, marker M1 is placed around the negative peak of the subclass control. Marker M2 is placed to the right of M1 to designate positive events. The second histogram shows events from a CD3 FITC sample.
Figure 5-4 Histograms of subclass control (NORM001) and CD3 FITC (NORM002) with histogram markers M1 and M2
Figure 5-5 shows 619 events in M1 and 2272 in M2. To find out statistical percentages of the negatives and the positives, compare the event count with the gated events. There are 6000 events in the data file, but 2891 events found inside the lymphocyte gate. We want the percentage of lymphocytes that are CD3 positive, so we would look at the %Gated for M2: 2272/2891 = 78.59%.
Figure 5-5 Histogram statistics
31
Introduction to Flow Cytometry: A Learning Guide
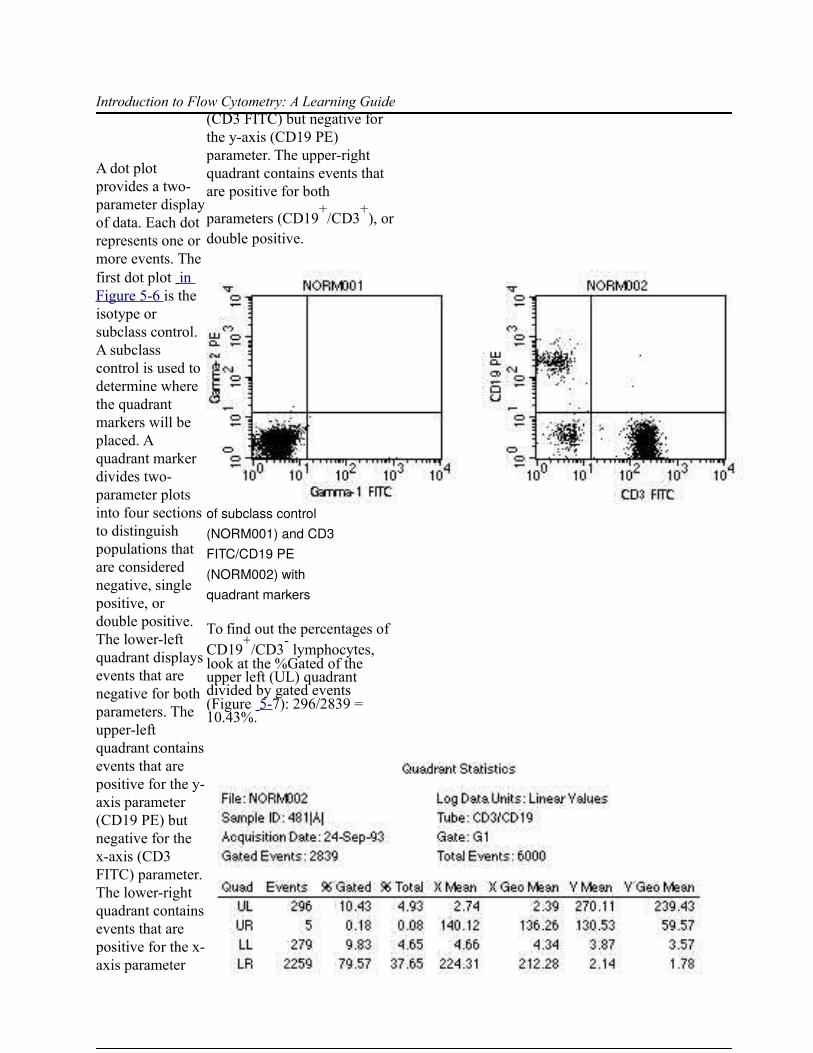
A dot plot provides a two-parameter displayof data. Each dot represents one or more events. The first dot plot in Figure 5-6 is the isotype or subclass control. A subclass control is used to determine where the quadrant markers will be placed. A quadrant marker divides two-parameter plots into four sections to distinguish populations that are considered negative, single positive, or double positive. The lower-left quadrant displaysevents that are negative for both parameters. The upper-left quadrant containsevents that are positive for the y-axis parameter (CD19 PE) but negative for the x-axis (CD3 FITC) parameter. The lower-right quadrant containsevents that are positive for the x-axis parameter
(CD3 FITC) but negative for the y-axis (CD19 PE) parameter. The upper-right quadrant contains events that are positive for both
parameters (CD19+
/CD3+
), or double positive.
Figure 5-6 Dot plots of subclass control (NORM001) and CD3FITC/CD19 PE (NORM002) with quadrant markers
To find out the percentages of CD19
+/CD3
- lymphocytes,
look at the %Gated of the upper left (UL) quadrant divided by gated events (Figure 5-7): 296/2839 = 10.43%.
Figure 5-7 Quadrant statistics

32

Chapter 5: Data Analysis
An alternative way to get statistics is to create regions around the populations insteadof using a quadrant marker. You can create differently shaped regions (Figure 5-8); then use region statistics to find out the percentages of specific populations. In
Figure 5-9, the %Gated of R4 is the CD3–/CD4
+ lymphocytes: 40/2866 = 1.40%.
Figure 5-8 Dot plot of CD3 FITC/CD4 PE with four regions
Figure 5-9 Region statistics
There is a disadvantage to using both of these analysis methods if you have several files to analyze from different donor samples. If you had drawn the regions around populations or created quadrant markers from one data file and then read in another file, it is possible that the populations will fall outside the regions or markers due to sample variability. In this case, you would have to readjust the regions or markers for every file.
There is a new analysis method available to avoid this situation. This innovative technology is called cluster analysis. BD MultiSETTM and AttractorsTM software use cluster analysis to analyze data. In these software programs, regions shift their positions to encompass clusters from one data file to the next (Figure 5-10).

33
Introduction to Flow Cytometry: A Learning Guide
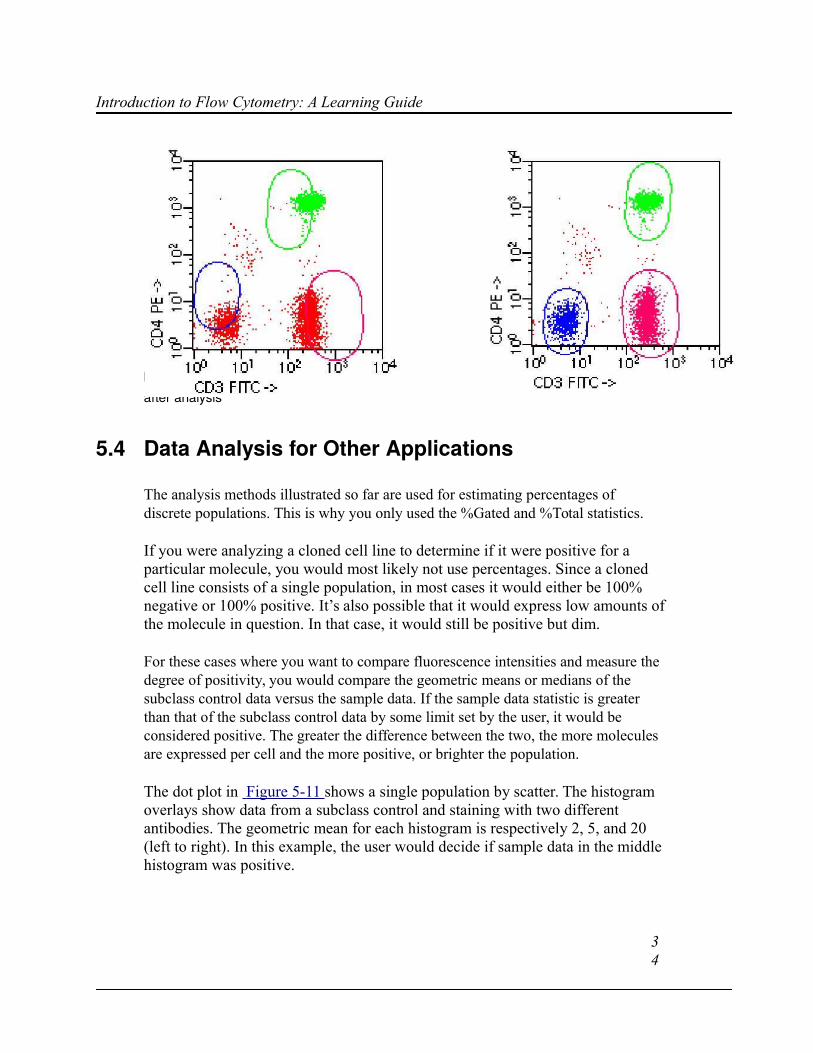
Figure 5-10 Two-parameter plot in Attractors software with ellipsoid regions before andafter analysis
5.4 Data Analysis for Other Applications
The analysis methods illustrated so far are used for estimating percentages of discrete populations. This is why you only used the %Gated and %Total statistics.
If you were analyzing a cloned cell line to determine if it were positive for a particular molecule, you would most likely not use percentages. Since a cloned cell line consists of a single population, in most cases it would either be 100% negative or 100% positive. It’s also possible that it would express low amounts ofthe molecule in question. In that case, it would still be positive but dim.
For these cases where you want to compare fluorescence intensities and measure the degree of positivity, you would compare the geometric means or medians of the subclass control data versus the sample data. If the sample data statistic is greater than that of the subclass control data by some limit set by the user, it would be considered positive. The greater the difference between the two, the more molecules are expressed per cell and the more positive, or brighter the population.
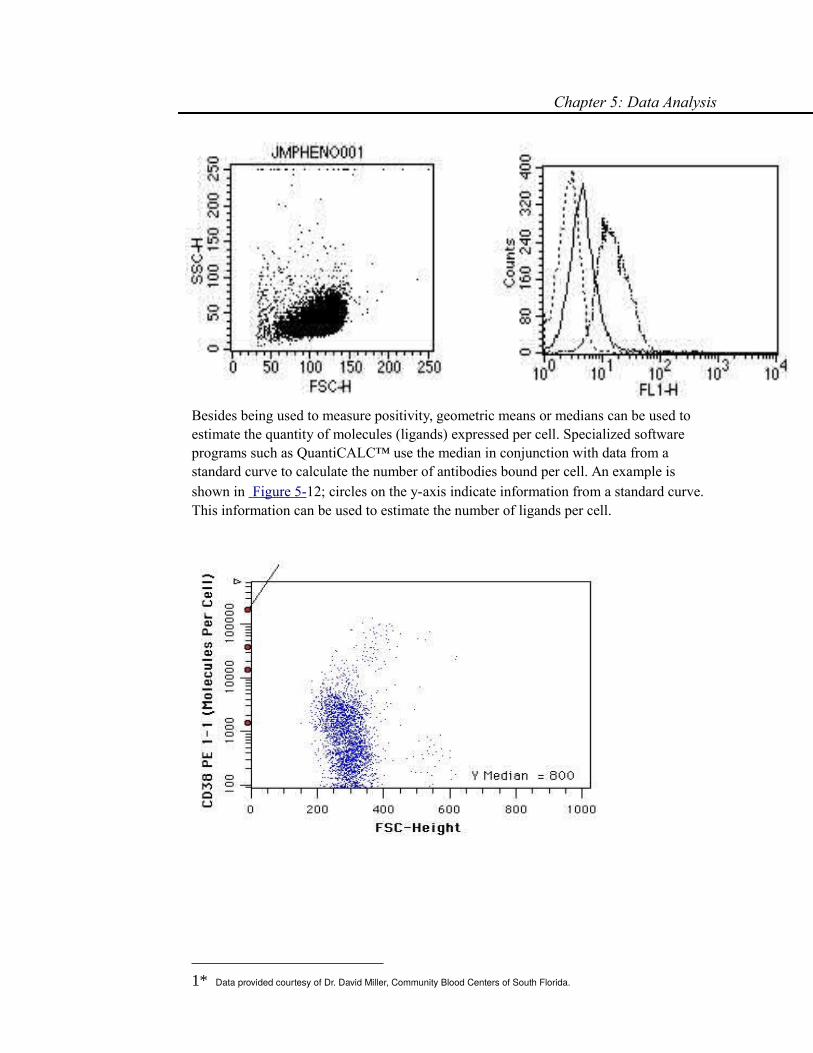
The dot plot in Figure 5-11 shows a single population by scatter. The histogram overlays show data from a subclass control and staining with two different antibodies. The geometric mean for each histogram is respectively 2, 5, and 20 (left to right). In this example, the user would decide if sample data in the middle histogram was positive.
34
Chapter 5: Data Analysis
Figure 5-11 Analysis of a cell line
Besides being used to measure positivity, geometric means or medians can be used to estimate the quantity of molecules (ligands) expressed per cell. Specialized software programs such as QuantiCALC™ use the median in conjunction with data from a standard curve to calculate the number of antibodies bound per cell. An example is shown in Figure 5-12; circles on the y-axis indicate information from a standard curve. This information can be used to estimate the number of ligands per cell.
information from a standard curve
Figure 5-12 QuantiCALC estimate of number of antibodies bound per cell*
1* Data provided courtesy of Dr. David Miller, Community Blood Centers of South Florida.

35
Introduction to Flow Cytometry: A Learning Guide
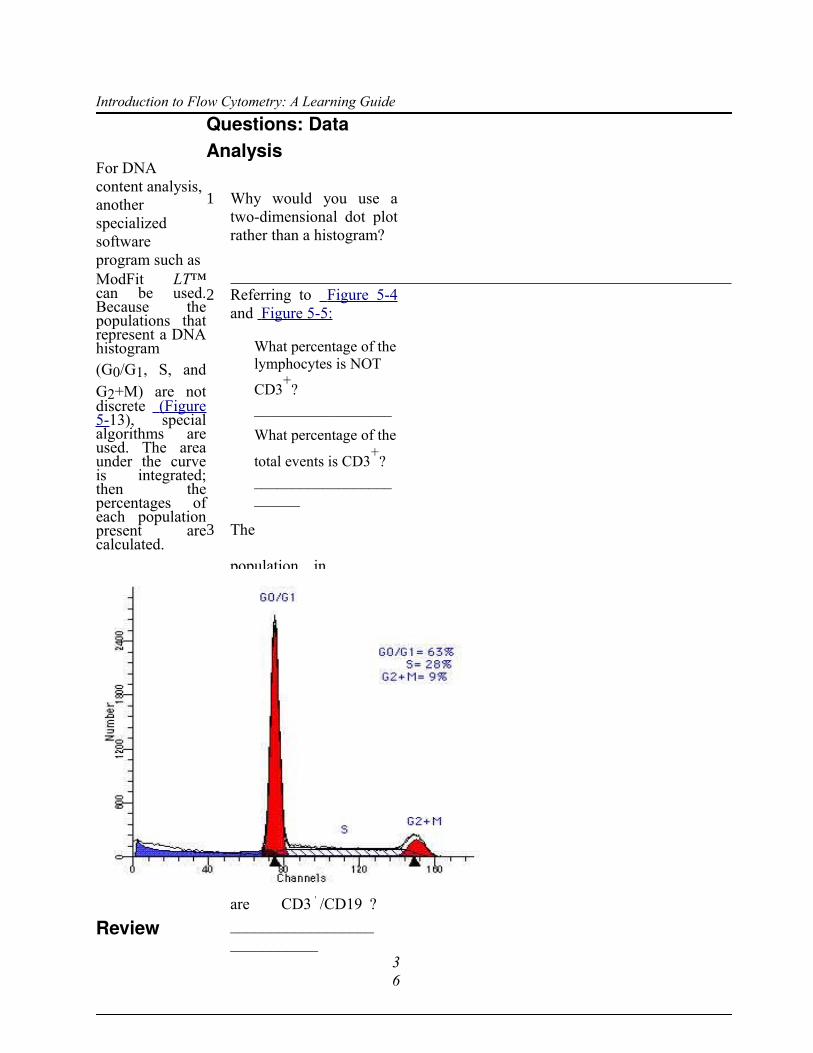
For DNA content analysis,another specialized software program such asModFit LT™can be used.Because thepopulations thatrepresent a DNAhistogram(G0/G1, S, andG2+M) are notdiscrete (Figure5-13), specialalgorithms areused. The areaunder the curveis integrated;then thepercentages ofeach populationpresent arecalculated.
Figure 5-13 DNA histogram
Review
Questions: Data Analysis
1 Why would you use atwo-dimensional dot plotrather than a histogram?
2 Referring to Figure 5-4and Figure 5-5:
What percentage of thelymphocytes is NOT
CD3+
? __________________
What percentage of the
total events is CD3+
? ________________________
3 The
population in
the LL
quadrant is the
double-
positive
population. T
F
4 Referring to Figure 5-6 and Figure 5-7,what is the percentageof lymphocytes that
are CD3+
/CD19–?
_____________________________
36
Chapter 5: Data Analysis
5 Regions can only be drawn as
rectangles. T F
6 What is the disadvantage of using regions to analyze several files?
7 What kind of data analysis avoids the problem of shifting groups ofcell populations?
8 What statistics are used to measure degree of positivity and forquantitation studies?
37

Introduction to Flow Cytometry: A Learning Guide
38

6
Sorting
6.1 Sorting
In most applications, after a particle exits the laser beam, it is sent to waste. Sorting allows us to capture and collect cells of interest for further analysis. Once collected, the cells can be analyzed microscopically, biochemically, or functionally. Not all benchtop flow cytometers are equipped with a sorting feature; however, they can be upgraded to perform this function.
To sort particles or cells, the cytometer first needs to identify the cells of interest, then separate out the individual cells. Once the population of interest has been identified on a data acquisition plot, a region is drawn around that population. A logical gate is created from the regions. This gate is then loaded into the cytometer’s software as the sort gate. The sort gate identifies cells of interest to be sorted out of the stream.
Different cytometers have different methods of capturing a particle of interest.The FACSCalibur system, a benchtop analyzer, uses a mechanical device called acatcher tube to sort cells. This catcher tube is located in the upper portion of theflow cell. It moves in and out of the sample stream to collect a population ofdesired cells at a rate of up to 300 cells per second.
As a cell passes through the laser beam, the FACSCalibur electronics system, using the sort gate characteristics, quickly determines if the cell is a target. The target cell is captured according to the preselected sort mode. A sort mode is the criteria of capturing the target cells relative to accurate cell count or purity. Because laser

39
Introduction to Flow Cytometry: A Learning Guide
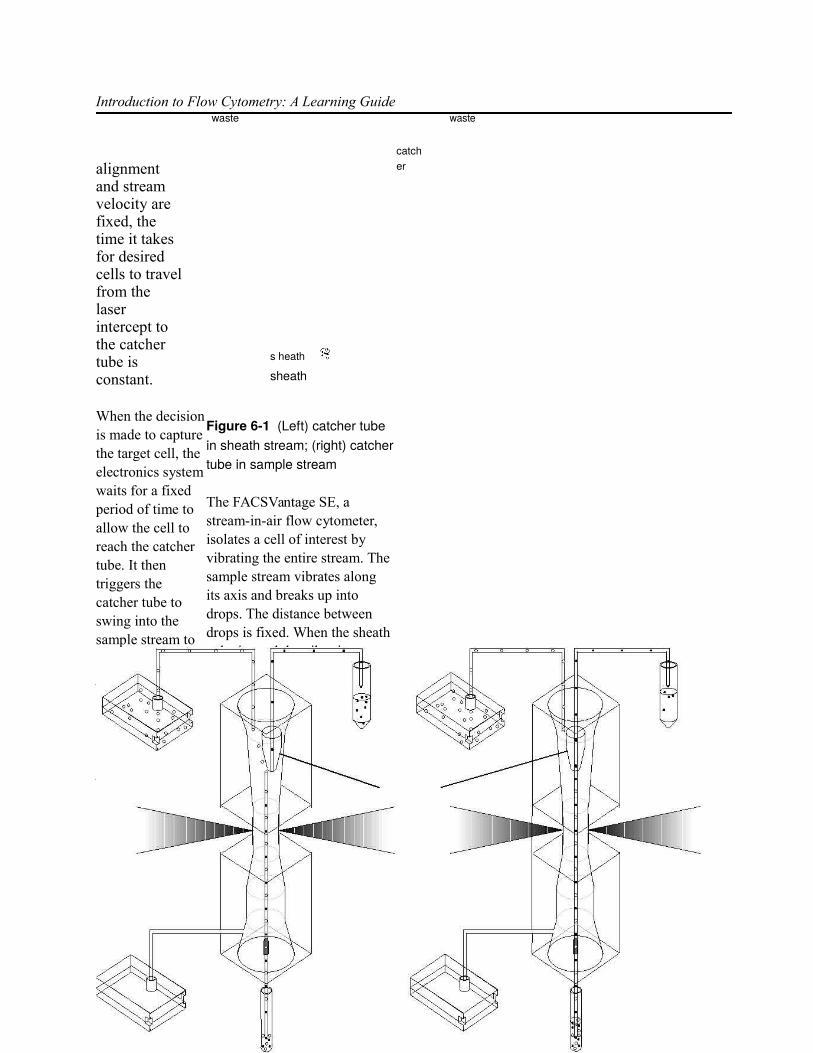
alignment and stream velocity are fixed, the time it takes for desired cells to travelfrom the laser intercept to the catcher tube is constant.
When the decisionis made to capturethe target cell, the electronics systemwaits for a fixed period of time to allow the cell to reach the catcher tube. It then triggers the catcher tube to swing into the sample stream to capture the cell. Figure 6-1(left) shows the catcher tube in its resting position in the sheath stream. Figure 6-1(right) shows the catcher tube positioned in the sample core stream ready to capture a target cell.
waste waste
catcher
s heath
sheath
Figure 6-1 (Left) catcher tube in sheath stream; (right) catcher tube in sample stream
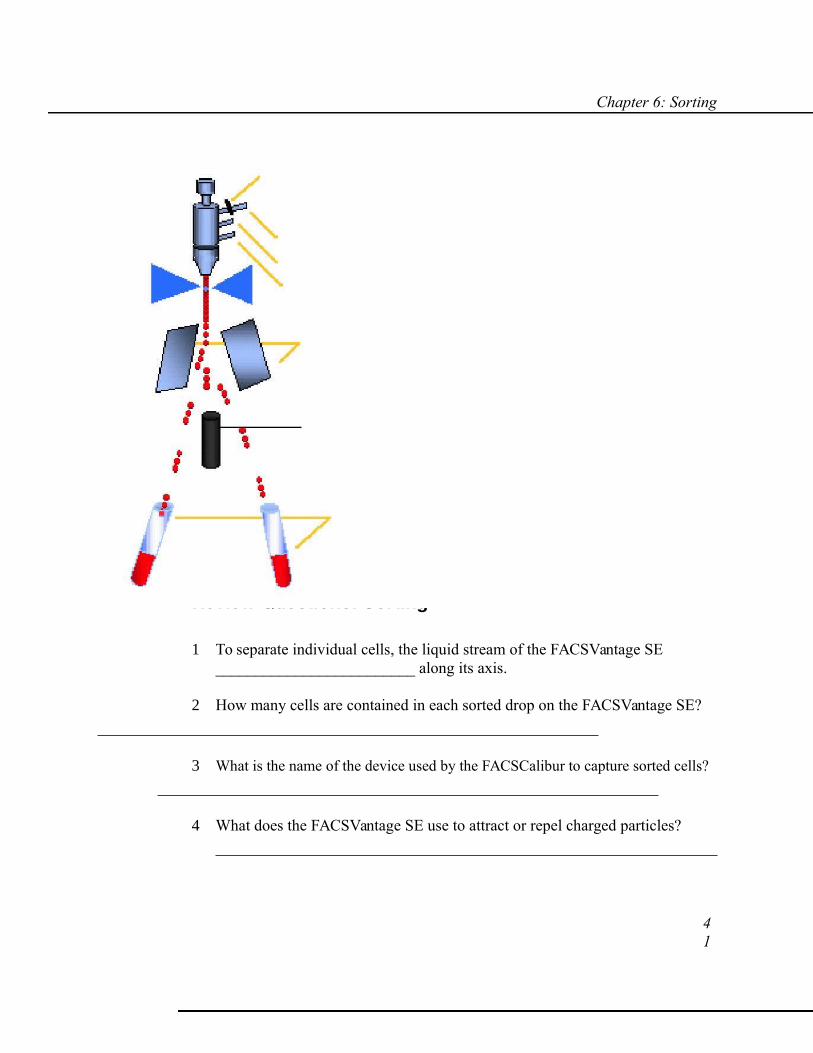
The FACSVantage SE, a stream-in-air flow cytometer, isolates a cell of interest by vibrating the entire stream. Thesample stream vibrates along its axis and breaks up into drops. The distance between drops is fixed. When the sheathvelocity and the vibration speed of the nozzle tip are constant, the pattern of drop formation is fixed. With the fixed drop formation, the FACSVantage SE is able to calculate the distance between the drops precisely, which allows for the isolation of individual cells.
The FACSVantage SE applies a voltage charge to drops containing a cell that meets the predefined sorting criteria. Positively and negatively charged plates are present on either side of the vibrating stream. As the

charged drops pass by the charged plates, the droplets are
deflected to the collection tubes, depending on the droplet’s charge polarity (Figure 6-2 on page 41).
40
Chapter 6: Sorting
charging electrode
sample injection
tube sheath tube
vent tube
deflection plates
waste collection
collection tubes
Figure 6-2 Sorting components on the FACSVantage SE
Review Questions: Sorting
1 To separate individual cells, the liquid stream of the FACSVantage SE _________________________ along its axis.
2 How many cells are contained in each sorted drop on the FACSVantage SE?
3 What is the name of the device used by the FACSCalibur to capture sorted cells?
4 What does the FACSVantage SE use to attract or repel charged particles?
41

Introduction to Flow Cytometry: A Learning Guide
42
7
Lasers and Alignment
7.1 How Lasers Work
LASER is an acronym for light amplification by stimulated emission of radiation.
Light is generated in the following manner. Gas lasers consist of cylinders, or plasma tubes, filled with an inert gas such as argon. The inert gas is ionized by a high-voltage electrical pulse, so that the electrons in the ionized gas atoms absorbenergy and move to a higher energy state. As the excited electrons return to the ground state, all at once or in several rapid steps, they give off photons with wavelengths specific to each transition level.
Optics at each end of the plasma tube reflect photons back and forth through the tube. These photons interact with other exited electrons, resulting in the release ofmore photons that are identical in wavelength, phase, and direction. As each photon is capable of stimulating more photons, light amplification or lasing occurs. Brewster windows seal each end of the plasma tube and transmit the light in one plane of polarization.
An electromagnet placed around the plasma tube creates a magnetic field that compresses the electrons towards the center of the tube. This prevents the electrons from hitting the sides of the tube, increasing the current density and causing greater stimulated emission of light.
4

3
Introduction to Flow Cytometry: A Learning Guide
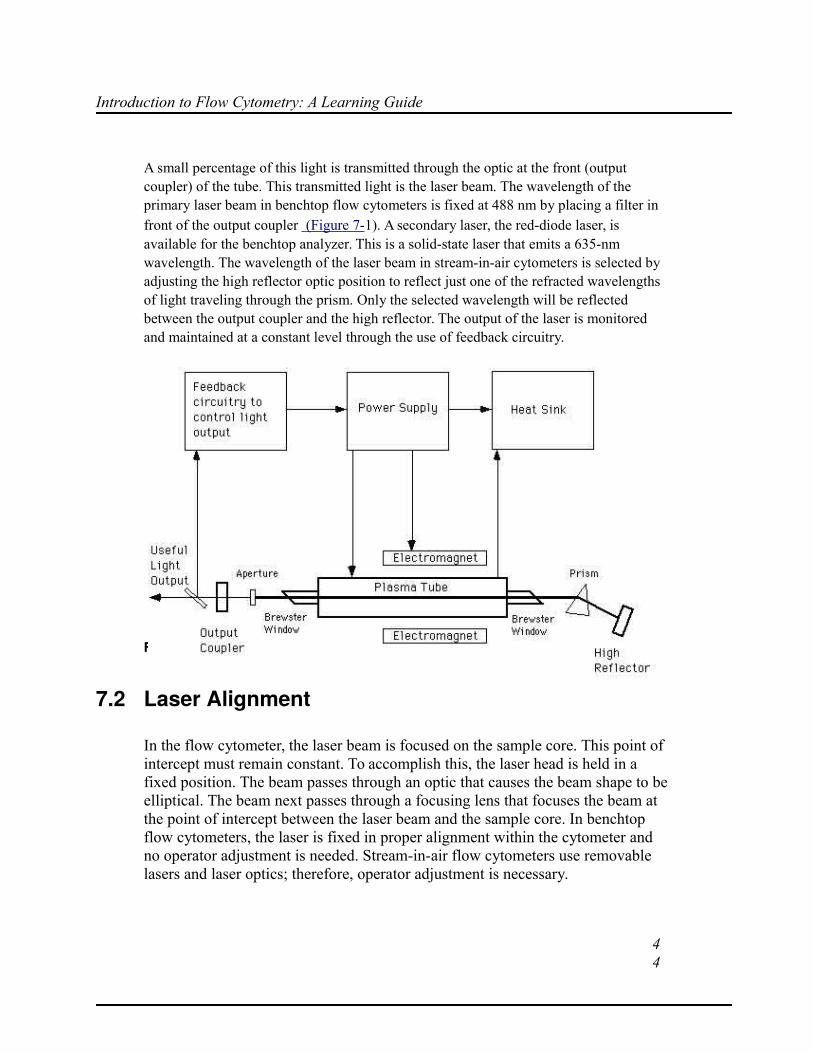
A small percentage of this light is transmitted through the optic at the front (output coupler) of the tube. This transmitted light is the laser beam. The wavelength of the primary laser beam in benchtop flow cytometers is fixed at 488 nm by placing a filter in front of the output coupler (Figure 7-1). A secondary laser, the red-diode laser, is available for the benchtop analyzer. This is a solid-state laser that emits a 635-nm wavelength. The wavelength of the laser beam in stream-in-air cytometers is selected by adjusting the high reflector optic position to reflect just one of the refracted wavelengths of light traveling through the prism. Only the selected wavelength will be reflected between the output coupler and the high reflector. The output of the laser is monitored and maintained at a constant level through the use of feedback circuitry.
Figure 7-1 Generation of laser light in a gas laser
7.2 Laser Alignment
In the flow cytometer, the laser beam is focused on the sample core. This point of intercept must remain constant. To accomplish this, the laser head is held in a fixed position. The beam passes through an optic that causes the beam shape to beelliptical. The beam next passes through a focusing lens that focuses the beam at the point of intercept between the laser beam and the sample core. In benchtop flow cytometers, the laser is fixed in proper alignment within the cytometer and no operator adjustment is needed. Stream-in-air flow cytometers use removable lasers and laser optics; therefore, operator adjustment is necessary.
44

Chapter 7: Lasers and Alignment
Review Questions: Lasers and Alignment
1 A(n) _______________ laser emits light that has a wavelength of 488 nm.
2 The laser beam shape is elliptical after it travels through the focusing optics.
T F
3 What is the wavelength of the red-diode laser in the bench top analyzer?
4 The wavelength of the laser used in the stream-in-air flow cytometer can be selected by adjusting the ______________ optic position at the rear of the laser.
45

Introduction to Flow Cytometry: A Learning Guide
46

Answer Key
Review Questions: Overview on page 7
1 Relative size, relative granularity or internal complexity, and relativefluorescence intensity
2 A laser
3 The fluidics, the optics, and the electronics
4 A single cell suspension
5 Sample core
6 Scattered light and fluorescence
7 Lenses
8 The amount of light striking them
9 True
10 True
47

Introduction to Flow Cytometry: A Learning Guide
Review Questions: Fluidics on page 12
1 To position thesample core inthe center ofthe laser beam
2 The width andthe positioningof the stream
3 One
4 Sheath fluid;flow chamber
5 Hydrodynamicfocusing
6 The samplepressureregulator
7 LO, MED, andHI
8 Increases,
width
9 A lower flow rate
10 True
11 True
Review Questions:Light Scatter on page 15
1 When a particledeflects incident laserlight
2 The cell membrane,nucleus, and internalgranular components
3 Forward-scattered light(FSC)
4 Cell surface area orsize
5 Side-scattered light(SSC)
6 Granularity or internalcomplexity
7 FSC and SSC 48

Answer Key
Review Questions: Fluorescence on page 18
1 Photons of light
2 Absorption spectra
3 Emission spectrum
4 The argon-ion laser
5 488 nm
6 FITC and PE
7 Antigenic surface markers
Review Questions: Optical Bench on page 21
1 The excitation and collection optics
2 The laser beam and the sample stream
3 True
4 Flow cell, sample stream
Review Questions: Optical Filters on page 23
1 Limit the range of wavelengths reaching the detector
2 515 and 545
3 Beam splitter
4 Shortpass, longpass
49
Introduction to Flow Cytometry: A Learning Guide
Review Questions: Signal Detection on page 25
1 Photodiode
2 Photomultiplier tubes
3 True
4 Convertsvoltagepulses tochannelnumbers
Review Questions: Threshold
on page 26
1 Dust, debris, or electronicnoise
2 False
Review Questions: Data Collection and Display on page 28
1 The parameter’s signalvalue in channel numbers
2 Two
3 The number of events perchannel
Review Questions: Gating on page 29
1 True
50

Answer Key
Review Questions: Data Analysis on page 36
1 A dot plot allows you to view a two-parameter display of data. Each event hasa position in the plot according to its channel values for both parameters. Histograms can only display data of one parameter in relationship to the number of events.
2 21.41%
78.59
3 False
4 79.57%
5 False
6 As you read in one data file to the next in the plot, if the regions are created tightly around the population, the subsequent populations could fall outside ofthe regions because of sample variability.
7 Cluster analysis
8 Geometric mean or median
Review Questions: Sorting on page 41
1 Vibrates
2 One
3 Catcher tube
4 Deflection plates
Review Questions: Gating on page 29
1 True
51

Introduction to Flow Cytometry: A Learning Guide
Review Questions: Lasers and Alignment onpage 45
1 Argon
2 True
3 635 nm
4 High reflector
52