Preclinical Flow Cytometry
2
Capabilites Capabilites KCAS’ flow cytometry team supports all aspects of large and small molecule bioanalysis for preclinical and clinical studies. Our experienced sciensts provide custom assay development, validaon, sample processing and consulng services for a wide variety of applicaons. We pride ourselves on being innovave problem solvers, and it’s our top priority to help clients overcome any obstacles encountered while developing funconal pharmacodynamic (PD) assays, live cell assays, isolaon of PBMC studies, mechanism of acon studies, and biomarker assays. Our flow cytometry experts can help with your study design, implement and perform the assay, and deliver quality data. Below is a case study of a recent pharmacodynamic (PD) assay performed by KCAS. KCAS performed a pharmacodynamic (PD) assay using flow cytometry for a preclinical non-GLP study in rats for an anbody therapeuc. Timelines were important to the client and KCAS needed to design, research, develop, and screen sample in less than four weeks. Client Need T Cell, B Cell, NK cell absolute counts and % recovery for the monitoring of an anbody drug candidate. KCAS Recommendaon KCAS and client selected the side scaer by CD45 lymphocyte gang in order to ulize the BD Trucount tube for absolute counts. As a part of development, KCAS researched the ulity of preserving cells for future studies to allow for batch sample analysis. (See Table 1) Biomarker Assay Services Objecve Design Evaluate in parallel rat whole blood forward scaer by side scaer for lymphocyte gang. (The most cost effecve method.) Side scaer by CD45 lymphocyte gang. The addion of the CD45 marker increases cost, but offeres the advantage of improved assay performance. 1) 2) Results Indicates %CV > 20% compared to baseline (Unpres-Day 0) Pres = Preserved samples Unpres = Unpreserved samples KCAS Bioanalycal & Biomarker Services | kcasbio.com | contact us: [email protected] Sample ID Dose % Gated of Lymph % Gated of Lymph Absolute Count (Cells/uL) Absolute Count (Cells/uL) Pres-Day 0 Pres-Day 1 Pres-Day 5 Unpres-Day 0 Unpres-Day 5 Pres-Day 0 Pres-Day 1 Pres-Day 5 Unpres-Day 0 Unpres-Day 5 28.5 29.8 29.3 32.9 18.6 39.4 43.1 40.5 39.8 28.7 3554.46 3422.18 3333.18 3718.52 2067.15 4224.52 4790.88 4230.46 4194.95 3008.38 25.7 22.0 24.5 24.2 25.5 35.1 32.3 34.0 33.1 30.9 3212.40 2526.28 2789.96 2736.42 2828.04 3764.18 3588.50 3543.50 3483.96 3246.50 BW0004 BW0005 T Cells B Cells Table 1: Summary of Rat Whole Blood T Cells and B Cells % and Gated of Lymphocytes (Lymph) and Absolute Count Preclinical Flow Cytometry Services Bioanalycal & Biomarker Services
-
Upload
kcas-bioanalytical-biomarker-services -
Category
Health & Medicine
-
view
32 -
download
0
Transcript of Preclinical Flow Cytometry
Capa
bilit
es
Capa
bilit
es
KCAS’ flow cytometry team supports all aspects of large and small molecule bioanalysis for preclinical and clinical studies. Our experienced scientists provide custom assay development, validation, sample processing and consulting services for a wide variety of applications. We pride ourselves on being innovative problem solvers, and it’s our top priority to help clients overcome any obstacles encountered while developing functional pharmacodynamic (PD)assays, live cell assays, isolation of PBMC studies, mechanism of action studies, and biomarker assays.
Our flow cytometry experts can help with your study design, implement and perform the assay, and deliver quality data. Below is a case study of a recent pharmacodynamic (PD) assay performed by KCAS.
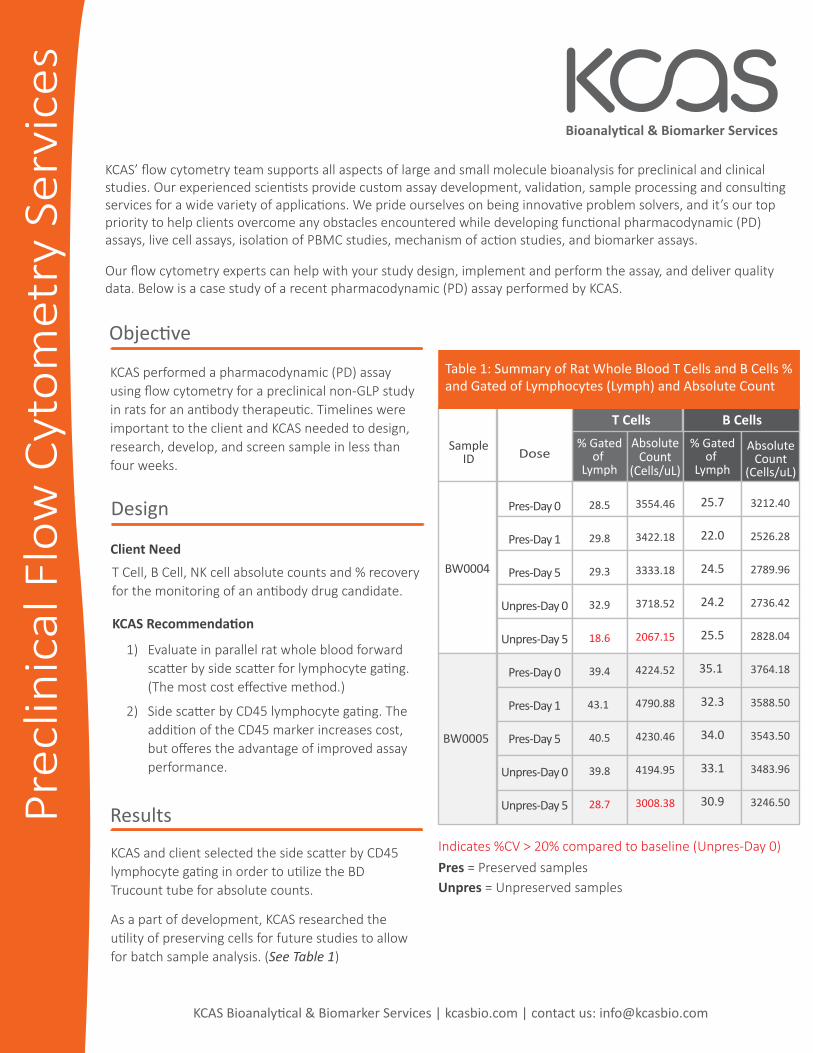
KCAS performed a pharmacodynamic (PD) assayusing flow cytometry for a preclinical non-GLP studyin rats for an antibody therapeutic. Timelines wereimportant to the client and KCAS needed to design,research, develop, and screen sample in less than four weeks.
Client NeedT Cell, B Cell, NK cell absolute counts and % recoveryfor the monitoring of an antibody drug candidate.
KCAS Recommendation
KCAS and client selected the side scatter by CD45lymphocyte gating in order to utilize the BD Trucount tube for absolute counts.
As a part of development, KCAS researched the utility of preserving cells for future studies to allow for batch sample analysis. (See Table 1)
Biom
arke
r Ass
ay S
ervi
ces
Objective
Design
Evaluate in parallel rat whole blood forward scatter by side scatter for lymphocyte gating. (The most cost effective method.)
Side scatter by CD45 lymphocyte gating. The addition of the CD45 marker increases cost, but offeres the advantage of improved assayperformance.
1)
2)
ResultsIndicates %CV > 20% compared to baseline (Unpres-Day 0)Pres = Preserved samplesUnpres = Unpreserved samples
KCAS Bioanalytical & Biomarker Services | kcasbio.com | contact us: [email protected]
SampleID Dose
% Gatedof
Lymph
% Gatedof
Lymph
AbsoluteCount
(Cells/uL)
AbsoluteCount
(Cells/uL)
Pres-Day 0
Pres-Day 1
Pres-Day 5
Unpres-Day 0
Unpres-Day 5
Pres-Day 0
Pres-Day 1
Pres-Day 5
Unpres-Day 0
Unpres-Day 5
28.5
29.8
29.3
32.9
18.6
39.4
43.1
40.5
39.8
28.7
3554.46
3422.18
3333.18
3718.52
2067.15
4224.52
4790.88
4230.46
4194.95
3008.38
25.7
22.0
24.5
24.2
25.5
35.1
32.3
34.0
33.1
30.9
3212.40
2526.28
2789.96
2736.42
2828.04
3764.18
3588.50
3543.50
3483.96
3246.50
BW0004
BW0005
T Cells B Cells
Table 1: Summary of Rat Whole Blood T Cells and B Cells % and Gated of Lymphocytes (Lymph) and Absolute Count
Prec
linic
al F
low
Cyt
omet
ry S
ervi
ces
Bioanalytical & Biomarker Services
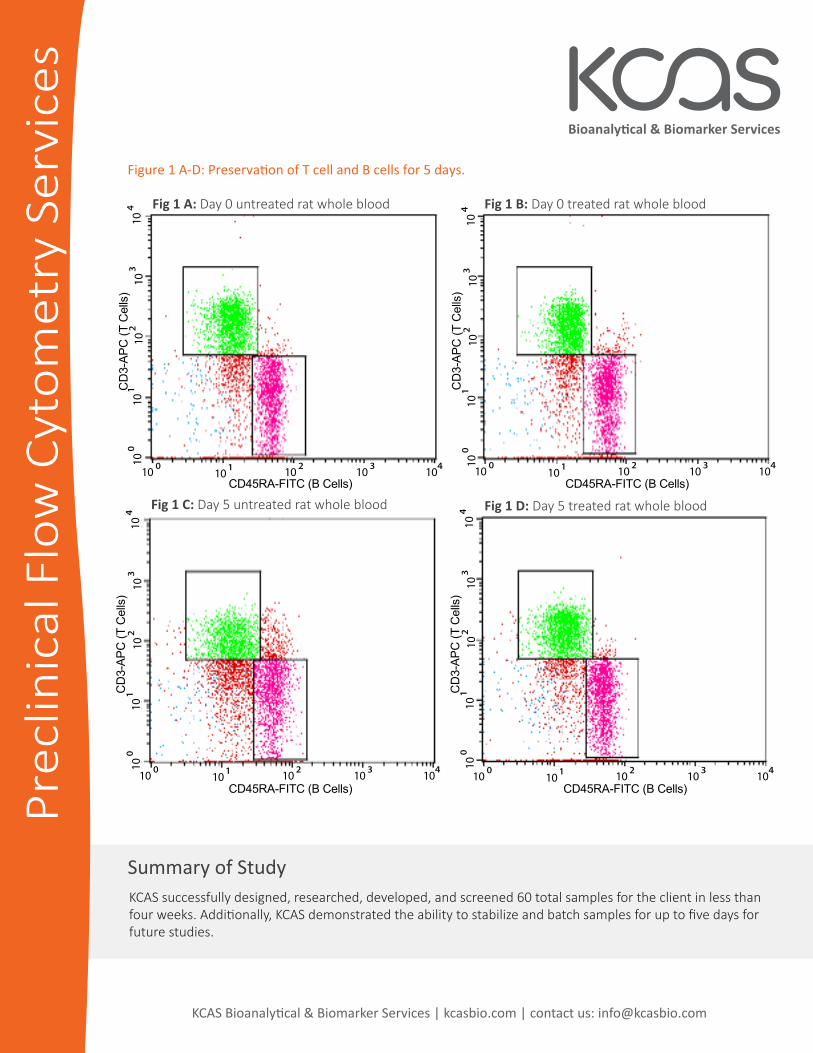
KCAS successfully designed, researched, developed, and screened 60 total samples for the client in less than
future studies.
Summary of Study
10 10 10 1010 10
10
10
10
10
CD45RA-FITC (B Cells)
CD45RA-FITC (B Cells)CD45RA-FITC (B Cells)
CD45RA-FITC (B Cells)
CD
3-AP
C (T
Cel
ls)
CD
3-AP
C (T
Cel
ls)
CD
3-AP
C (T
Cel
ls)
CD
3-AP
C (T
Cel
ls)
10 10 10 1010
10
10
10
10
10
10 10 10 1010
10
10
10
10
10
10 10 10 1010
10
10
10
10
10 Fig 1 A: Day 0 untreated rat whole blood Fig 1 B: Day 0 treated rat whole blood
Fig 1 D: Day 5 treated rat whole bloodFig 1 C: Day 5 untreated rat whole blood
Prec
linic
al F
low
Cyt
omet
ry S
ervi
ces
Bioanalytical & Biomarker Services
KCAS Bioanalytical & Biomarker Services | kcasbio.com | contact us: [email protected]