Tsunami Warning System Elements IOC Assessment Mission to Indonesia 29 August-1 September 2005.

UNESCO-IOC International Tsunami Survey Team (ITST) Post-Tsunami Survey Field Guide 2nd Edition, 2012 Dale Dominey-Howes and Lori Dengler

Suggested citation Dominey-Howes, D., Dengler, L., Dunbar, P., Kong, L., Fritz, H., Imamura, F., McAdoo, B., Satake, K., Yalciner, A., Yamamoto, M., Yulianto, E., Koshimura, S., and Borrero, J. (2012). International Tsunami Survey Team (ITST) Post-Tsunami Survey Field Guide. 2nd Edition. UNESCO-IOC, Paris. Pp XXX.

Executive Summary The 1998 Post-Tsunami Field Guide (Manual & Guides No. 37) was published by the UNESCO Intergovernmental Oceanographic Commission (IOC) to provide guidance for International Tsunami Survey Teams (ITSTs) conducting post event reconnaissance studies. This revision of the First Guide addresses developments in the tsunami field since 1998, and the expansion of ITST efforts into disciplines not covered in the first Guide. It also attempts to align ITST efforts within the United Nations and UNESCO natural hazards and risk reduction framework. The Guide provides a flexible framework for undertaking post-tsunami surveys, their guiding principles, and protocols, and a set of best practices and templates for individuals and groups considering forming, or participating, in post-tsunami surveys. The Field Guide is divided into three sections: Part I – Introduction to the Field Guide. This part outlines the rationale, purpose, and value of conducting field surveys. It describes the structure of the Guide, notes the modifications from the First Edition and importantly, recognizes the need for different ‘types’ of survey team structures to reflect varying research needs. Part II – Conducting post-tsunami field surveys. This part deals with the mechanics of conducting post-tsunami field surveys and is divided into three subsections that outline the issues to be addressed before, during and after the survey is conducted. Part III – Data types, equipment, methods and best practice. This part outlines the types of data that can be collected, the types of equipment needed to gather that data, the methods available to researchers and where appropriate, recognizes best practices. Data types and disciplines covered include:
• Tsunami characteristics including inundation, runup, and flow speed/depth/direction • Tsunami impacts on the built environment • Geology and tectonics including subsidence/uplift, scour, and deposits • Ecosystem and biological impacts on both terrestrial and marine environments • Eyewitness accounts and surveys, and • Social, human and economic impacts.
Annexes are listed at the end of the Guide that provide more detail in discipline-specific areas, including examples and templates for researchers to use as appropriate.

AUTHORS
Co-ordinating Lead Authors Dominey-Howes, Dale, Australia – Pacific Tsunami Research Centre, University of New South Wales, Australia Dengler, Lori, Geology Department, Humboldt State University, USA Core Working Group Lead Authors
Borrero, Jose, University of Southern California Tsunami Research Center. Dengler, Lori, Geology Department, Humboldt State University, USA Dominey-Howes, Dale, Australia – Pacific Tsunami Research Centre, University of New South Wales, Australia Dunbar, Paula, NOAA, USA Fritz, Hermann, Georgia Tech, USA Imamura, Fumihiko, Tsunami Engineering Laboratory Disaster Control Research Centre, Tohoku University, Japan Kong, Laura, UNESCO-IOC-NOAA ITIC, USA Koshimura, Shunichi, Civil Engineering, Tohoku University, Japan McAdoo, Brian, Earth Sciences and Geography, Vassar College, USA Satake, Kenji, Earthquake Research Institute, University of Tokyo, Japan Yalciner, Ahmet, Department of Civil Engineering, Middle East Technical University, Turkey Yamamoto, Masahiro, UNESCO-IOC, France Yulianto, Eko, Indonesian Institute of Science, Indonesia Contributing Authors
Goff, James, Australia - Pacific Tsunami Research Centre, University of New South Wales, Australia Dudley, Walter, University of Hawaii at Hilo, USA Petroff, Catherine, University of Washington, USA Jaffe, Bruce, USGS, USA We thank a number of people who provided comments and feedback on earlier drafts of this Guide. We specifically thank Stuart Fraser, Rick Wilson, Eric Geist, Patricio Winckler Grez, Efim Pelinovsky, Salvador Farrera, Paul Whitmore and Catherine Petroff Acknowledgements We thank…….. UNESCO-IOC for giving us the chance to produced this Guide. XXX for contributing material. XXX for reviewing earlier drafts. Other????????

TABLE OF CONTENTS
Executive summary Authors Acknowledgements Table of Contents Preface PART I – Introduction to this Field Guide PART II – Conducting post-tsunami field surveys PART III - Data types, data collection, methods and best practice References ANNEXES

Preface This Field Guide is intended to facilitate the acquisition of critical data in the immediate aftermath of tsunamis. It will be of use to a variety of people and organizations, who may either participate in, assist in coordinating of or host, post-tsunami field surveys. For researchers planning, or interested in taking part in a survey, this Guide will provide an outline of accepted field practices in a variety of disciplines, the expectations and responsibilities of team members, and the issues that need to be considered when working in a disaster affected country. For groups involved with coordinating ITSTs, this Guide will give an overview of the types of research investigations likely to be a part of post-event reconnaissance and a framework for communicating with and facilitating field teams. For host countries, this Guide provides an overview of the ITST process and how information from survey teams can be of use to government organizations in responding to a tsunami. It is hoped that this Guide will promote pre-event planning in countries at risk of tsunamis to reduce the stresses of developing organizational logistics in the post-emergency response phase and make the process of conducting an ITST easier and more productive for both participating researchers and host country organizations. This Guide is the result of the volunteer efforts of the Core Working Group. It represents our assessment of best practices at the time of this publication. We understand that the work of tsunami researchers is evolving quickly, and as such, this Guide may not fully capture all knowledge and techniques. It will need revising again in the future. Feedback and additions are sought from tsunami researchers everywhere. To give feedback, please email comments and suggestions to XXXX at XXX.
Dale Dominey-Howes � 4/5/12 10:58 AMComment: UNESCO to decide how to handle this suggestion

PART I 1. Introduction to this Field Guide 1.1 Introduction, rationale, purpose and value of post-tsunami surveys Post-tsunami field surveys are essential to understanding tsunamis and developing the tools and programs necessary to mitigate their effects. Researchers participate in field surveys to better understand tsunamis and to apply this new knowledge to long-term tsunami disaster risk reduction efforts (Synolakis and Okal, 2005; Kong, 2011). The ultimate goal of these efforts is to save lives, reduce losses, preserve and enhance resilience, and reduce vulnerability both in the affected country and other vulnerable regions. Post-tsunami surveys, particularly following high-profile, destructive events, attract experts from a number of disciplines including but not limited to physical, social, environmental sciences, economics, and engineering. Researchers collect perishable data such as evidence of the tsunami characteristics and impacts and document the factors that contribute to vulnerability and resilience (Goff and Dominey-Howes, 2011; van Zijll de Jong et al., 2011). These data can also be of use to government decision-makers to better organize and deploy the often-limited resources to heavily affected areas in the aftermath of an event. The survey results can assist in the long-term for recovery planning that will help to mitigate losses from future tsunamis. The availability of survey data to the tsunami research community can help address a wide number of socio-economic and scientific research questions. Following a tsunami disaster, local jurisdictions are likely to be overwhelmed responding to the immediate needs of the injured and displaced; not to mention the demands of government agencies, non-governmental organizations and the media. The influx of researchers puts additional stress on these jurisdictions and may interfere and conflict with emergency response activities. It is therefore important to coordinate with government emergency response operations in order to ensure the timely collection of perishable data that may otherwise be logistically difficult to obtain before natural environmental processes or clean-up efforts modify the landscape. By following the principles outlined in this Field Guide, researchers can effectively participate in post-tsunami survey teams and collect valuable data in an integrated approach that captures the full extent of the event. At the same time, by coordinating their efforts with host country governments, teams can gain logistical assistance, a better understanding of the cultural issues in the affected country, and provide information that can be used to better manage recovery and the reduction of future impacts. 1.2 Structure of this Field Guide This Field Guide is divided into three sections: Part I – Introduction to the Field Guide. This part outlines the rationale and describes the purpose and value of conducting field surveys. It describes the structure of this Guide, notes the modifications from the First Edition and importantly, recognizes the need for different ‘types’ of survey team structures, and how field reconnaissance efforts align with United Nations and UNESCO natural hazards and disaster risk reduction efforts. Part II – Conducting post-tsunami field surveys. This part deals with the mechanics of conducting post-tsunami field surveys and is divided into three subsections that outline the issues to be addressed before, during and after the survey is conducted. Part III – Data types, data collection equipment, methods and best practice. This part outlines the types of data that can be collected, the equipment needed to gather that data, the methods available to researchers and where appropriate, recognizes best practice. Various Annexes are listed at the end of the Guide that provide more detail, examples and templates for researchers to use as appropriate.

Make as many copies of the Annexes as necessary for conducting surveys at different sites. Be aware of the need to translate the Annexes in to relevant local languages. 1.3 Modification of this Field Guide from the First Edition The purpose of this Field Guide is to: (1) update the first Intergovernmental Oceanographic Commission (IOC) Post-tsunami Survey Guide (1998) in order to incorporate advances in the understanding of tsunamis, (2) improve data quality and acquisition, (3) facilitate coordination both within the research community and with host countries, and (4) contribute data to assist in the process of effective tsunami disaster risk reduction. While post-tsunami field surveys have been undertaken for many years, the formal designation of an International Tsunami Survey Team (ITST) was first used after the September 2, 1992 Nicaragua tsunami (Synolakis and Okal, 2005). As of the publication date of this Guide, ITSTs have responded to 31 events (see Annex I). Past ITSTs have ranged from an individual team studying a small region, to multiple teams that have covered both near and farfield tsunami impacts. Annex I provides details about previous ITSTs. Early ITSTs were driven by the hydrodynamic modeling community who needed water height and inundation measurements to benchmark the accuracy of model outputs. A team was necessary in order to quickly record the tsunami characteristics over potentially large areas. While generally focused on collecting water height data, most early ITSTs recognized the importance of interdisciplinary approaches to tsunami research and made an effort to share the information they collected with the people and officials in the affected country. In 1998, an ad hoc working group headed by Salvador Ferreras compiled the first IOC Post-tsunami Survey Field Guide (UNESCO-IOC, 1998) as a response to the need for uniformity in collecting data. A number of factors have led to this revised 2nd Edition of the Field Guide. In the 1990s, the number of tsunami researchers was relatively small and most events involved at most one or two teams and a handful of researchers. Two events changed this. In 1998 a moderate earthquake produced a major tsunami in Papua New Guinea. A number of researchers interpreted the tsunami as triggered by a submarine sediment slide. This generated interest in tsunami hazards in many parts of the world not previously considered at high risk of earthquake-generated tsunamis. The major change in perception of tsunami hazards and in the scale of post-tsunami surveys followed the December 2004 Indian Ocean disaster. The size of the event, both in terms of geographic spread and impact, was unprecedented in modern times. Dozens of teams and hundreds of researchers worked in the 11 affected countries over the following year. Not only was the amount of data collected much larger than in previous ITST efforts, it included numerous types of data measured in various ways by different groups. With the increase in data volume came concerns about how to archive and process the data, and quality issues including collection methodology, terminology, base levels, and ambient tidal conditions. The 2004 Indian Ocean tsunami made it clear that the ad hoc, informal way of conducting post-tsunami surveys was no longer adequate. The 2011 Japan tsunami disaster has further increased the volume and quality issues with vast amounts of data being collected, some of which were unknown in 1998. Tsunami research has changed since 1998. Advances in hydrodynamic modeling, the availability of space-based technologies including satellite imagery and global positioning satellite navigation, and methods of recording impacts such as the proliferation of amateur digital video and still imagery, required that new sections be added to the Field Guide. The 1998 Guide devotes one paragraph to describing tsunami sediment deposits. Since 1998, tsunami geology has become a major research discipline requiring careful techniques in collection and analysis of samples (Shiki et al., 2008; Chagué-Goff et al., 2011). In addition to advances in technique, many more disciplines have become involved in post-tsunami surveys including the social and economic sciences, ecology, and structural engineering. Post-tsunami surveys have moved beyond traditional approaches of measuring maximum inundation, run-up and flow depth to include a detailed, varied, rich and contextural understanding of the effects of tsunamis at different places including upon people and their communities, infrastructure, agricultural systems, ecology, geomorphological systems,

engineered structures and so on. Post-tsunami surveys now often take a much more ‘systems’ approach (Goff and Dominey-Howes, 2011). This Second Edition of the Guide seeks to address this rapidly developing integrative research framework. When the first Guide was published, the primary focus of tsunami hazard assessment and research was the Pacific. Tsunamis are now much more widely recognized as a global hazard that could impact any coastline. This edition of the Guide will provide government agencies in countries that may have had little awareness of tsunami impact with an overview of the phenomena researchers will be interested in studying and why they are important. By illustrating how ITSTs are conducted and the potential benefits a country may receive from their findings, it is hoped that more countries will be willing to work with the international tsunami community in facilitating post-tsunami surveys. This Field Guide is intended to provide a flexible framework for undertaking post-tsunami surveys, their guiding principles, and protocols, and a set of best practices and templates for individuals and groups considering forming, or participating, in post-tsunami surveys. It represents our best efforts at this moment in time and attempts to take account of what we know. It will need revision again in the future. 1.4 Recognizing the need for ‘flexible’ Post-tsunami Survey Teams This Guide recognizes that there is a need to collect important data that may perish or be lost soon after a tsunami has occurred. Indicators of peak tsunami heights and flow directions may be quickly erased by weather and cleanup efforts. Damaged structures may be quickly bull-dozed away. People’s memories of what occurred may be distorted by other factors. Each tsunami is unique in terms of physical and cultural context. Consequently, there may be a need for different types of post-event survey teams depending upon the particular event. While this Guide focuses on tsunamis, it does recognize that an event may also involve significant non-tsunami impacts such as earthquake or volcano damage, public health or safety issues such as those occurring at the Fukushima nuclear power station following the 2011 Japan earthquake-tsunami disaster, and that reconnaissance teams from other disciplines may also be involved in research efforts. Some teams may have multiple roles fulfilling both ITST objectives as well as looking at other multi-hazard impacts. It is not the intent of this Guide to prescribe operating procedures for these other teams. It does encourage cooperation and exchange of ideas wherever possible. The types of teams and constraints on operation will be dictated by the specifics of the event. 1.5 Working with national research professionals Countries affected by tsunamis have a broad range of domestic scientific and research capabilities and in-country resources. The most effective ITST is a shared enterprise involving international and local personnel that can exchange information and perspectives. This Guide emphasizes that ITSTs must involve the full collaboration of national and international researchers and that lessons learned during the survey are shared with host country agencies. 1.6 Tsunami terminology and alignment with United Nations and UNESCO natural hazards and disaster risk reduction definitions and efforts A number of technical terms are used by tsunami researchers to describe data, methods, and analyses. The terms used in this Guide are described in the UNESCO-IOC Tsunami Glossary (2008) (see http://ioc3.unesco.org/itic/contents.php?id=328) and in an UNESCO-IOC technical report (UNESCO-IOC 2011). It is critical that researchers working in the field of tsunami science consistently use established terms and meanings when reporting their results. This will help to ensure wider understanding of what’s being reported and transferability of results between studies. Many fundamental terms used by the tsunami research community (for example, hazard, risk, resilience, vulnerability, disaster etc) are used in slightly different ways by experts from different discipline fields. This is normal and not a problem. However, as this Field Guide is published by the UNESCO-IOC, wherever possible, the Field Guide seeks to use the accepted definitions of these terms given by the UN International Strategy for Disaster Reduction (UNISDR) (see the UNISDR glossary of terms at http://www.unisdr.org/).
Dale Dominey-Howes � 3/20/12 3:48 AMComment: This reference mentioned/provided by Laura Kong but Laura needs to provide full reference.

According to UNISDR policy, effective disaster risk reduction (DRR) efforts are increasingly being defined within the theoretical construct of the ‘coupled human-environment system’ also referred to as the ‘socio-ecological’ or ‘systems-approach’, which clearly recognizes the nexus and feedbacks between the biophysical world in which hazard events like tsunami occur, and the human (socio-economic) world in which ‘disasters’ unfold (Goff and Dominey-Howes, 2011; UNISDR, 2009). The closer alignment between tsunami research efforts and the UNISDR frameworks and definitions should facilitate a more effective integration of the ‘end-to-end’ components of the risk management process. The UNESCO-IOC strongly encourages all researchers working in the field of tsunami science to become acquainted with the meaning and use of these core terms.

PART II 2. Conducting post-tsunami field surveys This section of the Guide outlines the key elements of ITST post-tsunami surveys and the issues that will need to be considered by the ITST, before, during and after deployment in to affected areas. Post-tsunami survey teams may operate at a national and/or international level depending on the scale of the tsunami and the interests and capacity of national and international tsunami professionals and team volunteers. This Guide addresses only international teams but recommends that countries building a national capacity develop plans that are compatible with the international framework presented here for any proposed domestic teams. The intent of this Guide is to be flexible and not prescriptive. The size and composition of a particular team will indicate which elements of this Guide are most relevant and important. 2.1 BEFORE THE FIELD SURVEY ITSTs require careful pre-field work planning to be successful. This section summarizes the process of developing research priorities and co-ordination with the host country, team composition, logistical issues and the training of team members. 2.1.1 Co-ordination and Terms of Reference 2.1.1.1 Tsunami National Contact ITSTs need to work collaboratively with officials and professionals in the affected country. Effective operation of ITSTs can be greatly facilitated by the establishment of a Tsunami National Contact. This individual or group should have familiarity with the emergency response situation in the host country. Tsunami expertise is desirable but not essential. The Tsunami National Contact can participate in the development of appropriate Terms of Reference for the survey (see Section 2.1.1.3), ensure participation of local expertise on ITSTs, co-ordinate with national reconnaissance efforts, provide ITSTs with cultural awareness and knowledge, and make international researchers aware of relevant research and other data that will improve the ITSTs efforts. The Tsunami National Contact can also act as a liaison with the UNESCO-IOC and the international tsunami community before events occur. 2.1.1.2 Host Country Co-ordination Committee, Decision-making procedure After a tsunami has occurred, a host country Co-ordination Committee should be assembled in order to develop appropriate Terms of Reference and co-ordinate national and incoming ITSTs. Suggested membership of the Co-ordination Committee could include:
• Tsunami National Contact person from the affected (host) country • UNESCO-IOC staff member • Host government representative (may be ministry and/or scientific staff member) • Relevant scientist/technical expert(s) from host country university and/or research organization • Others as relevant
This Co-ordination Committee has the responsibility for the Terms of Reference and serves as liaison between incoming ITSTs and the host country government. Host country members who understand emergency response issues and the day-to-day technical challenges on the ground should be part of the decision-making process. The Co-ordination Committee may wish to identify an individual to act as the primary liaison between incoming ITSTs and host government officials. All relevant decisions that need to be made (e.g., timing of surveys, team size, Terms of Reference, logistics required etc) should be discussed and then communicated. The Co-ordination Committee should keep track of the type of data being collected by ITSTs and the geographic areas that they have worked in. It should encourage incoming ITSTs to work in areas that have not been covered by previous groups to avoid duplication of effort and ensure maximum knowledge gain. 2.1.1.3 Terms of Reference ITSTs should define the goals of their field reconnaissance efforts within a framework of the concerns of the host country and the needs of the research community. This framework is embodied in Terms of Reference that

are developed by representatives of the affected community, UNESCO-IOC, and the tsunami research community. The Terms of Reference for a specific event need to strike a balance between addressing specific questions of the affected country, and the research questions and expertise of the ITST volunteers. Effective collaboration between ITSTs and the host country requires that both groups benefit. A perception that visiting experts are only interested in collecting data to advance their personal careers will make governments less interested in facilitating ITSTs or welcoming research efforts. When working well, this collaboration can meet the needs of affected communities and ease the efforts of participating ITST members by providing critical logistical assistance to them. It may be appropriate for a small, highly mobile, team of experienced tsunami researchers to be deployed rapidly into affected regions to gather limited, significant, perishable data (e.g., water marks, flow direction indicators, geological deposits etc) soon after the event. Such teams would likely have a limited Terms of Reference. The results of their survey work should be shared and used to guide, larger, multi-sectoral, interdisciplinary teams with broader, more complex Terms of Reference and research tasks. The specific Terms of Reference depend on the scale and characteristics of the event. Terms of Reference for recent events have included the following: (1) Measure maximum inundation and maximum flood run-up and flow depth above ground surface at as many sites as possible – such measurements are useful for many reasons including improving forecast inundation models and understanding impacts of tsunami inundation on building damage. Complete inundation lines should be collected for the most important locations; (2) Collect geological samples of sediments left by the tsunami – such samples help with the characterization of tsunami deposits providing highly valuable analogues to compare with suspected palaeotsunami deposits; (3) Measure the type and severity of damage to different types of buildings and other coastal structures and record what factors affected damage levels – such data are valuable for helping revise building codes and design standards and for informing land use zoning and planning decision making; (4) Collect and measure information about the environmental and biophysical system impacts of the tsunami in different places – such work is helpful for exploring many aspects of conservation, ecosystem function analysis and environmental change and management; (5) Collect information about survivor experiences through interviews – such eye-witness accounts can provide observations of tsunami characteristics, evacuation and preparedness issues and the full impacts of the event on people; (6) Explore the human and community vulnerability and resilience factors at work in different places - what made a particular community resilient or vulnerable, what are the differential experiences of different types of people who experienced the tsunami? – such data are critical for understanding how to develop appropriate education and hazard awareness programs, for revising early warning approaches and alike; (7) Make recommendations - use the results from tasks 1 to 6 to draw up recommendations to assist local and national government authorities to increase community resilience, improve disaster preparedness and planning and increase community awareness and education and help identify gaps for future field research. Additional research objectives may be included in specific ITSTs Terms of Reference depending on the characteristics of a particular tsunami. 2.1.2 ITST Leadership (Co-ordination) and composition There is no prescribed composition to an ITST, because such teams are self-organized, self-funded and composed of ‘volunteers’ coming from other countries. However, to facilitate functioning of the ITST in country, to be cognizant of cultural norms and practices, to take account of in country expertise and knowledge

and to facilitate horizontal skills and knowledge transfer, it is critical that whenever possible, ITSTs include a mix of host country experts and international participants. ITSTs are typically composed of a mix of disciplinary expertise sourced from academic institutions and governmental organizations. In some cases it is appropriate to encourage the participation of practitioners such as warning centre staff, emergency management and response officials and planners. Some ITSTs have included journalists and film-makers and have successfully used the ITST survey as a vehicle for outreach and public education activities. In such cases, it will be important that media ground rules be carefully developed and agreed to in advance. Regardless of the composition of the ITST, it is always preferable that some of the team members have previous ITST post-tsunami reconnaissance experience. ITSTs should also include graduate students or young professionals where possible so that expertise is gained and transferred to the next generation of researchers. For some events, it may be necessary to restrict the size of an ITST depending on the nature of the impacts of the tsunami at specific places and the capacity of the host region to accommodate incoming teams. Size and exact composition should be negotiated between the incoming ITSTs via their Leader and the host country Co-ordination Committee. Significant tsunamis generate interest from a wide range of disciplines, level of professional expertise, and previous field experience. There may also be interest from persons who are primarily interested in seeing the scope of the damage but do not have the background to readily contribute to the ITST effort. In putting together an ITST, it is important to consider how members will work together and contribute to the data-collection goals of the group. Establishing symposia/field trips at some suitable interval after the event can accommodate the interests of people who are primarily interested in touring damage sites (see section 2.3). This Guide encourages those thinking of participating on an ITST to seriously consider their motivation and expectation for participation. Post-event surveys are undertaken in disaster-affected regions under difficult conditions. They typically involve intense physical exertion and psychological stress. ITSTs are not easy, they may be uncomfortable, and they can be distressing. 2.1.2.1 Leadership Leadership role(s) must be defined. A person needs to be responsible for working with the host country Co-ordination Committee to define the ITSTs research contributions under the Terms of Reference and communicating team travel plans to the host country. A person needs to take the leadership role within the ITST (i.e., to be the ITST Leader) to co-ordinate logistics and make sure that all team members understand their roles and responsibilities. For a small group, a single person may take on all of these roles. For larger ITSTs, it is recommended that responsibilities be designated to several individuals. 2.1.2.2 Discipline breadth of ITST survey efforts The goal of ITST efforts is to capture the broadest possible picture of the tsunami. ITSTs can do this either by incorporating different disciplines within the same ITST, or by having multiple ITSTs that focus on particular (and different) aspects of the tsunami. A large ITST may wish to consider dividing in to sub-groups. The types of data recent ITSTs have investigated include:
• Inundation, runup, and flow depth/direction • Building and infrastructure damage • Geology and tectonics (subsidence/uplift, scour, sediments) • Ecosystem and biological Impacts (both terrestrial and marine – natural and agricultural) • Eyewitness accounts and preparedness • Social, human and economic impacts
Future ITSTs should be open to the possibility of developing new research areas, technologies, data collection techniques and methods not listed here.

Interdisciplinary teams help to provide detailed, contextural information about the tsunami that cover the breadth of the coupled human-environment system. They also have the added benefit of providing participants with a window into disciplines and research methods they may not have been previously aware of. The result is that the sum of such analyses may be much greater than its individual parts. 2.1.3 Logistics Planning an ITST requires careful consideration of numerous logistical issues and challenges in order to carry out the intended research plan of the group. The Host Country Co-ordination Committee can provide guidance as to particular logistical issues at play in the affected country. 2.1.3.1 Scheduling an ITST field survey The first decision is when to go to the field. A balance must be struck between the desire and enthusiasm of potential participants in an ITST to go in to affected areas to collect perishable data as quickly as possible and meet the needs of emergency authorities, host governments and affected communities to complete essential activities in the immediate, critical, post-disaster emergency response phase. Annex II provides information for ITST Leaders and team members to think about when scheduling the survey (Dominey-Howes, in review). 2.1.3.2 Travel, accommodation, food and money It is the responsibility of individual ITSTs to book travel and accommodation. The availability of lodging, rental cars and other transportation may be severely limited because of the impacts of the event and the needs of response personnel. It will be the responsibility of ITST members themselves to ensure they can feed themselves and have sufficient monies in the local currency to purchase necessary services. Do not assume the capacity to pay for services by credit card or in currencies other than that of the host country. Do not assume safe drinking water will be available in the field. Consideration should be given to the idea of the ITST working from a single ‘base camp’ or co-ordination centre or whether the ITST (or sub-groups) require multiple bases throughout the survey. The latter will most likely be the case for large events impacting a wide area. 2.1.3.3 Access, translation and guide services, communication needs Access to affected areas may be controlled or limited by authorities. Participating in the ITST co-ordination process can facilitate access by providing information on how to apply for official access permission, and providing identification badges. Further details are provided in Annex II. In many countries it is necessary to engage the services of translators and/or guides to enter affected areas. The Host Country Co-ordination Committee may be able to provide relevant information. The inclusion of host country experts as members of ITSTs can significantly improve the capacity for communication with local people in local languages helping off set such translator and guide service costs. ITST participants are responsible for ensuring their own telecommunication and power needs. It should not be assumed that ITSTs will have access to stable telephone or mobile systems or regular power supply. The internet is usually not available in a tsunami affected area.
2.1.3.4 Funding Funding to support ITST reconnaissance efforts is the responsibility of the ITST and its members and is not provided by UNESCO-IOC. 2.1.3.5 Safety, health and insurance The highest priority of any ITST is the safety of its members. This includes identifying and planning for a wide range of physical risks such as water safety, immunization, severe weather, earthquake aftershocks, and potential psychological risks. Working in places affected by disasters is extremely dangerous. The Host Country Co-ordination Committee may be able to help identify risks for a particular event. ITSTs should develop a safety plan before entering the field and make sure that all team members are aware of and know how to take action to reduce risks. Each participant in an ITST should be required to complete the relevant health and safety and risk assessment documentation and protocols for their own organization to enable them to go in

to the field. The UNESCO-IOC will not take responsibility for specific field risk assessments. See the relevant advice from your own government prior to travelling in to the field. The ITST Leader is expected to liaise with the Co-ordination Committee to ascertain ‘broad’ risk management issues and should communicate these to potential ITST members as early as possible to enable potential participants to decide if they can join the field survey. For those considering taking part in an ITST survey, each individual must ensure they have adequate health and travel insurance coverage from their home organization. If mosquito nets and other health and safety equipment are needed for a particular country, it is best to bring them with you. If a participant takes regular medication they should ensure they have adequate supplies for the duration of the ITST (plus further supplies to allow for a safety buffer). Participants should advise others in the ITST and the ITST Leader if they have any medical conditions that might need a response from other team members – e.g., epileptic fits, allergies etc. The security of ITSTs cannot be guaranteed either by the UNESCO-IOC or the host government nor will they be responsible for any injuries incurred in the field. 2.1.3.6 Communication Successful ITSTs face a variety of communication issues including internal communications between ITST members, externally between the ITST and host country representatives, and with people in the country met by ITST volunteers during the field survey. Section 2.2 focuses on some of the essential communication issues. Annex II provides further details on those issues related to communication that will need to be carefully considered. 2.1.4 Relevant Background Information Section 3.1 describes background data that can be collected before going into the field. These data include satellite and remote sensing imagery, relevant research efforts in the affected area, and preliminary reconnaissance reports conducted by earlier ITSTs or researchers in related fields. Such data can assist an ITST in planning so as to optimize data collection and avoid duplication.
2.1.5 Training All individuals participating in an ITST survey need to be as well prepared and properly trained as possible for the specific task they undertake. It is the responsibility of the ITST Leader to ensure all team members are trained to complete the tasks they will be expected to undertake in the field. Further details are provided in Annex II. 2.1.6 Cultural awareness, country specific regulations and practices and human research ethics ITSTs undertake rapid assessments and generally cover as much ground as quickly as possible. Every effort should be made to ensure that the manner in which ITST surveys are undertaken are culturally informed and sensitive to the needs of communities affected and it is vital that appropriate, culturally-aware and socially-responsible practices are followed. When working in mixed or cross-cultural settings, it is very easy to inadvertently cause offense to host country team members and/or members of communities that the team is visiting or working in (van Zijll de Jong et al., 2011). Understanding cultural constraints and behaviour in a culturally sensitive way will help reduce stress, improve group dynamics, demonstrate respect for each other and ensure ITST work is focused and delivers results appropriate for enhancing community resilience to future tsunamis. Every care should be taken to understand and abide by cultural practices and norms (e.g., appropriate dress requirements, interview protocol, acceptable working days) and to be familiar with basic practices (greeting people, how to behave when invited in to someone’s home etc) in the area where the work is to be undertaken. All ITST members are advised to look up basic cultural practices of the area they are visiting prior to arrival. The Tsunami National Contact person or the Host Country Co-ordination Committee may be able to compile and provide guidance materials on key/common cultural issues and protocols for ITSTs. This information should be communicated to all ITSTs and their members via appropriate mechanisms. Poor, culturally insensitive behaviour in the field can have serious repercussions including the cancelling of host government

approval for ITST work, cancelling of research visas, withdrawal of logistical support and embarrassment to all agencies and organizations involved. ITSTs and their members are expected to seek and obtain all relevant approvals for ethics and human research from their own organization prior to arrival in the affected regions. 2.1.7 Legal requirements, visas and import/export permits All ITST members are required to abide by the legal rules and codes relevant to the study area. Whilst it is understood international volunteers cannot be expected to know or learn all rules, partnering with host country experts will help to ensure that situations where team members might inadvertently fall on the wrong side of legal practice can be reduced to a minimum. The overall ITST Leader is expected to seek general advice from the Host Country Co-ordination Committee about ‘key’ legal requirements for incoming ITST volunteers. ITSTs are expected to seek appropriate visas and import/export permits to be allowed to undertake fieldwork and research in each country visited and to ensure they have the correct permits for importing equipment and exporting samples. 2.2 DURING THE FIELD SURVEY This section of the Guide summarizes operational issues for ITSTs to consider while working in the affected country. It is divided into subsections associated with initial entry, conducting the survey, exit issues, and special considerations such as dealing with the media. The bulk of this section deals with communication – both internal among ITST members and external between the ITST and host country representatives and the Host Country Co-ordination Committee and with people met during the field survey. Good communication is vital to the success of ITSTs no matter how large or small they are or what disciplines are represented. 2.2.1 Entering the host country Before an ITST enters the host country, the Co-ordination Committee and the Tsunami National Contact will have identified an entry briefing process. For a small team and/or localized event, the process may be informal and conducted by email or telephone. For a significant event, the process is likely to be more formalized. The Co-ordination Committee will advise of the expectations for the particular event. This subsection describes the types of procedures typical of a significant event involving either a large team, or multiple ITSTs. The ITST Leader is likely to be requested to attend a ‘check-in briefing’ with the Tsunami National Contact and/or relevant government officers/ministries on arrival in the host country. This initial briefing provides an opportunity for the host government to raise relevant issues of concern and for the ITST Leader to reaffirm the commitments and intensions of the ITST so that the government officials understand how the ITST survey fits into the Terms of Reference. Reporting requirements for the ITST should also be clarified such as the nature and frequency of briefings and what is expected in a final report. The ITST Leader needs to also communicate with the Co-ordination Committee to seek the latest advice about conditions in the field that could affect survey work, team safety and performance, and for information on other field reconnaissance efforts that pertain to the group’s survey work. In some cases, the Co-ordination Committee may be able to provide a briefing on research issues and the findings from earlier teams. After the initial check-in briefing with the government representative, the ITST Leader should hold a meeting/briefing with their ITST members before field work commences. This meeting should include:
• An overview of the host country check-in briefing and any updates from the Co-ordination Committee including what facilities and logistics are available to support the ITST and for how long;
• A summary of relevant logistical considerations such as where to change money, appropriate dress in public, obtaining food and water, pertinent safety information, local telephone services, etc;
• Recent results, advice, and ancillary information, including recommendations on survey sites; • Responsibilities of team members such as cultural sensitivity issues, field reports and handling of data,
care and supervision of equipment; • Advice about infield safety issues and procedures such as the potential for aftershocks and evacuation in
the case of potential further tsunami events;

• Communication plans for the group including frequency of meetings/briefings, how changes in plans and field efforts will be communicated and so on.
Open communication among ITST members is essential for the success of the ITST survey. Explanations should be provided if for any reason, plans are changed and if logistical support has to be redirected. 2.2.2 Conducting the field survey The primary purpose of the ITST is to collect survey data in the area of expertise of the team members. Part III of this Guide provides summaries of the types of data and acquisition considerations for a variety of data typically collected by ITSTs. This section focuses on the operational factors that affect ITSTs. Communication requirements during the period of the survey will depend on a number of factors including the Terms of Reference developed for the event, the size and makeup of the ITST and any subgroups, and logistical considerations such as whether the group is located at a single basecamp site or multiple sites. ITST survey plans should include mechanisms to facilitate communication both within the ITST, with the Host Country Co-ordination Committee, and with the host government if requested. The following should be included in the plan:
Communicating with the host government No matter what the size and scope of the ITST, it is important that the host government or designated agency be kept informed of how the survey work is progressing. Different host governments will require different levels, forms and types of briefings. The ITST Leader will be informed of the host government reporting requirements at the entry briefing. If daily briefings are requested, it is the ITST Leader’s responsibility to make sure they are provided and to advise the host government at the earliest opportunity if there is likely to be a delay.
Communicating with the Co-ordination Committee It is important for the Host Country Co-ordination Committee to be aware of the survey progress. If the ITST learns of particular research or logistical issues while in the field, the Co-ordination Committee should be informed. Likewise the Co-ordination Committee may learn of issues that could impact the ITST and needs to be able to contact the ITST Leader.
Communicating within the ITST group In order to ensure smooth functioning of the ITST, it is important to undertake frequent briefings with all ITST members. For a large group, a daily briefing can facilitate the exchange of research information, identify logistical problems or issues, engender a sense of team spirit and improve morale. They also give the chance to allow all team members to share their developing knowledge and express any questions or concerns they have on how the survey work is going. All team members should be given the chance to speak if they wish.
Talking with people during the field survey All ITST participants will have the need to talk to people affected by the tsunami at some point during their survey work. In some cases these interviews may be peripheral to the central purpose of the ITST effort and in others, they may be the primary focus (see Annex X).
There is no area of ITST survey work where the possibility of causing cultural offense or getting biased data is as great as with interviews. For researchers not experienced in interview techniques and human behavioral research, talking to people can be challenging. Survivors have just experienced a traumatic event and may have lost loved ones and possessions. It is important to be aware of cultural issues when talking to people. These issues may cover a large range of behaviors including how to greet people, wearing of hats and sunglasses and whether it is appropriate for men to interview women and vice versa. Permission to record/videotape an interview or taking photographs must be given by the interviewee. It is essential to communicate with host country representatives about sensitive cultural issues before talking to people.

Keeping track of local contacts and obligations It is likely that a number of local individuals and/or agencies will contribute to the success of a survey. Keep track of these persons and groups and consider collecting contact information so that you can thank them later and/or properly acknowledge them in publications or subsequent work. It is also likely that you may offer to send information or materials to persons that you meet during the survey. Make sure you carry through on any obligations that you have made.
2.2.3 Exiting the country An agreed-upon exit procedure for the ITST should be part of the discussions with the host country Co-ordination Committee at the initial briefing with host government officials. At the very least, the exit process should include a verbal report on the activities of the ITST survey and preliminary findings. For many ITSTs, the exit process may be the only opportunity for the host country to learn from the team’s effort. Exit procedures should include:
Exit briefing with host country officials and Co-ordination Committee Prior to the ITST departing, a senior level meeting should occur. This meeting should be for the host government and its relevant contact points (Tsunami National Contact). At that meeting, the ITST Leader should provide a preliminary summary report of the ITST work, make a presentation in an appropriate format/style and engage in a question and answer session for the host government and its relevant staff. The meeting should occur at a place and time convenient to the host government and time should be set aside for this important activity rather than rushing it at the last minute. The summary report should include a description of the data collected and the preliminary results of the work. If the survey work has implications for preparedness and mitigation in the host country, the briefing should also include recommendations and priorities for risk reduction strategies and activities to improve tsunami resilience.
It is strongly recommended that ITSTs compile a written preliminary report of findings before leaving the country. The report can be presented to the host country and is tangible evidence of benefit for having facilitated the survey work. For busy researchers, completing a report before leaving has an added benefit. It may allow them to capture ideas and summarize findings before becoming distracted by other demands and projects in their home countries.
Check-out procedure for ITST members The exact nature of the check-out procedure will reflect the complexity and style of the overall ITST and the actual process may vary for each member. As each member of the ITST departs, they should receive basic information on planned next steps for work including post processing of data, report writing and publication. Their full contact details should be confirmed to the ITST Leader. Individuals should agree what post-departure tasks they are willing to undertake and the time frame of those activities. Each individual should be thanked for their efforts.
Assessment Consideration should be given to establishing some form of feedback to the UNESCO-IOC and the ITST Leader on how individual members think the survey went. Such an assessment might reflect on what worked and went well, what did not work and why, and what could be improved next time. This could help form a template for improving ITSTs and this guidance in the future.
2.2.4 Special Considerations
Media Most ITSTs are likely to have some contact with the media – either in the host country or their home country. Meaningful interaction with media may be beneficial but can be tricky to negotiate and could have political consequences. Media coverage can help to facilitate access to regions that might not otherwise be available to ITSTs, and it can provide an important education and outreach tool. Regardless of the interest of the ITST members in interacting with the media, it is important to discuss how it will be handled. Communication with the host country media should be considered as part of ITST service to host countries and communities.

Teams should think about who fronts the media – their skill, comfort level, language capacity and cultural sensitivity. The ITST Leader might not be the best person. The whole team should consider discussing those issues they would like covered in media interviews and careful consideration should be given to the consistency of information provided.
It may be appropriate for the ITST to brief the host country and international media on a daily or at regular intervals. It is recommended that the ITST Leader discuss with the host government and the Co-ordination Committee the nature, frequency and type of briefings that can/should be provided. This is important so that the host government is a partner in the type of information being provided to the public.
Some of the ITST’s data and findings might be politically sensitive. Take careful consideration of the needs of the host government and think about the results before releasing information to the media. Discuss in advance with the host government whether or not the media should/can be present at briefings. If the host government does not want media presence, consider/offer to have a separate follow-up meeting that presents results that have been approved by the host government.
Social Media Some recent ITSTs have included daily blogging, and Facebook and Twitter postings as part of their field procedures. These social media have the advantage of reaching large numbers of people and can serve as an important outreach tool by engaging the public in the process of conducting a survey. Consider any social media posting as in the public domain and treat it with the same care as in dealing with professional media. Make sure the ITST Leader and the Co-ordination Committee are aware of your posting plans and be extremely careful as to how posts might be misinterpreted by people not familiar with the field.
Presentations to host country audiences Many ITSTs have included public meetings and/or presentations to scientific or other host country organizations during or near the end of their field survey work. Such presentations may range from providing introductory information about earthquakes and tsunamis in remote areas that have no developed outreach programs to more specialized presentations to an audience of professionals already familiar with much of the subject matter. Similar care should be taken into consideration at presentations as with the media. With appropriate planning, such presentations provide an additional ITST service to the host country.
2.3 AFTER THE FIELD SURVEY An ITST is not complete nor can it be considered successful until the data gathered in the survey has been reported in a form that can be used by the host country and the international research community. Post-ITST data processing and publication is the responsibility of individual team members and this Guide recognizes that data dissemination may be constrained by the requirements of funders who provided the financial support for the survey and by the needs of individuals to get professional recognition for their research efforts. UNESCO-IOC encourages the rapid public dissemination of survey data and this section of the Guide summarizes mechanisms to facilitate publication and sharing of information. 2.3.1 Reports and publications arising from the ITST After data has been collected in the field, there are a variety of dissemination mechanisms including ITST reports, professional presentations at conferences and workshops, informal community meetings geared towards the public, and peer-reviewed publications.
ITST Interim and Final Reports It is expected that the ITST Leader will present a preliminary report of the survey activities before leaving the host country and teams are strongly encouraged to leave a written version of the report with the host country representatives. The Terms of Reference and/or discussions with host country representatives may also include the expectation of a Final ITST Report and/or copies of other publications. The date for the production and delivery of the Final Report or publications needs to be negotiated with the host country. The date will vary according to the detail and scale of the ITST and

the time required to post-process the data collected. Depending on the size and complexity of the ITST, it may be necessary for the ITST Leader to delegate writing tasks to different authors. Waiting for publications to appear in print may be more than a year after the completion of the survey thus potentially delaying production of the final report by an extended period of time. Make sure this is carefully explained to the host government. All reports and publications should acknowledge the assistance of government agencies and individuals who provided assistance to the field team and copies disseminated to the Co-ordination Committee.
Conferences and professional workshops ITST members are encouraged to present the results (preliminary and final) at relevant conferences and professional workshops. Members of the ITST – together with host government officers/relevant staff should where possible, convene special sessions at relevant conferences (e.g., the American Geophysical Union, European Geosciences Union etc). It is encouraged to organize workshops (subject to funding) to reflect on lessons learned at which participants from the original ITST surveys should be included.
All ITST members who present conference papers/presentations should communicate full details of these to the overall ITST Leader so that they can provide summaries to the host government and UNESCO-IOC for official records. Anniversary workshops and symposia can provide a forum to focus dissemination of the results of a variety of ITST field efforts and put them in a context of post-disaster response and recovery efforts within affected countries. When coupled with field excursions to the impacted area, they can provide a vehicle for professionals not directly involved with an ITST to better understand the event.
Community meetings and presentations geared to the public Once ITST members have returned to their home countries, their experiences and knowledge gained may be of interest to non-professional audiences and the general public. ITST members are encouraged to participate in Community forums, service club talks, displays and other outreach activities that foster tsunami preparedness. Further, researchers should liaise with official regional emergency preparedness agencies to ensure horizontal learning.
Peer-reviewed publications Every discipline has a variety of peer-reviewed publications that may be appropriate to present the results of the ITST survey. For major tsunamis, opportunity usually arises for a Special Issue of an International refereed journal to take papers related to a specific event. The ITST Leader, together with UNESCO-IOC can often negotiate directly with Editorial Boards to support such proposals. All ITST team members should be included as co-authors on at least one summative paper about various aspects of the ITST in recognition of their efforts.
Any Special Issue should be provided to the host government as appropriate (and may be presented as the ‘Final Report’.
2.3.2 Gathering, Processing, Sharing and Distribution of Data To be of the greatest use to the international tsunami community and to serve the function of reducing vulnerability, data collected during post-tsunami field surveys should be posted to a data repository and eventually assimilated into a long-term tsunami data archive. Some tsunami data, such as tide gauge recordings, are already routinely processed in this way (Dunbar et al., 2011). But the majority of data describing the full extent and severity of a tsunami that are collected during field surveys (e.g. maximum wave height, inundation, socio-economic effects), are often not included in data archives. These data are most often stored by individual field investigators, making access by others difficult. All of these data are essential for tsunami hazard assessment, forecast and warning, inundation modeling validation, preparedness, mitigation, education, and research. UNESCO-IOC encourages all ITST participants consider posting their final data to a data archive. Some ITSTs collect a large volume of samples such as tsunami and soil deposits during a post event survey. The samples are analyzed according to the interests of the researchers and accepted field methods of the time.

It is strongly encouraged that at least some of these samples be preserved (archived). There are two reasons for sample preservation. The first is that samples are limited and researchers in other disciplines may be interested in examining them when the primary purpose for collecting the materials has been completed. The second is that technology changes and there may be an interest in applying new techniques on samples from older events. Annex III provides further information about possible data sharing options.

PART III
3. Data types, data collection equipment, methods and best practice The primary objective of an ITST is collecting field survey data relevant to the disciplines and expertise of the members of the team. This Guide recognizes that ITSTs are typically composed of discipline-specific experts who understand the requirements of their disciplines. However, researchers from different countries may have developed variations in the handling and processing of data or, when working in an inter-disciplinary field team, find themselves working with measurements, data and observations that go beyond their previous experience. The purpose of this section of the Guide is to give an overview of the types of data that are typically collected by ITSTs and where appropriate, recognize currently accepted best practices so that data collection is consistent and the results can be shared and applied as widely as possible. More detailed information about the specific needs of different ITST areas is given in Annexes V – XI. All ITSTs need to be aware of the uncertainties and statistical variations in their data collection. It is often not feasible to sample in a statistically rigorous way due to time constraints and access issues involved with ITSTs. However, participants should be aware of the uncertainty issues involved with their particular discipline and convey this uncertainty in reports and published articles.
This section is organized into subsections that look at the types of relevant data and information that should be collected before field-work begins, and during the ITST. While it may be informative for ITST members to understand data issues outside of their areas of expertise, it is only necessary for a team to collect the data relevant to the questions and problems it seeks to understand and tackle and in relation to the agreed ITST Terms of Reference.
3.1 BEFORE GOING IN TO THE FIELD Collecting data before going in to the field is important for understanding the event, the current situation on the ground and for helping to make decisions about where to conduct post-tsunami surveys. Teams also need to collect the information and equipment relevant to their specific field efforts. Pre-survey data and information falls into four general classifications:
• Data of use to understanding the general aspects of the event; • Data that will aid in locating and conducting field surveys; • Information about logistics and safety that is important for determining field sites; and • Discipline-specific information for conducting the work a particular ITST intends to do.
3.1.1 General understanding of the tsunami event The earliest information available about a tsunami typically pertains to the source characteristics (such as earthquake size/mechanism), tsunami water levels, travel time, and general impacts. Of particular interest to tsunami researchers is water level data. Annex IV describes real-time and archived sites for water level information for both coastal tide gauge locations and deep-water sites available at the time of the publication of this guide.
Historical information about the impacts of past tsunamis in a region can be accessed at the National Oceanic and Atmospheric Administrations (NOAA) National Geophysical Data Center / World Data Center (NGDC/WDC) Historical Tsunami Database. The database includes runup and water levels from instruments, field surveys and eyewitness accounts, impacts, and bibliographic references.
It is also important to monitor impacts and conditions on the ground as the event unfolds. Situation reports by government and non-governmental agencies are posted on the United Nation’s ReliefWeb site. In future years, other relevant www sites carrying such information are likely to emerge.
National agencies, professional organizations and individual researchers may set up special events pages with links to information as it becomes available. A good way to keep track of early developments is through the International Tsunami Information Center’s Tsunami Bulletin Board. The Bulletin Board will also disseminate information about whether ITSTs will be invited to participate in post event reconnaissance and the status of

teams as they are developed and deployed. To subscribe to the Bulletin Board, please contact the ITIC ([email protected]).
3.1.2 Locating field survey sites Once a decision has been made to deploy an ITST, there are several useful tools for deciding on possible field sites:
Numerical modeling Numerical models of the tsunami generation, propagation, and predicted water heights are routinely produced by national agencies and researchers soon after a tsunami occurs. Initial models may be limited by the available bathymetric data and understanding of the source characteristics, but can provide a general picture of where impacts are likely to have been the greatest. See Annex V for further information.
Geospatial information A vast array of geospatial information including satellite imagery, geographic information systems databases, and aerial photography can assist in determining areas to be studied in the field. This information will help to identify impacted areas and land use and demographic factors.Maps and satellite imagery are often available from Google Earth (http://earth.google.com), Relief Web (http:// www.reliefweb.int), or the Centre for Satellite Based Crisis Information (http://www.zki.dlr.de/). By collaborating with host country experts and government agencies access may be gained to addition geospatial data not otherwise accessible to incoming researchers.
3.1.3 Logistical information No survey can be conducted if it is impossible to reach the field area. The best source of information on how to access field areas is the Host Country Co-ordination Committee and the Tsunami National Contact.
3.1.4 Discipline-specific information Different ITSTs and sub-groups within an individual ITST may have a need for specific types of data to take into the field. For example, water-level teams need to have access to tidal data so that measurements are calibrated to a common datum. It is the responsibility of the ITST Leader to make sure that all members of the team have the relevant information to accomplish the tasks required of their survey.
3.2 Data types and special considerations This section gives an overview of data typically collected by ITSTs and what is currently considered the best practices where appropriate. Much of the detailed information including templates, lists of equipment and standard techniques is included in Annexes. The types of survey data are organized in the following categories:
• Tsunami modeling and hydrodynamic data including inundation, runup, and flow speed, depth, and
direction; • Geophysical and seismological monitoring data; • Tsunami impacts on the built environment; • Geology and tectonics including subsidence/uplift, scour, and deposits; • Ecosystem and biological impacts on both terrestrial and marine environments; • Eyewitness accounts and surveys; and • Social, human and economic impacts.
3.2.1 Tsunami modeing and hydrodynamic data Most tsunami research efforts depend upon the characteristics of the tsunami. A significant part of the ITST effort will include describing the tsunami in time and space including:
• Extent and variability of inundation; • Water heights at specific locations and along profiles; • Timing and duration of tsunami surges; • Flow directions; and • Current speeds.

Measuring water heights, inundation extent, and flow directions requires recognition of the signs of a tsunami and care must be taken not to confuse a tsunami with other natural processes such as storms and tides, or human causes. Groups taking water height measurements must also be careful to reference heights to benchmarks or another recognizable datum. Water heights may vary significantly over space so it is essential that ITSTs focusing on height measurements consider how to adequately sample an area. Care should be taken to account for coseismic uplift/subsidence when referencing depths to the datum. For an interesting discussion on this topic and its relevance to supporting further modeling efforts, see the review by Fryer (2011). Annex V provides further information on measuring water levels. In the absence of coastal tide gauges, determining the timing of tsunami surges requires interviewing of eyewitnesses. Extreme care must be taken in talking to tsunami survivors and in getting an accurate assessment of what they observed. More information on interviews is given in the section on eyewitness accounts below and in Annex X. The velocity of tsunami currents is an essential factor in determining the forces exerted on structures or the landscape and is one of the more difficult parameters to accurately assess. Amateur, security, and media footage is becoming more widely available and ITST groups should make an attempt to collect as much footage as possible as velocity estimates can be made from them. 3.2.2 Geophysical and seismological monitoring Groups looking at source characteristics may wish to deploy seismographs and strong motion instruments to investigate aftershock distributions and other seismic aspects of the event. Portable networks of Global Positioning Satellite (GPS) instruments can give important information about land level changes and post event deformation. It is assumed that groups involved in these and other auxiliary activities will understand the requirements necessary to conduct such field investigations, and that in the interests of brevity, are not detailed in this Guide. Annex VI provides additional information on Geophysical and Seismological Monitoring techniques. 3.2.3 Built environment The built environment refers to all marine and terrestrial human-made structures ranging from residential or commercial buildings to water supply or energy networks and coastal protection structures. Assessing damage to structures and lifelines is important for understanding tsunami forces and to developing design and planning guidelines. Damage is influenced by the flow of water that causes drag and uplift forces, the funneling of flows between structures, and the cycling of tsunami surges through flood and drawdown. Surveys of tsunami impacts on structures require an understanding of the architectural and structural elements of the structures impacted and recognition of the variety of ways in which a tsunami can cause damage including buoyancy, debris impact, scour, and the internal pressures produced when a tsunami repeatedly floods a structure and then recedes. If the tsunami was caused by an earthquake, seismic effects such as ground shaking and liquefaction may complicate the analysis of damage. ITSTs should strive to separate damage from tsunamis from damage from other processes (e.g., earthquake, landslide etc), especially foundation damage from liquifaction, scour etc. When possible, collecting ‘before’ photos of the impacted area can improve damage assessments. Further information is provided in Annex VII. 3.2.4 Tsunami geology Geologic effects relevant to tsunamis include changes to the land surface such as uplift and subsidence and the impacts of the tsunami flow including scour and deposition. Subduction zone earthquakes and landslides are likely to cause changes in the ground level surface and measuring areas of uplift, subsidence and identifying other geologic features such as fractures or surface faulting may help to constrain the tsunami source characteristics. Land level changes that occur coincident with or shortly after the source event may also affect the vulnerability of the area to the tsunami surges. ITSTs looking at land-level changes should have geotechnical expertise in order to recognize the difference between earthquake- and tsunami-caused impacts on the landscape. Interviews with eyewitnesses and coastal residents may help to gather anecdotal evidence of

changes in land elevation and coastal landscapes. See the section below on interviews for more information and Annex VIII. There is great value to mapping, investigating and recording geological deposits left by tsunamis – both those associated with the event in question and palaeotsunamis where these might be identifiable. Analysing deposits can provide important information about the flow on land and help in the interpretation of palaeotsunami deposits both locally and in other parts of the world. Care needs to be taken to distinguish tsunami deposits from other sedimentary material such as beach sands and storm deposits. ITSTs measuring and collecting tsunami deposits need to follow careful collection and measuring protocols so that data is not contaminated - see Annex VIII. As part of the survey of the contemporary deposits it is reasonably simple to add a module for an initial study of possible paleotsunami deposits. While the time available is unlikely to allow a comprehensive core and trench study, it may be possible to gather suitable core data through either gouge coring, D-corer or vibracoring coupled with a study of deeper trench records where a mechanical digger is available. Further information is provided in Annex VIII. 3.2.5 Ecosystem and biological impacts Researchers have been aware that tsunamis affect both marine and terrestrial ecosystems for some time, but only in recent years has the systematic approach to studying such changes been included in ITSTs (McAdoo et al., 2011). The study of the ecological impacts is important not only for a more complete understanding of tsunamis, but also for issues related to coastal protection, economic impacts and recovery. Such work may help address as the following:
• How natural coastal systems and human modifications may exacerbate or reduce impacts; • The economic impacts of a tsunami as well as contaminants and other urban releases in to the
environment for populations that rely on coastal activities for their livelihood; and • How rapidly ecosystems recover.
The ecosystems, and the reliance of people on these ecosystems, will vary between tropical and temperate climates and between countries and regions. The environmental and biophysical data that should be obtained in these regions will also differ, however the tools for collection are largely the same. Marine and terrestrial features that can reflect, refract, or diffuse tsunami energy should be mapped, along with vegetation that can stabilize sediment. In the offshore, these might include coral reefs (tropical), oyster reefs (temperate), and seagrass beds, mapped by high-resolution satellite data and marine geophysical surveying, ground-truthed and quantified by swim-transects. On land, intertidal mangroves as well as supratidal dune grasses, and coastal forests and other vegetation must be considered. A challenge in assessing the damage to the ecosystems is to determine the pre-tsunami condition of the coupled human-environment system. Pre- and post-satellite imagery, can often be used to look at the changes in offshore features such as coral reef, seagrass beds, sand bars and should be examined in the context of onshore runup and damage. Intertidal and terrestrial ecosystems such as mangroves, salt marsh, dunes, etc. should be similarly investigated. Identification of past or ongoing ecological research efforts in a region that may pertain to these studies requires that ITSTs reach out to the national and international environmental sciences community that often is not aware of or been included in tsunami research efforts. It is important to identify existing studies that may be available to provide a base-line to measure tsunami impacts and recovery. These studies may be in disciplines that are not typically involved with tsunamis such as ecology, wildlife, and fisheries and it is important for ITSTs to query diverse academic communities for the availability of such studies. Further information is provided in Annex IX.

3.2.6 Eyewitness observations No ITST effort is complete without knowing how the tsunami impacted humans and human activities. Interviews with eyewitnesses and survivors, both formal and informal, are essential to a full understanding of the event and for meaningful tsunami risk-reduction programs. Talking to people can yield critical information about:
• Tsunami characteristics – water height, timing of surges; • How people responded to natural warnings; • How people received official warning messages and how they responded and why; • Evacuation behavior including triggers and routes; • Pre-event awareness and preparedness; • Effectiveness of response and relief efforts; and • Where to get additional information such as photographs and videos, local resources, or other important
eyewitnesses accounts. There are many different types of interviews. Some research groups may want to ask a fixed set of questions to a large sample of people. Others may take a more open approach, or will wish to document individual survivor stories. In a typical ITST conducted soon after the tsunami, it is generally not possible to conduct statistically-significant social science surveys. But informal surveys can identify general themes and issues for more robust studies conducted later. There are a number of aspects of interviewing people that are common to almost all cultures.
• When talking to groups of people, a group dynamic may develop where everyone agrees with a particular version of events. In some cultures this may be related to gender or status. It is always desirable to get multiple perspectives from different people.
• It is important to genuinely listen to what a person is saying. This can be frustrating to a team who may only be interested in a specific piece of information such as how high the water reached. For a survivor, sharing observations has an emotional cost and it is never appropriate to cut off an interview because the specific goal has been obtained.
• Initial versions of an account are often incomplete and may reflect the interviewee’s desire to report what they think the group wishes to hear. Allowing the person to take their time, or even recounting specifically what they did during the event, may result in more complete and accurate data.
• Many eyewitnesses are willing to recount their experiences when approached in a culturally sensitive way. But never push an unwilling respondent to talk to you and always make it clear, that they are free to stop the interview process whenever they wish.
More information about specific interview techniques and sample interview templates are included in Annex X. 3.2.7 Social, human and economic impacts The goal of ITST efforts is to reduce losses and enhance resiliency in coastal areas that have been or may be affected by future tsunamis. The United Nations International Strategy for Disaster Reduction has recognized that disasters are ultimately a social construct and that understanding the human system in all its many parts is as important as the understanding of the physical and technological aspects of potential events. This requires that experts from many discipline fields including, but not limited to, human geography, sociology, economics, planning, policy and decision-making, risk and emergency management, anthropology, human health, political sciences, Indigenous studies, history, religious studies etc, should be encouraged to participate in an ITST. The types of data collected by such experts covers a broad range including (but not limited to):
• Disaster demographics including casualties, injuries, displaced and sheltered etc; • Direct and indirect economic losses; • Pre-event planning, mitigation efforts, preparedness and capacity; • Evacuation behavior; • Risk perception; and

• Response, relief and recovery planning. This Guide does not seek to be prescriptive nor can it be exhaustive given the range of social, human and economic sciences that could be involved in an ITST. Experts from such disciplines will know the latest, best and most appropriate data collection tools, methods and approaches to be used. Other post-event assessment teams will likely be working in the affected regions and such teams will also comprise human and socio-economic researchers under the guise of host government agencies, professional organizations, and/or international organizations such as the World Bank, Asian Development Bank, the UNDP and so forth. It is strongly recommended that ITSTs should wherever possible, work collaboratively with such teams to avoid duplication of efforts and to find opportunities to pursue additional avenues of human and socio-economic research that takes into account the expertise of ITST members. Annex XI provides some basic guidelines on undertaking human system focused work as part of an ITST.
References Chagué-Goff, C., Schneider, J-L., Goff, J., Dominey-Howes, D. and Strotz, L. (2011). Expanding the proxy toolkit to help identify past events – lessons from the 2004 Indian Ocean tsunami and 2009 South Pacific tsunami. Earth Science Reviews, 107, 107 – 122. DOI: 10.1016/j.earscirev.2011.03.007 Dunbar, P., McCullough, H., Mungov, G., Varner, J. and Stoker, K. (2011). 2011 Tohoku earthquake and tsunami data available from the National Oceanographic and Atmospheric Administration / National Geophysical Data Center. Geomatics, Natural Hazards and Risk, 2 (4), 305 – 323. DOI: 10.1080/19475705.2911.632445 Fryer, G. (2011). Walk the inundation limit: a suggestion for future post-tsunami surveys. Earth Science Reviews, 107, 123-127. DOI: 10.1016/j.earscirev.2011.03.003 Dominey-Howes, D. (in review). Reflections on organizing and leading a post-tsunami International Tsunami Survey Team (ITST) – issues and recommendations for future teams and their Team Leaders. Natural Hazards. Goff, J. and Dominey-Howes, D. (2011). The 2009 South Pacific tsunami. Earth Science Reviews, 107, v – viii. DOI: 10.1016/j.earscirev.2011.03.006 Kong, L. (2011). Post-tsunami field surveys are essential for mitigating the next tsunami disaster. Oceanography, 24 (2), 222-226. McAdoo, B., Ah-Leong, J., Bell, L., Ifopo, P., Ward, J., Lovell, E. and Skelton, P. (2011). Coral reefs as buffers during the 2009 South Pacific tsunami, Upolou Island, Samoa. Earth Science Reviews, 107, 147-155. DOI: 10.1016/j.earscirev.2010.11.005 Shiki, T., Tsujui, Y., Yamazaki, T., Minoura, K. (2008). Tsunamiites - Features and Implications, 1st Edition,Elsevier Science, pp432. Synolakis, C. and Okal, E. (2005). 1992 – 2002: Perspective on a decade of post-tsunami surveys. Pp. 1-29 in Tsunamis: Case Studies and Recent Developments. K. Satake, ed., Advances in Natural and Technological Hazards Research, vol. 23, Springer, the Netherlands. DOI: 10.1007/1-4020-331-1_1 UNESCO-IOC. (1998). Post-Tsunami Survey Field Guide (First Edition). UNESCO-IOC. Intergovernmental Oceanographic Commission Manuals and Guides # 37 (1998). UNESCO-IOC Tsunami Glossary (2008) UNESCO/IOC 2011).
Dale Dominey-Howes � 4/2/12 10:58 AMComment: This reference mentioned/provided by Laura Kong but Laura needs to provide full reference.

UN ISDR. (2009). Global Assessment Report on Disaster Risk Reduction. United Nations. Available at: http://www.preventionweb.net/english/hyogo/gar/report/index.php?id=1130&pid:34&pih:2 van Zijll de Jong, S., Dominey-Howes, D., Roman, C., Calgaro, E., Gero, A., Veland, S., Bird, D., Muliaina, T., Tuiloma-Sua, D., and Afioga, T. (2011). Process, practice and priorities – reflections on, and suggestions for, undertaking sensitive social reconnaissance research as part of an (UNESCO-IOC) International Tsunami Survey Team. Earth Science Reviews, 107, 174 – 192. DOI: 10.1016/j.earscirev.2011.03.001
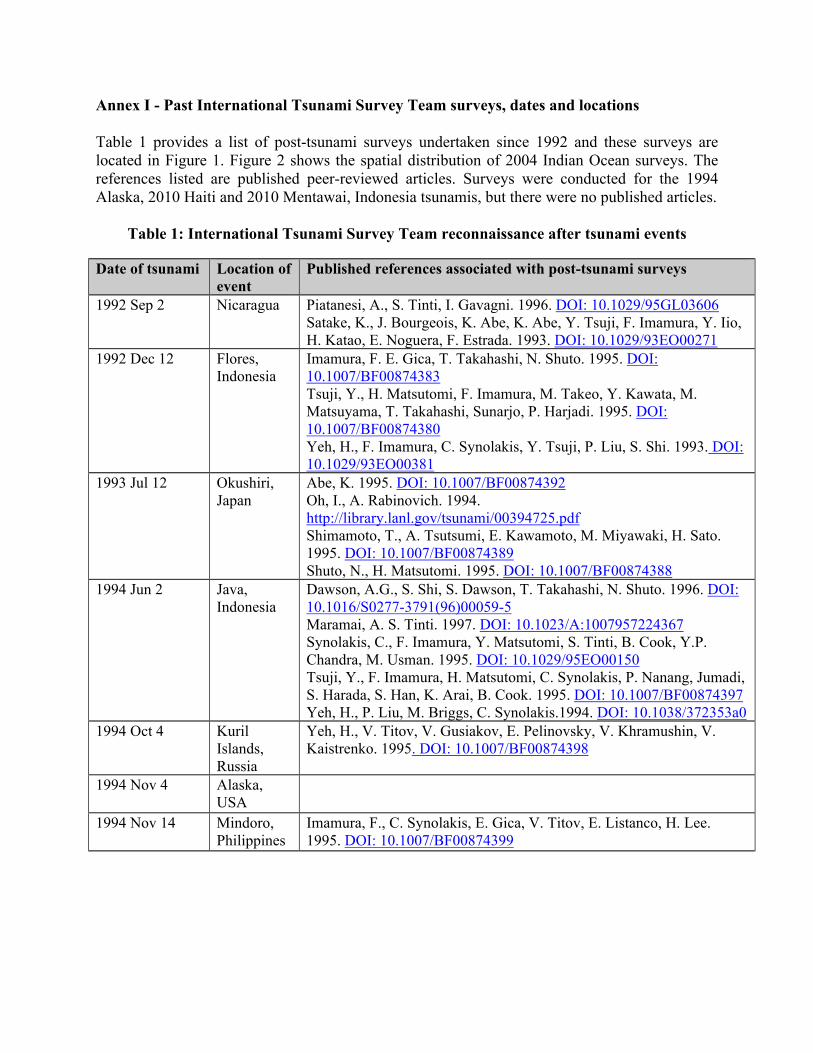
Annex I - Past International Tsunami Survey Team surveys, dates and locations Table 1 provides a list of post-tsunami surveys undertaken since 1992 and these surveys are located in Figure 1. Figure 2 shows the spatial distribution of 2004 Indian Ocean surveys. The references listed are published peer-reviewed articles. Surveys were conducted for the 1994 Alaska, 2010 Haiti and 2010 Mentawai, Indonesia tsunamis, but there were no published articles.
Table 1: International Tsunami Survey Team reconnaissance after tsunami events
Date of tsunami Location of event
Published references associated with post-tsunami surveys
1992 Sep 2 Nicaragua Piatanesi, A., S. Tinti, I. Gavagni. 1996. DOI: 10.1029/95GL03606 Satake, K., J. Bourgeois, K. Abe, K. Abe, Y. Tsuji, F. Imamura, Y. Iio, H. Katao, E. Noguera, F. Estrada. 1993. DOI: 10.1029/93EO00271
1992 Dec 12 Flores, Indonesia
Imamura, F. E. Gica, T. Takahashi, N. Shuto. 1995. DOI: 10.1007/BF00874383 Tsuji, Y., H. Matsutomi, F. Imamura, M. Takeo, Y. Kawata, M. Matsuyama, T. Takahashi, Sunarjo, P. Harjadi. 1995. DOI: 10.1007/BF00874380 Yeh, H., F. Imamura, C. Synolakis, Y. Tsuji, P. Liu, S. Shi. 1993. DOI: 10.1029/93EO00381
1993 Jul 12 Okushiri, Japan
Abe, K. 1995. DOI: 10.1007/BF00874392 Oh, I., A. Rabinovich. 1994. http://library.lanl.gov/tsunami/00394725.pdf Shimamoto, T., A. Tsutsumi, E. Kawamoto, M. Miyawaki, H. Sato. 1995. DOI: 10.1007/BF00874389 Shuto, N., H. Matsutomi. 1995. DOI: 10.1007/BF00874388
1994 Jun 2 Java, Indonesia
Dawson, A.G., S. Shi, S. Dawson, T. Takahashi, N. Shuto. 1996. DOI: 10.1016/S0277-3791(96)00059-5 Maramai, A. S. Tinti. 1997. DOI: 10.1023/A:1007957224367 Synolakis, C., F. Imamura, Y. Matsutomi, S. Tinti, B. Cook, Y.P. Chandra, M. Usman. 1995. DOI: 10.1029/95EO00150 Tsuji, Y., F. Imamura, H. Matsutomi, C. Synolakis, P. Nanang, Jumadi, S. Harada, S. Han, K. Arai, B. Cook. 1995. DOI: 10.1007/BF00874397 Yeh, H., P. Liu, M. Briggs, C. Synolakis.1994. DOI: 10.1038/372353a0
1994 Oct 4 Kuril Islands, Russia
Yeh, H., V. Titov, V. Gusiakov, E. Pelinovsky, V. Khramushin, V. Kaistrenko. 1995. DOI: 10.1007/BF00874398
1994 Nov 4 Alaska, USA
1994 Nov 14 Mindoro, Philippines
Imamura, F., C. Synolakis, E. Gica, V. Titov, E. Listanco, H. Lee. 1995. DOI: 10.1007/BF00874399

1995 Oct 9 Mexico Borrero, J., M. Ortiz, V. Titov, C. Synolakis. 1997. DOI: 10.1029/97EO00054
1996 Feb 17 Biak, Indonesia
Matsutomi, H., N. Shuto, F. Imamura, T. Takahashi. 2001. DOI: 10.1023/A:1012042222880 Pelinovsky, E., D. Yuliadi, G. Prasetya, R. Hidayat. 1997. DOI: 10.1023/A:1007904610680
1996 Feb 21 Southern Peru
Bourgeois, Joann, Catherine Petroff, Harry Yeh, Vasily Titov, Costas Synolakis, Boyd Benson, Julio Kuroiwa, James Lander, and Edmund Norabuena. 1999. DOI:10.1007/s000240050242
1998 Jul 17 Sissano, Papua New Guinea
Kawata, Y., B. Benson, J. Borrero, H. Davies, W. deLange, F. Imamura, H. Letz, J. Nott, C. Synolakista DOI: 10.1029/99EO00065 Lynett, P., J. Borrero, P. Liu, C. Synolakis. 2003. DOI: 10.1007/s00024-003-2422-0 Synolakis, C., J-P. Bardet, J. Borrero, H. Davies, E. Okal, E. Silver, S. Sweet, D. Tappino. 2002. DOI 10.1098/rspa.2001.0915 Dengler, L., J. Preuss. 2003. DOI: 10.1007/s00024-003-2417-x
1999 Aug 17 Izmit, Turkey
Altinok, Y., S. Tinti, V. Alpar, A. Yalciner, S. Ersoy, E. Bortolucci, A. Armigliato. 2001. DOI:10.1023/A:1011863610289 Yalciner, A., Y. Altinok, C. Synolakis. 2000. DOI: 10.1193/1.1586146
1999 Sep 13 Fatu-Hiva, French Polynesia
Okal, E., G. Fryer, J. Borrero, C. Ruscheral. 2002. DOI: 10.2113/173.4.359
1999 Nov 26 Vanuatu Caminade, P., D. Charlie, U. Kanoglu, S. Koshimura, H. Matsutomi, A. Moore, C. Ruscher, C. Synolakis, T. Takahashil. 2000. DOI: 10.1029/EO081i052p00641-02
2001 Jun 23 Southern Peru
Dengler, L., J. Borrero, G. Gelfenbaum, B. Jaffe, E. Okal, M. Ortiz, V. Titov. 2003. DOI: 10.1193/1.1737247 Okal, E., L. Dengler, S. Araya, J. Borrero, B. Gomer, S. Koshimura, G. Laos, D. Olcese, M. Ortiz, M. Swensson, V. Titov, F. Vegas. 2002. DOI: 10.1785/gssrl.73.6.907
2002 Sep 8 Wewak, Papua New Guinea
Borrero, J., J. Saiang, B. Uslu, J. Freckman, B. Gomer, E. Okal, C. Synolakis. 2003. DOI: 10.1785/gssrl.74.4.393
2004 Nov 21 Les Saintes, Guadeloupe
Zahibo, N., E. Pelinovsky, E. Okal, A. Yalciner, C. Kharif, T. Talipova, A. Kozelkov. 2005. http://library.lanl.gov/tsunami/ts231.pdf
2004 Dec 26 Sumatra, Indonesia, Indian Ocean
Borrero, J., C. Synolakis, H. Fritz, H. 2006. DOI:10.1193/1.2206793 Choowong, M., N. Murakoshi, K. Hisada, P. Charusiri, V. Daorerk, T. Charoentitirat, V. Chutakositkanon, K. Jankaew, P. Kanjanapayont. 2007. DOI:10.2112/05-0561.1 Dominey-Howes,D., M. Papathoma. 2006. DOI: 10.1007/s11069-006-0007-9 Fritz, H., J. Borrero. 2006. DOI: 10.1193/1.2201972 Fritz, H., E. Okal. 2008. DOI:10.1007/s11069-007-9185-3 Fritz, H., J. Borrero, C. Synolakis, J. Yoo. 2006. DOI:10.1029/2006GL026784

Fritz, H., C. Synolakis, B. McAdoo. 2006. DOI:10.1193/1.2201973 Goff, J., P. Liu, B. Higman, R. Morton, B. Jaffe, H. Fernando, P. Lynett, H. Fritz, C. Synolakis, S. Fernando. 2006. DOI:10.1193/1.2205897 Ioualalen, M., E. Pelinovsky, J. Asavanant, R. Lipikorn, A. Deschamps. 2007. DOI: 10.5194/nhess-7-141-2007 Jaffe, B., J. Borrero, G. Prasetya, R. Peters, B. McAdoo, G. Gelfenbaum, R. Morton, P. Ruggiero, B. Higman, L. Dengler, R. Hidayat, E. Kingsley, W. Kongko, Lukijanto, A. Moore, V. Titov, E. Yulianto. 2006. DOI:10.1193/1.2207724 Kench, P., R. McLean, R. Brander, S. Nichol, S. Smithers, M. Ford, K. Pamell, M. Aslam. 2006. DOI: 10.1130/G21907.1 Kurian, N., T. Prakash, M. Baba, N. Nirupama, N. 2006. DOI: 10.1080/01490410600748301 Liu, P., P. Lynett, H. Fernando, B. Jaffe, H. Fritz, B. Higman, R. Morton, J. Goff, C. Synoplakis. 2005. DOI: 10.1126/science.1110730 Okal, E., H. Fritz, A. Sladen. 2009. DOI: 10.2113/gssajg.112.3-4.343 Okal, E., A. Sladen, E.A.-S. Okal. 2006. DOI:10.1193/1.2209190 Okal, E., H. Fritz, R. Raveloson, G. Joelson, P. Pancoskova, G. Rambolamanana. 2006. DOI: 10.1193/1.2202646 Okal, E., H. Fritz, P. Raad, C. Synolakis, Y. Al-Shijbi, M. Al-Saifi. 2006. DOI:10.1193/1.2202647 Papadopoulos, G., R. Caputo, B. McAdoo, S. Pavlides, V. Karastathis, A. Fokaefs, K. Orfanogiannaki, S. Valkaniotis. 2006. http://www.terrapub.co.jp/journals/EPS/pdf/2006/5802/58020233.pdf Paris, R., P. Wassmer, J. Sartohadi, F. Lavigne, B. Barthomeuf, E. Desgages, D. Grancher, P. Baumert, F. Vautier, D. Brunstein, C. Gomez, C. 2009. DOI: 10.1016/j.geomorph.2008.05.040 Satake, K., T. Aung, Y. Sawai, Y. Okamura, K. Win, W. Swe, C. Swe, T. Swe, S. Tun, M. Soe, T. Oo, S. Zaw. 2006. http://www.terrapub.co.jp/journals/EPS/pdf/2006/5802/58020243.pdf Synolakis, C., L. Kong. 2006. DOI: 10.1193/1.2218371 Tsuji, Y., Y. Namegaya, H. Matsumoto, S. Iwasaki, W. Kanbua, M. Sriwichai, V. Meesuk. 2006. http://www.terrapub.co.jp/journals/EPS/pdf/2006/5802/58020223.pdf Umitsu, M., T. Charlchai, B. Patanakanog. 2007. DOI: 10.1016/j.margeo.2006.10.030 / Worachananant, S., R. Carter, M. Hockings. 2007. DOI:10.1080/08920750601169667 Yeh, H., M. Francis, C. Peterson, T. Katada, G. Latha, T. Chadha, R. J. Singh, G. Raghuraman. 2007. DOI: 10.1061/(ASCE)0733-950X(2007)133:6(382)

2005 Mar 28 Nias, Indonesia
Borrero, J., B. McAdoo, B. Jaffe, L. Dengler, B. Gelfenbaum, B. Higman, R. Hidayat, A. Moore, W. Kongko, Lukijanto, R. Peters, G. Prasetya, V. Titov, E. Yulianto. E. DOI:10.1007/s00024-010-0218-6
2006 Jul 17 Java, Indonesia
Fritz, H., W. Kongko, A. Moore, B. McAdoo, J. Goff, C. Harbitz, B. Uslu, N. Kalligeris, D. Suteja, K. Kalsum, V. Titov, A. Gusman, H. Latief, E. Santoso, S. Sujoko, D. Djulkarnaen, H. Sunendar, C. Synolakis, C. 2007. DOI:10.1029/2007GL029404
2006 Nov 15 Kuril Islands, Russia
Levin, B., V. Kaistrenko, A. Rybin , M. Nosov, T. Pinegina, N. Razzhigaeva, E. Sasorova, K. Ganzei, T. Ivel’skaya, E. Kravchunovskaya, S. Kolesov, Y. Evdokimov, J. Bourgeois, B. MacInnes, B. Titzhugh. 2008. DOI: 10.1134/S1028334X08020335 MacInnes, B., T. Pinegina, J. Burgeois, N. Razhigaeva, V. Kaistrenko, E. Kravchunovskaya. 2009. DOI: 10.1007/s00024-008-0428-3
2007 Apr 1 Solomon Islands
Fritz, H., N. Kalligeris. 2008. DOI:10.1029/2007GL031654
2007 Apr 21 Islin, Chile Naranjo, Arenas, Clavero, Muñoz. 2009. http://www.scielo.cl/scielo.php?script=sci_arttext&pid=S0718-71062009000100011&lng=es&nrm=iso
2007 Aug 15 Southern Peru
Fritz, H., N. Kalligeris, J. Borrero, P. Broncano, E. Ortega. 2008. DOI:10.1029/2008GL033494
2007 Sep 12 Sumatra, Indonesia
Borrero, J., R. Weiss, E. Okal, R. Hidayat, Suranto, D. Arcas. V. Titov. 2009. DOI: 10.1111/j.1365-246X.2008.04058.x
2009 Sep 29 South Pacific (Samoa, American Samoa, Tonga)
Fritz, H., J. Borrero, C. Synolakis, E. Okal, R. Weiss, V. Titov, B. Jaffe, S. Foteinis, P. Lynett, I. Chan, P. Liu. 2011. DOI:10.1016/j.earscirev.2011.03.004 Lamarche, G., B. Pelletier, J. Goff. 2010. DOI:10.1016/j.margeo.2010.02.012 Okal, E., H. Fritz, C. Synolakis, J. Borrero, R. Weiss, P. Lynett, V. Titov, S. Foteinis, B. Jaffe, P. Liu, I. Chan. 2010. DOI:10.1785/gssrl.81.4.577
2010 Jan 3 Solomon Islands
Newman, A., L. Feng, H. Fritz, Z. Lifton, N. Kalligeris, Y. Wei. 2011. DOI:10.1111/j.1365-246X.2011.05057.x
2010 Jan 12 Haiti 2010 Feb 27 Chile Fritz, H., C. Petroff, P. Catalan, R. Cienfuegos, P. Winckler, N.
Kalligeris, R. Weiss, S. Barrientos, G. Meneses, C. Valderas-Bermejo, C. Ebeling, A. Papadopoulos, M. Contreras, R. Almar, J. Dominguez, C. Synolakisl. 2011. DOI:10.1007/s00024-011-0283-5
2010 Oct 25 Mentawai, Indonesia
2011 Mar 11 Tohoku, Japan
Fritz, H., D. Phillips, A. Okayasu, T. Shimozono, H. Liu, F. Mohammed, V. Skanavis, C. Synolakis, T. Takahashi. 2012. DOI:10.1029/2011GL050686 Mori, N., T. Takahashi, T. Yasuda, H. Yanagisawa. 2011. DOI:10.1029/2011GL049210

Figure 1: Spatial distribution (and dates) of ITSTs globally.
Figure 2: Spatial distribution of 2004 Indian Ocean surveys.

Annex II - Issues to consider in regard to undertaking an ITST Scheduling ITSTs and their Leader are asked to reflect on the following:
• Survivors of disasters are in a highly stressed condition and authorities and governments and humanitarian agencies are working under difficult circumstances with incomplete information. Their priority is the affected communities – not ITSTs;
• Is there political resistance to allowing an ITST to enter an affected area for a period of time?; • Are there safety issues after a tsunami that requires teams to wait before entering affected areas?; • Resources on the ground to support an ITST will most likely be extremely limited and
emergency response has priority; • What does the affected country consider is the optimum time for the ITST to enter the affected
areas?; • If there is a scientific urgency for ‘rapid’ ITST deployment to an area, the ITST Leader, together
with UNESCO-IOC should negotiate with the host government only – avoid multiple people trying to get ‘authorisation’ and help to enter an area. It might be easier for UNESCO-IOC to gain approval;
• Try to avoid multiple ITSTs going to the same areas to undertake what will be perceived as ‘repeat surveys of the same thing’. By working in partnership with UNESCO-IOC and following the protocols suggested in this Guide, data acquisition will be maximized and duplication avoided;
• Keep ITSTs as short as reasonable, and as long as necessary to gather meaningful data; • Be flexible and understand that for reasons not obvious to ITST participants, host governments
might need to keep shifting the ‘ideal’ survey date and reschedule. Try to avoid allowing frustration to show and ‘work’ with the host government to know the best date for the survey and what might be the ‘maximum’ size of survey team a region can support.
Access, translation and guide service Each ITST Leader should inform the ITIC or Host Country Co-ordination Committee, providing the name, position, institution, and photograph of all arriving ITST participants. The nature and form of any identity badge will be culturally variable and thought should be given to their meaning and likely effects. For example, in some places, the wearing of an ‘official identity badge’ might draw the attention of survivors to survey team members in the expectation that the person wearing the badge can provide immediate disaster response or emergency aid help or official government support. Possible scenarios and solutions should be discussed on a country-by-country basis. Additionally, each ITST could be provided with an Official Letter of Support signed by the Tsunami National Contact and/or the responsible Government organization over seeing post-tsunami impact and damage assessments (in the local language and in English). The Letter should identify each participant, the team’s research tasks and will request that person’s assistance in helping the team. The Letters may be helpful in situations where official endorsement is required to obtain information. Communication Here, we ‘flag’ those most important to the overall performance of the ITST. These should be considered carefully, prior to departure in to the field and incorporated into an ITST plan:
• Communication between all ITST members and the host government and its representatives needs to be carefully considered. This will most likely be via email. We suggest to minimize overall communication traffic that there should only really be “one way” communication to make things easy or delegated communication between specific people/sub-teams. For example, ‘only’ the ITST Leader should liaise directly with the host government and then only the ITST Leader liaises directly with incoming ITST members;
• Communication between team members once in the field – especially if team members are not returning to a ‘base camp’ at the end of each day;

• Transportation of team members on a daily basis – how many vehicles are required, where will they be sourced, how long are suitable vehicles available for, who pays for transportation costs;
• How is coordination to occur? Will there be a ‘base camp’ at which information is centrally stored and co-ordination decisions can be easily made? Can sub-team leaders have decision-making and co-ordination activities delegated to them?
• Who is responsible for organizing logistics? For large ITSTs – especially those based at a single ‘base camp’? Logistics will need to be carefully planned and modified throughout the survey period to take account of daily needs and team size. This task can be very significant and may need a single person allocated to that core task. Who does this and what recognition do they get for their efforts (e.g., co-authorship of publications arising even when they have not collected data)?
• Consider infield safety issues and procedures such as the potential for aftershocks and evacuation in the case of potential further tsunamis.
At the start of the work of an ITST, when there may be multiple teams entering the field simultaneously, there should be an ITST briefing organized by the host country Co-ordination Committee and if possible hosted by the Tsunami National Contact. The meeting can be held at the ITST base camp or another location. At this briefing, final team composition is confirmed, presentations made by host government officials, and the final research tasks are decided. If there are coincident research tasks, then it is advised that where possible, efforts are made to minimize duplication of work.
At this briefing, all relevant protocols (including daily activities and briefings and survey, post-survey and end survey reporting) should be detailed. When there is a base camp that hosts team lodging, daily briefings should be held. These should be: At the start of each day, short (circa 15 min), perhaps informal (such as at breakfast) and discuss where the work program for the day is set; At the end of each day, there should be:
A evening information briefing by each team to share pertinent observations or field logistics conditions status; Data transfer by a nominated person from each team to the ITST Tsunami Technical Clearinghouse (TTC, shared data repository). The TTC can be local, e.g., external hard drive at the base camp, or remote, e.g., cyber-based through internet connection. All team members must have access to the TTC to ensure all members have access to all data at the end of the survey. These data will also be made available to ITIC/UNESCO according to their usual data acquisition protocols. It is understood that each volunteer ITST member will have specific research questions that they wish to answer and as volunteers, their right to publish data they have collected must be respected and honoured.
Working in post-disaster situations is stressful and can be upsetting. Team members should take care of each other, take time to ask if others are ok, take time to sit and listen to each other at the end of each day – formally if needed but definitely informally. Effort should be made to respect each other professionally and to understand everyone’s roles and responsibilities as researchers.
Training Training means at least the following key things:
1 - Disciplinary expertise and relevant training (BEFORE) going in to the field. Volunteering team members should make sure they are trained to do what they want to do or are asked to do by the ITST Leader. Such training might be formal training – e.g., academic research qualifications and/or professional practice (e.g., as a surveyor, geologist, social scientist, engineer etc), OR it might be very specific training by your own organization in a relevant form. 2 – In the field training. The overall ITST Leader should take responsibility to ensure their field team members are all properly trained to undertake relevant field tasks PRIOR to departure in to the field. The

ITST Leader should take responsibility for finding time (perhaps half a day) to make sure everyone understands what they are to do, their role and that all team members are properly prepared. This could include developing a standard template for data collection, practicing leveling, agreeing on the meaning of ‘key terms’ (e.g., maximum runup etc). This is easier to achieve for smaller survey teams. Where a large survey team has been assembled and is broken in to separate research sub-teams (e.g., geologists or engineers etc), the ‘Sub-team Leader’ could be given responsibility for ensuring all members of the sub-team are properly trained and prepared before survey work commences. Again, it may be necessary to spend a few hours practicing tasks prior to survey work beginning. ITSTs are reminded that they are working in disaster zones. As such, training should include how to respond to ongoing events – e.g., earthquake aftershocks and further tsunami warnings; how to communicate between team members and the base camp if regular communication channels have failed as well as basic disaster survival techniques. Consideration should be given to the idea that survey team participants might need some form of ‘cultural and or social’ training (orientation) for the specific country in which survey work is being undertaken (see Section 2.1.6). By this, it is meant that a local expert from the host country who is a member of the team should brief all team members (especially international members not from that country) on the basic do’s and don’ts of working and behaviour in that region to avoid difficult situations, accidental offence and misunderstandings. There may be a need for some training and guidance for survey team members on what they should say and do when confronted by local people in the field seeking ‘official’ government information. Despite best intentions, most survey team members are not trained to provide local survivors with humanitarian guidance, psychological care and alike but might feel under pressure to do so or to help. These issues should be discussed and prepared for prior to the team going in to the field. With time, it is hoped that the UNESCO-IOC (and others) might develop ‘core competences’ and agree standards that can be undertaken and learned by potential researchers in many countries that equip them with basic core skills to undertake post-tsunami surveys (e.g., water measurement, surveying, interviewing etc). Feedback to UNESCO-IOC on this idea is welcomed.

Annex III - Suggestions regarding data sharing Introduction and background Several, password-protected survey data repositories have been utilized to support the collection and sharing of tsunami data acquired during post-tsunami surveys. These include the US-funded NEES Tsunami Reconnaissance Data Repository implemented after the 2004 Indian Ocean event, and the ITIC-supported ITST-Chile 2010 and Mentawai 2010 clearinghouse sites. EERI, which sponsors post-earthquake investigations that have also included tsunami impacts, provides an information clearinghouse for reports submitted by survey teams, and supports during-survey contributions through its blog service (Comerio et al., 2003). The NEES data repository (http://tsunamirepository.nacse.org) objectives were to preserve key data that would otherwise be scattered or lost, and make data widely accessible via web interfaces and tools in compatible standards so tsunami data could be linked and cross-analyzed with related information from other sources. Planned tools included searching, exploring, analyzing, and extracting data by survey scientists and the public. The repository was developed after the conclusion of the 2004 Indian Ocean Tsunami surveys and with feedback from the survey scientists. Curation was by a team of experts in computer technology and tsunami science. The ITST-Chile and ITST-Mentawai clearinghouse objectives were to serve as a simple, but secure information sharing mechanism for survey scientists and government officials of the affected countries during and immediately after the survey. Survey plans, during-survey progress and data sharing, preliminary field results, and survey final reports could be posted as files and email communication with trusted users was enabled. In 2002, ITIC worked with the Hawaii State Civil Defense-sponsored Tsunami Technical Review Committee (TTRC), the Hawaii State Earthquake Advisory Committee (HSEAC) and the Pacific Disaster Center to develop a model for a secure post-disaster technical clearinghouse for tsunamis in Hawaii (Kong et al., 2002). ITST Survey Data Repository/ Technical Clearinghouse Therefore, during and following field surveys, ITSTs are strongly encouraged to share their findings through a data repository or post-tsunami survey technical clearinghouse (TTC) coordinated by the UNESCO-IOC/NOAA International Tsunami Information Center (ITIC). These data will provide guidance for investigators to better plan their field surveys, including areas where more detailed measurements would be valuable. Data should include the following metadata: survey team members; type of data; when, where, and how the data were collected. The preliminary data should also include the processing metadata such as GPS locations, astronomical tide, flow height, type of measurement (water mark or debris in a tree, on a building, wall etc). Through the TTC, data are available to other ITSTs, but should not be considered public information. The original survey team retains the intellectual property rights to the data. Once the data are finalized, investigators should contribute data to the public, long-term archive. Clearinghouse minimum requirements The following are minimum attributes for an ITST Tsunami Technical Clearinghouse:
• Real-time sharing to support disaster response and subsequent surveys • Secure • Easy-to-use with flexibility to facilitate in-field reporting/data sharing
Data included should try to include:
• Survey Plan (metadata) • During Survey status (logistics, findings, survey maps, photos, etc) • After Survey Preliminary report (check-out briefing) • Final report
Data sharing in the field ITST Leaders, when possible, should provide regular reports to the TTC during their surveys. However, due to the disaster, normal communications infrastructure may be poor or inoperable. In this case, ITSTs are

encouraged to develop and utilize satellite-based communications for data collection and sharing. For example, several recent surveys have employed portable hand-held devices to collect data (photos, location, voice notes, measurements) and these data have then been uploaded daily to a remote server. This data collection method provides data backup from the field ensuring that data will not be lost in the case of later mishaps or malfunction of in-field instruments. Data management and policies Central to the ITST is the belief that data collected are owned by the investigators themselves and will be proprietary for a length of time to allow them to conduct further research and analyses and publish their results. After the end of each ITST and its information-sharing through the TTC, it is recommended that each ITST Leader submit all collected tsunami survey data to the ICSU (International Council of Scientific Unions) World Data Service – Marine Geology and Geophysics who are responsible for maintaining the world’s long-term tsunami data archive (see below). These data should be submitted as soon as possible, but no later than two (2) years after the data are collected. Inventories (metadata) of all data collected should be submitted to the designated WDS-MGG within sixty (60) days after the survey. An example Data Management Policy – the USA National Science Foundation The US National Science Foundation (NSF) requires funded investigators to have a data management plan (http://www.nsf.gov/bfa/dias/policy/dmp.jsp). The NSF Grant Proposal Guide requires that proposal Project Descriptions outline plans for preservation, documentation, and sharing of data, samples, physical collections, curriculum materials and other related research and education products. The general ocean sciences data policy states that Principal Investigators are required to submit all environmental data collected to the designated National Data Centers as soon as possible, but no later than two (2) years after the data are collected (NSF, 2011). Inventories (metadata) of all marine environmental data collected should be submitted to the designated National Data Centers within sixty (60) days after the observational period/cruise (http://www.nsf.gov/pubs/2011/nsf11060/nsf11060.pdf ). An example data management plan from the NSF Division of Atmospheric and Geospace Sciences is available at: http://www.nsf.gov/geo/geo-data-policies/ags/index.jsp. The 2-page data management form includes questions on the type of data collected, volume of data, if metadata will be included, how the data will be made available to the public, file formats, how long the data will be kept private, and policies for distribution and archiving. Long-term Tsunami Data Archive The National Geophysical Data Center (NGDC) and co-located ICSU World Data Service for Geophysics and Marine Geology (WDS) maintains a national and international tsunami data archive (Dunbar et al., 2008). The NGDC-WDS and ITIC work closely together starting immediately after an earthquake or volcanic eruption to collect tsunami event data through eyewitness reports, news, ITST surveys, government reports, published scientific articles, and final reports. The data are considered public information and may be distributed or copied. The archive now consists of:
• A global historical tsunami (event and runup) database • A global tsunami deposits database • A Hazards Photos and Videos database • A Hazards References database • A Coastal water-level data (i.e., digital tide gauge data and marigrams on microfiche) databse; and • Bottom pressure recorder (BPR) data as collected by Deep-ocean Assessment and Reporting of
Tsunamis (DART ®) buoys The final field survey data will be assimilated into the global historical tsunami, deposits and damage photos databases.

References Comerio, C., Basoz, N., Eguchi, R., Greene, M., Holmes, W., Kircher, C., Reitherman, R., Scawthorn, C., and Tubbesing, S. (2003). Collection and Management of Earthquake Data: Defining Issues for an Action Plan, Developed by the Earthquake Engineering Research Institute From a Workshop held in Pasadena, California September 19th and 20th, 2002, EERI Publication Number 2003-03, Oakland, CA, 125 p. http://www.eeri.org/lfe/pdf/Collection-MgmtEQData.pdf Dunbar, P., Stroker, K., Brocko, V., Varner, J., McLean, S., Taylor, L., Eakins, B., Carignan, K., and Warnken, R. (2008). Long-Term Tsunami Data Archive Supports Tsunami Forecast, Warning, Research, and Mitigation, Pure and Applied Geophysics, 165, p. 2275-2291. DOI: 10.1007/s00024-008-0419-4 Kong, L., Yanagi, B., Goosby, S., Isawa, R., Walker, D., and Curtis, G. (2002). Post-Disaster Technical Clearinghouses: An Operational Model for Tsunamis in Hawaii, Proceedings of The International Workshop "Local Tsunami Warning and Mitigation", September 10-15, 2002, Janus-K, Moscow, 8 p. National Science Foundation (2011). Division of Ocean Sciences Data and Sample Policy, NSF 11-060, Arlington, VA, 17 p. http://www.nsf.gov/pubs/2011/nsf11060/nsf11060.pdf

Annex IV: Real-time and archived sites for water level information for both coastal tide gauge locations and deep-water sites Introduction and background to the discipline field and data to be collected The history of in-situ tsunami measurements and the present state-of-the-art of international tsunami observing networks as of 2007 were described in detail by Mojfeld (2009). He outlines coastal tide gauges, autonomous pressure gauges deployed in the open ocean, and submarine cable-based pressure systems deployed on or near the continental shelf and slope. This Annex focuses on water level data that are publicly available in near-real-time. Systems and instruments that are currently used in research or are not available in real-time such as global positioning systems (GPS) on surface buoys (Kato et al., 2011) are not described. Coastal tide gauge data Coastal tide gauge data are available from the Global Sea Level Observing System (GLOSS). GLOSS is an international program conducted under the auspices of the Joint Technical Commission for Oceanography and Marine Meteorology (JCOMM) of the World Meteorological Organisation (WMO) and the Intergovernmental Oceanographic Commission (IOC). The main component of GLOSS is the Global Core Network (GCN) of 289 sea level stations located around the world that is used for oceanographic sea level monitoring and determining long-term climate change. Near-real-time (up to 30 days) GLOSS data can be displayed and downloaded from the UNESCO-IOC Sea Level Station Monitoring Facility (http://www.ioc-sealevelmonitoring.org/). The sampling rate, transmit intervals and delay times vary. These data have not been quality-controlled or de-tided, but spikes and outliers can be removed in the display. Research quality sea level data are available from the GLOSS designated data centers at the Permanent Service for Mean Sea Level (PSMSL http://www.psmsl.org/), the British Oceanographic Data Center (BODC http://www.bodc.ac.uk/), the University of Hawaii Sea Level Center (UHSLC http://ilikai.soest.hawaii.edu/uhslc/contacts.html) or the data originators. A list of links for several real-time tide gauge data originators is maintained on the National Geophysical Data Center / World Data Service for Geophysics (NGDC/WDS) tide data web page (http://www.ngdc.noaa.gov/hazard/tide.shtml). An example of data availability from a data originator is described below. Following the 2004 Indian Ocean tsunami, the U.S. National Ocean Service (NOS) Center for Operational Oceanographic Products and Services (CO-OPS) began a system-wide upgrade of its instrumentation to increase the rate of data collection and transmission at all coastal National Water Level Observation Network (NWLON) stations. Over 180 upgraded tide stations are now equipped with new hardware and software to enable collection and dissemination of 1-minute water-level sample data. These data are available in near-real time and can be downloaded from the CO-OPS website in blocks of time of up to four days from the end of 2005 to the present (http://tidesandcurrents.noaa.gov/1mindata.shtml). These data are preliminary and have not been subjected to the National Ocean Service's quality control or quality assurance procedures and do not meet the criteria and standards of official National Ocean Service data. Additional 6-minute verified data, harmonic constituents and datums are available for the same stations from the main CO-OPS website (http://tidesandcurrents.noaa.gov/). The NGDC/WDS began the long-term archive of the raw 1-minute data in 2008. Deep-Ocean Assessment and Reporting of Tsunami (DART®) data In the 1980s, NOAA's Pacific Marine Environmental Laboratory (PMEL) developed deep ocean tsunameters for operational early detection, measurement, and real-time reporting of tsunamis in the open ocean based on developments by numerous researchers described by Mofjeld (2009). In 2003, operational responsibility of the DART® network was transitioned from PMEL to the National Data Buoy Center (NDBC). Each DART® and tsunameter system consists of an anchored seafloor bottom pressure recorder (BPR) and a companion moored surface buoy for real-time communication through an acoustic link. Today, a network consisting of 55 U.S. DART® and internationally owned tsunameter systems is deployed throughout the world oceans (Mungov et al., 2012). NDBC acquires and manages real-time DART® data from all ocean basins and monitors hourly messages containing real-time 15-minute data. An internal tsunami detection algorithm (Mofjeld, 1997) monitors the estimated water level to detect changes in successive 15-second values exceeding a threshold. When the internal detection software identifies an event, the system begins event mode transmission. In event mode, 15-second values are transmitted during the initial few minutes, followed by 1-minute averages. Also, all currently operating tsunameters can be set in event mode by an operator's request. The standard 15-minute and
real-time event data are displayed and made available for download in near real-time on the NDBC website (http://www.ndbc.noaa.gov/dart.shtml). Historical data for all ocean basins are accessible from the same NDBC website. Two types of DART® systems are currently used: Tsunameters of DART® second generation technology (DART® II) store 15-second pressure and temperature measurements on an internal memory card downloaded after unit recovery. The compact DART® Easy-to-Deploy (ETD) system incorporates the same technological features of the DART® II, but is deployed as a disposable unit having an operational life in excess of 4 years. The DART® ETD bottom unit is not retrieved. Both systems transmit real-time data, but internally recorded 15-second pressure and temperature data from the DART® II systems are available after the BPR unit is retrieved. The 15-second observational data that are downloaded from the internal memory cards of the DART® II tsunameters are sent to NGDC/WDS for processing (NOAA Data Management Committee, 2008). NGDC/WDS archives and distributes the raw, edited and processed data along with the available metadata (http://www.ngdc.noaa.gov/hazard/DARTData.shtml). The archive currently includes raw data from 1983–2001 deployments and processed (calibrated, edited and de-tided) data from 2002–2010 deployments. NGDC/WDS is also now archiving and processing recent significant event-specific DART® data. The event-specific web pages include a tsunami travel time map (Wessel, 2009) that shows which buoys were triggered and links to the highest resolution data that are available for download. After a tsunami, researchers should first check the NGDC/WDS website to determine if the related DART® data have been processed and archived. If the data are not yet available from NGDC/WDS, they will be available from the NDBC website. The information in this section about the DART® data was taken from the paper by Mungov et al., (2012). Please access this paper for more detailed information on the history, processing, distribution and archive of the DART® data. References Kato, T., Terada, Y., Nishimura, H., Nagai, T., Koshimura, S. (2011). Tsunami records due to the 2010 Chile Earthquake observed by GPS buoys established along the Pacific coast of Japan. Earth Planets Space, 63, e5–e8. DOI: 10.5047/eps.2011.05.001 Mofjeld, H. (1997). Tsunami detection algorithm. (Not published paper, available at http://nctr.pmel.noaa.gov/Dart/dart_ref.html Mofjeld, H. (2009). Tsunami Measurements. In The Sea, Volume 15: Tsunamis. Harvard University Press, p. 201-235. Mungov, G., Eblé, M. Bouchard, R. (2012). DART tsunameter retrospective and real-time data: reflection on 10 years of processing in support of tsunami research and operations. Pure and Applied Geophysics, in press. NOAA Data Management Committee (2008). Tsunami Data Management, An Initial Report on the Management of Environmental Data Required to Minimize the Impact of Tsunamis in the United States, Version 1.0, U.S. Department of Commerce, Washington, D.C., 87 p. Available at http://www.ngdc.noaa.gov/hazard/data/publications/Final_Tsunami_DataManagement.pdf Wessel, P. (2009). Tsunami Travel Time software v 3.2. Geoware, Ewa Beach, Hawaii. http://www.geoware-online.com/tsunami.html

Annex IX - Ecosystems Survey Equipment Standard data collection instruments can be adapted for the marine environment, however some specialized equipment is necessary. During the initial reconnaissance surveys, researchers interested in the effects on nearshore ecosystems (coral reef in the tropics, seagrass and algal communities as well as oyster reefs and the like in temperate regions) should focus on manta tows (Kenyon et al., 2006) snorkeling transects, which are faster so more area can be covered (ICRI/ISRS, 2005):
• Snorkel, fins, and mask; • Wetsuit (for sun and warmth); • Gloves; • Waterproof camera; • Pencils, slate for notes; • Sealable, plastic bags for sediment samples; and • Foatable board to attach GPS unit (with waterproof covering).
Follow-up surveys should consider bringing quadrats, manta-tow board, and weighted transect tapes. Certified divers might bring a buoyancy compensator and regulator, if quality tanks and air are available in the field area, while keeping in mind space limitations. Detailed nearshore water depth data is critical for inundation models, yet it is a challenge to collect multibeam swath bathymetry in shallow water environments (less than 30 m). A simple, portable echo sounding unit with side scan sonar capability is ideal as they measure water depths and the sidescan provides a qualitative view of seafloor roughness, which can be used to assess both habitat and constrain tsunami propagation models. Simple and affordable, off the shelf technology can be useful (e.g., Humminbird 998C SI Combo- http://store.humminbird.com/products/341046/998c_SI_Combo; Tronde-Inge et al., 2002), and more advanced systems would be beneficial for the best data quality (e.g., http://www.starfishsonar.com/products/starfish450h.htm). Documenting seafloor displacements including surface rupture and potentially tsunamigenic landslides as well as submarine paleoseismology requires a survey the trench and continental slope of the subduction zone (usually greater than 200 m). The first possible limitation for undertaking deepwater surveys is the availability of a suitable research vessel in the affected region. As a minimum, a specialized research vessel would have the following:
• Multibeam sonar (with side-scan sonar, if available); • Seismic profiler (chirp); and • Coring facilities (gravity, piston, and/or box corers).
The best case scenario would involve a ship that also has the ability to collect visuals on the seafloor - either a camera-sled, remotely-operated vehicle, or a manned submersible. The multibeam and side-scan sonar can map scarps generated either by surface faulting or landslides, however it is impossible to determine when they occurred. Seismic reflection data can show transparent or chaotic layers indicative of mass-transport deposits, potentially generated by earthquakes. Sediment cores are required to date these deposits, and in some cases, stacked mass-transport deposits can give a recurrence interval of past earthquakes. As this research is very costly, financial resources must be secured as well as the human resources necessary to process the data. Environmental and Biophysical Information While the most damaging and deadly tsunami over the last 100 years have occurred in tropical, lesser developed countries (LDCs), the potential exists for an event to occur in higher latitude, temperate developed regions (e.g., Japan, North and South America, New Zealand, etc.). It is important to keep in mind that people living in LDCs rely on ecosystem services for their livelihoods and safety more than those living in developed

countries (Sudmeier-Rieux et al., 2006). For example, coral reefs provide not only a potential physical buffer against tsunami, but may also provide for fisheries that generate food and income and the tourism industry (see McAdoo et al., 2011). Similarly, mangroves can buffer some tsunami energy, but fragmentation of the ecosystem by people seeking wood for fuel or building material can decrease its effectiveness (Cochard et al., 2008). It is therefore critical to ascertain the tsunami damage done to these systems. The ecosystems, and the reliance of people on these ecosystems, will vary between tropical and temperate climates. The environmental and biophysical data that should be obtained in these regions will also differ, however the tools for collection are largely the same. Marine and terrestrial features that can reflect, refract, or diffuse tsunami energy should be mapped, along with vegetation that can stabilize sediment. In the offshore, these might include coral reefs (tropical), oyster reefs (temperate), and seagrass beds, mapped by high-resolution satellite data and marine geophysical surveying, ground-truthed and quantified by swim-transects. On land, intertidal mangroves as well as supratidal dune grasses, and coastal forests and other vegetation must be considered. Again, pre- and post-tsunami satellite data provides a large overview of the region, and observations on the flora (and fauna) as well as the interactions of the local population with the ecosystems should be collected by ecologists familiar with the region. Ecosystems require periodic disturbances to maintain proper functioning, however the degree of the disturbance will affect how long it takes for it to recover. A low-frequency, high magnitude tsunami stresses the environment by damaging coral and benthic flora, eroding sediment from the coastal zone and redepositing vast amounts both on land and in the offshore, salinizing soils, etc. Material mobilized by the tsunami, including hydrocarbons, human waste, and solid debris will damage the ecosystems that people rely on, and must be carefully documented. The health of these ecosystems will help determine their resilience- those less affected by pollution, fragmentation and other stressors will return to providing crucial services faster. A challenge in assessing the damage to the ecosystems is determining the pre-tsunami condition of the coupled human-environment system. Maps and satellite imagery are often available from Google Earth (http://earth.google.com), Relief Web (http:// www.reliefweb.int), or the Centre for Satellite Based Crisis Information (http://www.zki.dlr.de/). From these high-resolution data, offshore features such as coral reef, seagrass beds, sand bars, and the like can be observed, and should be examined in the context of onshore runup and damage. Intertidal and terrestrial ecosystems such as mangroves, salt marsh, dunes, etc. should be similarly investigated. Each of these entities affect wave propagation, and the tsunami will have an effect on them. The degree of impact will determine the length of time until these ecosystems will return to providing services. Once in the field, researchers must determine how the affected populations interacted with the ecosystems prior to the tsunami. In some cases, it is clear, others more nuanced. For example- in developing countries, subsistence and commercial fishermen often live in the coastal zone to have better access to their livelihoods. If their primary catch is from an inshore reef fishery, then it is important to know what their catch was prior to the event, if their equipment was compromised during the tsunami, and if the catch had changed subsequently (McAdoo et al., 2011). Based on the observations, it might be necessary for government and/or aid agencies to support this community helping to replace equipment, supplement food supplies, or provide long-term aid if the reef ecosystem was severely damaged. The more nuanced effects require local knowledge. It is critical to involve government officials as well as the local people that live and work in the coastal zone. Ideally, this would be done using structured interviews by trained researchers. However, rudimentary information can be easily attained by an initial response team while measurements are being made, especially if there are in-country members of the team that are familiar with the physical, economic and cultural landscapes. Conducting post-tsunami ecological surveys The initial, rapid response survey teams should include at least one member that is familiar with a variety of coastal ecosystems. The ecologist can make quick, first-cut observations while an area is being surveyed for water level data. They must determine what critical flora and fauna live offshore and in the terrestrial coastal zone, how they were affected by the tsunami, how they affected the tsunami, and how the people interface with their surrounding ecosystems. These observations must be made quickly so that the entire inundated coastline (offshore and onshore) can be covered in a short period of time.

Recommendations can be made for areas of interest for follow up investigations During the initial survey, it is important to document interactions between people and ecosystems, especially in tropical developing countries, where people often rely on ecosystems for their sustenance and livelihoods (Sudmeier-Rieux et al., 2006). The services that the coastal ecosystems provide are crucial to their survival. For example, coral reefs are the first line of defense against large tropical storms and cyclones (and possibly tsunami), providing buffers that reduce the wave energy and minimize coastal erosion. Shallow lagoons between the barrier reef and land provide for the local fishing industries by providing a nursery services as well as habitat for a variety of commercially viable species. Healthy fisheries provide both nutrition and income for coastal residents, making them less vulnerable to a variety of hazards. Furthermore, many tropical developing countries rely on tourism as a significant contributor to their economies (see McAdoo et al., 2008), and reef damage could compromise this expected income. Nearshore ecosystems Because of these multiple and intersecting vulnerability factors, post-tsunami surveys must assess the health of offshore ecosystems as well as collect offshore physiography data that can be used for inundation models. Nearshore surveys should collect bathymetry data using a sonar linked to a GPS to water depths up to 30 m, documenting bottom character including sediment type, rocks, flora and fauna, as well as fish in the water column. In coral reef coasts, survey areas will be constrained by accessibility- access to the seaward portions of the reef will be limited by channels and shallow water in the lagoon may preclude boat access. Therefore efforts must be made to acquire shore-parallel data, both from satellite and in the water (on wading or swimming) where it is too shallow to drive a boat. Special attention should be paid to features that might buffer the tsunami, including offshore sand bars, seagrass beds, and fore reefs, so bathymetric transects should be taken seaward of these barriers for the tsunami propagation models. Sidescan sonar is also helpful as it provides a qualitative view of seafloor roughness and potential habitats.
In shallow, coral lagoons, surveys should aim to document seafloor substrate, percent of live coral, coral species, incidents of disease, algae, benthic fauna and fishes. Initial efforts should be made to tie in an offshore bathymetry survey with the on-land topography and inundation surveys. Depending on the local offshore physiography, shore-parallel (alongshore) surveys should be conducted along bathymetric contours at fixed distances from the shoreline, outside of the zone of wave breaking where any evidence of the tsunami would have been erased. The International Coral Reef Initiative/International Society for Reef Studies (ICRI/ISRS) provides detailed post-tsunami survey and sampling guidelines (ICRI/ISRS 2005; available at http://www.reefbase.org). The guidelines offer procedures for rapid response surveys to long-term, post-tsunami monitoring. For the rapid surveys, large swaths of coastline must be covered, and the sample unit should be on the order of 10 m2, so that large features such as boulders can be captured. It is very important to use the same survey methodology so that data can be easily compared. Based on the time and resources available, there are several options to consider for how to conduct the nearshore transects:
• Timed swim or fixed distance snorkeling, shore parallel ‘virtual’ transects of a few hundred meters are useful to document alongshore changes as damage is often spotty. Transect lines are preferred, but are

time consuming so should probably be saved for follow up work. Observations are subject to observer bias, and there can be variations between different observers;
• Manta tows (only conducted by experienced swimmers and boat drivers) cover large areas and sidescan sonar can simultaneously document seafloor roughness, water depth and GPS location. Again, observer subjectivity can be an issue; and
• SCUBA and transect-based surveys can be used in particular areas of interest such as the deeper channels that could act to focus tsunami flow, but is more cumbersome, gear intensive, and time consuming, and cannot cover as much area as snorkeling.
During the surveys, special attention should be paid to the following:
• In coral environments, is there evidence of disease and/or bleaching?; • Is there an active fishery industry? If so, is it industrial or artisan? How have fish takes changed
historically, and post-tsunami?; • Are there aquarium fish collecting in the region? What are the target species? What effect does their
harvest have on the ecosystem? How are they collected (e.g. cyanide, bombing)?; • What are the recreational activities in the region? What effect do they have on the environment?
Economy?; • Are there invasive species?; and • When was the last extreme weather event? How did it affect the region?
Tsunami Damage in Nearshore Environments (modified from ICRS/ICRI 2005)
Indicator Code Explanation Tropical Benthic live hard coral LCC Live coral that survived the tsunami. Estimate
area as proportion of bottom recently killed coral RKC Hard coral that has clearly died recently. The
skeleton will appear a dirty white, with sediment and/or algal filaments. Estimate as proportion of LIVE CORAL identified in previous indicator
coral life forms, alive CLF Write the main coral lifeform types from the standard list below (table 3). A - Acropora; TS - Table/staghorn Acropora; B - Branching; E - Encrusting; M - Massive/submassive; F - Foliose/plate/laminar; S - Soft coral; WF - Sea whip/sea fan
filamentous algae FAG Filamentous algae (e.g. Enteromorpha) - very fine filaments, grow within 3-4 weeks due to high nutrients. This may not be observable any more from tsunami, but may occur due to latent nutrients in silt
thick turf/fleshy algae TAG Thick algal turf and fleshy algae, maybe developing from filamentous algal bloom after tsunami. May be prevalent where nutrients are increased and/or fish populations are depleted
rock/bare surface RC Rock framework of the reef, including with a thin algal turf
rubble RB Old coral rock and pebbles in natural position with covering of algal turf and coralline algae
sandy SD Soft substrate, often in base of channels or between coral heads
Damage- Corals
overall damage to corals
CDAM Estimate the proportion of the coral community affected/damaged by the tsunami. Include dead coral in this estimate
up-turned coral UPC Live corals, but broken and overturned or lying on the bottom

broken coral BCC Live corals in growth position, but physically fragmented, cracked or broken
recently killed coral- standing
RKC-S Recently dead coral tissue, in growth position
recently killed coral- upturned
RKC-U Recently killed corals, upturned and toppled
coral life forms, damaged
CLF-D List coral life forms most damaged, in all of the damage categories listed below (table 3). A - Acropora; TS - Table/staghorn Acropora; B - Branching; E - Encrusting; M - Massive/submassive; F - Foliose/plate/laminar; S - Soft coral; WF - Sea whip/sea fan
Damage- Waves
overall damage to substrate
SDAM Estimate the proportion of the substrate affected/damaged by the tsunami
erosion CRE Erosion of reef slopes caused by slumping of rubble from reef zones above
rubble piling/movement
RBP/M Movement of old and new rubble by waves, distinguished by piles and drifts of rubble
loose rocks < 50 cm R<50 Loose rocks (framework, or dead corals) of a small size (approximately 50 cm diameter and less)
loose rocks > 50 cm R>50 Loose rocks (framework, or dead corals) of a medium size (between approximately 50 cm and 1 m diameter)
boulders > 1 m BLD Large boulders (framework, or dead corals) moved over the reef surface, of approximately 1 m diameter and larger)
scars/exfoliation SCR Scars in the reef framework and exfoliation of surface organisms caused by movement of rocks and debris
cracks CRCK Cracks in the reef framework caused by wave forces/battering with rocks
Damage- Backwash
silt smothering live coral surface
SILC Silt smothering live coral surfaces. May become chronic due to silt stored in reef sediments
silt on reef surface/sand pockets
SIT Silt smothering reef surfaces and/or collected in sand pockets and drifts
debris-stone/solid DBS Loose debris from land - stone, metal and solid items, e.g. from buildings, appliances, vehicles, etc
debris-vegetation/seagrass
DBV Loose debris - vegetation; from trees, mangroves, seagrass, etc
debris-litter (plastics/text.)
DBL Loose debris from land - litter and rubbish, plastics, textiles, etc
coral disease CD Coral diseases, potentially enhanced by microbial fauna in terrestrial silt
coral reef fish CRF Coral reef fish. Brief notes - space is included on Reef Check datasheets for notes on key species. For detailed monitoring, Underwater fish surveys should be conducted
seagrass reduction SGD Uprooting or defoliation of in situ seagrasses in sample units
mangrove debris BMG mangrove debris transported to sample areas Temperate Benthic sandy SD loose, fine grained sediment rocky (loose) RK-L loose gravel > 2 mm up to boulders (>250
mm) rocky (outcrop) RK-O bedrock, free of loose sediment cover bedforms BED Ripples, channels. Estimate ripple height,
spacing, symmetry non-coral reef builders NCR clam/oyster beds

vegetation VEG including seagrass, kelp and other macroalgae offshore bar BAR presence or absence of offshore bar and water
depth Damage debris-stone/solid DBS Loose debris from land - stone, metal and solid
items, e.g. from buildings, appliances, vehicles, etc
debris-vegetation/seagrass
DBV Loose debris - vegetation; from trees, wetlands, seagrass, etc
debris- litter (plastics/text.)
DBL Loose debris from land - litter and rubbish, plastics, textiles, etc
scars/exfoliation SCR Scars in the reef framework and exfoliation of surface organisms caused by movement of rocks and debris
cracks CRCK Cracks in the reef framework caused by wave forces/battering with rocks
vegetation reduction VGD Uprooting or defoliation of in situ seagrasses/macroalgae in sample units
Terrestrial coastal zone ecology On land, vegetation in the coastal zone will also interact with the tsunami, in some cases providing a buffer, but in other cases, providing a source of debris that might cause damage inland depending on the size of the waves and health of the particular ecosystem. Sometimes, the vegetation might not be a direct buffer- for example- dune grasses (as seagrasses offshore) while not buffers themselves, stabilize sediment drifts that are effective at retarding the inland progression of waves (e.g. Cochard et al., 2008). Similar to the offshore reef ecosystems, plants in the coastal zone provide a variety of services to communities on land past physical buffers against waves and sediment stabilization, including wood for building and fuel, food, shade and aesthetics. These plants are key elements to the coastal zone economy, especially in developing nations. Onshore ecologic surveys should tie in with the offshore transects. Beginning in the backshore, ecological transects should follow the inundation survey lines as well as documenting changes in the ecosystems parallel to the coastline. In the initial, rapid response surveys, it is important to document the species, distribution, and overall health of the dominant coastal zone ecosystems. Local and regional partners will be critical not only in helping to identify native and non-native species, but also in determining the state of the ecosystems prior to the tsunami, and how the local population interacts with the ecosystem. While this pre-tsunami information can be bolstered by satellite data, qualitative assessments from local officials as well as the communities that interact with these systems on a daily basis are important. The following factors should be considered:
• Are there any industrial activities (factories, power plants, agriculture, sewage facilities) that could affect the offshore health?;
• What are the terrestrial ecosystems that could affect the health of offshore flora and fauna?; • Where are the wetlands? Are they healthy? Are they likely to become places where earthquake debris
is dumped?; • Are there commercially important resources that were affected? If so, who owns them? ; • Is there a coastal zone management plan in place?; • Prior to the tsunami, what were the stresses on the ecosystem?; and • Do land-use patterns have any effect on fragmentation?
Follow-up surveys can focus on more detailed ecological transects, however in the early stages, it is important for decision makers to have these data so that resources can be allocated appropriately. While the force of the tsunami wave has direct impacts on coastal ecosystems, there are a variety of secondary impacts that can affect the long-term recovery of the region. Debris from damaged buildings is often pushed landward, sometimes into sensitive wetlands, and can also be dragged offshore with the backwash. Accompanying this debris can be a suite of toxic chemicals that should be documented, from septic tanks and

fertilizer storage to a variety of hazardous wastes, from fuel storage tanks and acids from batteries. A catalog of these potential pollutants will be particularly helpful as the region plans for debris removal and disposal. References Cochard, R. S., Ranamukhaarachchi, G., Shivakoti, O., Shipin, P., Edwards, and Seeland, K. (2008). The 2004 tsunami in Aceh and Southern Thailand: A review on coastal ecosystems, wave hazards and vulnerability, Perspectives in Plant Ecology, Evolution and Systematics 10, 3-40. ICRI/ISRS (International Coral Reef Initiative/International Society for Reef Studies) (2005). Tsunami Damage to Coral Reefs. Guidelines for Rapid Assessment and Monitoring. April 2005. Victoria, Seychelles. 30 pages. Kenyon, J.C., R.E. Brainard, R.K. Hoeke, F.A. Parrish, and C.B. Wilkinson. (2006). Towed-diver surveys, a method for mesoscale spatial assessment of benthic reef habitat: A case study at Midway Atoll in the Hawaiian, Archipelago. Coastal Management 34, 39–349. McAdoo, B.G., H. Fritz, K. Jackson, N. Kalligeris, J. Kruger, M. Bonte-Grapentin, A. Moore, W. Rafiau, D. Billy, and B. Tiano. (2008). Solomon Islands Tsunami, One Year Later, EOS, Transactions, American Geophysical Union 89, no. 18, p. 169-170, 29 April 2008. McAdoo, B. G., Samuelu, J., L. Bell, P. Ifopo, J. Ward, E. Lovell, P. Skelton. (2011). Coral reefs as buffers during the 2009 South Pacific tsunami, Upolu Island, Samoa. Earth Science Reviews, 107, 147 – 155. Sudmeier-Rieux, K., H. Masundire, A. Rizvi and S. Rietbergen (eds). (2006). Ecosystems, Livelihoods and Disasters: An integrated approach to disaster risk management. IUCN, Gland, Switzerland and Cambridge, UK. 58 p. Trond-Inge, K.; M. Akhir, and J. Studholme, (2002). A low-cost procedure for automatic Sea-floor mapping, with particular reference to coral reef conservation in developing nations. Hydrobiologia 474(1): 67-79.

Annex V - Tsunami modeling and hydrodynamic data Introduction and background
The objective of a post tsunami field survey from a hydrodynamics point of view is to collect and interpret physical evidence observed in the field and reconstruct the tsunami flow characteristics including water height, inundation extent, current velocity, and timing of wave arrivals in as much detail and over as wide an area as possible. These data can be used for a variety of purposes, including the development and calibration of hydrodynamic models for hazard assessment and real-time forecasting, as well as using established models for tsunami behaviour that will enhance understanding of the tsunami source mechanism. Using numerical models before the survey can help survey teams identify the likely areas of maximum impact and make better decisions of where to go, the survey plan and area needed to be covered, what equipment is needed and other logistical issues.
Survey considerations for collecting hydrodynamic data in an ITST will vary depending upon the scope of the event. In the case of a localized near-field tsunami (i.e. Nicaragua, 1992, Mexico 1995, Peru 2001 and Mentawai Island 2010 among others), one small survey team may be able to cover the entire coastal extents of an event in a relatively short amount of time. In larger events, such as the 2004 Indian Ocean Tsunami, 2010 Chile or 2011 Japan, it may take dozens of teams and hundreds of researchers working over a time span of months to completely document the event.
Tsunami modeling
Tsunami modeling is one of the essential components of tsunami studies. Tsunami models solve the governing and boundary equations using the valid numerical methods. Post-tsunami surveys provide invaluable data that can calibrate and validate tsunami models. Tsunami modeling includes the mathematical description of the problem with initial and boundary conditions, appropriate approximations and assumptions, solving the governing equations with reliable numerical techniques, simulating tsunami propagation and coastal amplifications, and computing all necessary tsunami parameters in the impact region. The main parameters computed by tsunami modeling in relation to post tsunami surveys are:
• Arrival time of first wave (when water level exceeds +- 15cm at 10m water depth) and maximum wave (the maximum amplitude near at 10m water depth); • The wave shape; • Initial sense of motion of wave (towards land or towards ocean); • The distributions of maximum positive and negative wave amplitudes near the coastal zone; • Maximum water level in the inundation zone; • Inundation distance; • Maximum water level at the inundation limit; • Flow depth in the inundation zone; • The characteristics flow velocities.
To model the tsunami, first it is necessary to define its source mechanism. While most tsunamis are tectonic in origin, landslides, volcanoes and other mechanisms can also cause tsunamis. The complexity and the uncertainty in fault rupture or other tsunami generation processes can cause difficulties in developing tsunami source model and in validation of tsunami propagation models using observed tsunami waveforms recorded at coastal tide stations. This guide primarily addresses tectonic tsunamis. However, modeling has been developed for other types of tsunami sources (need best refs), and the field procedures outlined here are applicable to all types of tsunamis.
For earthquake sources, initial numerical modeling done immediately after the event usually assumes that the fault rupture is terminated almost instantaneously, producing a likewise instantaneous sea surface displacement that is identical to the vertical sea floor displacement. The analytical solution for vertical surface deformation caused by slip on a rectangular fault in an elastic half-space is used to obtain a simple evaluation of co-seismic sea-floor displacement, (e.g., Mansinha and Smylie, 1971 and Okada, 1985). The fault parameters and the

mechanisms of fault rupture should be interpreted using tectonic settings and CMT (Centroid Moment Tensor) solutions that are released shortly after the earthquake occurs (e.g. USGS and Global CMT project). The accuracy of modeling results directly depends on the reliability of the source parameters and the accuracy of the bathymetric and topographic data especially in the shallow and near shore regions. In order to obtain reliable results in tsunami modeling, the shoreline of the model data must fit well with actual shoreline and the bathymetric data used in the model must be based on the accurate measurements and database. Since the early tsunami numerical modeling should have global coverage, bathymetry or the merged bathymetry/topography grids are needed. As of 2010, several bathymetry and topography grids of global coverage are available. Table 1 gives merged bathymetry/topography and digital elevation models (DEM) that can be used for early tsunami numerical modeling.
Table V-1: Specification of digital elevation models and merged bathymetry and topography grids
ASTER GDEM SRTM3 GTOPO30 GEBCO ETOPO1 Data DEM DEM DEM Merged Merged
Distribution METI/NASA NASA/USGS USGS GEBCO NGDC Release
year 2009 2003 1996
2008 (recent
version) 2008
Spatial resolution
30 m 90 m 1000 m 30 sec. and 1 min. 1 min.
Accuracy 7 - 14 m 10 m 30 m N/A N/A Coverage 83N to 83 S 60N to 56S Global Global Global
The history of tsunami modeling in given in Synolakis and Bernard (2006). There are a number of numerical models in common use. The methods of validation and verification of tsunami numerical models are given in Synolakis et al., (2008). Several research organizations have their own resident numerical models such as the TUNAMI-code (Tohoku University's Numerical Analysis Model for Investigation of Tsunami) and MOST (Method of Splitting Tsunami) model from PMEL, NOAA. Following most significant tsunami events, researchers will post preliminary results on line typically within hours or a day of the event. These preliminary models can then be used to quantify the magnitude of the tsunami, to estimate the extent of affected area and to guide the post-tsunami survey. Evaluation of tsunami-affected area for decisions by ITST
The primary objective of the early tsunami numerical modeling is to identify the location and scale of likely impacts by combining the initial numerical modeling results with vulnerability information. Geo-informatics, remote sensing and Geographical Information System (GIS) provide the capability to estimate the exposure of coastal populations and infrastructure to the tsunami. Figure V-1 shows how potential survey sites were identified by integrating LandScanTM population data and modeled tsunami wave heights the 2010 Chilean tsunami. Search criteria identified impacted areas by the co-incidence of 4 m or more of modeled tsunami heights and a coastal population of greater than 1000. The 4 m water height was chosen because the probability of fatalities is significantly increased (Koshimura et al., 2009).

Figure V-1: Population exposure (a), modeled tsunami height (b, c) for the February 27, 2010 tsunami in Chile. The red lines delineate regions where the population exceeds 1000 and the 4 m tsunami water height threshold. Abbreviations as follows; VAL:Valparaiso, ALG: Algarrobo, SAT: San Antonio, PIC: Pichilemu, CON:Constitucion, PEL:Pelluhue, DIC:Dichato, TOM:Tome, TAL:Talcahuano, LOT:Lota) Other resources such as Google Earth can be used to identify tsunami-affected areas. Numerical model output can be converted to .kmz/.kml files and displayed in the Google Earth’s application (Figure V-2). Recently, the Google Crisis Response team took the initiative to assess the severity of disaster by providing updated satellite imagery and maps of affected areas to illustrate infrastructure damage and help relief organizations navigate the affected area.
Figure V-2 Superimposing the early tsunami numerical model output on Google Earth’s user interface. White rectangles are the post-tsunami satellite footprints reported by Google Crisis Response team.
Using the results of numerical modeling, exposure, and government/media reports, and working with the Host Country Coordination Committee, survey teams can make better decisions on where to go and deploy limited resources.

Glossary / description of discipline specific terms
A number of terms are used to describe the overland flow of the tsunami (Figure V-3). It is essential to use the appropriate term for the types of measurements used. Important quantities include the tsunami flow depth, tsunami height, the runup height and the inundation distance. Runup is the maximum ground elevation wetted by the tsunami on a sloping shoreline. In the simplest case, the runup value is recorded at the maximum inundation distance – the horizontal distance flooded by the wave. Flow depth is the depth of the tsunami flood over the local terrain height while the tsunami height is the total elevation of the water free surface above a reference datum. In some cases where the ground topography is flat, large tsunamis can penetrate for hundreds of meters, and several kilometers inland. In such cases it may not be practical to quantitatively measure inundation distances to the furthest inland extent. In such cases, it is most useful to estimate the tsunami height and flow depths close to the shoreline and as far inland as the conditions and circumstances allow.
Figure V-3: Tsunami hydrodynamic data terminology
Current velocity and flow speed data are also important to a complete description of the tsunami characteristics. These data cannot usually be measured directly in the field. However, estimates can often be made from displaced objects and video footage.
List of equipment
Not all workers may have access to the same equipment types. This list is not exhaustive and equally does not require that all items be carried. It offers an element of redundancy and choice. It is recognised that several different types of equipment can achieve the same goal.
Collection of Water level Data
To collect water level and inundation data (i.e. tsunami heights, flow depths runup and inundation distance), the surveyor should be comfortable with the use of levelling equipment. This can include hand held eye levels, tripod mounted auto-levels, laser guided total stations or hand held laser range finders. Each of these pieces of equipment in one way or another allows for a precise quantification of the elevation difference and distance between two points.
Hand Held Level – Hand held levels are good for short horizontal distances and moderate elevation differences. A hand level is good to have as a backup, however, its relatively low accuracy and limited capabilities mean it should not be used as a primary tool for data collection.
Optical Auto Level – Optical auto levels are good for measuring elevation changes over longer distances. Optical auto levels can also be used to measure distances when used in conjunction with a

the stadia marks and a proper surveying rod. Depending on the magnification of the level, distances on the order of 100 m per shot.
Total Station/Laser level – Total stations are relatively complex to use, but with an experienced operator, they can be used effectively to collect large amounts of data over large areas. Total stations are particularly well suited for surveying over flat areas where there may be several water marks visible form one central location. A draw back of the total station is its appetite for power, usually requiring heavy batteries, which can make transport to the site cumbersome and possibly impossible due to airline baggage restrictions on hazardous material. This type of equipment is better sourced through local scientific contacts.
Laser Range Finder – One very quick and effective wave to collect accurate water level data is through the use of laser rangefinders. Ideally choose a model that has a built in inclinometer and compass. These compact and simple devices can be used without a reflecting prism over shorter distances, as the sensor can pick up reflections off of walls, trees or even people. One must only know the height of the instrument and target to obtain a relative elevation difference.
Tripod – Heavy duty aluminium tripods are used to support the auto levels and total stations. They are large and bulky and can be cumbersome to travel with, however they are absolutely vital if working with those types of equipment.
Stadia Rod or Surveying Rod – Are generally made from fibreglass and come in 5 m lengths. They a collapsible, but cannot usually be carried as hand luggage.
Other Gear
Dry Bags – for moving equipment between boats and shore.

Strong Adhesive Tape – Silver or clear packing tape. Useful for packing equipment in cardboard or attaching the stadia rod to another piece of luggage for air travel.
Power – Plug adaptors, automobile power inverters, batteries, chargers, extension cords etc…
Preserve your notes! Use waterproof paper and notebooks, i.e. the “Rite in the Rain” brand or equivalent. The weather may be bad, you could drop your notebook overboard, be splashed by a wave, or it may simply be hot and you will sweat all over your notes. Bring good pens! i.e. ‘Sharpies’, it is almost impossible to have enough of these. Bring several colors and thicknesses.
Collection of Distance Data
o Measuring tapes – can be used, but can be a hassle. Better for short distances.
o Auto level and Stadia Rod – The old classic, but a bit time consuming and requires detailed note taking a post processing of field notes.
o Laser Range Finder – See above for examples, but these can give quick, accurate distances up to ~100 m per shot.
o Handheld GPS – with accuracies on the order of 4-10 m, using a hand-held GPS to calculate distance is an acceptable solution for extensive inundation distances of several hundred meters or more. See below for more information on GPS.
o Car odometer – If there is road access from the coast to the inundation line, the car odometer can give a quick approximation of the inundation distance.
Collection of Position Data
o GPS – Hand held units are ubiquitous these days; most ‘smart’ phones have them built in as well. It may be desirable to have a dedicated surveying GPS that is capable of displaying local maps, hydrographic or topographic charts. To avoid confusion and misplacing of site locations, ensure that an appropriate standard co-ordinate frame is set-up. This is normally World Geodetic System 84 (WGS 84), but it is worth checking. It is also important to note the time zone the GPS is recording to sync with cameras, notes, etc. Most hand held GPS units do not have the accuracy to be used to measure vertical distances.
Collecting Photographic Imagery
Camera: take the best one you can get your hands on with the highest resolution possible and with a good wide lens for overview shots. Be sure to have plenty of memory cards and battery back-up. Set the camera time to the preferred reference (UTC or local) and document this by photographing a GPS time screen. A local time reference has the advantage of jogging the memory (e.g. I took that sample right after lunch) when viewing photographs.
Video camera: Useful for recording interviews and audio notes. The problem however is post processing after the fact, which can be time consuming.
Tips on Tsunami Photography

When shooting tsunami effects, keep in mind that after the field survey you will have a lot of data to organise and probably not a lot of time to do it. For this reason it is best to work in as organised a manner as possible in the field. It is advisable to keep a running log of photographs, noting the file number and time each one was taken and if possible an associated GPS location. Newer camera models often have this information contained in the image file metadata, however it is often quite cumbersome to retrieve the information and copy/paste it in to a spreadsheet or other database. If not using a GPS enabled camera, note the GPS location as well as the heading for which the shot was taken. Some cameras will record GPS, but the direction in which the photo was taken is also very important. Many digital cameras allow the user to assign a prefix to their photographs. Particularly for larger teams, it can be useful for each person to assign a unique prefix (e.g. their initials) to their photos. This helps with tracing the photographer when many photos are compiled post-survey. Often it can be just as easy and time efficient to simply note things like ‘Photos 38 – 42 taken at location waypoint 33, 3:50 pm.’ It may make life simpler when you get back to the office. Try to sort the photos by location at least daily if not more often. Relabel with relevant information as soon as possible (Figure V-4).
Figure V-4: Field survey of Iwate Prefecture Japan. Georeferenced Photo label is: DSCF0248_5-13-11_Taro Fishing Port_Bridge Deck System Turned Upside Down off Piers Adjacent to Canal Control Structure_RMN.JPG
Panoramic shots – Often the damage in a particular area cannot be covered in a single frame. Panoramic shots produced by overlaying multiple frames are useful and effective in showing the degree of the tsunami severity (Figure V-5).
Figure V-5: A panoramic view of the western side of Sibigau in the Mentawai Islands, Indonesia, October 2010. Photo is taken from the point of maximum runup.
Aerial Photography – Getting up in the air can provide scientifically valuable and breathtaking views of the tsunami effects (Figure V-6). Getting airborne however can be difficult and is usually quite expensive. However, the access to remote areas and the insight gained from the aerial perspective can be very valuable.

Sometimes, serendipitous aerial images can be taken from inbound transport flights, always ask for a window seat. Another option is for the team Leader and possibly a member of the Host Country Coordinating committee to take an aerial survey flight prior to starting the survey in order to select locations and pan logistics.
Figure V-6: (left) Helicopter perspective of the West side of Sibigau. (right) Inundation extent in Aliepata on the eastern side of Upolu. This image was taken from the window of an inter-island shuttle flight from Apia to Pago Pago.
Field Methods
Collection of Water level Data
To collect water level and inundation data (i.e. tsunami heights, flow depths runup and inundation distance), the surveyor should be comfortable with the use of the levelling equipment described above. If possible, water level data should be collected along a shore perpendicular transect to the point of maximum inundation. Topographical elevation and the tsunami flow depth should be recorded at several points along the transect. Topographical measurements should be made at obvious breaks in the coastal topography, where the ground slope has a significant change or where there is a feature of particular interest. Figure V-7 below shows a series of water level transects recorded during a survey of the 2009 Samoa tsunami. Along each transect, topographic relief was recorded as well as indicators of the tsunami water level at various locations.

Figure V-7. Water level transects from 2009 Samoa ITST. Sampling locations on left, profiles and water level indicators on right.
Correction for Tide
All collected water level data must be corrected for tide. It is important to be aware of the tidal conditions at the time of the tsunami and also at the time of the survey. Tidal data can be obtained through the use of tidal prediction software or through standard water levels at nearby reference stations. In some locations, the tidal variation may be small relative to the tsunami height and the correction may be small. Other locations have large tidal ranges and the tidal height can be very important. At higher latitude areas, the tidal stage may make the difference between on-land inundation for modest tsunami events. The duration of the tsunami inundation can also interact with the tidal variation, amplifying or diminishing the destructive capacity of later arrivals in the tsunami wave train. It will be left to the survey team to understand these considerations and accurately account for them in the reporting of the tsunami data.
Identification of Tsunami Traces and Watermarks
Paramount to the collection of tsunami water level data is the proper identification of tsunami watermarks and traces. In some cases it can be obvious, but in other situations, it can be quite difficult. Care must be taken to ensure that what is being measured is indeed a tsunami flow mark. Tsunami traces can include strand lines of debris, denuded hillsides, debris left on stairs, or broken branches. In the case of broken branches or debris caught in trees, the surveyors should assure themselves that the candidate tsunami mark was caused by the tsunami and not by some other event such as strong winds or storm waves. In tropical areas surveyors should be particularly wary of palm fronts in the tops of other types of trees. Coconut palms can grow to be quite tall and shed their fronds regularly. As such they are often blown around or fall on to the tops of other trees and can be mistaken for a tsunami deposit.
It is important to understand that a visible watermark does not always represent the highest elevation reached by the tsunami. Some of the strongest watermarks are left by trapped water after the largest surges have subsided. Tsunami trace may vary from one side of a structure to the other, and differ between the interior and the exterior. Careful interior examination may be necessary as people may scrub walls to remove marks, but miss hidden surfaces.

Figure V-8: (left) A clearly identifiable tsunami trace in American Samoa, 2009 (mid) Indicators of tsunami flow depth are less clear in this example from the Mentawai Islands; note the broken branches and (right) flow depth indicated on a photograph by an eyewitness.
Data quality and special considerations
Fieldwork should be carried out in teams. Teams size and composition are best arranged by mode of transport and availability of measuring equipment. It is recommended that there are regular morning and evening group/sub-group discussions to not only plan the work that needs to be done but also to discuss what has been collected and how. Data sharing and cross-correlation between the work of individuals and teams should help to ensure that quality control is maintained and that data are reliable. There is NEVER enough time to complete all of the work, and there will ALWAYS be something that is forgotten or poorly recorded, this cannot be avoided, but it can be reduced by repeated data checking. IF time permits we recommend that at least one site be resurveyed/resampled to provide a check on the data collected.
One of the most significant issues in recent immediate post-tsunami research efforts has been the recognition that there tends to be a biasing towards recording only the maximum runup and inundation at any one site, or the thickest and most extensive deposits – these are valuable data but only cover a part of the story. If time permits, teams should make efforts to undertake more comprehensive surveys at each site visited. When possible, the surveyors should try to recover a range of tsunami heights.
Teams should not focus only on areas where there was damage or the tsunami was high. It is as important to document areas where the inundation is modest and to clearly identify the limits of the inundation by validating the absence of a tsunami.
Most hydrodynamic data collected in the field will have some uncertainties associated with them. These uncertainties include instrumental precision, location precision, and variability in the flow. We suggest that all ITSTs discuss the issue of uncertainty and develop field protocols to address it. Some water level indicators may be very sharp and easy to measure such as a debris line indicating the landward extent of inundation. Other indicators may be more uncertain such as trying to estimate water heights in scattered trees from broken branches or debris.
Conducting Interviews
Fieldwork should include interviews of local residents, fishermen and public officials to gather anecdotal accounts of changes in sea level, coastal landscapes (geomorphology), and damage to reefs. Where possible, interviews should be in video form in order to allow for post-visit analysis. See Annex X for more information.
Collecting current velocity data
It is becoming increasingly likely that eyewitnesses will video tape the tsunami on smart phones and tablets and this video data can be used to estimate current velocities if the location of the camera is precisely known (Fritz

et al., 2012). Other sources of direct measurements of currents are from security cameras that are often located in harbor areas. Security camera footage is often erased on a daily or weekly basis so it is important for the Host Country Coordinating Committee to encourage preservation of such footage as soon as possible. Indirect estimates of current velocities can be made from displaced objects, but only when the initial location of the object is precisely known and if it is certain that debris did not contribute to the displacement of object.
Flow direction indicators
It is likely the field team will see many indicators of flow direction in the inundation zone. Features may be subtle, such as oriented grass, or pronounced such as tilted and broken trees. In some cases, indicators may show two different directions of flow (Figure V-8) in response to the varying flow regime. Directions should be carefully noted and linked to photographs.
Figure V-8: Two directions of flow indicators, Natori City, Miyagi after the March 11, 2011 tsunami. Note trees in the background displaced to the left and dead grass in the middle displaced to the right.
Remote Sensing Data Collection
High-resolution satellite images can be useful for both pre-trip planning and post event analysis of tsunami affected areas. Since 1999 commercial satellites with high-resolution optical sensors (i.e. IKONOS) have been launched. Many satellites have captured the images of tsunami-affected areas and the imagery used for disaster management activities including emergency response, relief and recovery. Table V-2 shows the specifications of high-resolution optical satellite sensors that can be used for inspecting the affected areas. The highest spatial resolution of optical sensor is about 50 cm (pan-sharpened composite image) and the acquired image has sufficient resolution to identify structural damage. Inspecting the pre and post-event images can clearly indicate the spatial extent of tsunami affected areas and damage on structures. Figure V-9 is an example of the result of visual inspection of structural damage in PagoPago, American Samoa using pre and post-tsunami satellite images from QuickBird which took the images of pre-tsunami (21:43, 24 September 2009 (GMT)) and post-tsunami (four hours after the earthquake occurred, 21:48, 29 September 2009 (GMT)).
Table V-2 Specifications of high-resolution optical satellite sensors QuickBird WorldView-
2 IKONOS GeoEye-1 SPOT-5 FORMOSAT-2
Organization DigitalGlobe DigitalGlobe GeoEye GeoEye CNES NSPO
Launch Date Oct. 18 2001
Oct. 8 2009
Sep. 24 1999
Sep. 6 2008
May 4 2002
May 21 2004
Altitude 450 km 770 km 681 km 681 km 832 km 891 km Revisit
frequency 2-3 days 1.1 or 3,7 days 3 days 3 days 2 - 3 days
Period 93.4 min. 100 min, 98.3 min. 98 min. 101.4 min. 103 min. Swath Width 16.5 km 16.4 km 11.3 km 15.2 km 60 km 24 km

Sensor bands PAN MS(4bands)
PAN MS(8bands)
PAN MS(4bands)
PAN MS(4bands)
PAN MS(4bands)
SWI PAN
MS(4bands) Sensor
resolution (Pan)
61 cm 46 cm 82 cm 41 cm 2.5 m 2 m
Sensor resolution
(MS) 2.4 m 1.8 m 4 m 1.65 m 10.0 m 8 m
Shortly after a major natural disaster occurs, space agencies and space system operators activate their efforts of emergency satellite observations to contribute to the management of crises arising from natural or technological disasters. The International Charter aims to provide a unified system of space data acquisition and delivery to those affected by natural or man-made disasters. Also in 2003, UNOSAT (UNITAR operational satellite applications programme) began rapid mapping activity to produce geospatial information in relief and coordination operations in the aftermath of disasters. Mapping efforts of satellite image interpretation and geospatial information significantly contribute on planning survey itinerary and access to the site, in addition to understanding the situation of the affected area.
Figure V-9. An example of the result of visual inspection of pre and post-tsunami satellite images acquired in Pago Pago, American Samoa (QuickBird). The event occurred at 17:48, 29 September 2009 (UTC). QuickBird satellite successfully took the images of pre-tsunami (21:43, 24 September 2009 (GMT)) and post-tsunami (four hours after the earthquake occurred, 21:48, 29 September 2009 (GMT)).
References
Amante, C. and B.W. Eakins, ETOPO1 1 ARC-MINUTE GLOBAL RELIEF MODEL: PROCEDURES, DATA SOURCES AND ANALYSIS, NOAA Technical Memorandum NESDIS NGDC-24, 19p., 2009, <www.ngdc.noaa.gov/mgg/global/global.html>
ASTER GDEM, <www.ersdac.or.jp/GDEM/E/index.html>
Disaster Charter, <www.disasterscharter.org>
Dobson, J. E., E. A. Bright, P. R. Coleman, R.C. Durfee & B. A. Worley, LandScan: A Global Population Data-base for Estimating Populations at Risk, Photogrammetric Engineering & Remote Sensing Vol. 66, No. 7, 849-857, 2000, <www.ornl.gov/sci/landscan/>

Fritz, Hermann M; Phillips, David A; Okayasu, Akio; Shimozono, Takenori; Liu, Haijiang; Mohammed, Fahad; Skanavis, Vassilis; Synolakis, Costas E; Takahashi, Tomoyuki (2012). The 2011 Japan tsunami current velocity measurements from survivor videos at Kesennuma Bay using LiDAR ,Geophysical Research Letters [Geophys. Res. Lett.]. Vol. 39.
Google Crisis Response, <www.google.com/crisisresponse/>
IUGG/IOC TIME Project, Numerical Method of Tsunami Simulation with the Leap-frog Scheme, Intergovernmental Oceanographic Commission, Manuals and Guides, No.35, SC-97/WS-37, 1997.
Koshimura, S., Y. Namegaya and H. Yanagisawa, Tsunami Fragility - A new measure to assess tsunami damage, Journal of Disaster Research, Vol. 4, No. 6, pp.479-488, 2009.
Mansinha, L. and D. E. Smylie, The displacement fields of inclined faults, Bulletin of the Seismological Society of America, 61(5), pp.1433-1440, 1971.
Okada, Y., Surface deformation due to shear and tensile faults ina half-space, Bull. Seismol. Soc. Am., 75(4), pp.1135-1154, 1985.
Shuttle Radar Topography Mission (SRTM), <srtm.csi.cgiar.org/index.asp>
Synolakis, C. and Bernard, E., (2006). Tsunami Science before and beyond Boxing Day 2004. Phil. Trans. R. Soc. A 2006, 364, 2231-2265, doi: 10.1098/rsta.2006.1824
Synolakis C. E., Bernard E. N., Titov V., Kânoğlu U., González F., (2007) NOAA Technical Memorandum OAR PMEL-135, Contribution No. 3053 from NOAA/Pacific Marine Environmental Laboratory, Also available from the National Technical Information Service (NTIS) (http://www.ntis.gov). Accessible at: http://yalciner.ce.metu.edu.tr/synolakis
Titov, V. V. and Synolakis, C. E., Numerical modeling of tidal wave runup, Journal of Waterways, Ports, Coastal and Ocean Engineering, 124 (4), pp.157-171, 1998.
Titov, V.V., F.I. González, E.N. Bernard, M.C. Eble, H.O. Mofjeld, J.C. Newman, and A.J. Venturato, Real-time tsunami forecasting: Challenges and solutions. Nat. Hazards, 35(1), Special Issue, U.S. National Tsunami Hazard Mitigation Program, pp.41-58, 2005.
The General Bathymetric Chart of the Oceans (GEBCO), <www.gebco.net/>
The Global Centroid-Moment-Tensor (CMT) Project, <www.globalcmt.org>
USGS Earthquake hazards program, <earthquake.usgs.gov>
UNOSAT, www.unitar.org/unosat/

1
Annex VI - Geophysical and Seismological Monitoring Data Introduction and background The detailed methods involved with geophysical reconnaissance studies are beyond the scope of this guidebook. However, some ITSTs may be involved with geophysical investigations as well, and it is important to have a general understanding of the purpose or such studies. Geophysical monitoring and measurements provide information and valuable data to construct an earthquake source model that can be used for the initial conditions of tsunami modelling. These include installing seismometers, GPS receivers or measuring land (or sea) levels or gravity. Note that if such measurements are started after the earthquake, only post-seismic or post-tsunami information can be obtained. It is important to identify areas where geophysical data (such as seismological or geodetic) were taken before the earthquake that caused the tsunami, even if only intermittently or during a short campaign. This can help in the location of instruments for the post event study and allow a better comparison between pre- and post-event conditions. Glossary / description of discipline specific terms Coseismic change refers to a change in values (e.g., land levels) before and after the earthquake, whereas postseismic changes refer to those after the earthquake occurrence. Smaller earthquakes following the mainshock are called aftershocks, and can be monitored by installing a set of seismometers. The aftershock distribution usually coincides with the fault area of the mainshock or the tsunami source area. The number of aftershocks usually decays with time since the mainshock, but it is not unusual for a large aftershock to re-excite the sequence and be followed by a secondary aftershock sequence. Postseismic ground deformation is usually smaller and often shows different spatial distribution from that of the coseismic deformation. List of equipment Seismometer, data logger, battery and/or solar panel, GPS clock GPS receivers for geodetic measurements Other instruments for measurements (e.g., gravimeter for measuring gravity change, levelling equipment or total station for land (sea) level measurements) Field Methods For large or great earthquakes that occurred in an area with sparse or no seismic networks, seismological observations to monitor and locate aftershocks will help to understand the main shock. Precise aftershock distributions can be used to estimate the static parameters of the causative fault, such as location, size, depth and dip angle, hence contributes to reliable initial condition of tsunami numerical simulation. In order to accurately locate earthquakes, at least four but ideally more seismic stations must be set up to record aftershocks for weeks to months. Factors to consider for such measurements include site selection (high sensitivity instruments must be set up at hard rock sites), station distribution (to cover the aftershock area), data storage and power supply, protection of instruments from vandalism, and custom clearance of imported instruments. Coordination and collaboration with local and international seismologists are essential for such geophysical measurements.

2
Data quality and special considerations Coordination and collaboration with local and international geophysicists and/or seismologists are essential. Location of instruments and timing of records must be controlled by GPS receiver and clocks, respectively.

ANNEX VII - Built Environment Introduction The built environment includes all the structures and systems resulting from human activity that modify a natural landscape. In coastal areas exposed to tsunamis this may include residential and commercial structures, port and harbor facilities, coastal protection structures, infrastructure for power, communication and transportation systems, navigation, fisheries and agriculture as other landscape-altering activities such as parks and public spaces. Damage summaries and analyses of impacts on the built environment have many important uses. They can assist in the evaluation of economic losses and in reconstruction planning. Carefully documented observations can be used to improve model-based estimates of structural and nonstructural damage. Trained observers can also differentiate the relative impacts of the tsunami and other earthquake-related factors such as ground shaking, liquefaction and surface disruption. One of the most important goals of post-event damage surveys is to recommend building practices and codes that will reduce casualties and damage from future tsunamis. Typically, ITSTs of the built environment split into sub-groups based on different engineering disciplines: e.g. structural engineers survey buildings, coastal engineers look at ports and shore protection, and geotechnical engineers review foundations and earthworks. It is important that each group coordinate with colleagues from the affected area, not only to enhance the exchange of knowledge, but also to understand the local building practices and historical and cultural contexts. Local colleagues can provide valuable information such as design drawings and plans as well as contacts with community officials in charge of buildings and infrastructure. Within the ITST, all members should discuss the different approaches and practices of their discipline on an equal footing. The timing of the ITST survey is very important. As in the case of a hydrodynamics survey (Annex V) the team must weigh the need to gather ephemeral data against the disturbance this will cause to the vital rescue and recovery efforts that take place right after a tsunami. One of the first tasks of recovery is to re-establish transportation pathways as well as power and water supply. Often this means that evidence of damages to these systems must be destroyed before repairs can begin. An ITST that looks at bridges must understand that a damaged bridge on a critical roadway may be removed almost immediately to conduct recovery operations. A survey that focuses on coastal protection will have to consider that local erosion near detached breakwaters and groins will change rapidly in the days following a tsunami as sand transport resumes a normal pattern. Other timing considerations are logistics of travel in the affected area and the health and safety of the team. The ITST Leader should work with the Host Country Coordinating Committee to determine an appropriate time for the survey and any efforts that can either assess or document types of damage that cannot be preserved for survey. List of equipment The type and amount of equipment that the ITST needs to carry depends to some extent on whether a thorough hydrodynamic survey has already been carried out in the area. A survey of the built environment requires accurate information about flow depth around structures, extent of inundation and, in some instances, runup heights. If these specific details are not known ahead of time, the ITST should be prepared to make these measurements along with their damage assessments. Annex V contains a detailed commentary on the equipment needed to record water level data for a tsunami and should be consulted for further information on these items. Equipment for measuring water level includes:
• Handheld level • Optical autolevel • Laser range finder • Total station laser level • Stadia or surveying rods
Additionally the following equipment is recommended to survey the built environment: • Camera: A camera should have the largest megapixel size possible and with a good macro facility for
close-up shots. Ideally the camera should automatically record the GPS location for a geo-referenced record of shot locations. Bring plenty of memory cards and battery back-up and consider a download

cable for daily backups and downloads (some cameras can download wirelessly or via Bluetooth). Set the camera time to the preferred reference time (UTC or local) and document this by photographing a reference time screen. A local time reference has the advantage of jogging the memory (e.g. I took that sample right after lunch) when viewing photographs. Camera Tips: Make note of the heading (compass angle) of the photo for future reference. For view shots, include a person as a reference for visual scale. For close-up shots use an object of known size for scale: e.g. A ruler or a coin. Record the date, location, photographer and reason for taking the photograph, either in field notes, or by changing photo titles as soon as possible after taking them: e.g. “_5-16-11_Sendai Port Facility_Damage_to_Gantry_Container_Crane_RMN.jpg.
• Global Positioning System (GPS): To avoid confusion and misplacing of site locations ensure that an appropriate standard co-ordinate frame is set-up. This is normally World Geodetic System 84 (WGS 84), but it is worth checking. It is also important to note the time zone the GPS is recording to sync with cameras, notes, etc. GPS Tips: Pre-load topographic maps of the survey area to the GPS unit. This can be helpful for confirming site locations as well as for navigation if road access is interrupted. Consider taking a GPS waypoint that coincides with each photograph even if the camera is GPS enabled.
• Measuring tapes: Preferably long (100 m), medium (20-30 m) and short (5 m) tapes. These are useful in measuring and recording the size and characteristics of various structural features. In the absence of GPS or surveying equipment, a simple rod-and-level topographic survey can be achieved using measuring tapes and a long pole.
• Video camera: Can be used for interview footage and area overview. Also useful for recording the context for trench/coring work and the nature and extent of erosion, deposition or subsidence. Like a camera – the highest resolution available is preferred. Video Tip: Remember that video cameras record audio - simultaneous narration of the video can be very helpful when reviewing the footage while inappropriate commentary will also be recorded.
• Calipers or a fine scale metal ruler: These are useful for measuring things like crack widths, reinforcing steel, or dimensions of small parts. Also consider bringing a protractor for estimating angles of structural connections or member failure.
• Compass and Maps: Consider bringing an analog compass for backup in the event of a power failure or lack of batteries. Use an appropriate northern or southern hemisphere compass. Topographic and other maps can supplement electronic data and can be marked up easily in the field. Tourist maps can be useful in surveys of the built environment since they usually indicate the functions of many buildings, a feature unavailable on topographic maps.
• Binoculars of high quality: These are useful for examining potential sites from a distance or for planning a survey sequence.
• Plans and specifications for structures and facilities to be visited, where available. • Aerial photographs of survey areas: If possible obtain views before, and immediately after the
tsunami. • Miscellaneous items:
o Sample bags for small structural parts or sediments, o Power adapters for charging electronics in a moving vehicle, o Waterproof notebook and writing implements.
• The following safety equipment is also helpful for survey inside damaged structures or in severely impacted areas. It is also sometimes required by the Host organization:
o Hard hat – for hanging or loose falling debris, o Steel-toed boots – for heavy, loose or sharp debris, o Survey vest in a highly visible color– for increased visibility to vehicles and construction
equipment, o Respiratory protection – for airborne contaminants from clean-up, o Eye protection – for hanging debris and dust.

Since each ITST is a specialized team composed of experts, the team members should decide the specific areas that will be addressed by the survey beforehand. As such this summary of field methods is not intended to be prescriptive but presents some of the issues that the ITST should consider during the planning phase. General considerations
• The ITST members should agree on the specific focus of the survey and the uses of the survey data. For example: is the object to gather thorough and exhaustive data sets at a few selected sites, to survey many sites for a general list of lessons learned, to gather data for model calibration or to scout out areas for further case study?
• As much as possible, documentation of failure and damage should consider the causes of failure (buoyancy, drag or impact forces, soil saturation, combined forces, etc.), the failure mechanisms (buckling, shear, overturning, etc.) as well as the timing of the failure (on-rush, down-rush, multiple wave cycles, etc.).
• Data collection should take into account how the data may be used later to refine numerical models for wave propagation, inundation and flow – structure interactions. For example: any indicators of the flow velocity or water surface variation around structures are important for model refinement.
• It is important to note what did not fail as well as what did fail. • If the ITST has many members working independently gathering similar data, the team should consider
establishing a data template to facilitate the later synthesis and reduction of data. Alternately, if appropriate, there are a number of published protocols for assessing the structural integrity of various facilities (e.g. for a breakwater survey: ERDC/CERL TR-REMR-OM-26 - Condition and Performance Rating Procedures for Nonrubble Breakwaters and Jetties).
Specific considerations
Structures – Structural damage includes tsunami effects on residential, commercial and public buildings as well as industrial facilities. The building materials for these structures can range from wood and brick to reinforced concrete and structural steel. Tsunami effects can vary widely as well: from damage to windows, interior and exterior walls, structural walls and frame, foundation damage and scouring, right through to total collapse. The level of damage is related to many things including the characteristics, type and location of the structure, erosion and scour levels, deposition and debris accumulation as well as the level of previous damage (from earthquake shaking for example).
Tips: • Damage in the survey area should be assessed for a sufficient number of similar buildings or structures
in the same area – both damaged and undamaged – so that both an average level of damage, the variety of the damage and spatial distribution of damage can be determined properly.
• During the damage survey, pictures should be collected to document findings and should include views of the structure from different angles and sides.
• ITST team members should record as much as possible about the purpose of use, type, height, size, age, and construction materials used for the structure. Since failed structures are usually rapidly demolished, it is good to recognize and record the kind of data that will not be available to a later survey group e.g. slab thickness, size of reinforcing steel, concrete quality, dimensions and angles of cracks or buckling, evidence of debris impacts etc.
• The description of a surveyed structure should include the location, address or GPS coordinates, as well as ground elevation, distance to the shoreline, orientation to the incoming waves and existence of and distance to nearby buildings.
• Data on the composition of the ground surrounding the structure as well nearby erosion, deposition or scour should be collected.
Geotechnical Issues – The geotechnical aspects of an ITST survey span a wide range: from inspection of building foundations like footings and piling, review of earthworks such as levees and dams to assessment of slope stability. Some of the methods presented in Annex VIII (Geology) apply well to evaluating large-scale effects of an earthquake and tsunami event like co-seismic uplift and subsidence as well as large area erosion and deposition. Local effects on the built environment like liquefaction, local scour and slumping as well as wave induced flow and pore pressure effects require more specialized engineering knowledge of how the affected structures are designed. An ITST that is conducting a survey of structural foundations and soils should consider the following:

• The survey should coordinate with ITSTs doing geological surveys in the same area to share valuable data and insights.
• On a plan view for each area, the ITST should note both large scale and small scale terrain and earthwork changes and, if possible, determine how and when they occurred. These include uplifted or subsided zones, erosion (scarps, exposed surfaces, slides) and deposition (extent of sand and mud transport), areas of seismically or hydraulically induced liquefaction and local scour or slumping.
• Where scour or slope failure has occurred as a result of flow interaction with a structure, careful measurements should be made to determine the cause and sequence of the failure. For example, was soil removed because it was liquefied by earthquake shaking, as a consequence of inundation and saturation or by high velocity flows around or over a structure?
Ports and Navigation- Port facilities include both large and small boat harbors, marinas, as well as vessel loading, offloading and container storage areas. Both maintained (dredged) and unmaintained navigation channels in the vicinity of the port are considered part of port operations. Additional areas, such as fuel storage facilities, are sometimes also considered. ITSTs investigating ports should consider the issues outlined above under Structures and Geotechnical Issues sections. The following principal port damages should be documented for any kind of small craft, fishery or large ship harbors in the survey area:
• Damage to port structures, • Inundation in the port storage area, • Damages resulting from the parting of vessel moorings, • Damages resulting from out-of control movements of maneuvering or unmoored vessels transported by
tsunami-induced currents, • Damages when vessels are lifted out of the water onto piers, quays or port uplands, • Damages from tsunami-induced transport of containers, vehicles and equipment within the port
boundaries, • Damages due to tsunami-induced sediment scour, deposition, slope failure or liquefaction, and • Damage or changes to navigation channels bathymetry.
Coastal and River Works – Often an ITST is formed with the specific intent of assessing the performance of shoreline structures during a tsunami. These structures are typically associated with storm and flood protection as well as sediment management on coastlines and river banks. Structures include seawalls, dikes, groins, levees, jetties, breakwaters, weirs and watergates. In addition, a survey of coastlines and rivers should include an assessment of the tsunami effects on beach, estuary and river morphology as well as vegetated barriers and parklands near the waterline. ITSTs investigating coastal and river works should consider the issues outlined above under Structures and Geotechnical Issues sections. Other suggestions are as follows:
• The survey should coordinate with ITSTs doing geological surveys in the same area to share valuable data and insights.
• The ITST should confirm the specific purpose and design conditions for the coastal or river structure – i.e. Was the design wave height for a tsunami or storm wave? Is the structure intended to stabilize the bank or shoreline or to prevent flooding?
• As much as possible, the survey should document the sequence and mechanisms of failure or response during the tsunami (What failed first? How did the damage evolve?). Since coastal structures are often the first point of tsunami impact, it is very important to get a good idea of the complex interaction of the tsunami with the structure, its foundation and debris.
• The ITST should carefully record the transport (or stability) of revetments and individual armor units. If possible, the dimensions of shore and river bank protection should also be measured, since transport of simply shaped objects can be used to refine numerical models.
• During the planning phase, the ITST or team Leader should evaluate carefully the need for a boat and or underwater survey, both from a logistical and a safety standpoint.
• Beach and channel characteristics (width, slopes, grain-size etc.) should be documented at the time of survey so they can be compared with other available data, both pre- and post- tsunami, to document morphological changes.
Infrastructure Systems – As part of a built environment ITST, the team may be asked to assess the performance of integrated systems that have structural, mechanical and personnel components. Aside from documenting damages to structures and facilities related to these systems, the ITST should insure that if tasked

with infrastructure assessment, team members have adequate expertise in the relevant areas. These include but are not limited to:
• Transportation: roads, railways, bridges, airports, ferries; • Utilities: water, power, communication, liquid and solid waste disposal; • Emergency Response: fire and police, hospitals and medical, evacuation and temporary shelters; and • Agriculture, Aquaculture and Fisheries.
Data quality and special considerations
Each damage survey team should have a Leader who has extensive experience in immediate post-tsunami surveys and an up-to-date understanding of the latest methods and techniques available for field work. They should act to ensure consistency of data collection and provide quality control over the team’s (or sub-team’s) work. The Leader should also coordinate with local authorities to obtain pre tsunami conditions of the survey site.
One of the particular competencies of a built environment ITST is the ability to document the behavior of engineered objects with known dimensions and material properties. The response of railings, posts, and armor units to hydrodynamic loading can be used to refine predictions of tsunami forces and inundations which in turn can improve planning and design in tsunami prone areas. The ITST should try to gather as much quantitative evidence as possible about deformation, transport distances and impacts of:
• Cylindrical objects : Posts, poles, railings and trees • Block units: Precast shore and river armor, revetments and boulders • Buoyant objects: Vehicles, vessels and containers including storage tanks and mechanical equipment
The ITST should consider and incorporate the possible effects of multiple hazards on the findings of the survey. What conditions occurred prior to the tsunami (e.g. liquefaction due to earthquake?) and between the time of tsunami and the survey (reworking of the beach face from a storm event?).
Figure 1 - Scour pattern and multiple views of reinforced concrete structure: Arahama Beach, Sendai, Japan, May 16, 2011, two months after tsunami.

Figure 2 – Pile-supported dock with local subsidence failure of dockside infill: Kesennuma Port, Japan, March 10, 2012, one year after tsunami.
Data quality and special considerations The properties (coordinate, time and direction of shooting, etc.) of the picture, and all specifications (brand, model, etc.) of the camera should be given in the survey report of the built environment. We recommend that each damage survey team has a leader who has extensive experience in immediate post-tsunami surveys and an up-to-date understanding of the latest methods and techniques available for field work. They should act to ensure consistency of data collection and provide quality control over the team’s (sub-team’s) work. References Edge, B., Eskijian, M., Boudreau, R., Carbuccia, M., Jaradat, O., Percher, M., Serrano, J., and Arulmoli, A., (2011). Investigation of the Damage to Areas of Coastal Chile Due to the Maule MW 8.8 Earthquake of February 27, 2010, in Proceedings Solutions to Coastal Disasters, doi:http://dx.doi.org/10.1061/41185(417)31 EERI Special Earthquake Report — September 2011. EERI/ASCE report on tsunami effects on structures, http://www.eqclearinghouse.org/2011-03-11-sendai/2011/09/29/next-in-eeri-lfe-series-now-available-tsunami-effects-on-structures/ Koshimura, S., Oie, T., Yanagisawa, H., Imamura, F. (2009). Developing fragility functions for tsunami damage estimation using numerical model and post-tsunami data from Banda Aceh, Indonesia, Coastal Engineering Journal, Vol. 51, No. 3. pp. 243-273. Tanaka, N., Sasaki, Y., Mowjood, M. I. M. , Jinadasa and Samang Homchuen, K. B. S. N. (2007). Coastal vegetation structures and their functions in tsunami protection: experience of the recent Indian Ocean tsunami, Landscape and Ecological Engineering, Volume 3, Number 1, 33-45, DOI: 10.1007/s11355-006-0013-9

Annex VIII - Geologic, Tectonic, and Geotechnical Information Introduction and background to the discipline field and data to be collected The collection of geologic, tectonic, and geotechnical Information is in essence work undertaken to capture changes to the physical environment. It involves the reporting and recording of coastal uplift or subsidence (itemising the indicators used), the study of deposits laid down by the tsunami both in onshore and offshore settings, and determining the extent of erosional features and geomorphological change associated with the event. Where time allows there is also scope for preliminary work on palaeotsunami deposits in order to place the most recent event in the context of past tsunami activity in the region. List of equipment Not all workers may have access to the same equipment types. This list is not exhaustive and equally does not require that all items be carried. It offers an element of redundancy and choice. It is recognised that several different types of equipment can achieve the same goal.
• Compass: Use an appropriate northern or southern hemisphere compass • GPS: Not everyone will have one but they are reasonably common. To avoid confusion and misplacing
of site locations ensure that an appropriate standard co-ordinate frame is set-up. This is normally World Geodetic System 84 (WGS 84), but it is worth checking. It is also important to note the time zone the GPS is recording to sync with cameras, notes, etc.
• Electronic distance and elevation meters. These are becoming increasingly available as prices fall. • Measuring tapes: Preferably long (100 m), medium (20-30 m) and short (5 m) tapes. In the absence of
GPS or surveying equipment a simple rod-and-level topographic survey can be achieved using measuring tapes and long pole (e.g. Morton et al., 2008).
• D-handled shovel/spade about 1 m long (handle plus blade) and/or round pointed (cupped blade) shovel. Square point (flat blade) spade. All digging equipment should have a sharp edge to the cutting blade – it is recommended that a file or stone be used to keep the blade sharp. The shaft can be painted/marked (e.g. red/white paint) at 10 cm intervals to provide photo scale.
• Folding shovel: Space saving, convenient. Shaft can be painted/marked (red/white paint) at 10 cm intervals to provide photo scale.
• Nejirigama (a Japanese weeding tool): Some researchers prefer to use these to clean the face of a section/trench. Sharp edge on one side.
• Trowel: Blade has two sharp edges and a point (maintain sharp edges/point using file/stone). Useful to have large (15 cm blade) and small (2 cm blade) for cleaning the face of a section/trench and for the fine detail work.
• Brushes: For cleaning up face of section/trench – this helps highlight bedding. Preferable to have large (~8 cm wide) and small (~1 cm wide) for variable detail of work.
• Water spray bottle: Any type of laundry spray bottle filled with water. Useful with dry sands or unconsolidated sediments – it helps to retain integrity of section.
• Augers/corers: There are many varieties with extension rods – a core/auger has value for examining sediments in wetlands, estuaries, all types of water bodies. In the absence of trenchable areas or with only shallow trenches available these also has value for penetrating deeper below the surface to look for evidence of past events. Most common/convenient are Gouge Augers – these have variable barrel widths and lengths and work well for consolidated sediments but do not retain dry sands or unconsolidated material well; D-corer or Russian-type corer – they have variable barrel widths and lengths, the rotating blade retains a length of core that can be extracted and examined later back in the laboratory. Always good to have one or both of these to augment trench work. Hand held piston cores are also a possibility. Whatever type of coring-related equipment is taken in the field it is essential to have the relevant sample collection material. This may be plastic core tubes for storing samples, or it may be by sample bags, but equally duct tape and plastic wrap (e.g. Saran wrap, glad wrap) are extremely useful for securing samples collected.
• Camera: take one with the largest megapixel size possible and with a good macro facility for close-up shots. Plenty of memory cards and battery back-up. Set the camera time to the preferred reference (UTC or local) and document this by photographing a GPS time screen. A local time reference has the advantage of jogging the memory (e.g. I took that sample right after lunch) when viewing photographs.

• Video camera: Useful for recording the context for trench/coring work and the nature and extent of the deposit at any one point. Like a camera – the highest resolution available is preferred.
• Binoculars: High quality – useful for examining potential sites from a distance. Time-saving device (e.g. is it worth crossing river to examine deposit?).
• Sample bags, sample tags, marker pens. It is almost impossible to have enough of these. • Supplies for sediment peels: Taking a peel from a trench face is becoming an increasingly common
practice BUT needs appropriate training because the hydrophilic grout used contains highly toxic chemicals. For this reason researchers from many countries are unable to access the material because it cannot be imported. The technique is moderately simple, but breathing apparatus and strong gloves are essential. The key supplies are the grout, a roll of plastic mesh, several litres of water, gloves, breathing apparatus, a plastic spatula or two, and some disposable plastic containers to mix the grout with water. Consult with colleagues to determine the best grout source in a region.
Field Methods Coastal uplift or subsidence (indicators used), surface faults, tilt Fieldwork should include interviews of local residents, fishermen and public officials to gather anecdotal accounts of changes in sea level, coastal landscapes (geomorphology), and damage to reefs. Where possible, interviews should be in video form in order to allow for post-visit analysis. See further discussion in Section 2.2.2, Annex II and Annex X. Field teams should complement interview data with on-site observations and measurements including the identification, location and estimates of the extent of possible coastal uplift or subsidence. Where possible and subject to equipment availability, GPS vertical positioning of existing benchmarks would be useful. The field team should note and estimate vertical movements based upon the presence of:
• Submerged or salt-burnt vegetation or green leafy plants in the inter tidal zone • Uplifted barnacles, mussels, seaweed, or any other subtidal/intertidal flora • Changes in tidal limits – new high tide marks • Cracks, liquefaction, tilting or warping in the ground, evidence of fault creep and direction of the
motion, landslides Measurements of estimated uplift based on these features have uncertainties of ± 0.5 m, but nevertheless they serve to define broad spatial variations in the magnitude of vertical deformation along a coastline. Aerial reconnaissance - extensive coastal surveys - can identify the presence of uplifted wave-cut platforms cut into bedrock. These platforms will be covered in dead intertidal marine organisms, and will be clearly visible from the air. Similarly, well documented/mapped coastal structures such as lighthouses may be uplifted and will provide more precise indications of uplift/subsidence. Tsunami deposits - onshore and offshore and erosion and geomorphological change Observe and detect the presence of boulders, sand, silt, gravel and/or mud sheets deposited by the tsunami in tidal wetlands, coastal lakes/lagoons, coastal plains, over and behind barrier beaches, in dune systems, and on man-made surfaces (e.g. roads, building foundations). Take photographs of the setting before disrupting it by trenching or coring. Dig trenches with the long axis parallel to flow direction. Trenches should extend below the tsunami deposit to allow characterization and sampling of the pre-tsunami sediment. Clean trench walls before photographing, describing, and sampling. Take trench samples with a spatula or a similar tool. Take photographs of trench walls after sampling to document where samples were taken. Take core samples either with a d-corer, piston corer, or other augering device. Take photographs of cores. If possible, a sampling regime should include numerous trenches and cores from landward to seaward sites along the pathway of inundation – this may be perpendicular to the shoreline, but equally may be sub-parallel to the coast. Prior to undertaking any sampling regime it is vital to determine the flow direction, assess the maximum extent of inundation, identify sediment sources and deposit thickness. Where possible both core and trench data should be collected in order to have a better understanding of vertical and horizontal continuity of the deposit. Samples of sediment sources for the deposit (underlying eroded sediment, beach sediment, shallow nearshore if possible, etc.) should be collected as well.

Teams should measure the thickness and horizontal extent of fine sediment deposits, and also the a, b, c axes and orientation of large clasts. Coarse sediment deposits such as boulders should have their distance from the shore and source area, and elevation above sea level measured. Equally, the transport mode for large clasts should be determined by identifying striations, chatter marks and the association between fine and coarse sediment deposits. All deposits should be surveyed and tied to mean sea level at the time of the survey or a suitable survey point that can be referenced to a sea level datum. Samples should be collected at as high a resolution sampling regime that is possible given the time available. Sediment cores, peels from trenches, high resolution photographs for subsequent grain size analyses, monoliths sampled from trench walls, or closely spaced vertical sampling at sub-cm intervals are some of the techniques recommended. It is vital to determine the nature of the tsunami as it came inland – eroding, creating a bypass zone, depositing, and then the relationship between the maximum inundation distance of the water compared with sediment and detritus. Detailed studies of the entire deposit are extremely valuable – not solely the sediments but also the nature of the lower contact – crushed vegetation, erosional etc. Elements of the deposit such as incorporated shells, wood, organic matter, anthropogenic material, all help to understand the nature of the erosion-entrainment-deposition process. The study of submarine deposits is in its infancy and there are considerable logistical difficulties associated with gathering data. Conditions may not permit safe sample collection and this decision is left to the team to decide. Collection by SCUBA and/or snorkel survey is the most appropriate since it involves low cost and relatively simple shore based work. At the very least, it is recommended that personnel have a high proficiency certificate in either SCUBA or snorkelling and also have relevant first aid facilities on-hand. The most likely scenario is that teams carrying out submarine work will be part of a later group of researchers to access the area once the initial emergency response has passed. Water clarity, tidal conditions, currents, debris in the water, etc.. all need to be considered. If possible a sonar/side scan survey should be carried out to determine the extent of submarine deposits prior to selective push core sampling. Maintaining the integrity of the sediment samples is vital and as such, the work should not be carried out without relevant underwater research expertise. If time permits, a fully gridded section of the deposit should be studied with a complete photographic survey of the area tied in to an appropriate benchmark on land. Where there has been deposition there may also have been associated erosion. It is vital to undertake a comprehensive study of both zones since these in essence comprise the full geological evidence for the tsunami. A study of eroded areas is both a study of the source area for much of the material deposited on land and a measure of the fluctuating energy regime within the tsunami itself since backwash erosion is often noted and will clearly contribute sediments to the submarine component of the deposit. This work should be carried out in conjunction with a study of the deposit and efforts should be made to associate zones of erosion with zones of deposition since these indicate the size of material that moved and over what distance inland and what elevation. Where possible a detailed topographic survey should be carried out of key areas where both zones of deposition and erosion are clearly defined, preferably with an onshore and offshore component. This will also serve to provide a detailed geomorphology of the area that can be compared and contrasted with earlier topographic information if available. The importance of a holistic study of features associated with the “deposit” cannot be overstated. Erosion and deposition are intimately connected and equally they in turn form a unique suite of geomorphological features that remain in the landscape to complement the geological evidence. All forms of data gathering should be undertaken, but it is vital to place the sedimentological and stratigraphic evidence in the context of the process environment. This requires detailed surveying by any available tools such as total stations, GPS, rod and level. These on-the-ground data can be compared with satellite or other remotely gathered data later to groundtruth a broader interpretation of the inundation area. Palaeotsunami deposits survey As part of the survey of the contemporary deposit it is reasonably simple to add on an initial study of possible palaeotsunami deposits. While the time available is unlikely to allow a comprehensive core and trench study, it
is a simple process to gather suitable core data through either D-corer or vibracoring coupled with a study of deeper trench records where a mechanical digger is available. The most reasonable locations for augering and coring work would be coastal wetland areas that allow for easy penetration of the ground surface. Trenches are unlikely to penetrate as deep as an augering/coring regime BUT they provide key data on the lateral continuity of suspected palaeotsunami deposits. In the field there are two different types of work that can be carried out depending upon whether data have been collected through auger/coring or trenching. For the former, other than ensuring that the appropriate site location and contextual data have been collected it is relatively simple to sample and store the extracted core material and return to the laboratory for later analysis. For trench work, any potential palaeotsunami deposit can be treated in a similar manner to the contemporary event but with a particular focus on attempting to establish a chronology for the event(s) in question. Treating the potential palaeotsunami deposit in a similar fashion to the contemporary event however, means that a substantial amount of time needs to be spent at a single site to process all of the information. Since this work would normally represent an addition to the study of the contemporary deposit there may be little time to do more than take a few preliminary samples. If time allows, then a more complete study can be carried out. If not, this preliminary work provides crucial location data for a return visit once funding permits. As an interim measure it is recommended that a simple “core” be taken from the side of the exposed trench. The current practice is to cut 50 cm lengths of plastic core pipe lengthwise and push it up against the trench wall. By cutting around the sides of the pipe with a trowel a vertical section of the trench wall is retained in the plastic pipe. This process can be continued from the top downwards to the base of the trench. In this manner one can retain an intact core sequence with contacts preserved and with a good understanding of the lateral continuity of the deposit(s) in relation to each other. Data quality and special considerations Fieldwork is carried out in teams and as such it is recommended that there are regular morning and evening group/sub-group discussions to not only plan the work that needs to be done but also to discuss what has been collected and how. Data sharing and cross-correlation between the work of individuals and teams should help to ensure that quality control is maintained and that data are reliable. There is NEVER enough time to complete all of the work, and there will ALWAYS be something that is forgotten or poorly recorded, this cannot be avoided, but it can be reduced by repeated data checking. IF time permits it is recommended that at least one site be resurveyed/resampled to provide a check on the data collected. One of the most significant issues in recent immediate post-tsunami research efforts has been the recognition that there tends to be a biasing towards recording only the maximum runup and inundation at any one site, or the thickest and most extensive deposits – these are valuable data but only cover a part of the story. If time permits, teams should make efforts to undertake more comprehensive surveys at each site visited. It is recommended that each geology team has a leader who has extensive experience in immediate post-tsunami surveys and an up-to-date understanding of the latest methods and techniques available for fieldwork. They should act to ensure consistency of data collection and provide quality control over the team’s (sub-team’s) work. References Chagué-Goff, C., Schneider, J-L., Goff, J., Dominey-Howes, D. & Strotz, L. (2011). Expanding the proxy toolkit to help identify past events – lessons from the 2004 Indian Ocean tsunami and 2009 South Pacific tsunami. Earth Science Reviews, 107, 107 – 122. Dawson, A. & Stewart, I. (2007). Tsunami deposits in the geological record. Sedimentary Geology, 200 (3/4), 314-327. Goff, J. & Dominey-Howes, D. (In press - to be published sometime in 2012). Tsunami. In: Shroder, J. Jr., James, L.A., Harden, C. and Clague, J., (Eds), Treatise on Geomorphology. Academic Press, San Diego, Ca, vol. 13.

Goff, J., Chagué-Goff, C., Nichol, S.L., Jaffe, B. & Dominey-Howes, D. (2012). Progress in palaeotsunami research. Sedimentary Geology, 243/244, 70-88. Morton, R.A., Goff, J. and Nichol, S. (2008) Hydrodynamic implications of textural trends in sand deposits of the 2004 tsunami in Sri Lanka. Sedimentary Geology, 207, 56-64. Richmond, B., Buckley, M., Etienne, S., Chague-Goff, C., Clark, K., Goff, J., Dominey-Howes, D. & Strotz, L. (2011). Deposits, flow characteristics, and landscape change resulting from the September 2009 South Pacific tsunami in the Samoan islands. Earth Science Reviews. 107, 38 – 51. Shiki, T., Tsujui, Y., Yamazaki, T., Minoura, K. (2008). Tsunamiites - Features and Implications, 1st Edition Elsevier Science, pp432.

Annex X - Eyewitnesses and Interviews Introduction and background All ITSTs will find the need to talk to people impacted by the tsunami. The nature of interview questions and techniques will depend upon the focus of the ITST and the purpose of the interview. There are three general types of interviews discussed here: 1) Interviews about the characteristics of the tsunami The most common type of interview is with eyewitnesses to confirm water height or inundation extent, number and timing of significant surges, ambient conditions (e.g., tidal stage, storm conditions etc), and localized impacts. These interviews are usually conducted by scientists and engineers participating in ITSTs studying water levels, tsunami deposits, damage, or geotechnical impacts and sights, sounds and changes of water conditions. These interviewers do not usually have training or experience in conducting surveys. All members of ITSTs should be aware of the general comments about communicating with people in the impacted area (Section 2.2). Availability of interview subjects will depend on who happens to be in the field area where the team is working. It is not possible to statistically sample survivors. See discussion under Special Considerations and Data Quality as to how to reduce bias. 2) Broader impacts Some ITSTs are interested in acquiring information on the broader impacts of the tsunami and vulnerability/resilience factors that may have exacerbated or reduced impacts. Examples include factors influencing evacuation, pre-event planning and preparedness, emergency response and/or recovery issues. The limited amount of time of an ITST does not usually lend itself to an exhaustive treatment of these issues, but may be able to identify important areas for more detailed investigations at a later date. ITSTs interested in these aspects of the tsunami should include an interdisciplinary group of researchers and talk to as broad as spectrum of people as possible including planners and emergency managers, teachers, business people, politicians, first responders, and members of the media in addition to the general public. 3) Personal recollections of the tsunami event for outreach and education Walter Dudley pioneered recording tsunami survivor accounts of the 1946 and 1960 tsunamis in Hawaii. The initial purpose of his project was to record accounts of aging survivors before they were lost and to give a human face to the tsunami experience and the interviews were conducted many years after the event. The project has been expanded to participation in ITSTs and to record these accounts in weeks to months after the tsunami event. More information on the field techniques and processing is included in the additional background section of this Annex and the references. Shorter accounts have been collected by other researchers (Atwater et al., 1999; Yulianto et al., 2010) to package into lessons for outreach. This Annex does not address detailed social science surveys of behavior as it is assumed they will be conducted by researchers with expertise in the conduct and analysis of such surveys. Field Methods During an ITST, it is usually not possible to sample respondents in a statistically significant way. For ITSTs gathering eyewitness accounts, the availability of interview subjects will depend upon who is in the field area where the ITST happens to be working. The section below addresses ways to avoid bias and to get the most accurate information from these interviews. The Host Country Co-ordination Committee may be able to assist groups in indentifying other potential interview subjects. Pre-ITST communication with the Co-ordination Committee will facilitate this process as long as the intent of ITST has been communicated in advance. Reports from and communication with earlier ITSTs can also aid in targeting people to talk to and avoid unnecessary duplication. It is important to re-iterate the points in Section 2.2: • Be aware of cultural issues • Always request permission before recording/videotaping an interview or taking photographs. •The process of recounting the event may be traumatic. It is essential to be patient and to respect the interviewee.

Be very sensitive to how you approach people. In many cases, survivors are quite willing to share their stories and will often come up to ITST groups working in the field on their own accord. The Host Country Co-ordination Committee can also give you advice on how best to communicate with survivors in the field. There are two interview templates at the end of this Annex. They may be adapted to the needs of the particular ITST. Translated versions of the selected questions should be made before the team arrives in the country. The translations should be reviewed by the Host Country Co-ordination Committee before use. It is very important to thoroughly discuss interview protocol with translators, particularly if they are not part of the ITST research group. We very strongly encourage anyone considering interviewing tsunami survivors who have no prior experience to review basic human geography and social science research methods texts on ‘interviewing participants’. These will provide many useful guides and tips on what to do, how to approach and work with interviewees. A very good basic text to start with is Minichiello et al., (2008) and Hay (2010). Data quality and special considerations Eyewitness perceptions of a tsunami event are rarely objective. Following the recommendations below will help to reduce bias and improve survey data quality.
1) If possible, talk to single individuals as opposed to groups. Groups tend to create a common story and may be influenced by dominant individuals and their stories could be affected by the dynamics among members of the group.
2) Template questions can be a useful guideline to begin an interview but sometimes the most interesting information will come out in discussions outside of a specific question. Don’t be impatient to quickly get through a set of questions, but allow respondents to contribute additional information.
3) Eyewitness estimates of time are often inaccurate.Sometimes there are time markers such as an aftershock that can be used to constraint times.
4) Having a respondent walk through what they did during the tsunami event (where they were, what they did) can also constrain the timing and may help to bring back details of the event.
5) Interview multiple eyewitnesses in an area if possible. The accounts of a single individual may not represent the event very accurately. But if multiple eyewitnesses, interviewed independently, have converging stories, they are more likely to be true.
6) Sometimes people will want to tell you what they think you want to hear. Avoid asking leading questions. Accounts may change as the interview progresses.
7) Ask respondents what the area looked like before the tsunami. This can often lead to identifying key structures or markers to help describe impacts. When appropriate, ask for photographs or other pre-event documentation of the setting.
Additional relevant background information Tsunami Survivor Interview Protocol - High-quality Video Interviews – by Walter Dudley. Interviews with tsunami survivors have now become a regular part of social science studies of tsunami events. More recently, the use of interviews as a way to collect data of value to physical scientists has also been recognized. Tsunami survivor stories also have great value for tsunami education. There is no messenger more credible for tsunami education than someone who has actually gone through the experience. Questionnaires and written accounts can be valuable for tsunami education and as an aid for social science studies and for integrating physical data acquired through field surveys, but they lack the emotive power of video recording the first-hand experiences told by tsunami survivors in their own words. Video interviewing of tsunami survivors is one of the most effective and efficient ways to gather physical and social science data and create compelling educational tools because they contain visual emotive elements not found in other media. This section describes interview techniques than can be followed by any ITST. It does not require the use of professional film crews.

Video Interview Techniques For over a decade the Pacific Tsunami Museum has sponsored the collection of video oral histories of tsunami survivors. The museum’s archives contain over 400 survivor interviews for 12 different tsunamis in the Pacific and India Oceans from 1923 to 2009. The current protocol is based upon a combination of scientific and pragmatic lessons. It is critical that the interview protocol be customized to recognize the local culture and customs and avoid offending local sensibilities, especially during a time of community stress and grieving. The progression from set questionnaires, to written accounts, to a combination of audio tapes and their transcription, and finally to video recordings and their transcription, is indicative of this learning process. The final videos are of excellent quality, having been recorded with sophisticated digital video equipment. The current model in use is a Sony HDR FX1 high-definition (1080i) digital video camera with a BeachTek DXA-FX audio adaptor to allow for XLR stereo microphone inputs. Protocol: Ideally a team of four people is used, though by combining roles, three people can successfully carry out the interviews. The team consists of a Project Director (PD), typically a scientist with interest and/or colleagues in the region, who serves as producer, camera operator, and sound/light technician. A Field Coordinator (FC) serves as production assistant and is chosen on the basis of previous experience in the region. The On-Site Facilitator (OSF) is typically a local resident, with expertise and/or sincere interest in tsunami preparedness, knowledge of the tsunami event(s) in question, fluency in local languages and the ability to translate interviews into English (if required). A Logistical Coordinator (LC) liaises between interviewees and team members. Normally the OSF serves as interviewer (after on-site coaching), although the role can also be carried out by either the FC or LC. For organizational purposes, the process of collecting video interviews is divided into three phases: pre-interview, interview, post-interview. Pre-interview Phase: The OSF contacts potential interviewees, explains the reason why the data are being collected and the interview process. This may involve intermediate steps, for example, in Samoa and American Samoa, immediately upon entering a village, the local chief or a respected elder was sought and our mission thoroughly explained. The chief or elder then assisted the OSF in selecting appropriate survivors to be interviewed. Among the factors the OSF considers in the selection of potential interviewees are:
• The individual’s personal experience during the tsunami event; • The ability to effectively communicate this experience; and • The lesson(s) that can be learned from the experience.
Care must also be taken in the selection of interviewees because of the emotional impact on survivors of reliving a painful experience through their interview, especially if it is soon after the event (Bird et al., 2011). Though often emotional, interviews usually prove to be cathartic for most interviewees. When possible, interviewees should also reflect a range of ages, sexes, and community positions. An appointment for the video interview is set up and a location chosen. Typically the location is one that makes the interviewee feel comfortable, but also needs to meet certain criteria to ensure the overall quality of the video product. The site should not be a high noise area and, where possible, should be away from all motor traffic noise. The OSF uses their judgment and local knowledge to select the initial interview site. It is often desirable to schedule time to meet with, and potentially arrange to interview, local leaders or other community members. A test interview is carried out by the entire crew and reviewed for all aspects of the process to include interview technique, camera work, lighting and sound. At this time the OSF is provided with a list of recommended interview questions that include queries designed to gather important physical and social science data, as well as deliver a powerful description of tsunami experience. If necessary, culturally appropriate behavior is discussed with the OSF once the mix of interviewees is known.

The LC ensures that all appropriate documentation is in order to record key personal information for each interviewee. Each individual (or guardian for minors) signs a release form that allows use of the recording for educational purposes. Where possible, the forms should be translated into the local language so that the interviewee understands fully what they are signing. The nature and extent of the questions to be asked are also discussed at this time either by the LC or OSF (Sample video questionnaire template). Prior to the interview, all forms (biographical, release) and the tape (and case) for each interviewee are assigned a unique Interview Code number consisting of a location abbreviation, the date of interview, and the interview number in the series for the particular assignment. Photos of the site and interviewee (full face) are taken either prior to, during, or after the interview, whichever is felt to be least intrusive. These actions help to minimize the likelihood of incorrect archiving in the future. Interview Phase: Tsunami survivor interviews must be recorded in a single video with no second takes. It has been suggested that interviewees might embellish their stories to make them more interesting or exciting. Our experience has been, that for nearly all the survivors interviewed, it was not the simple telling of a story but the reliving of the most traumatic experience of their lives, thereby putting them in a state in which invention or embellishment was highly unlikely. Interviewees are usually asked to begin their story with when they woke up on the day of the event and to describe the day and their activities prior to tsunami. The following are recommendations during the interview:
• Subjects must be allowed to recall and describe events without coaching; • Avoid interrupting their train of thought; • Avoid closed-questions, such as those that could be answered with a “yes” or “no”; and • Never lead the discussion. This can give the interviewee a sense of what the interviewer might be
“looking for” leading them to give the responses that they perceive are desired.
When the initial narrative is complete however, the interviewee may be gently prodded for additional information, overlooked details, and other useful information. Follow-up questions may be asked about the appearance, number, height, direction, and timing of waves. The final questions used to terminate each interview are: “What advice would you give to others about tsunami safety” or words to that effect, followed by “Is there anything you would like to add?” Ideally, interviews should be scheduled for a minimum of two hours. In practice however, interviews vary in length from as little as 15 minutes to over an hour, thereby often permitting the collection of three or four interviews in as little as two hours at the same site. Depending upon travel times between sites, location and availability of interviewees, a maximum of about six interviews can be accomplished in a full day. If an interviewee is willing and able, additional footage may be shot at sites meaningful to the story, otherwise background footage (B-roll) is shot separately. Upon arrival at the interview site it is important for the PD and FC to determine if it meets the criteria for sound, light and movement. Once a suitable site has been found with reasonable sound quality, it must be checked for appropriate lighting. The optimum time of day for recording is when the sun is low. For mid-day shooting, a partially shaded area should be selected. In these circumstances, the subject is placed in the shade with their face illuminated by reflected light without making them squint. It is important though to choose an area where nothing can move behind the subject. People or animals wandering around in the background are distracting to the viewer. The subject should always be comfortably seated so that they do not fidget, and on a seat that does not squeak. It is important to let the subject attach the microphone themselves, only providing assistance when asked, so as to do nothing offensive in the host culture. Nothing should actually touch the microphone however, such as a scarf or jewelry and this often requires assistance to ensure the interviewee understands. A lavaliere microphone attached at shirt collar level works best. Under windy conditions the interviewee is shielded from direct wind blowing over the microphone. A microphone windscreen is also used to further dampen wind noise. It also pays to check on regularly scheduled events in the area such as a soccer game or evening prayers, which may require adjusting the scheduled interview time to avoid intrusion of potential loud background noise.

Immediate Post-interview Phase: Following each interview our practice has been to have the OSF immediately provide a short written summary of the story in English. It is important to allow time for this process immediately after the interview. The immediate post-interview phase also offers the opportunity to arrange for the copying of any documentation of the tsunami provided by the interviewee (e.g. photos), and to accept and process any donated memorabilia. At the end of the day, the team meets to review the day’s interviews. Any necessary revisions or additions to the descriptive data that accompany the interview tapes are made immediately while the details are still fresh. An electronic summary interview document is set-up for each assignment. his is updated daily with each reference number assigned to the appropriate interviewee photograph, and brief biographical details. It is optimum to simultaneously record video and directly to a hard drive. This will produce a digital videotape and a hard drive backup copy of interviews, thereby eliminating the chore of making backup videotape copies during an expedition. Never place videotapes in checked airline baggage. Immediately following an ITST, all interview tapes are backed up and the back-up copies stored in separate, secure, climate-controlled locations. These DVDs are complete, unedited copies of the interview and contain the time code recorded on the original videotape. Transcription and Translation of Interviews Where translation is necessary the DVDs are sent to the OSF who carries out or supervises the transcription and translation of the interviews. The video time code must be entered at frequent intervals (two to five minute intervals) alongside the translated transcription of the interview in order to permit editing of the video. These transcriptions can then be easily converted into a video storyboard. A typical interview lasts between 20 and 40 minutes, although some extend up to two hours. All achieved interview transcripts are recorded in a searchable archive database keyed to specific tsunami events. Selected interviews may be edited to a three to four minute final product, which includes the most important lessons learned. Our practice has been to offer DVD copies of the interviews to the interviewee whenever feasible, typically in full-length form. Due to the different video standards used internationally (NTSC, PAL, SECAM), providing copies of interviews for commercial video players can be both an unexpectedly problematic and expensive component of any project, however the provision of videotape copies is often a necessary expense. References Atwater, Brian F., Marco Cisternas, Joanne Bourgeois, Walter C. Dudley, James W. Hendley II, and Peter
H.Stauffer (1999). Surviving a Tsunami—Lessons from Chile, Hawaii, and Japan, USGS Circular 1187, 20 pp, http://pubs.usgs.gov/circ/c1187/c1187.pdf
Bird, D., Chague-Goff, C. and Gero, A. (2011). Human response to extreme events: a review of three post-tsunami case studies. Australian Geographer, 42 (3), 225-239.
Dudley, Walter C., Min Lee (1998). Tsunami! University of Hawaii Press, 362 pp. Dudley, W., Goff, J., Chague-Goff, C., Johnston, J., 2009. Capturing the next generation of cultural memories
- video interviewing tsunami survivors, Science of Tsunami Hazards, 28:3, 154-170. Dudley, W., Johnston, J., and Preller, C. (2010). Tsunami Survivors Tell their Tales. Natural Hazards
Observer, XXXIV, #5, p1, 10-12. Dudley, W., Whitney, R., Faasisila, J., Fanolua, S., and Jowitt, A. (2011). Learning from the Victims: New
physical and social science information about tsunamis from victims of the September 29, 2009 event. Earth Science Reviews, 107: 201-206.
Faasisila, J., Jowitt, A, and Dudley, W. (2011). Surviving a Tsunami - Dealing with Disaster - Lessons from the Samoa Tsunami, 49 pages, Read Pacific Ltd, Alpine Printers, New Zealand.
Hay, I. (ed). Qualitative research methods in human geography. Third Edition, Oxford. Pp432. Minichiello, V., Aroni, R. and Hays, T. (eds). In-depth interviewing. Pearson. Pp342. Yulianto, Eko, Fauzi Kusmayanto, Nandang Supriyatna, and Mohammad Dirhamsyah, adapted by Brian F.
Atwater, Eko Yulianto, and Ardito M. Kodijat (2010). Where the First Wave Arrives in Minutes. Indonesian Lessons from Surviving Tsunamis Near Their Sources, UNESCO IOC Brochure 2010-4, 30 pp, http://itic.ioc-unesco.org/images/docs/where_the_first_wave_arrives_in_minutes_sml.pdf

Template 1 Template 1 – sample interview questions adapted from IOC UNESCO 2010 Chile tsunami ITST 1. Was a tsunami, tidal wave or other unusual water wave activity along nearby coastal areas noted by you or
anyone in your community near the date and time indicated on the opposite page? Yes No If No, please complete item 2 and return this form.
Date ____________ Time _______________ AM PM Standard Time Daylight 2. To be completed by person filling out this form Name _________________________________________________________________ Address ________________________________________________________________ City _____________________________ Country ____________________________ State _____________________________ Zip Code ___________________________ Tel _____________________________ Fax _____________________________ E-mail _____________________________ Profession, gender, age___________________________________________________________________ Where were you during the earthquake and the tsunami? (a hill, a house, a boat, etc.)________ Place name (town, village, colony, topographic) ______________________(locate on maps or air photos) TSUNAMI ALERT INFORMATION 3. Did you have knowledge/expectation that a tsunami would come? Yes No 4. If yes, but what do you know and how did you know it? ___________________ Did you have experience of or knowledge of previous events? ________________________________________ 5. Did you receive a tsunami alert, information bulletin, watch, or warning? Yes No 6. If yes, indicate type and at what time(s):
Alert ______ _______________ Bulletin ___ Watch ______ Warning ____
7. If yes, how did you learn of the alert, warning, bulletin, or watch? If more than one, please indicate order:
Siren Radio TV Civil Defense Fire Dept Police Telephone Internet Other (explain) ____________
8. What was your response to the alert, warning, bulletin or watch? If more than one, please indicate order:
Did nothing Evacuated Waited for further instructions Other (explain) ______________________________________________________
9. What was the response of different segments of the population (elderly, disable, minors and children, etc) ?
______________________________________________________________________________________ 10. How effective were response planning, operation, and evacuations?_______________________________ 11. Were there obstacles during the evacuation? __________________________________________________ 12. What preparedness actions had you taken well before the tsunami?______________________________ TSUNAMI WAVE OBSERVATIONS We are interested in documenting the sea water appearance before, during, and after the tsunami (boiling, foaming, etc.). Specifically, did the water receded or not before the first tsunami wave arrived?

Were there any sounds (noise) before or during the arrival of the tsunami and of what type? Were there tsunami-excited seiches in semi-enclosed bays, tsunami generated bore waves traveling up-rivers,
trapping, refraction or diffraction of tsunami waves around islands and edge waves along the continental shelf, coastal water piling due to intense hurricane or typhoon winds simultaneous to the arrival of the tsunami?
Were there any evidences and effects of tsunami-induced flows and currents (estimate magnitude and direction if possible). What was the situation before the tsunami? (meteorological conditions, sea-level, light conditions, sounds or noise, etc. ___________________________________________________________________________ 13. Did you see unusual waves? Yes No 14. If yes, indicate the location and type of water body where you observed the wave:
Open coast Bay Harbor Estuary Location _______________________________________________________________ 15. Indicate the direction the wave came from:
North South East West 16. Indicate the direction the wave went to:
North South East West 17. Indicated the slope of the shore where you observed the wave:
Level Gently sloping Steep Vertical 18. Were there any other natural phenomena at or near the time of the tsunami?
None Earthquake Landslide Volcanic activity Other (describe) _____________________________________________________
19. What was the water condition before the tsunami waves arrived?
Calm Ripples Swells Choppy Heavy surf Stormy 20. Describe any sounds at the time of arrival?
Drum Thunder Airplane Rain Car River Train No Sound Other ___________________
21. Did the water recede before the first tsunami wave arrived? Yes No 22. Indicate the nature of the tsunami wave(s):
Fast rising and falling tides Breaking waves (swell with white caps) Calm, slow flooding Like a river Wall (bore) Other _________________________________________________________________________________
23. Describe any sounds or noise, or other unusual happening before or during the tsunami wave arrival. _________________________________________________________________________________ 24. How many times did the water rise (How many waves were there)? ____________________________ Local time - from clocks, TV programmes, etc. _______________________________________________ How much time was there between the main earthquake shock and the tsunami wave arrival ____________ (Note that an aftershock may come between the main shock and the tsunami arrival time) Did the water completely withdraw and came back again? ___________________________________ Were there bores, eddies in rivers or bays, or changes in water color? What was the relative size of the waves? (which one was largest, etc.)? _________________________

Please give times and heights of the waves at your location: Time Heights (feet or meters) Location and Observation First wave: ____________________________________________________________ Second wave: _________________________________________________________ Third wave: __________________________________________________________ Fourth wave:_________________________________________________________ Fifth wave:____________________________________________________________ Other waves:__________________________________________________________ 25. How far inland did the water travel from high-tide shoreline at your location?
A few feet (up to few m) Up to 165 feet (50 m) Up to 330 feet (100 m) Up to 80 feet (25 m) Up to 245 feet (75 m) More than 330 feet (100 m)
Please provide additional descriptions. Location and Description _________________________________________________ _______________________________________________________________________ TSUNAMI IMPACT AND DAMAGE 26. Describe the types of tree damage observed (if any):
Small limbs broken Tree less than 2” diameter broken (5 cm) Trees from 2” to 8” diameter broken (5-20 cm) Trees greater than 8” diameter broken (20 cm) Trees uprooted Total destruction of vegetation
27. Describe effects on other types of vegetation: _______________________________________________________________________ 28. Did the water move debris inland (seaward) form the shoreline?
Inland: Yes No; Seaward: Yes No 29. If yes, identify large rocks, significant debris, houses, ships, etc moved by the tsunami (and where they
were before). 30. Make a drawing if necessary. 31. Indicate the predominant type of debris, how far inland (or seaward) beyond the high (low) tide shoreline
the debris was moved, and the slope of the shore (i.e. level, gentle, steep): Slope Distance
Sand _______________ ___________________________ Driftwood _______________ ___________________________ Rocks to cobble size _______________ ___________________________ Boulders _______________ ___________________________ Other (describe) ______ _______________ ___________________________
32. Were there any permanent changes in sea level after the tsunami? Yes No What were the changes in the land surface caused by the tsunami? Places where there was erosion? Places where it left sediment (deposits)? What did it look like before the tsunami? Location ____________________________________________________________ Description _________________________________________________________ 33. Was there damage to boats of different sizes?
34. What percentage of boats were damaged in the harbour?
None Few (about 5%) Many (about 50%) Most (about 75%)

35. List types of damage (moorings, types of boats) and describe how they were damaged, such as by waves, strong currents, debris (boats, pirogues).
Location ____________________________________________________________ Description _________________________________________________________ STRUCTURAL DAMAGE 36. What percentage of buildings or structures were damaged by the wave in your locality?
None Few (about 5%) Many (about 50%) Most (about 75%) 37. Check the approximate age of the majority of damaged buildings or structures:
Built before 1945 Built between 1945 and 1965 Built between 1965 and 1980 Built between 1980 and 1990 Built between 1990 and 2000 Built after 2000
38. Check the types of buildings or structures, the type of construction (wood, stone, brick, cinderblock, metal,
reinforced concrete, etc), the type of foundation (pilings, cinder block, poured concrete, etc.), and the overall extent of damage
(1-Slight, 2-Moderate, 3-Severe, 4-Total): Type: Type of construction: Foundation: Damage: High-rise building ___________ ______________ 1 2 3 4 Low-rise building____________ ______________ 1 2 3 4 Split-level houses____________ ______________ 1 2 3 4 Single-level houses __________ ______________ 1 2 3 4 Breakwaters ______________ ______________ 1 2 3 4 Piers ______________ ______________ 1 2 3 4 Docks ______________ ______________ 1 2 3 4 Wharfs ______________ ______________ 1 2 3 4 Light houses ______________ ______________ 1 2 3 4 Bridges ______________ ______________ 1 2 3 4 Overpasses ______________ ______________ 1 2 3 4 Dams ______________ ______________ 1 2 3 4 Railroad tracks ______________ ______________ 1 2 3 4 Roads ______________ ______________ 1 2 3 4 Other ______________ ______________ 1 2 3 4 Describe _______________________________________________________________ 39. Describe the predominant type of ground under the majority of damaged buildings or structures:
Sandy soil Marshy Fill Hard rock Clay soil Shale Don’t know
40. Was the slope of the ground under these buildings or structures:
Level Gently sloping Steep 41. How far away from the shoreline were the buildings or structures that were damaged?
At the shoreline Less than 165 feet (50 m) Between 165-330 feet (50-100 m) Between 330-660 feet (100-200 m) More than 660 feet (200 m)
42. Do you know of any injuries or fatalities associated with the wave? Yes No If yes, how many injuries? ____________ Fatalities? _________________ Circumstances? ___________________________________________________ FOR THOSE WHO WERE IN BOATS OR AT THE BEACH
43. Where were you before, during and after the event? Please describe________________________________________________________________________ 44. What did the sea surface look like? (e.g., boiling, shaking, foaming ripples or waves) Please describe__________________________________________________________________________________ 45. Was there damage to the ship/boat? Yes No Please describe ________________________________________________________ 46. Did you notice any other phenomena? (e.g., fish behavior, light,
etc.)___________________________________________________________________________________________________
FOR OLDER PERSONS 47. Have you experienced any other tsunamis like this one in your lifetime, at this same or another place? When? Where? Please describe such events._____________________________________________________________ _________________________________________________________________________________ 48. Did your parents/grandparents experience any such events? When? Where? Please give a brief description___________________________________________________________ 49. Do you know of stories or legends of such events that have been handed down? Please describe. ________________________________________________________________________________________ Thank you for taking the time to fill out this information questionnaire.

Template 2 Adapted from the 2009 Samoa ITST Tsunami survivor/disaster awareness research survey Research Survey Instrument – Adapted from the 2009 Samoa ITST Name of Community_________________________________ Name of Household______________________________ Name of person interviewed_______________________ Age____ Gender____ The following questions should help us to better understand tsunamis. Please help us in that by given your experience with the recent tsunami as best as you can remember. 1. Where were you when you felt the earthquake? Inside own house Inside other people’s house Inside school Inside other: Outside own house Outside other people’s house On the street Outside other: 2. What did you do after you felt the earthquake? I continued with what I was doing I rushed out of the house to see what was happening I rushed out of the house to get myself to safety Other 3. When were you first aware of the tsunami? When I saw the water receding When I heard the water coming When someone warned me When I saw the water coming Other 4. How soon after the earthquake did you notice the tsunami? Immediately, i.e. I felt the earthquake and then the tsunami came straight away Less than 5 minutes after the earthquake Between 5 – 10 minutes after the earthquake More than 10 minutes after the earthquake I really don’t know 5. How many waves did you experience? Only one wave More than three waves Two waves I really don’t know Three waves More than three waves – estimate how many ____________ 6. Which wave was the largest?_____________ 7. How much time was there between the waves? ________________ 8. From what direction did the water come and where did it go to? 9. When and how did you start to evacuate from the tsunami?

Evacuated _______ minutes before the tsunami arrival Evacuated just after seeing the tsunami coming Did not evacuate, but stayed in the house Did not evacuate, but stayed outside 10. How did you evacuate? Went on foot Drove a car Other __________________ 11. Were you caught in the tsunami water? Yes outside Yes in the house No, I was in a safe place 12. How could you escape from the tsunami? I was able to swim I held to floating materials I could climb onto house / tree Other reasons 13. What did you know about tsunamis before the tsunami? Nothing, I never before had heard anything about tsunamis I had heard about tsunamis before, but was not sure what it is exactly I knew something about tsunamis, but I was not sure what to do I knew enough about tsunamis to know what to do 14. How much is your home affected by the tsunami Home not affected by tsunami Home partly damaged, still living there Home partly damaged, moved out to Home fully damaged, moved out to 15. How were people of your household affected by the tsunami? People from household died in the tsunami People from household got injured People from household are still missing Additional questions you may wish to consider including either before or after asking the above questions: 1. How are you after the tsunami? What are your worries and concerns? 2. What are your needs now? 3. How do you see these needs being met? 4. What help have you received? 5. What were your sources of income before the tsunami? 6. How has this been affected? 7. Are you planning on rebuilding your homes and where?

Annex XI - Socio-economic Data Collection Introduction Researchers interested in people and their associated socio-economic systems, will be keen to identify, describe and explain the nuanced socio-economic and political processes affecting impacted communities and the things those communities value. Further, they will want to quantify and explain the socio-economic impacts of the tsunami. An understanding of such processes and impacts can help to identify why the human system impacts are as bad (or not) in a particular place, what factors were at work to influence resilience and adaptive capacity and what the underlying root causes of vulnerability were. Such knowledge is a fundamental requisite for quantifying the impacts so appropriate levels of compensation (i.e., a ‘needs assessment’) can be organized and delivered to affected communities and for assisting in the design of new disaster risk reduction policies and plans for the future. In reality, experts from many discipline fields including, but not limited to, human geography, sociology, economics, planning, policy and decision-making, risk and emergency management, anthropology, human health, political sciences, Indigenous studies, history, religious studies etc, may have interest in contributing to socio-economic aspects of an ITST. Their insights will all help to shed light on the effects of tsunamis on people and their communities and why, and how the event was experienced by survivors. It is also important for them to identify pre-existing cultural, economic, or geographic that influenced resiliency and vulnerability. List of equipment This Guide does not provide any specific advice about equipment that would be relevant for socio-economic and human sciences researchers. As a minimum however, notebooks, pens, laptops and voice recorders will all be useful. Of note, it is worth remembering that field teams will be working in post-disaster contexts where for example, power cannot be guaranteed. As such, any specific equipment taken that requires power (mains electricity or battery) should be entirely self-sufficient. Carry additional batteries yourself and assume mains power will not be available. Field Methods This Guide recognizes that in addition to ITSTs, other major post-tsunami disaster assessment teams will very likely be working in the affected regions. Such teams will also comprise human and socio-economic researchers under the guise of host government agencies and/or international organizations such as the World Bank, Asian Development Bank, the UNDP etc. This Guide strongly encourages that ITSTs should wherever possible, work collaboratively with such teams to avoid duplication of efforts and to find opportunities to pursue additional avenues of human and socio-economic research that takes account of the expertise of ITST members. Given the variety of expertise that might be included under the banner of ‘socio-economic’ systems analysis, this Guide cannot be sufficiently prescriptive in terms of providing guidance on field methods. Appropriately qualified experts will know the best tools and methods to use in the field. The Guide does recommend however, where a team of socio-economic experts (of any discipline fields) come together in the field, pre-arrival discussions about which research questions and consequently, which methods, frameworks and approaches and tools are most appropriate to use, should occur. This will help to facilitate a dialogue and mutual understanding of the task ahead and the range of possible approaches to field based study and analysis. It is likely that researchers focusing on the socio-economic aspects of the tsunami will spend much of their field time talking with survivors, officials, and other persons in the affected area. Annex X provides additional information on considerations and techniques for field interviews. Exiting research methods and tools Having indicated that this Guide cannot be prescriptive in relation to the tools and methods to be used, it does recognize, established and widely used ‘Damage, Loss and Needs Assessment’ tools. For example, the Global Facility for Disaster Reduction and Recovery (GFDRR) has the Damage and Loss Assessment Methodology

and Post Disaster Needs Assessment tools (see http://gfdrr.org/gfdrr/node/69). Such tools (though not exclusively) are hugely relevant for undertaking socio-economic impact assessments. However, such tools and methods will not meet the needs of health experts or Indigenous researchers or other subfields of human, social and economic studies. As such, experts will need to adopt and utilize relevant methods and tools developed and used within their areas of expertise. Data quality and special considerations This Guide recognises that for meaningful data analyses within the socio-economic disciplines to occur, establishing a pre-tsunami baseline about conditions and context will be important. Once collected, such baseline data will be useful for enabling an analysis and mapping of the effects of the event. Additional relevant background information The 1990s were significant because they were designated by the United Nations as the International Decade for Natural Disaster Reduction. Of particular importance, by the end of 1999, the United Nations via the UNISDR had shifted its emphasis in research and language from a more western, scientific paradigm of physical and engineering sciences as providing all relevant answers to hazards and disasters, to a more sophisticated recognition that disasters are a social construct. Furthermore, the explicit recognition that disasters are social constructions and the ongoing failings of detection, monitoring and early warning systems coupled with increasing human, infrastructure and economic losses, meant that a shift towards understanding the human system (in all its many parts) context of disasters was as important as understanding the physical earth system processes of the hazard event itself. It is in the recognition of this shift that this Guide encourages researchers with expertise in socio-economic systems to consider contributing to ITSTs in a more concerted way than has traditionally been the case. The UNESCO-IOC ITST Samoa working in September – October 2009 was the first ITST to have a significant socio-economic team. That team published a useful paper describing their experience and approach to undertaking socio-economic work as part of a larger multidisciplinary ITST and outlined many of the challenges of working within the tight timeframe of an ITST. Potential ITST participants are encouraged to read van Zijll de Jong et al., (2011) prior to going in to the field. References van Zijll de Jong, S., Dominey-Howes, D., Roman, C., Calgaro, E., Gero, A., Veland, S., Bird, D., Muliaina, T., Tuiloma-Sua, D., & Afioga, T. (2011). Process, practice and priorities – reflections on, and suggestions for, undertaking sensitive social reconnaissance research as part of an (UNESCO-IOC) International Tsunami Survey Team. Earth Science Reviews, 107, 174 – 192. Templates This Guide provides no specific templates for collecting socio-economic and human systems data. Researchers intending to undertake such work should negotiate with others in advance and provide copies (ideally circulated electronically before hand) to team members for modification, approval and adoption. Here the Guide lists those types of data that can be collected in relation to the socio-economic system. It is not exhaustive but indicative of the types of data governments, communities and Disaster Management Offices are interested in gathering to understand the impacts of a tsunami. They include:
o Number of human deaths and the causes of those deaths and survivor numbers o Casualty and injury figures and types of injury o Number of homeless and displaced people o Emergency shelter requirements o Food, water, sanitation and medicine requirements o Damage to and loss of households, household goods and types o Damage to and loss of agriculture equipment, seeds and stock and animals

o Impacts on life line services, communication and transport systems and critical infrastructure o Loss of jobs and businesses and business interruption o Micro and macroeconomic effects o Experience of survivors of the emergency management procedures and their successes and
failings o Human behaviour, knowledge and experience including decision making processes during the
event o Time line of official events (transcript) from the regional/local/national disaster management
office o Media analysis of what went on from the local, regional, national perspective o Local/regional/national socio-economic and demographic data to compare disaster effects
against (e.g., male/female/children casualty statistics against averages) etc o GIS and other national/regional/local database statistics o Impacts on Indigenous peoples o Impacts on minorities, women and children