Tunç O. Aydın - CNRvcg.isti.cnr.it/Publications/2011/BAADEGMM11/talk7_quality_metrics.pdf ·...
48
Transcript of Tunç O. Aydın - CNRvcg.isti.cnr.it/Publications/2011/BAADEGMM11/talk7_quality_metrics.pdf ·...
Problem Definition
Rate
the
Quality
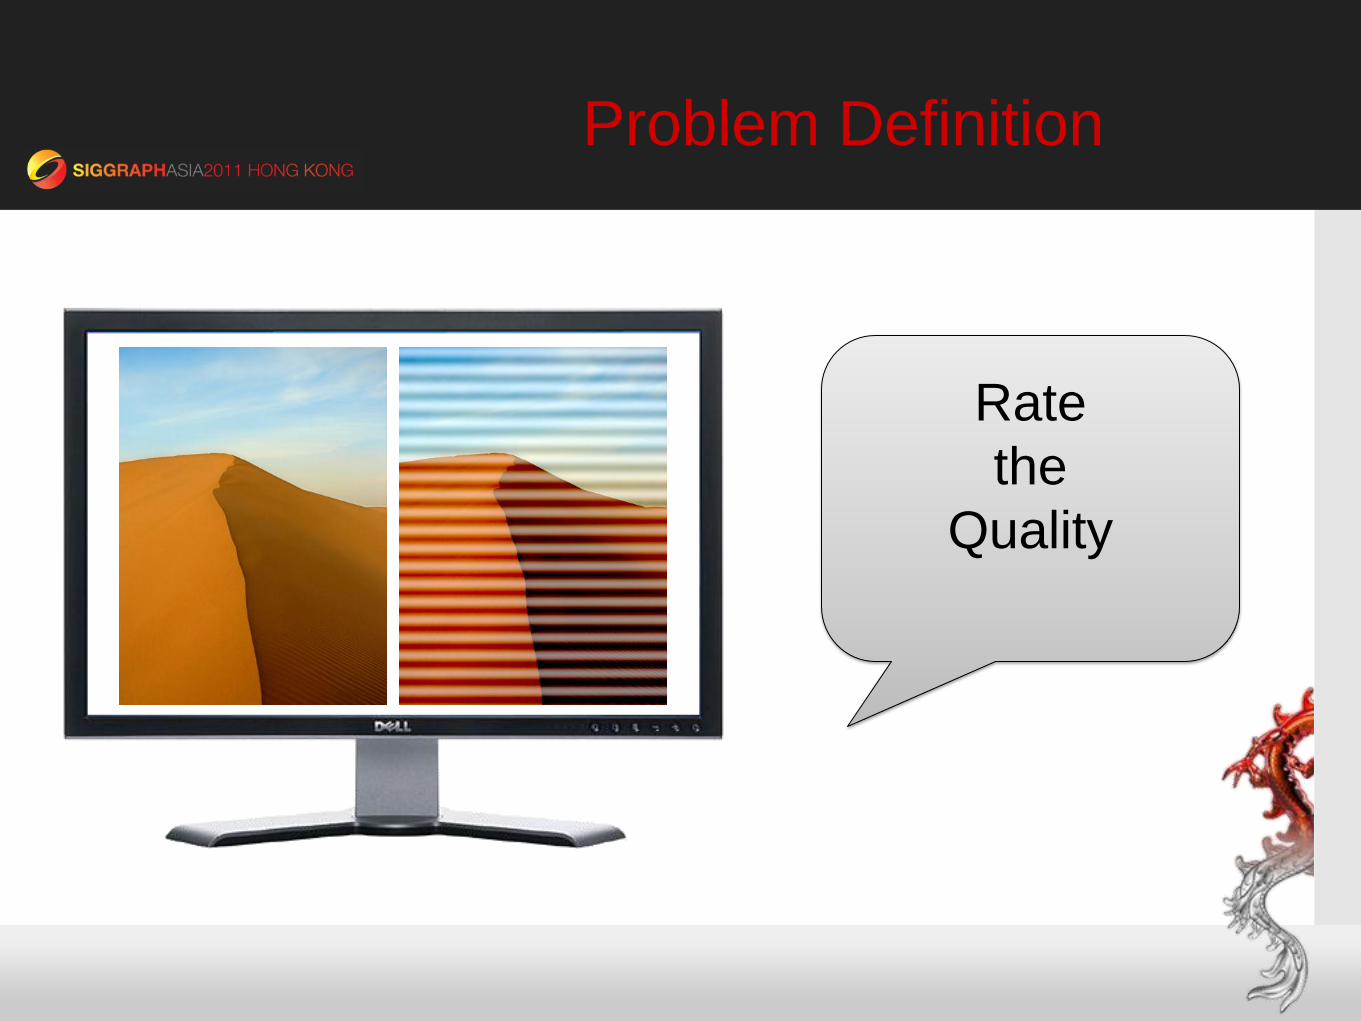
Subjective Quality Assessment
+ Reliable - High cost
Refer to: [James Ferwerda, Psychophysics 101: How to Run Perception Experiments in Computer Graphics, SIGGRAPH 2008].
Scaling Detection Discrimination
Figures taken from [Ferwerda 2008]
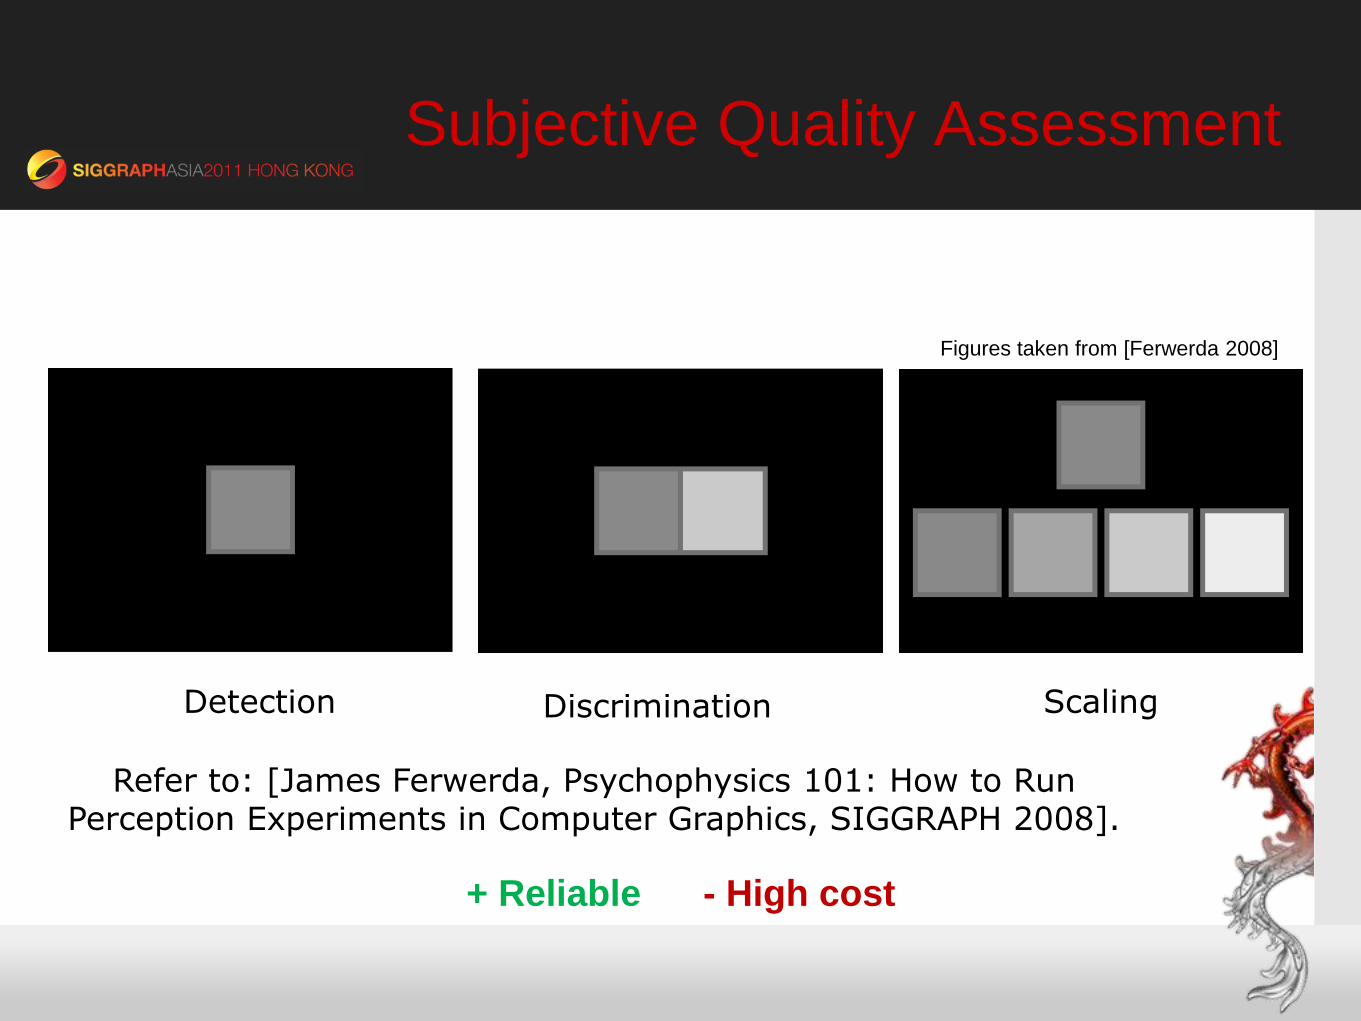
Objective Quality Assessment
Full Reference No Reference Reduced Reference
Refer to: [Wang & Bovik, Modern Image Quality Assessment, 2008].
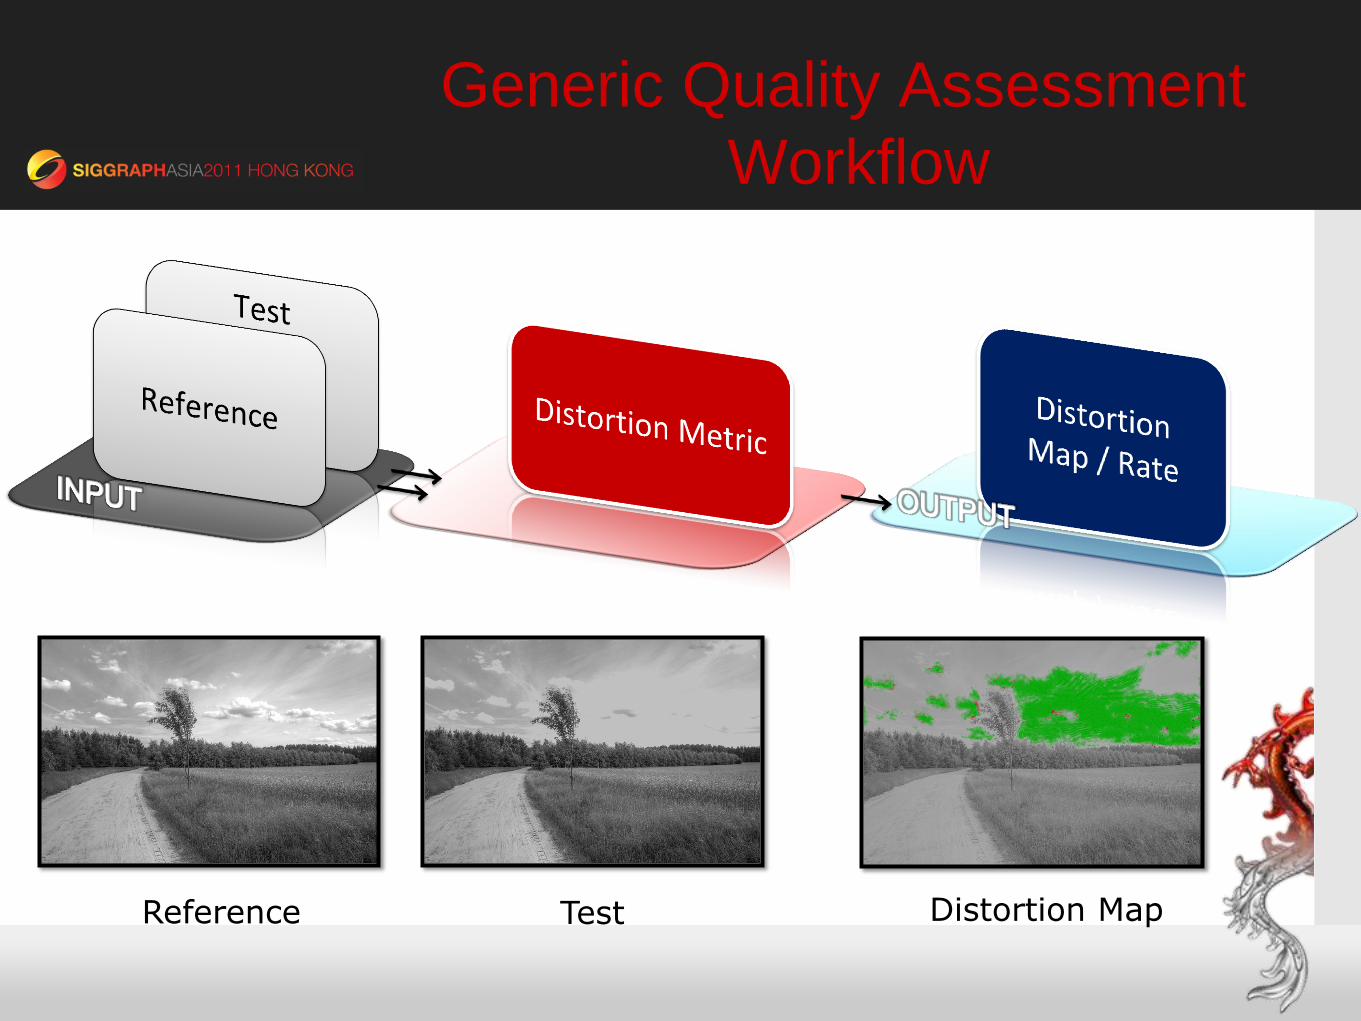
Generic Quality Assessment
Workflow
Distortion Map Reference Test
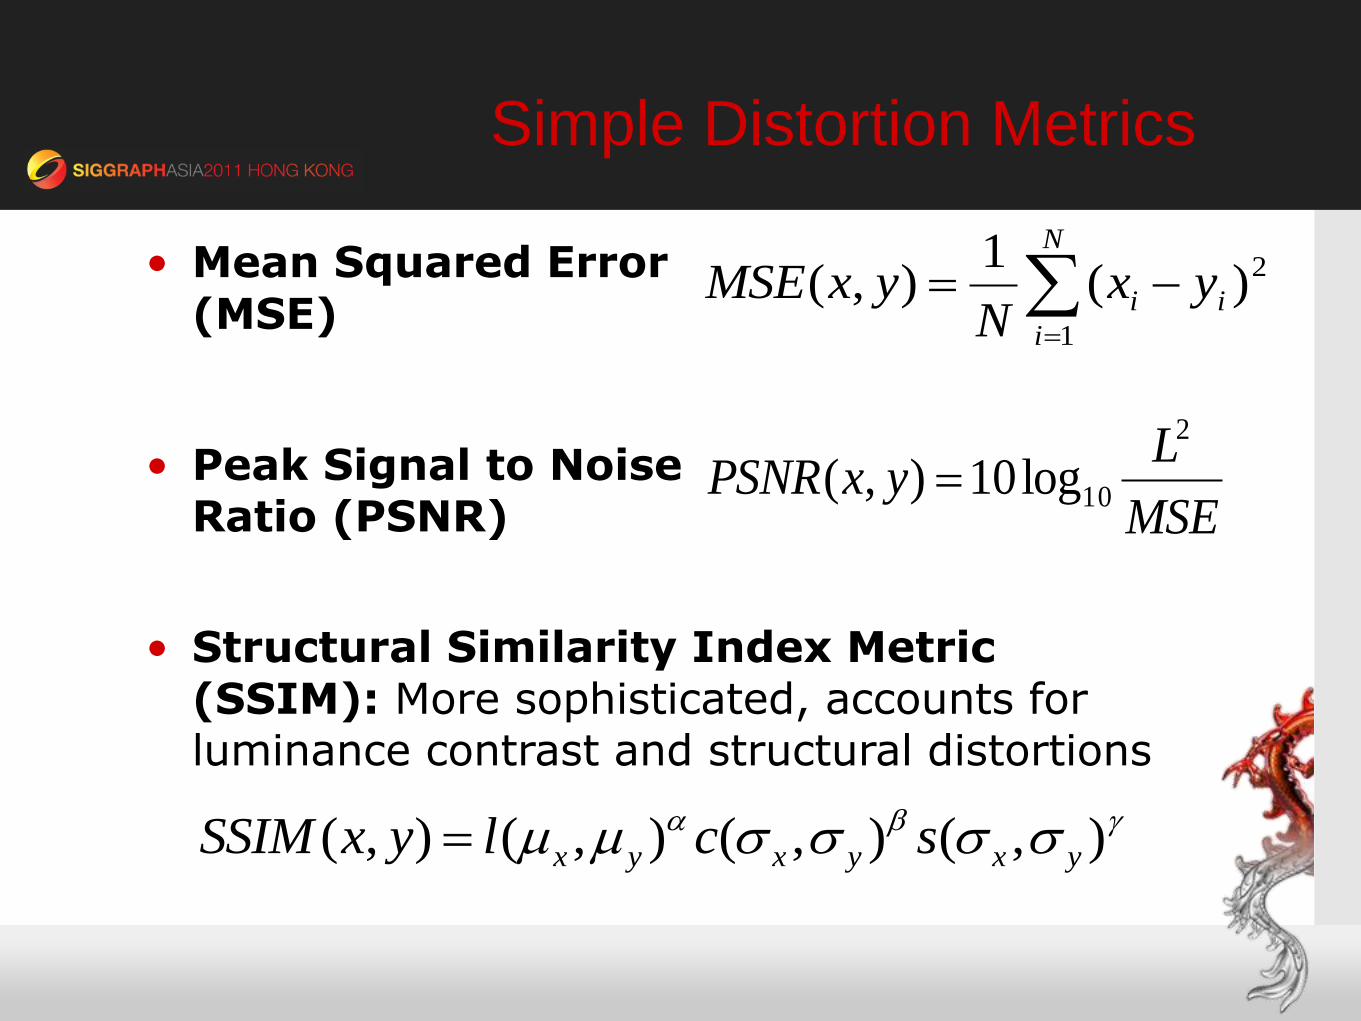
Simple Distortion Metrics
• Mean Squared Error (MSE)
• Peak Signal to Noise Ratio (PSNR)
2
1
)(1
),(
N
i
ii yxN
yxMSE
MSE
LyxPSNR
2
10log10),(
• Structural Similarity Index Metric (SSIM): More sophisticated, accounts for luminance contrast and structural distortions
),(),(),(),( yxyxyx sclyxSSIM
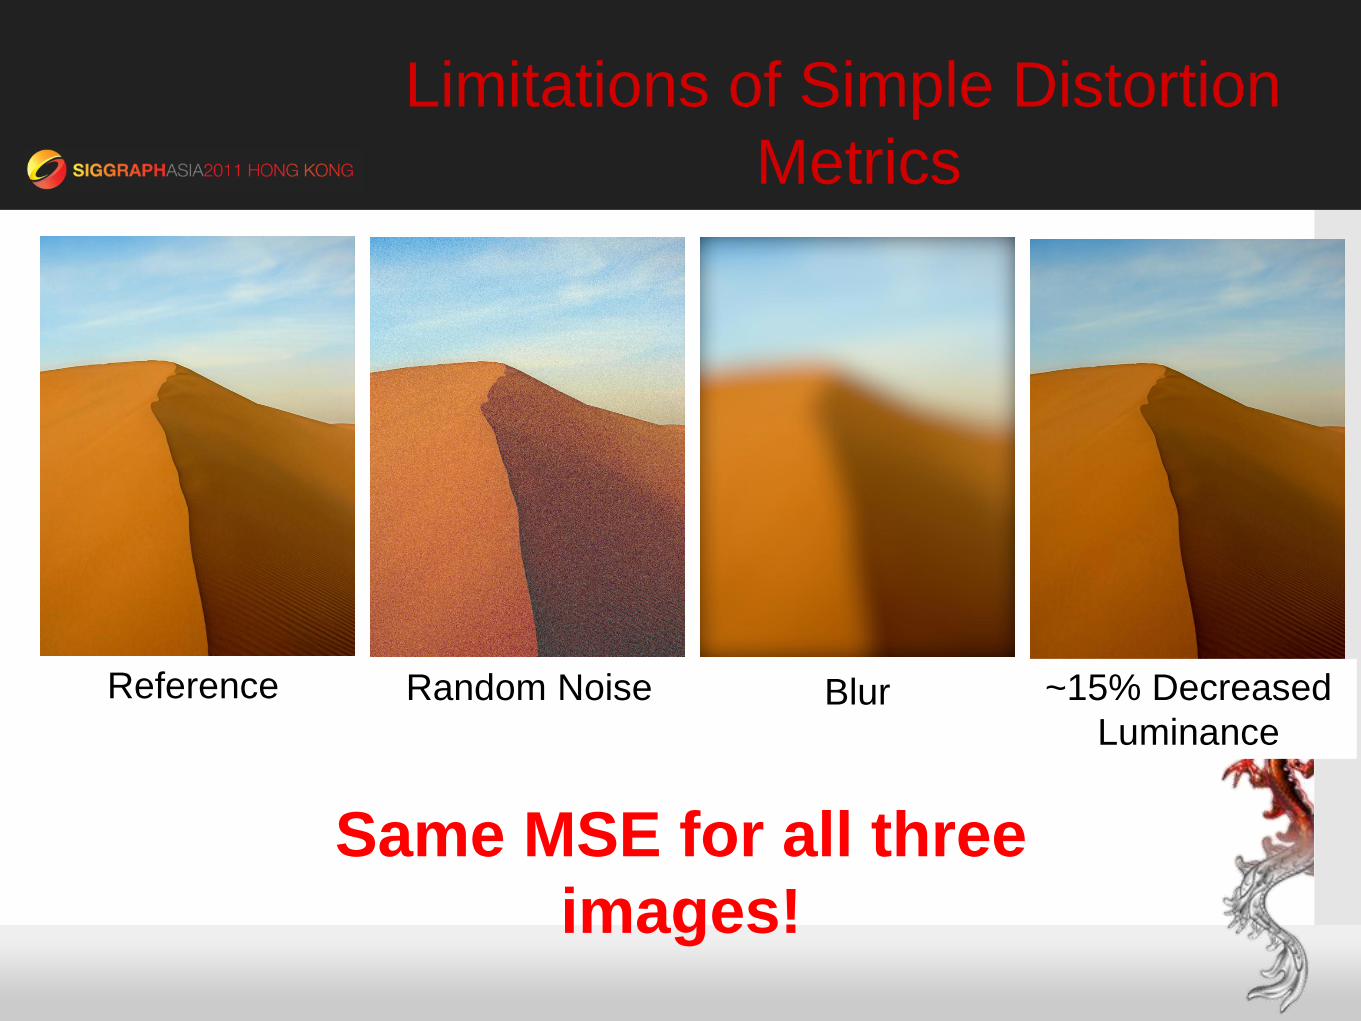
Limitations of Simple Distortion
Metrics
Same MSE for all three
images!
Random Noise Blur ~15% Decreased
Luminance
Reference
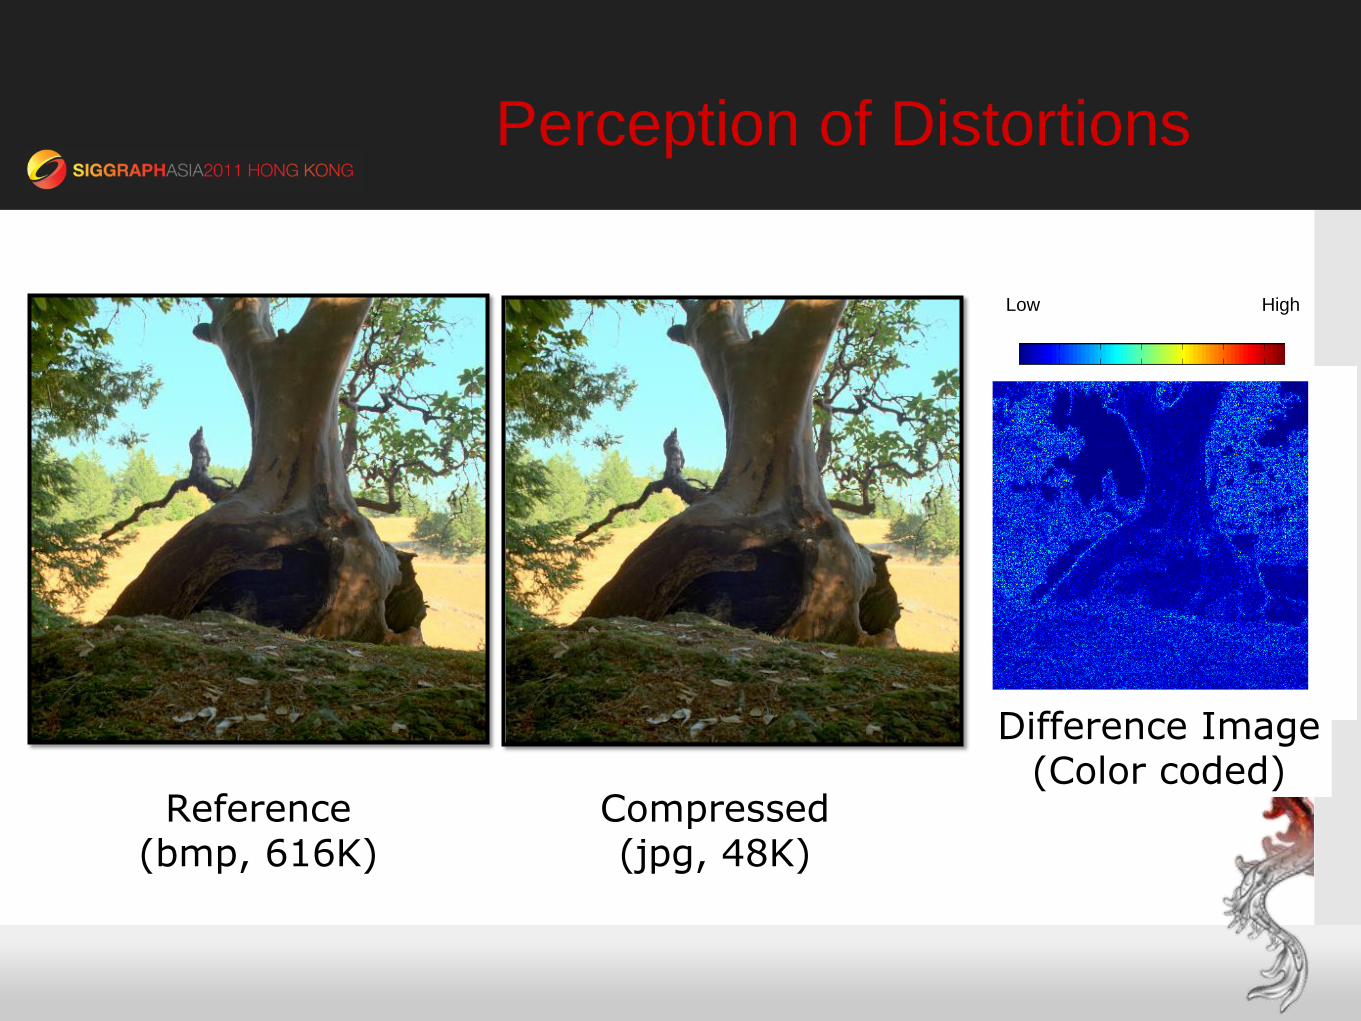
Perception of Distortions
High Low
Difference Image (Color coded)
Reference (bmp, 616K)
Compressed (jpg, 48K)
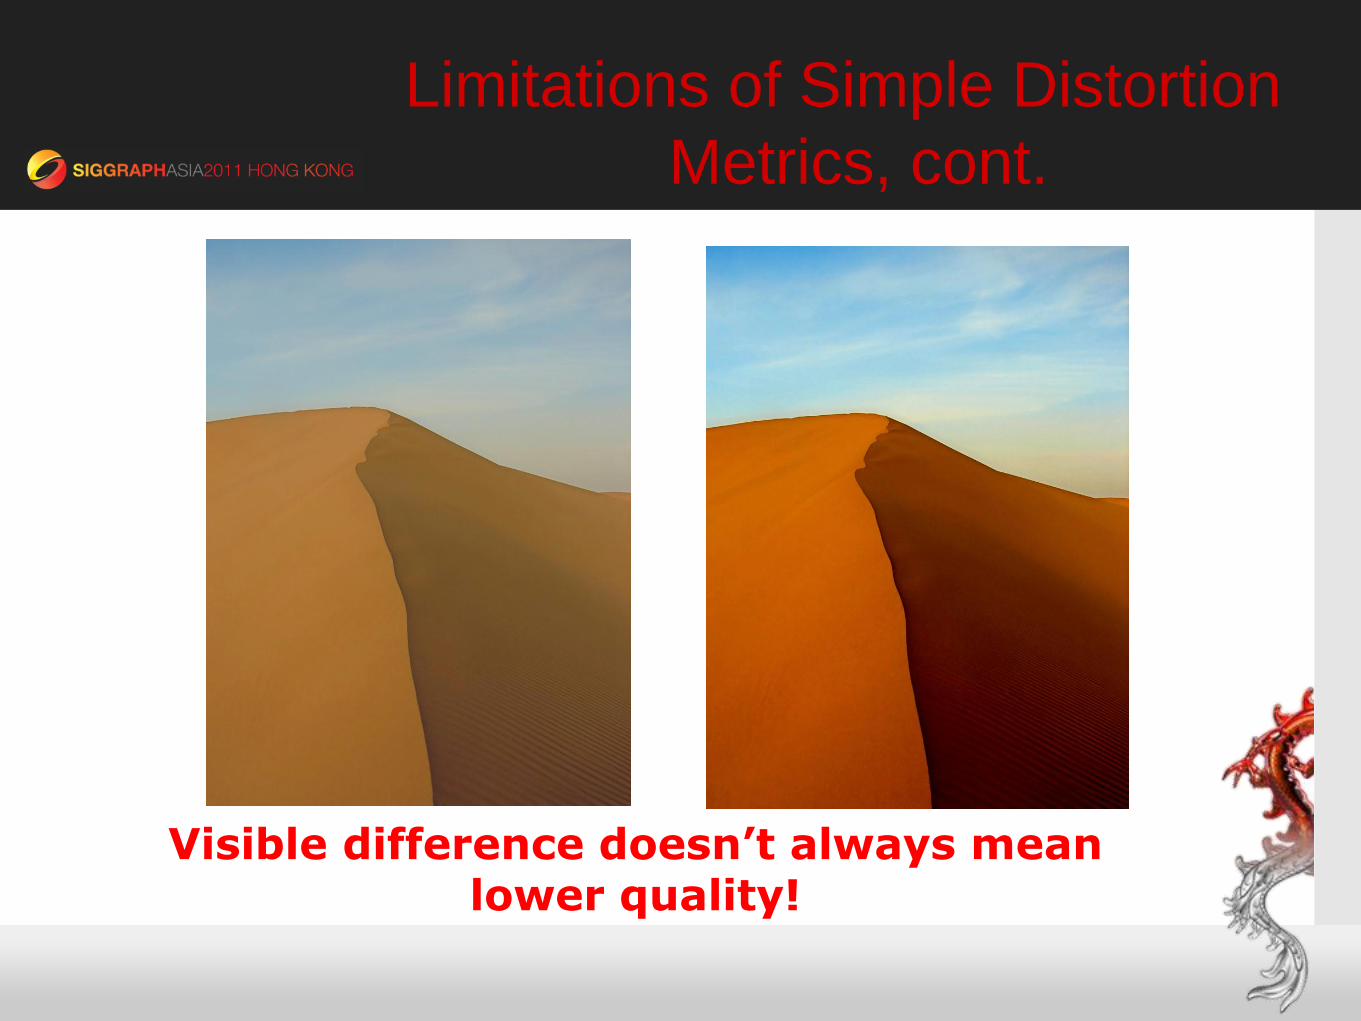
Limitations of Simple Distortion
Metrics, cont.
Visible difference doesn’t always mean lower quality!

The Human Visual System
(HVS)
• Experimental Methods of Vision
Science
• Micro-electrode
• Radioactive Marker
• Vivisection
• Psychophysical Experimentation
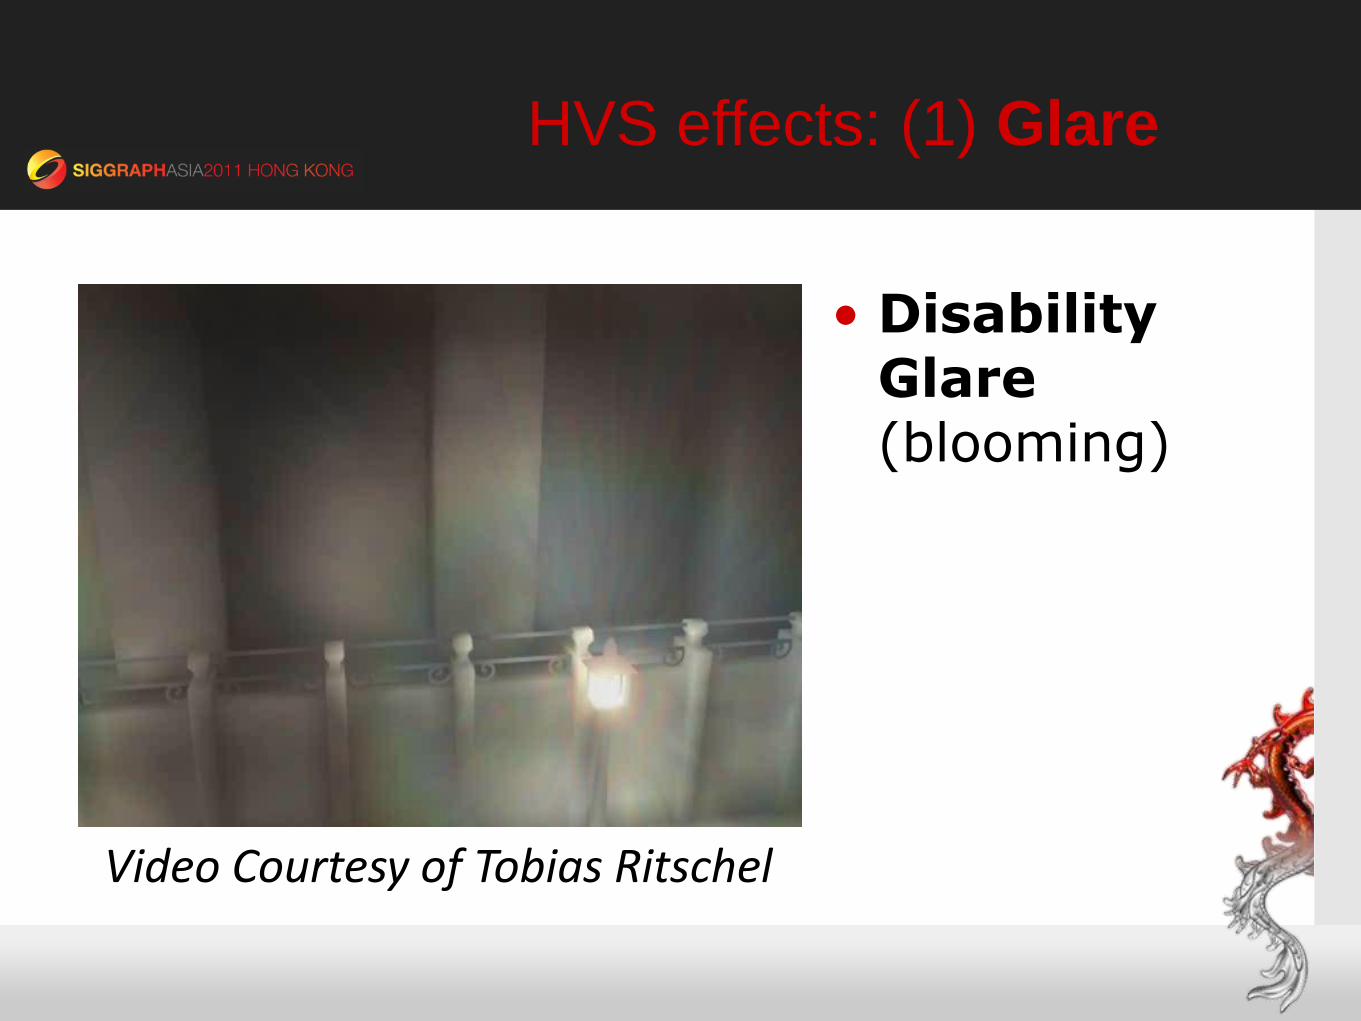
HVS effects: (1) Glare
Video Courtesy of Tobias Ritschel
• Disability Glare (blooming)
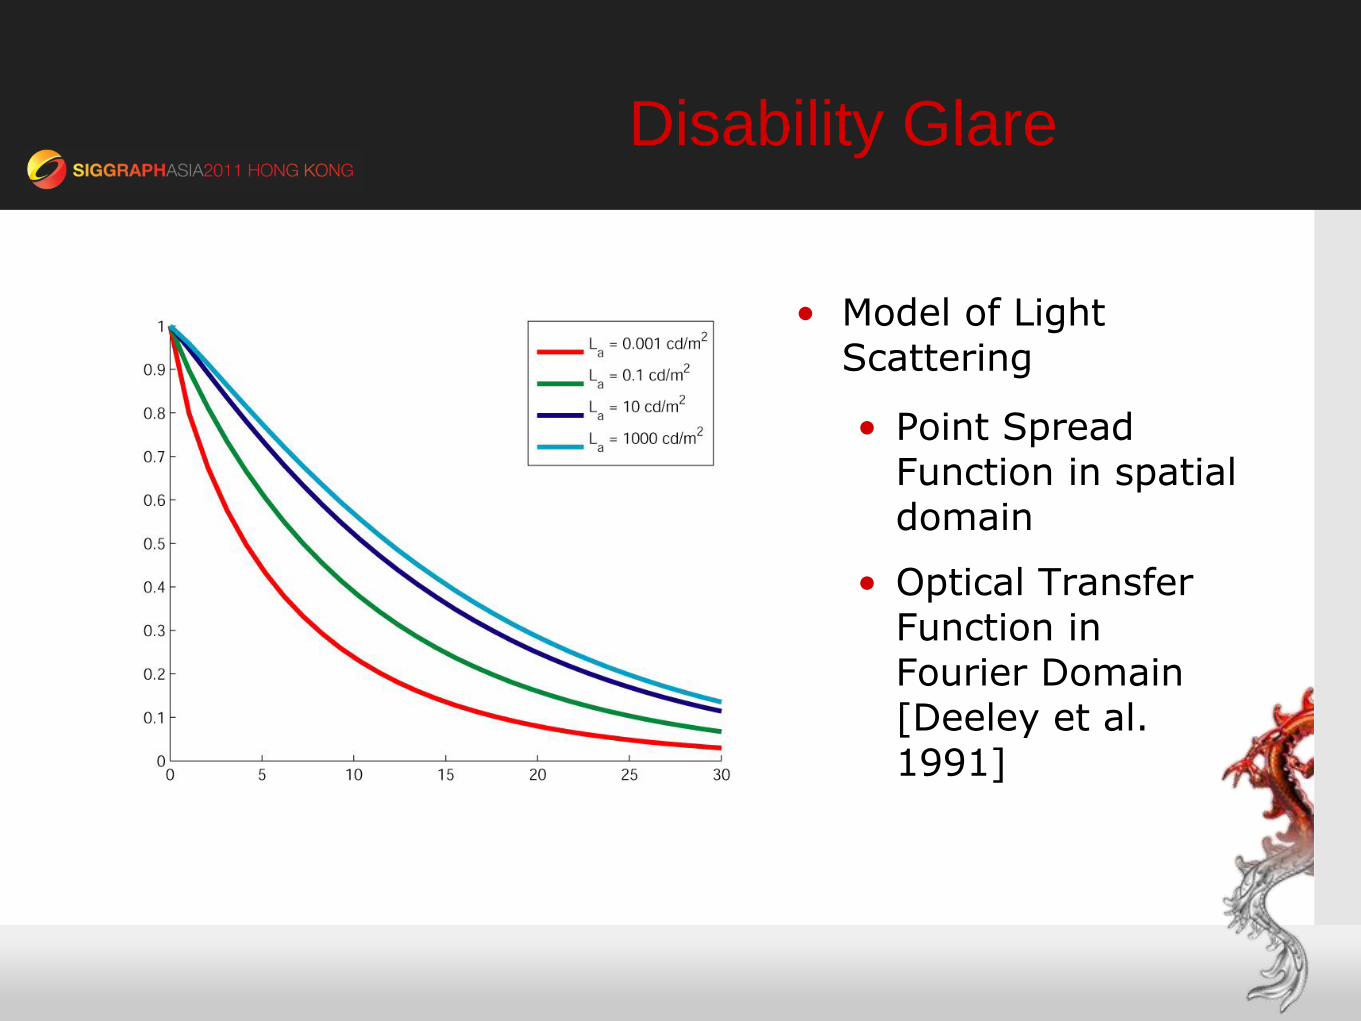
Disability Glare
• Model of Light Scattering
• Point Spread
Function in spatial domain
• Optical Transfer Function in Fourier Domain [Deeley et al. 1991]

(2) Light Adaptation
Time Adaptation Level:
10-4 cd/m2 Adaptation Level:
17 cd/m2
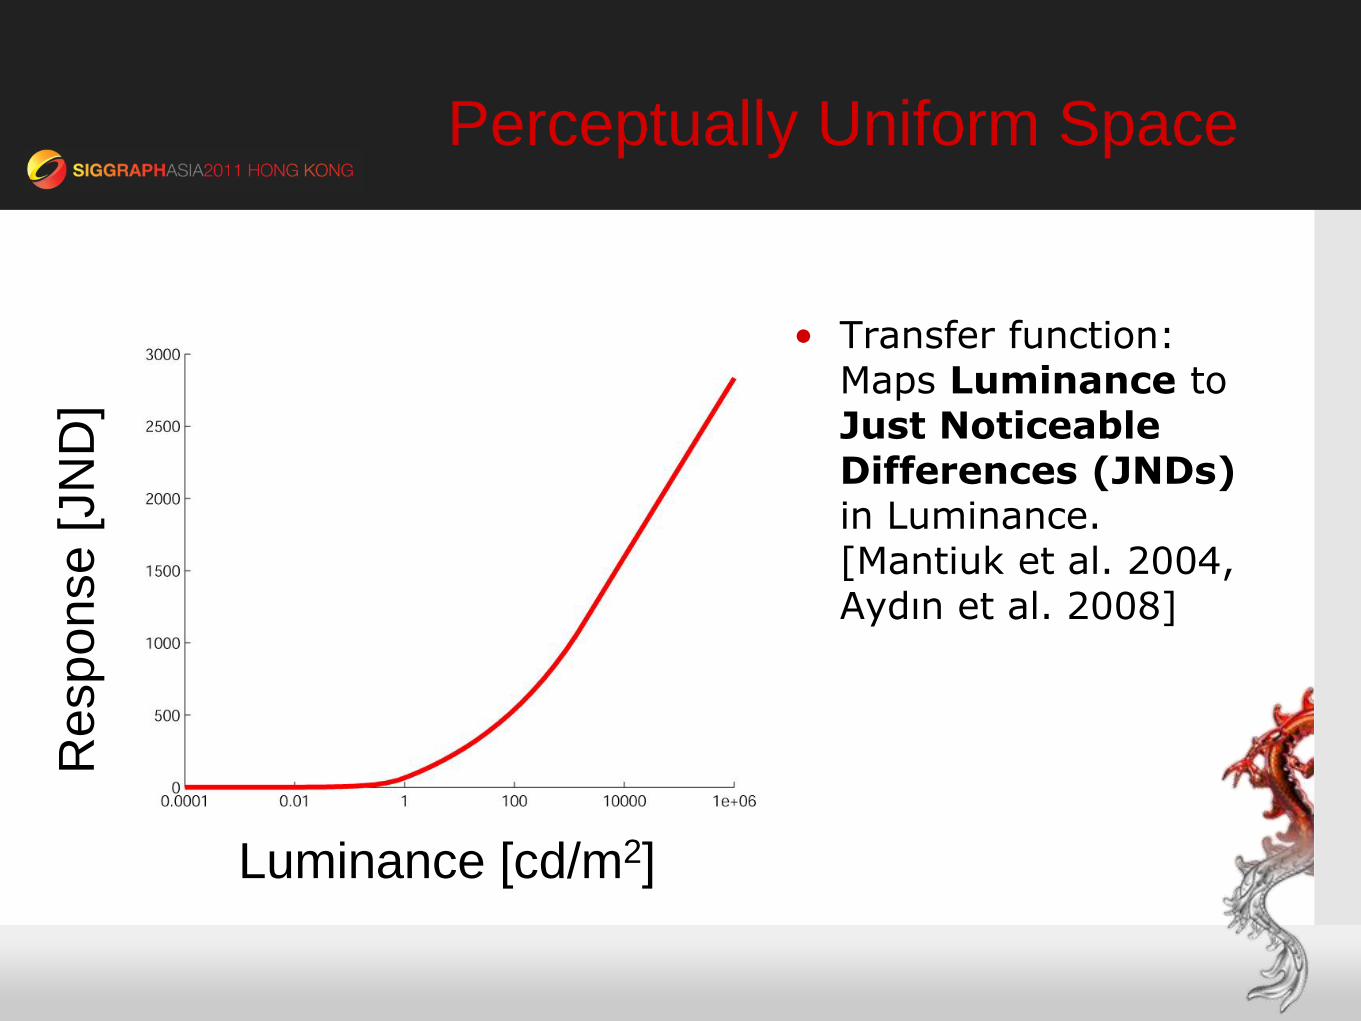
Perceptually Uniform Space R
esp
on
se
[JN
D]
Luminance [cd/m2]
• Transfer function: Maps Luminance to Just Noticeable Differences (JNDs) in Luminance. [Mantiuk et al. 2004, Aydın et al. 2008]
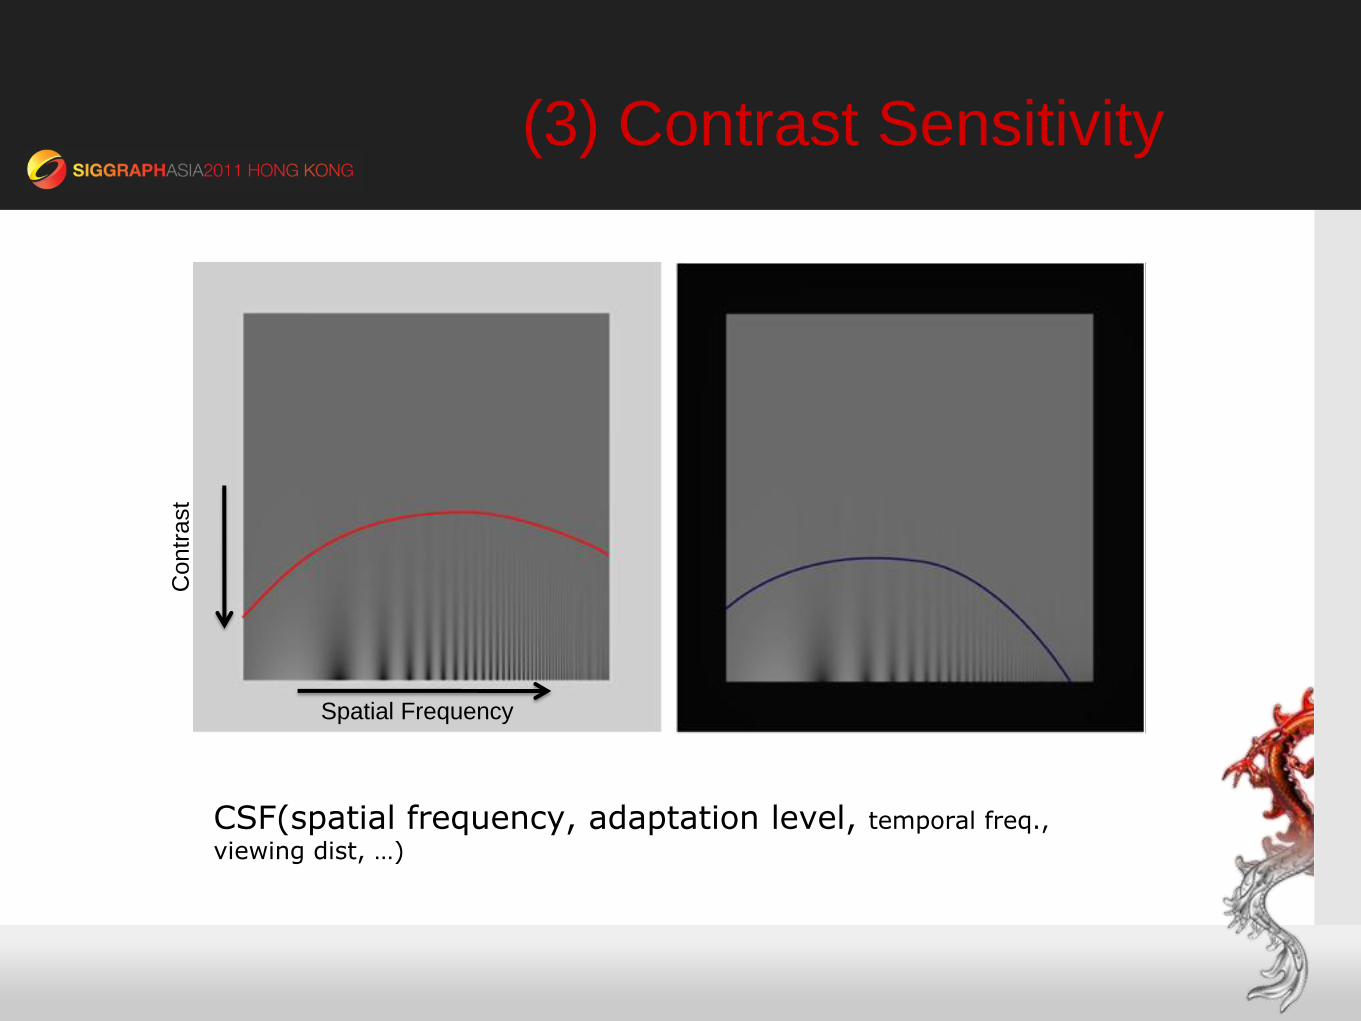
(3) Contrast Sensitivity
CSF(spatial frequency, adaptation level, temporal freq.,
viewing dist, …)
Contr
ast
Spatial Frequency
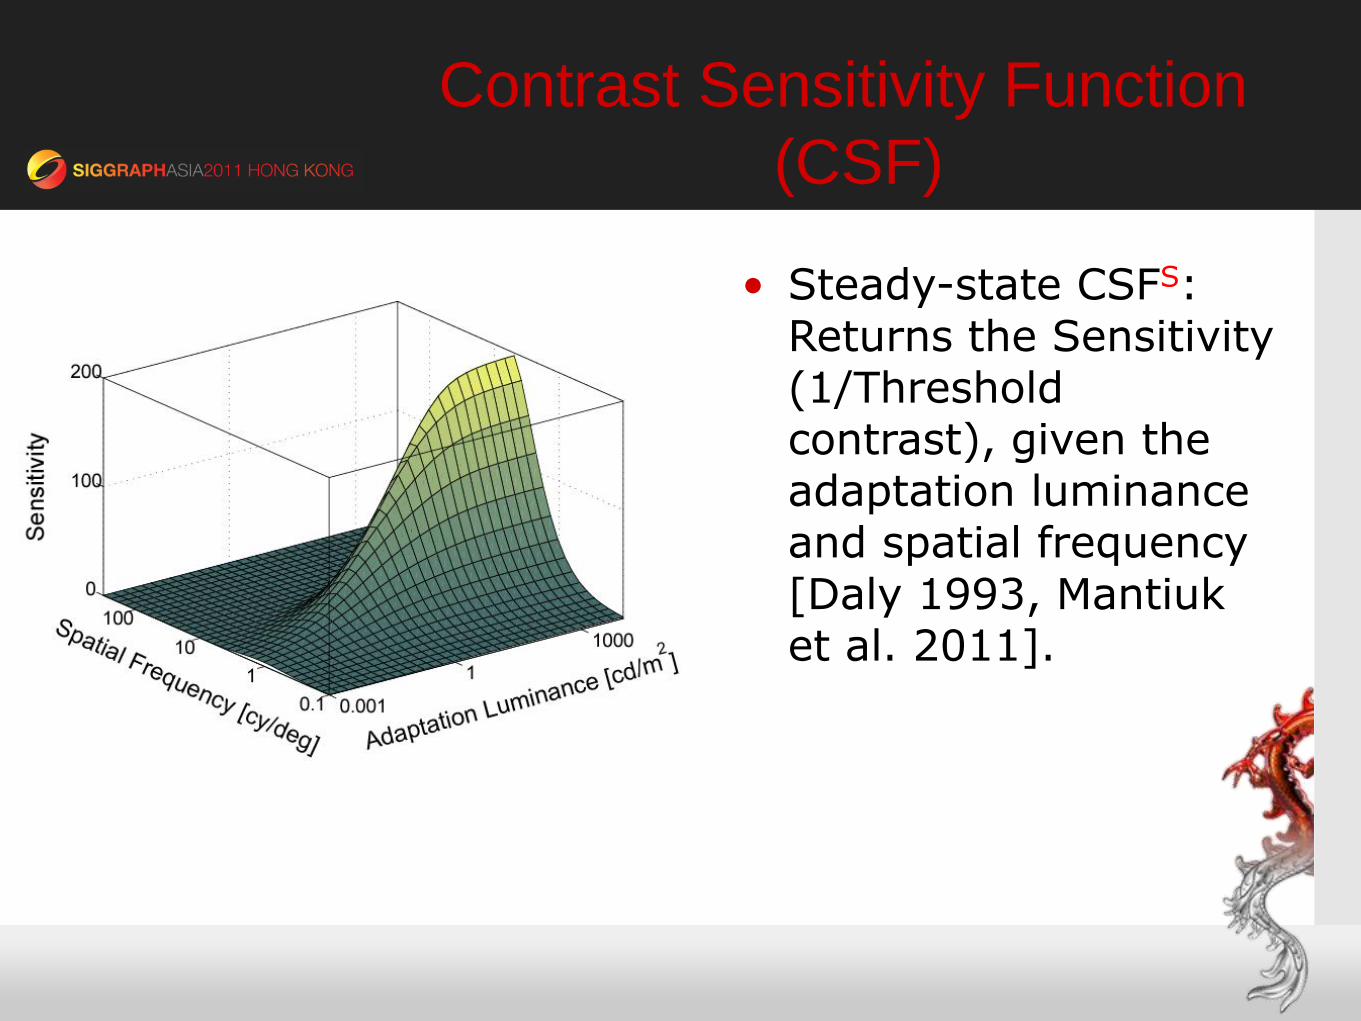
Contrast Sensitivity Function
(CSF)
• Steady-state CSFS: Returns the Sensitivity (1/Threshold contrast), given the adaptation luminance and spatial frequency [Daly 1993, Mantiuk et al. 2011].
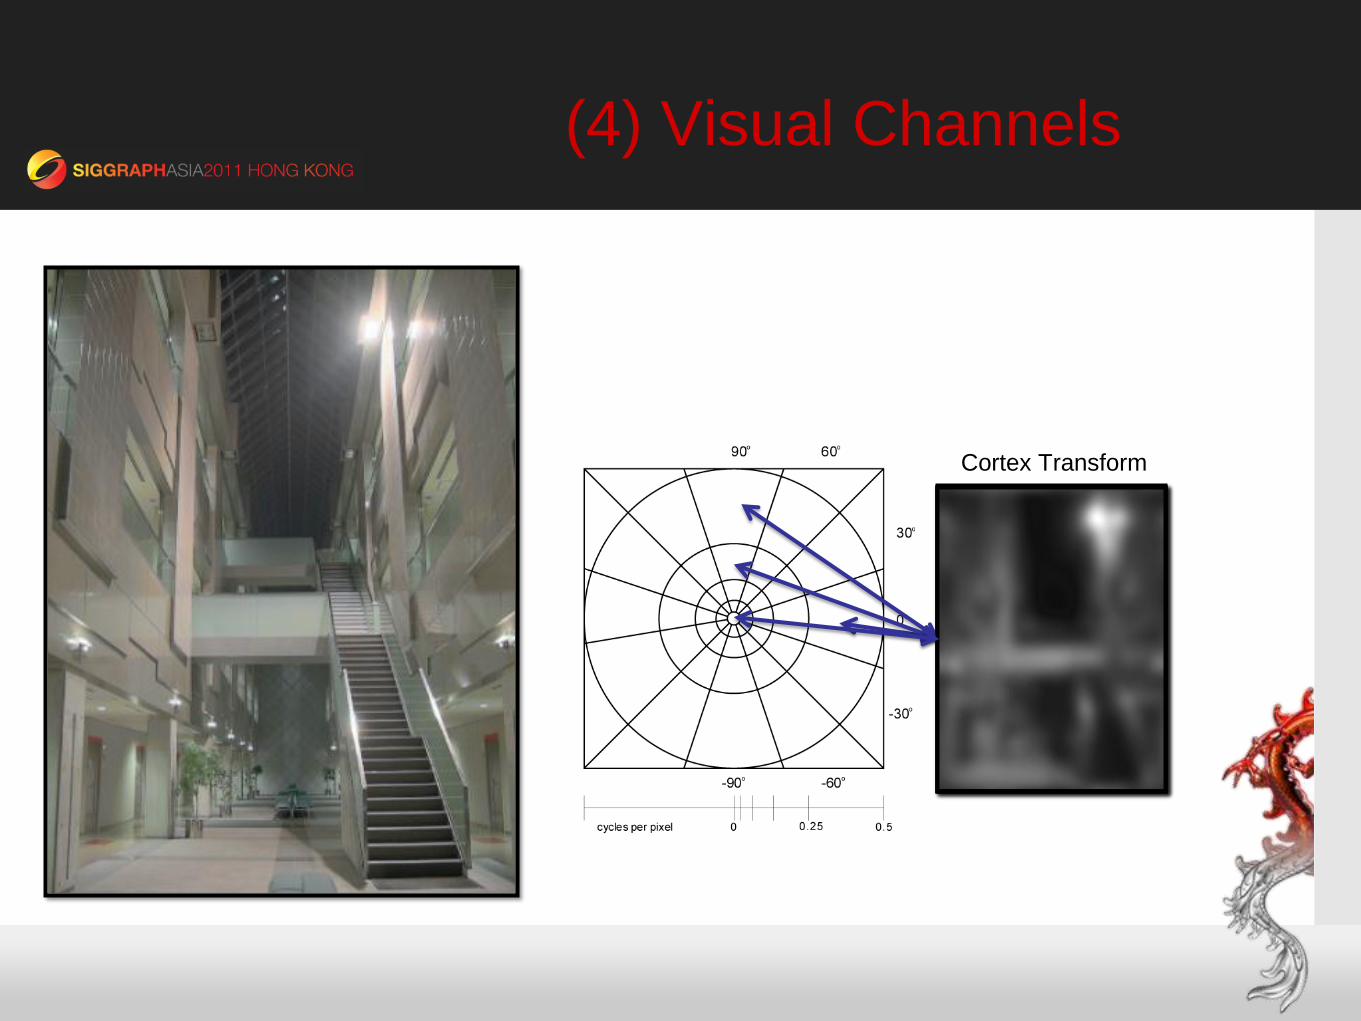
(4) Visual Channels
Cortex Transform
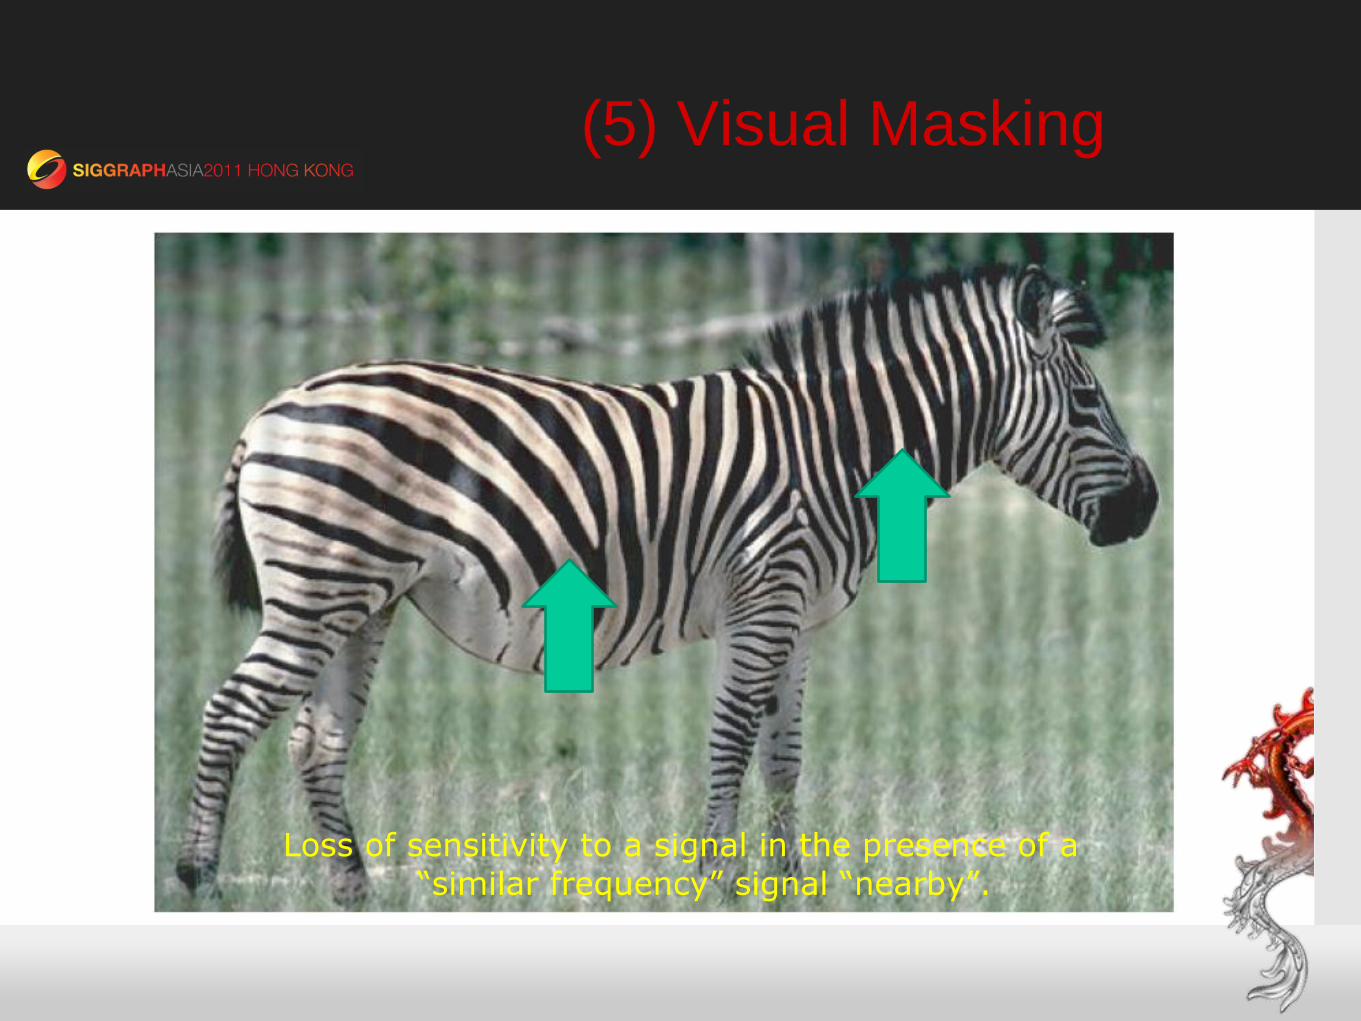
(5) Visual Masking
Loss of sensitivity to a signal in the presence of a “similar frequency” signal “nearby”.
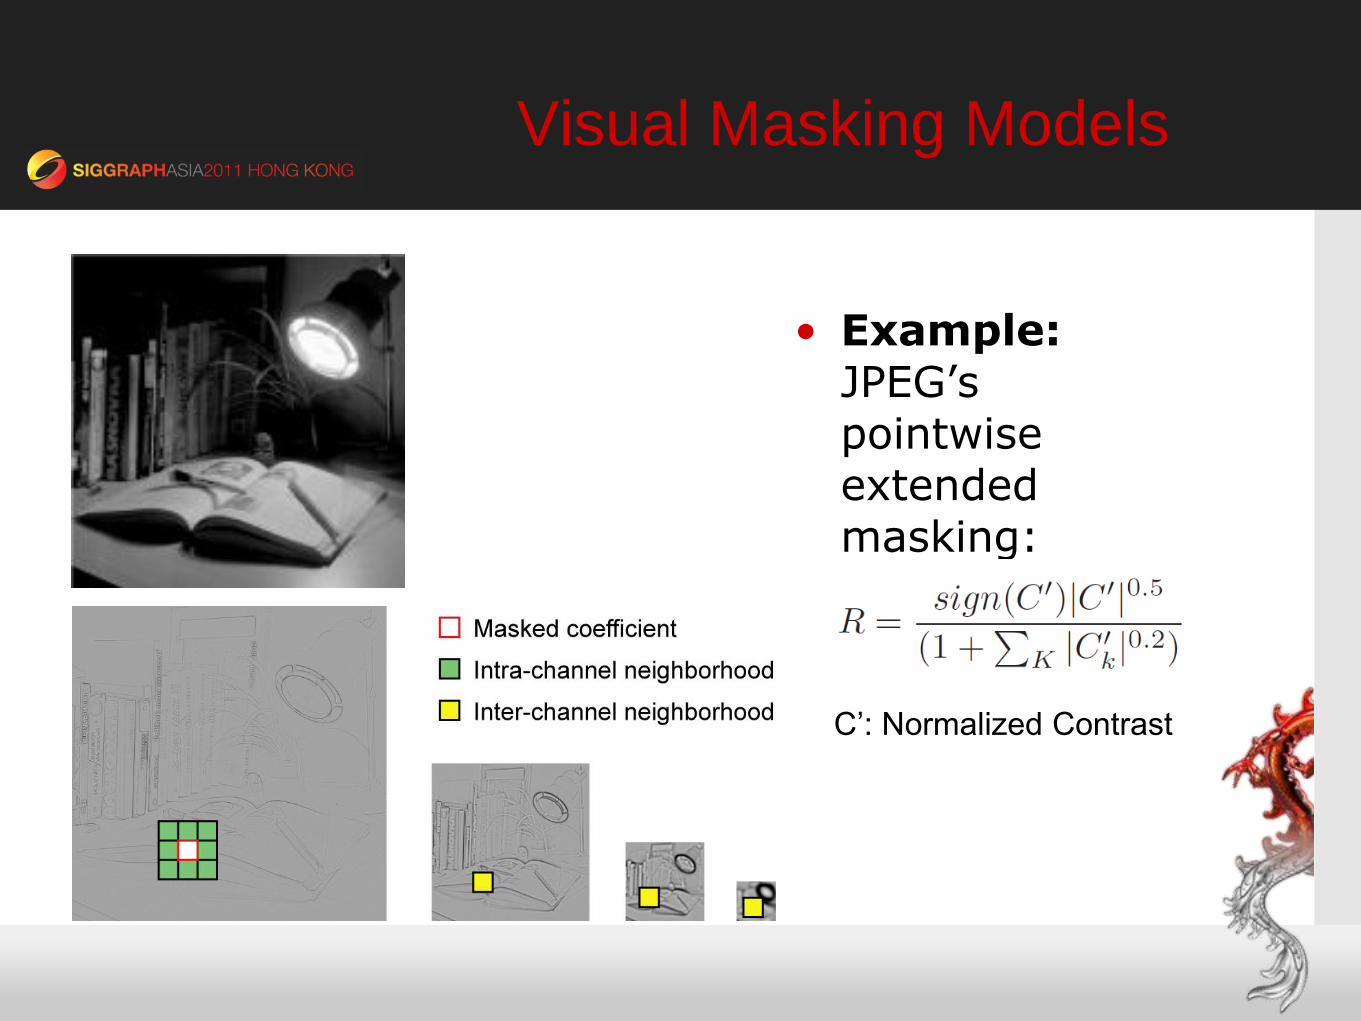
Visual Masking Models
• Example: JPEG’s pointwise extended masking:
C’: Normalized Contrast
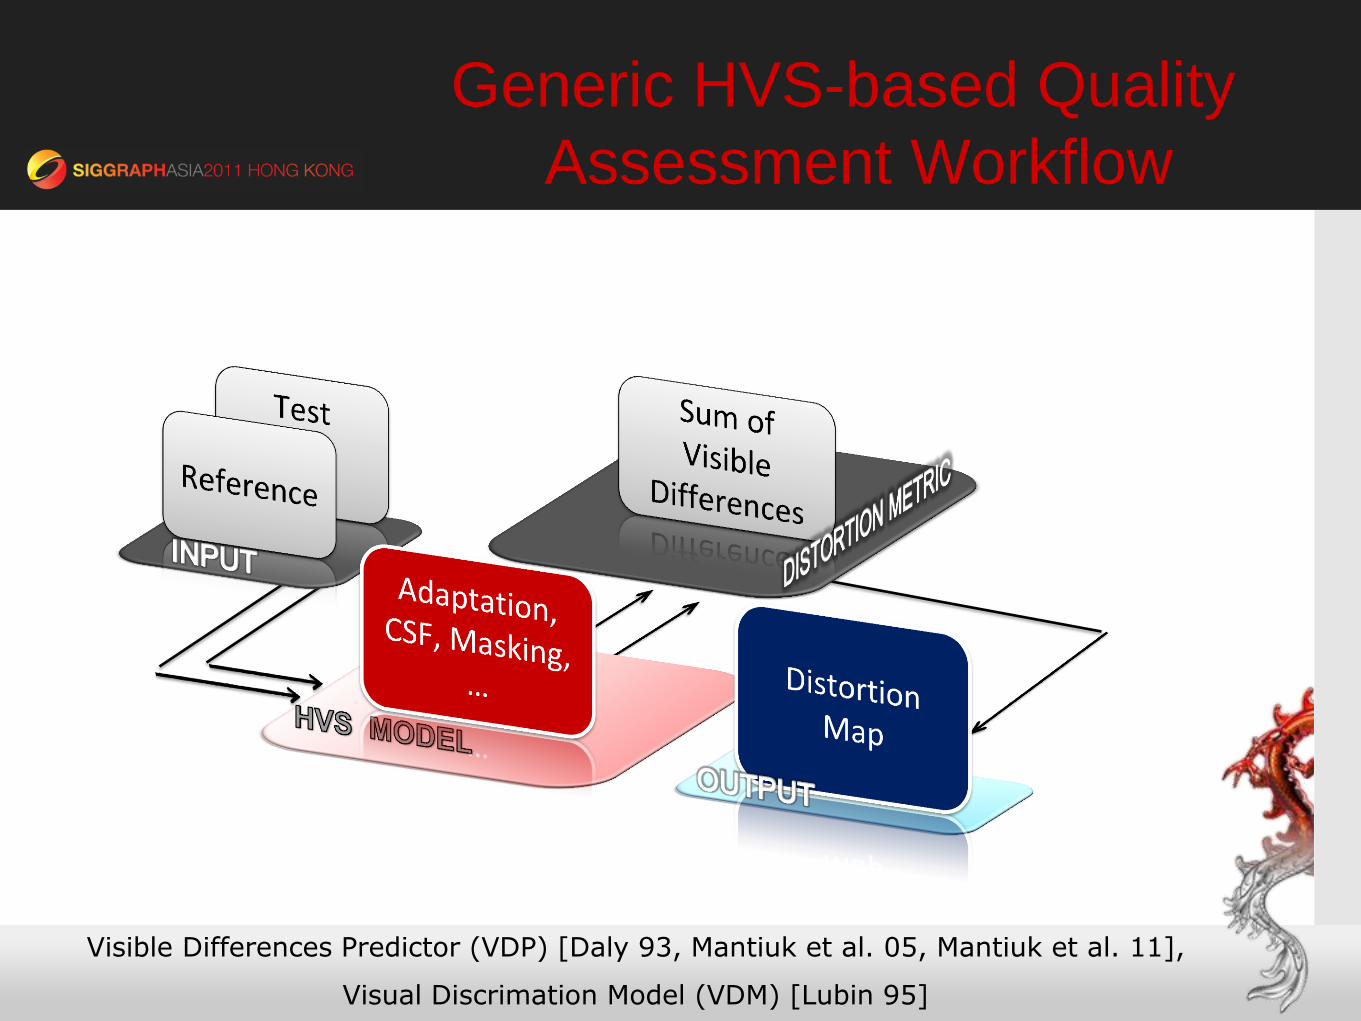
Generic HVS-based Quality
Assessment Workflow
Visible Differences Predictor (VDP) [Daly 93, Mantiuk et al. 05, Mantiuk et al. 11],
Visual Discrimation Model (VDM) [Lubin 95]
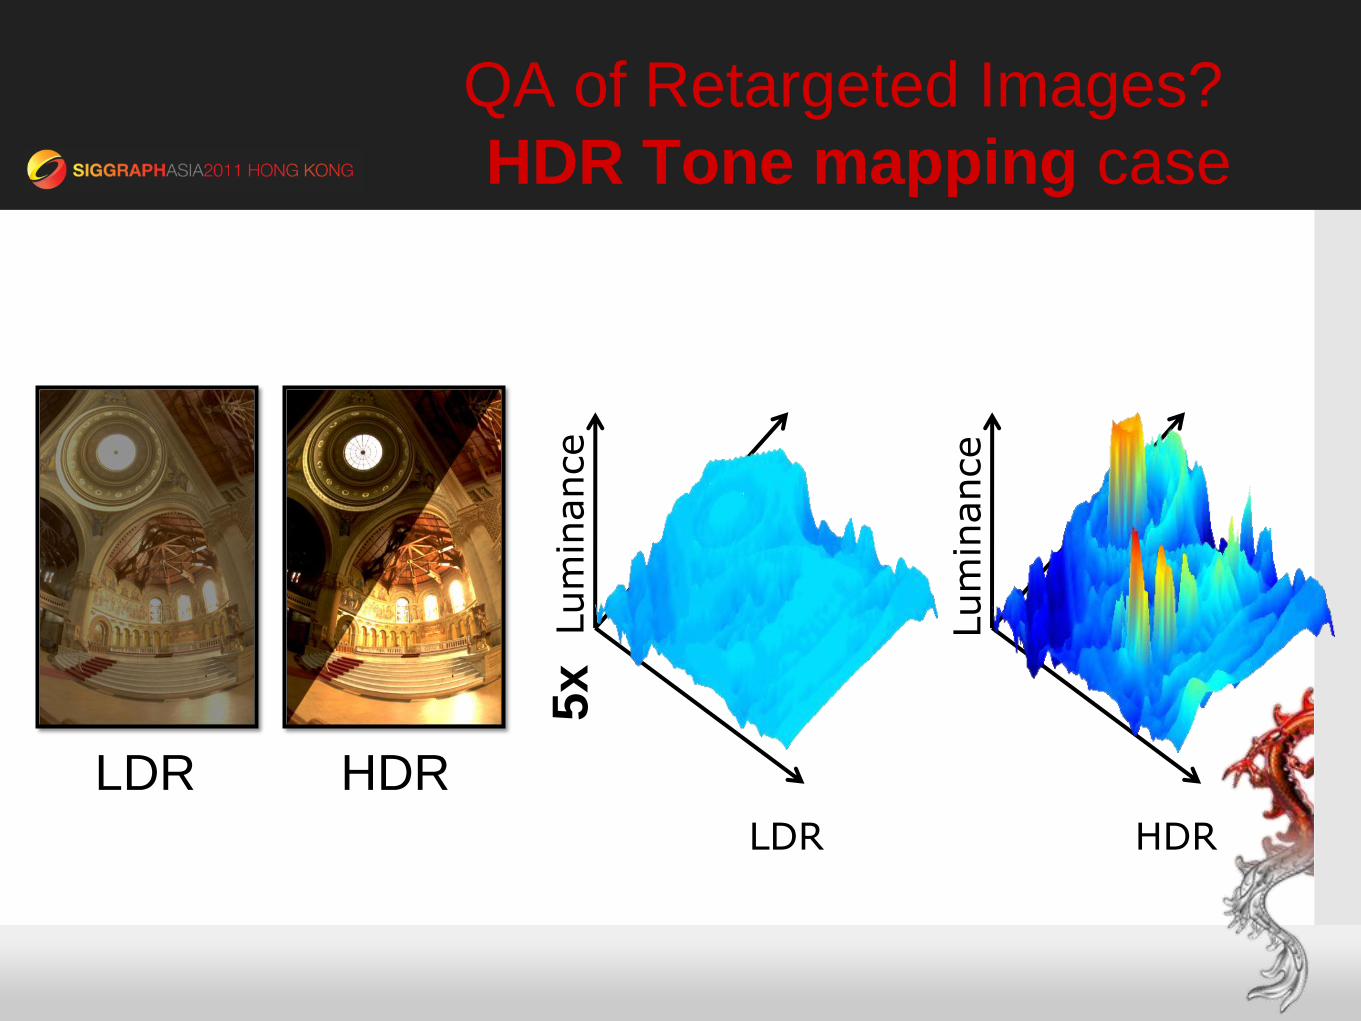
5x
LDR HDR
Lum
inance
Lum
inance
LDR HDR
QA of Retargeted Images?
HDR Tone mapping case
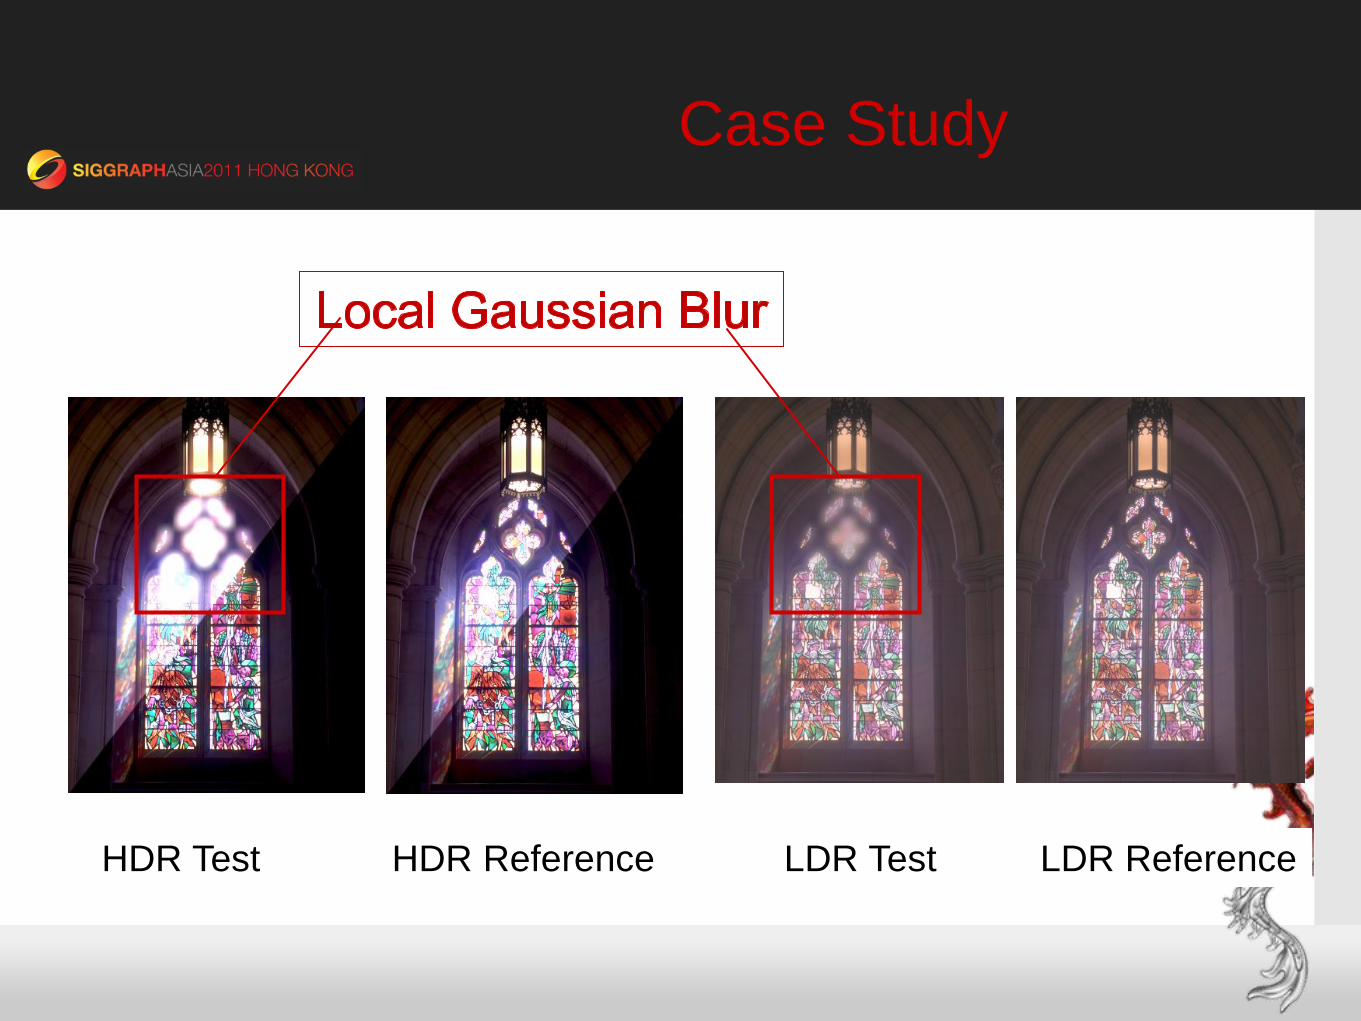
Case Study
HDR Test HDR Reference LDR Test LDR Reference
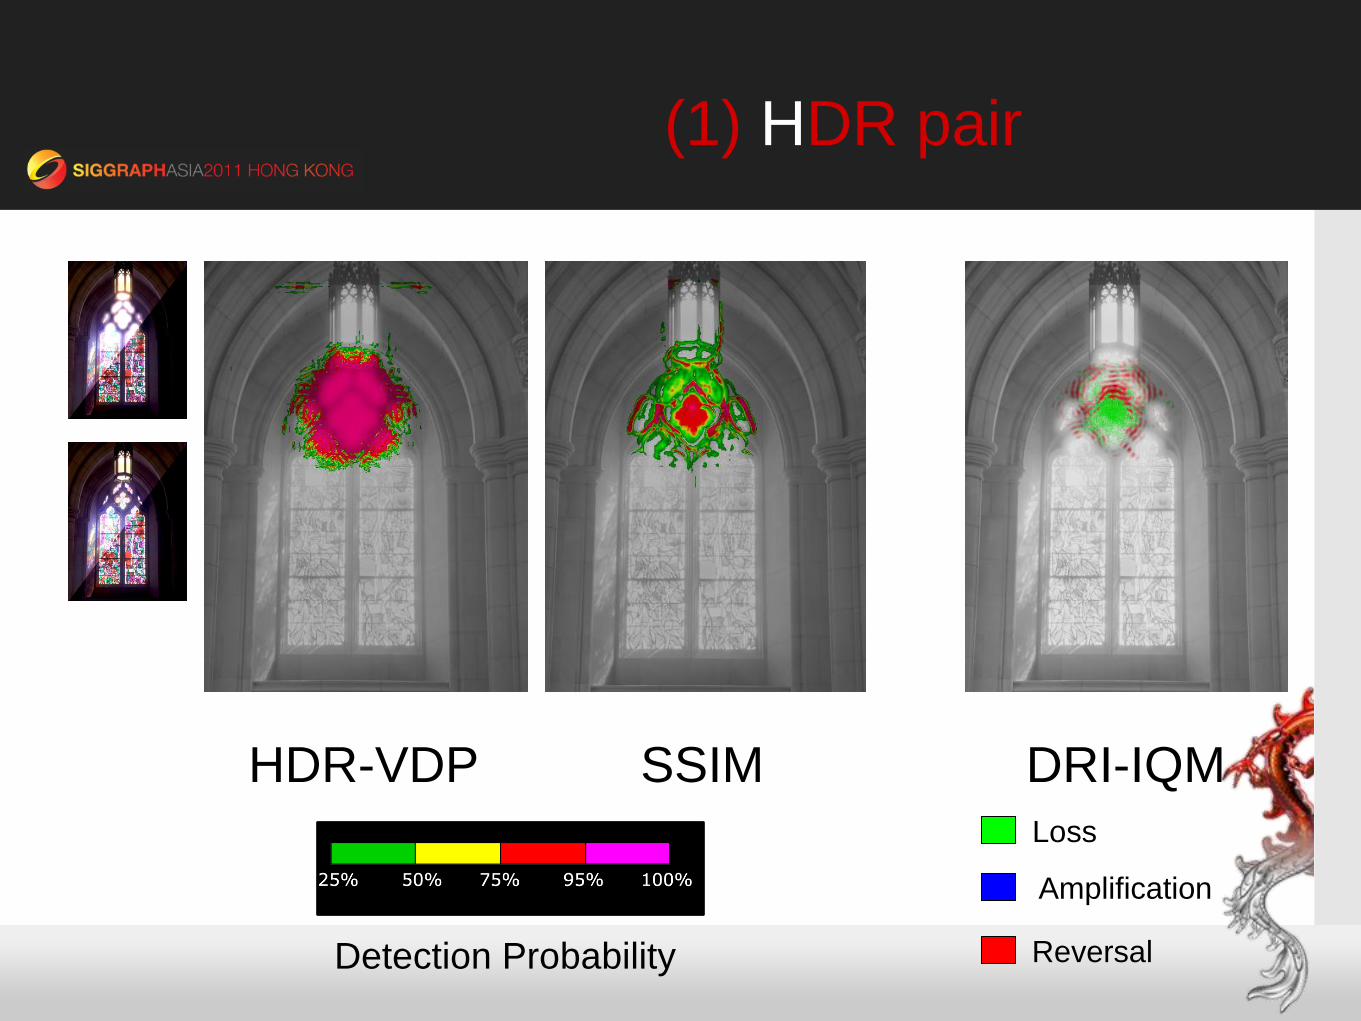
(1) HDR pair
HDR-VDP DRI-IQM SSIM
Loss
Amplification
Reversal Detection Probability
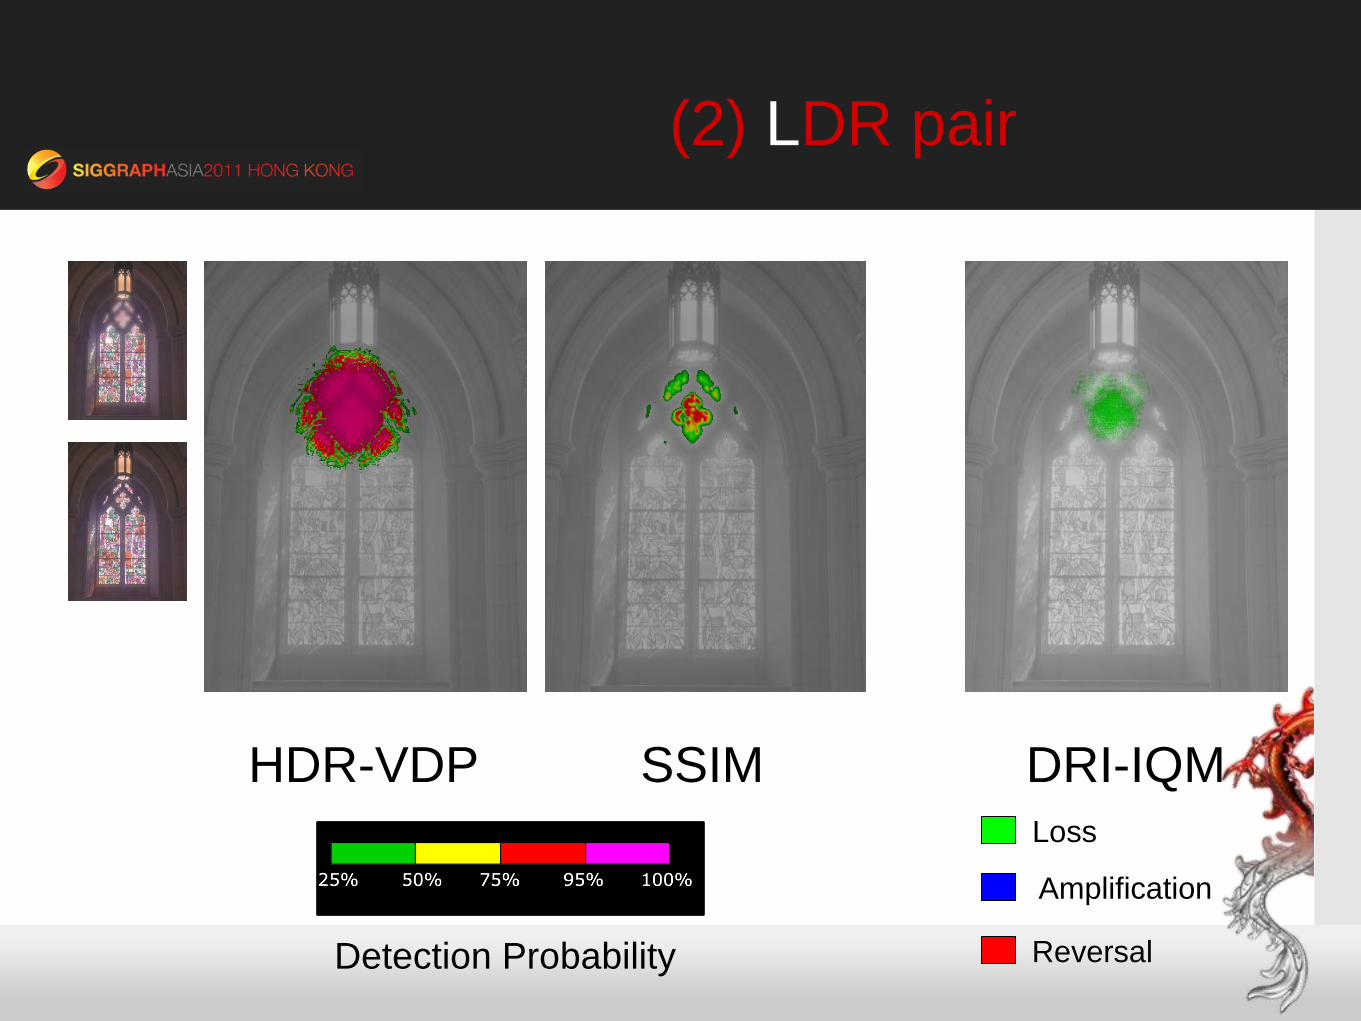
(2) LDR pair
HDR-VDP DRI-IQM SSIM
Loss
Amplification
Reversal Detection Probability
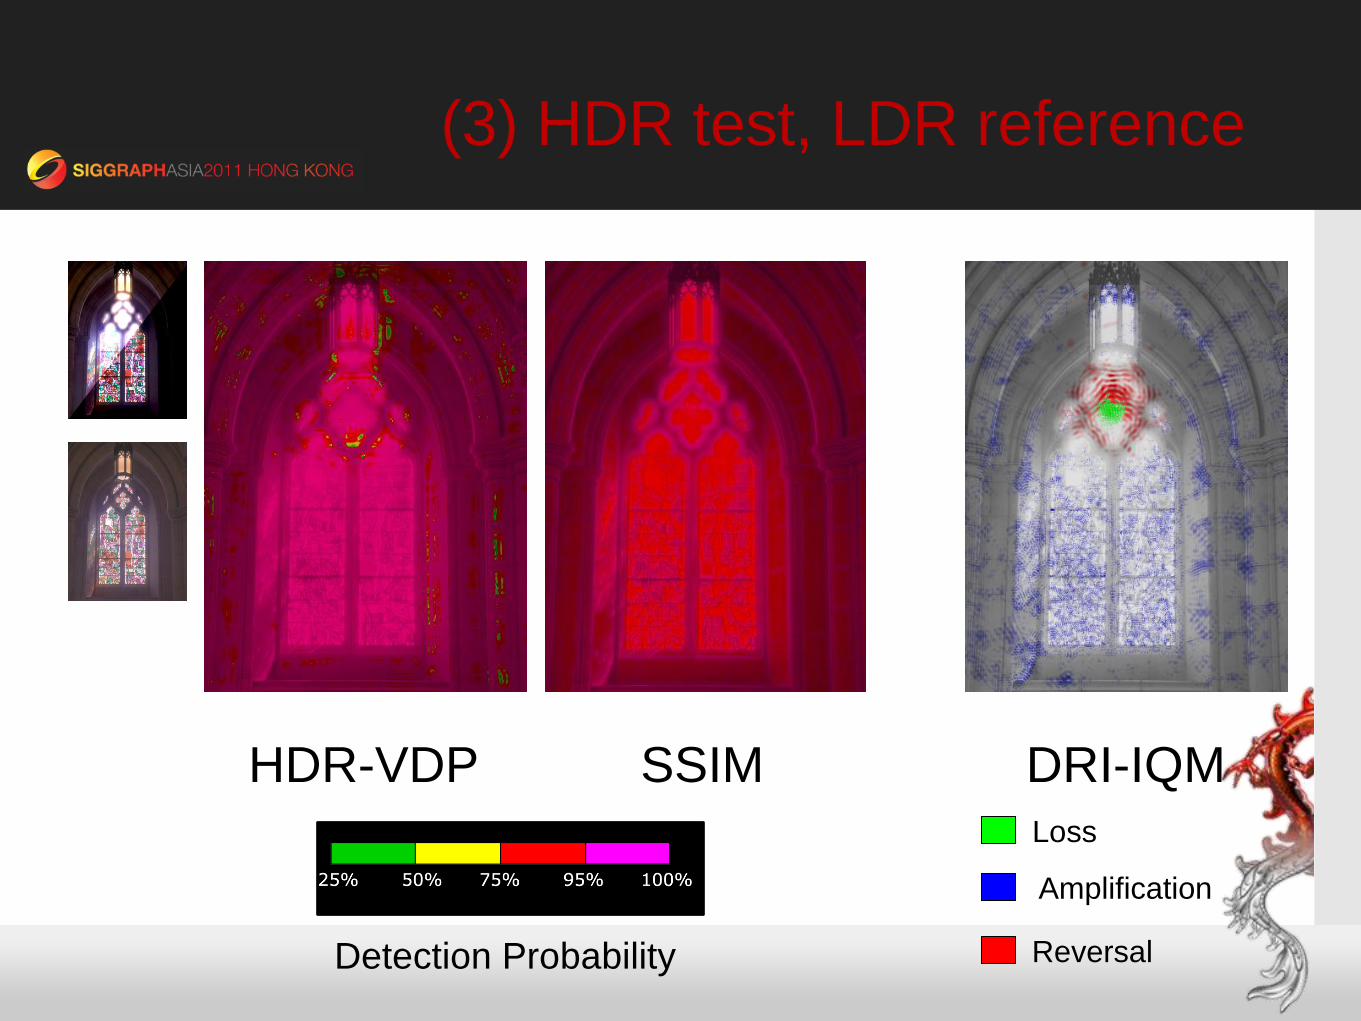
(3) HDR test, LDR reference
HDR-VDP DRI-IQM SSIM
Loss
Amplification
Reversal Detection Probability
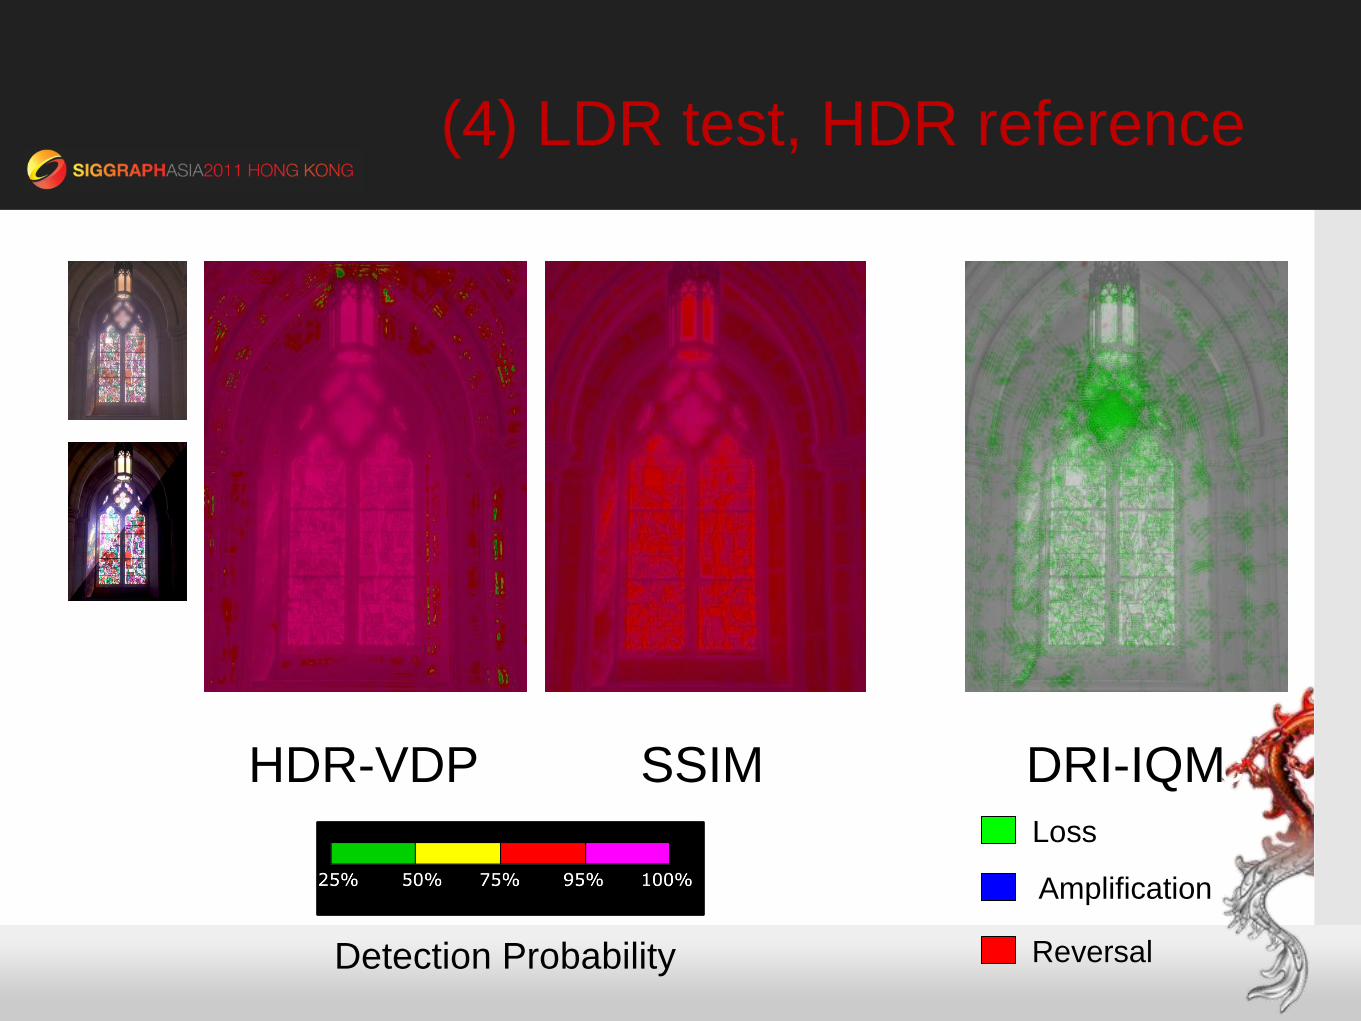
(4) LDR test, HDR reference
HDR-VDP Our Metric SSIM HDR-VDP DRI-IQM SSIM
Loss
Amplification
Reversal Detection Probability
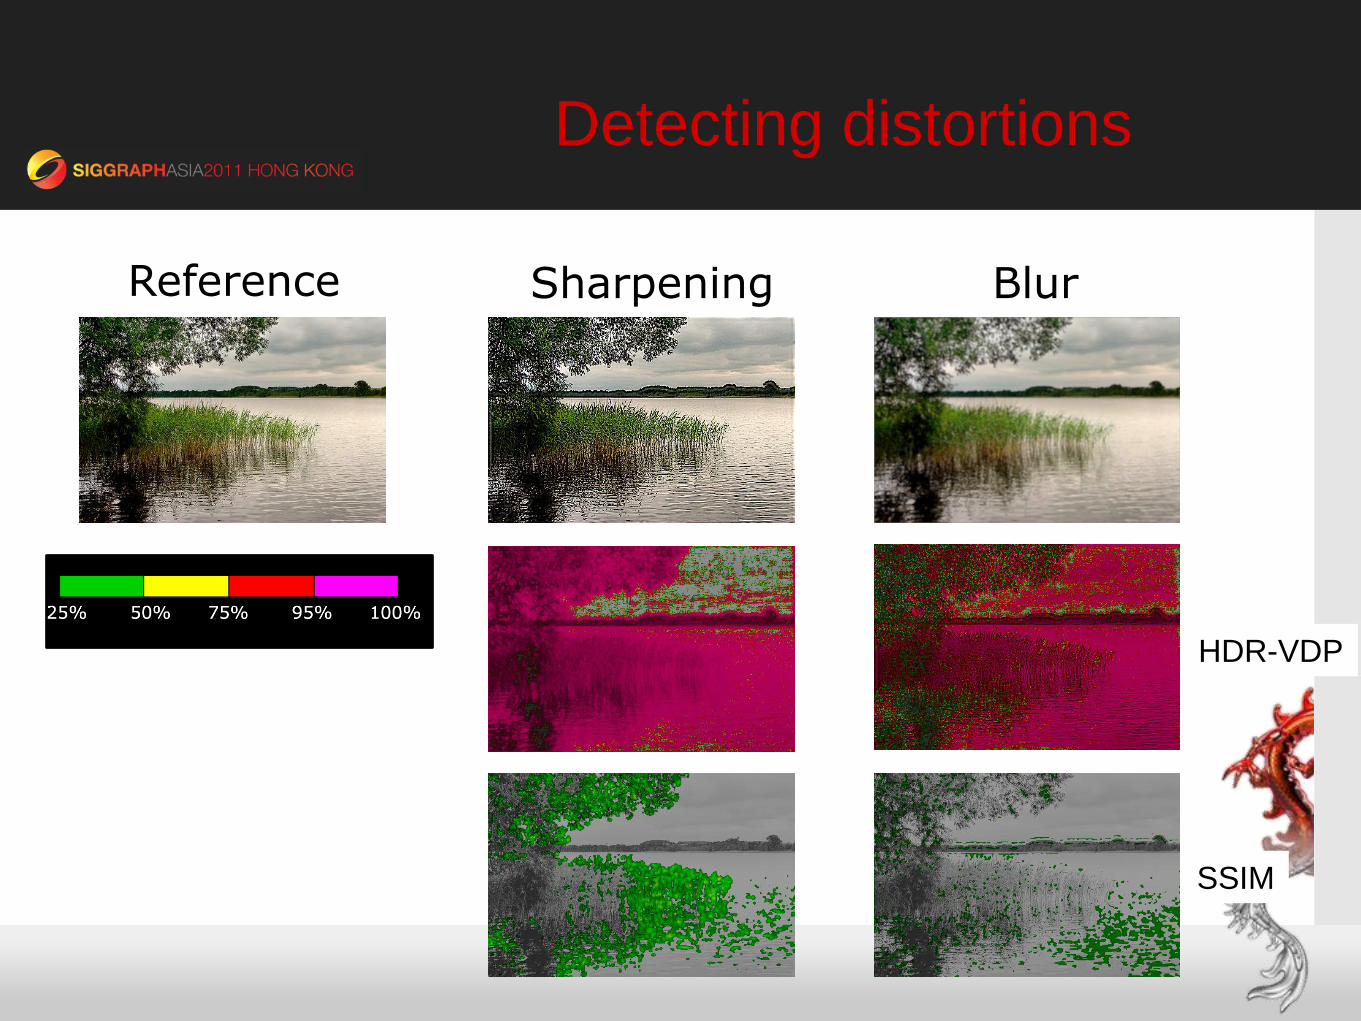
Detecting distortions
HDR-VDP
SSIM
Sharpening Blur Reference
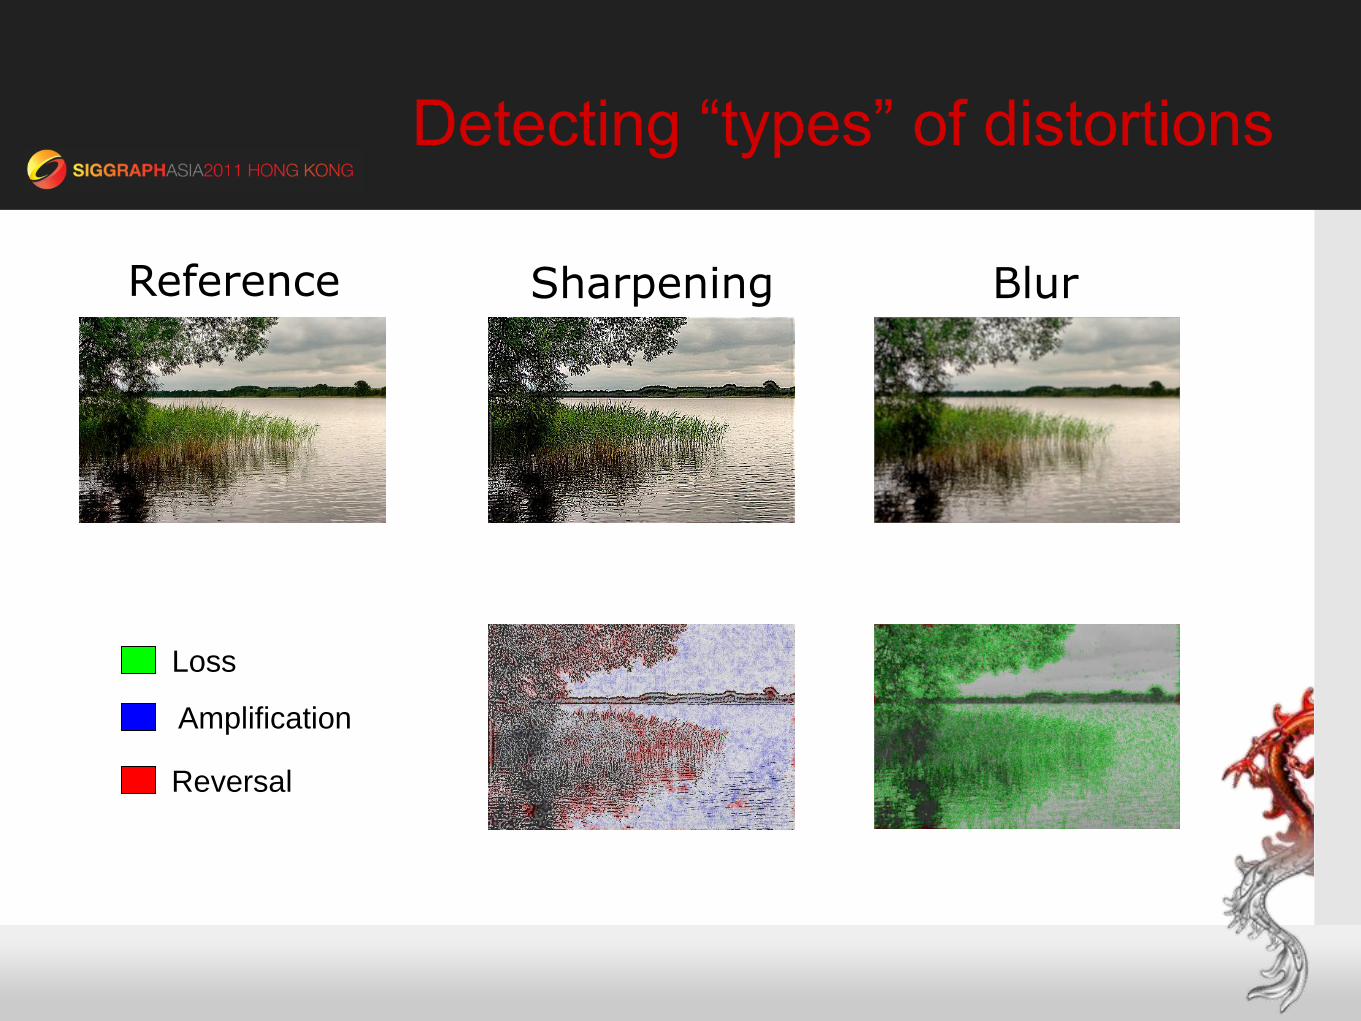
Detecting “types” of distortions
Sharpening Blur Reference
Loss
Amplification
Reversal
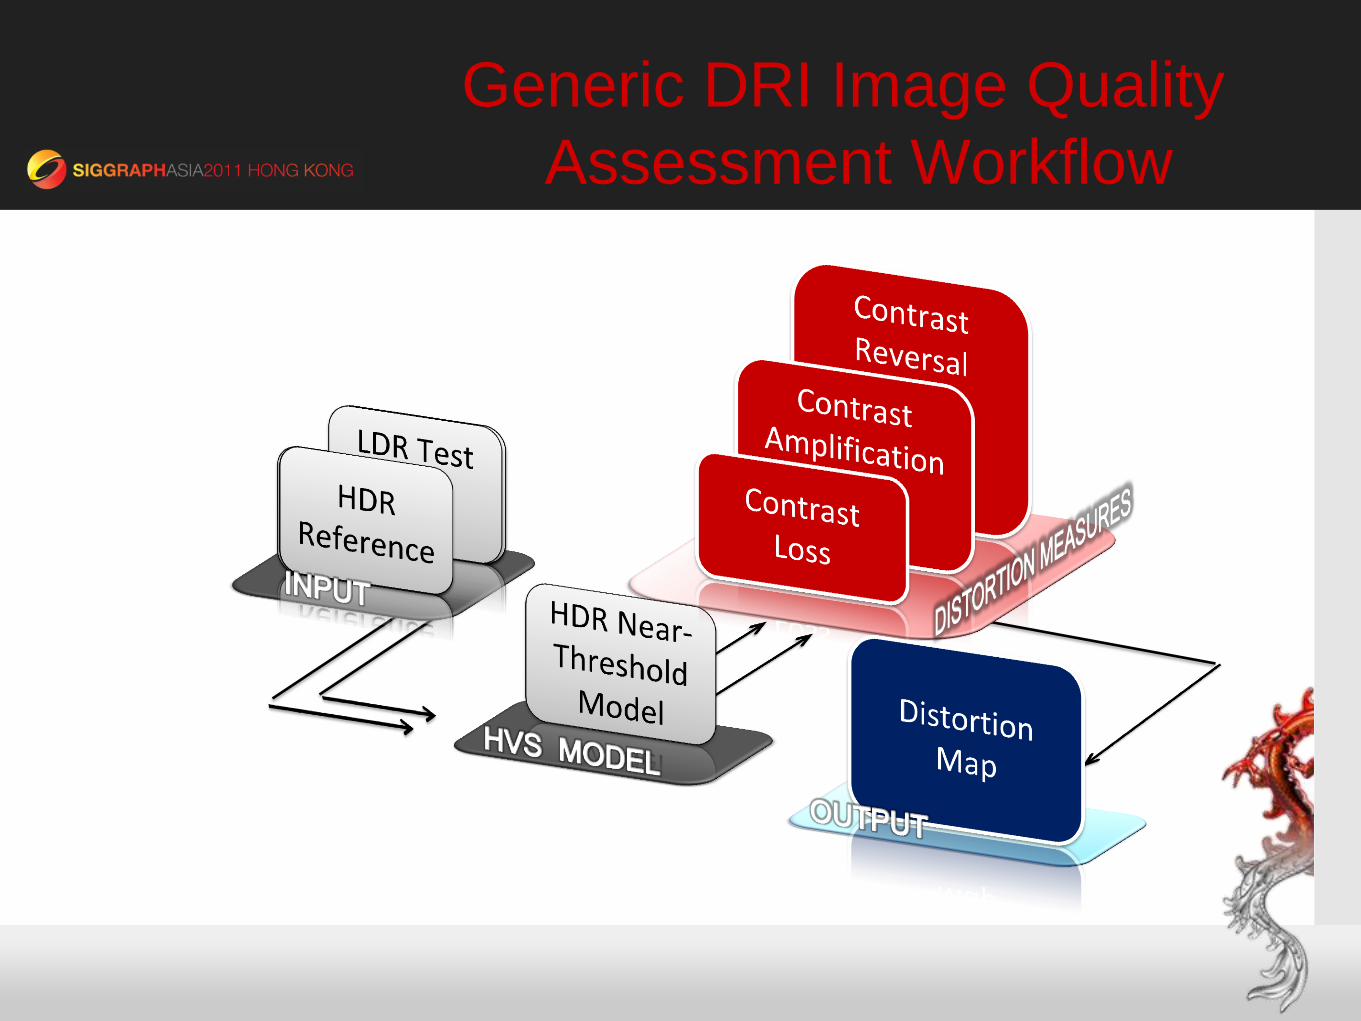
Generic DRI Image Quality
Assessment Workflow
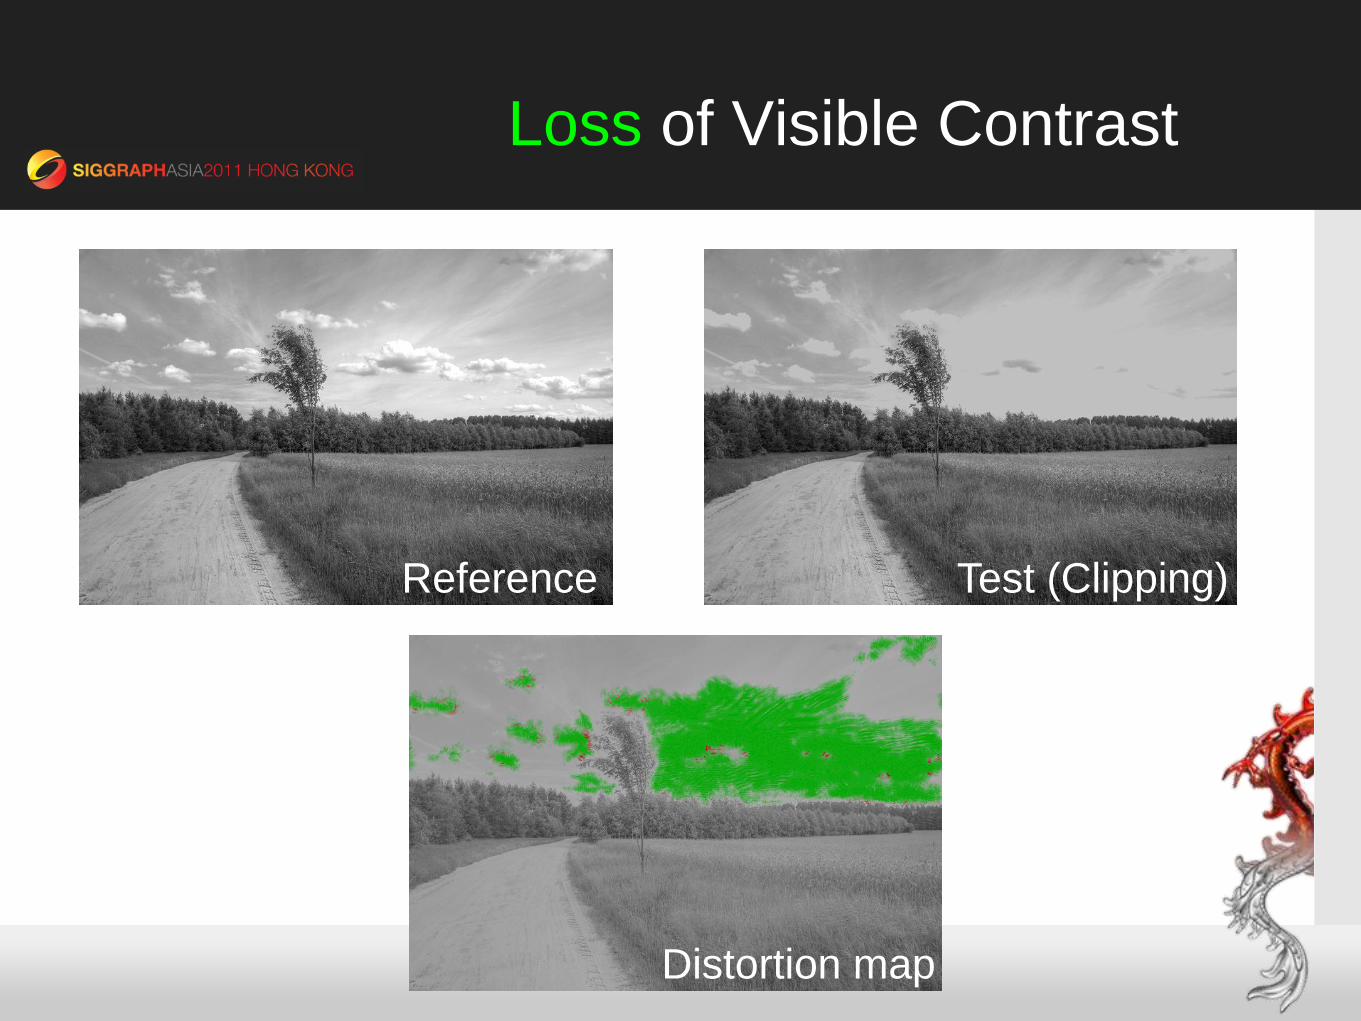
Loss of Visible Contrast
Reference Test (Clipping)
Distortion map
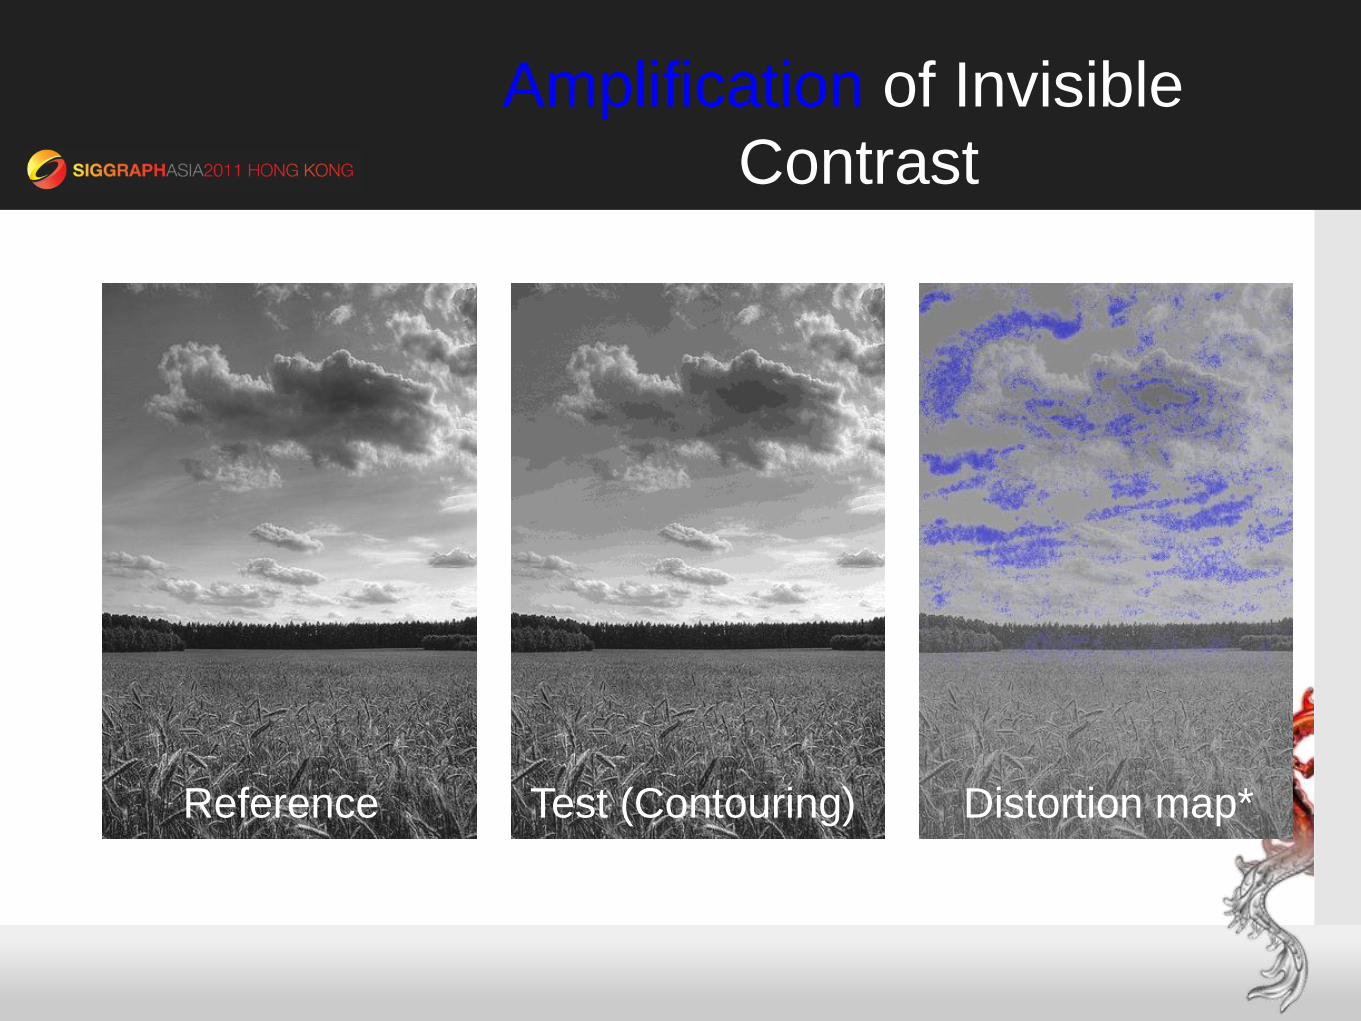
Amplification of Invisible
Contrast
Reference Distortion map* Test (Contouring)
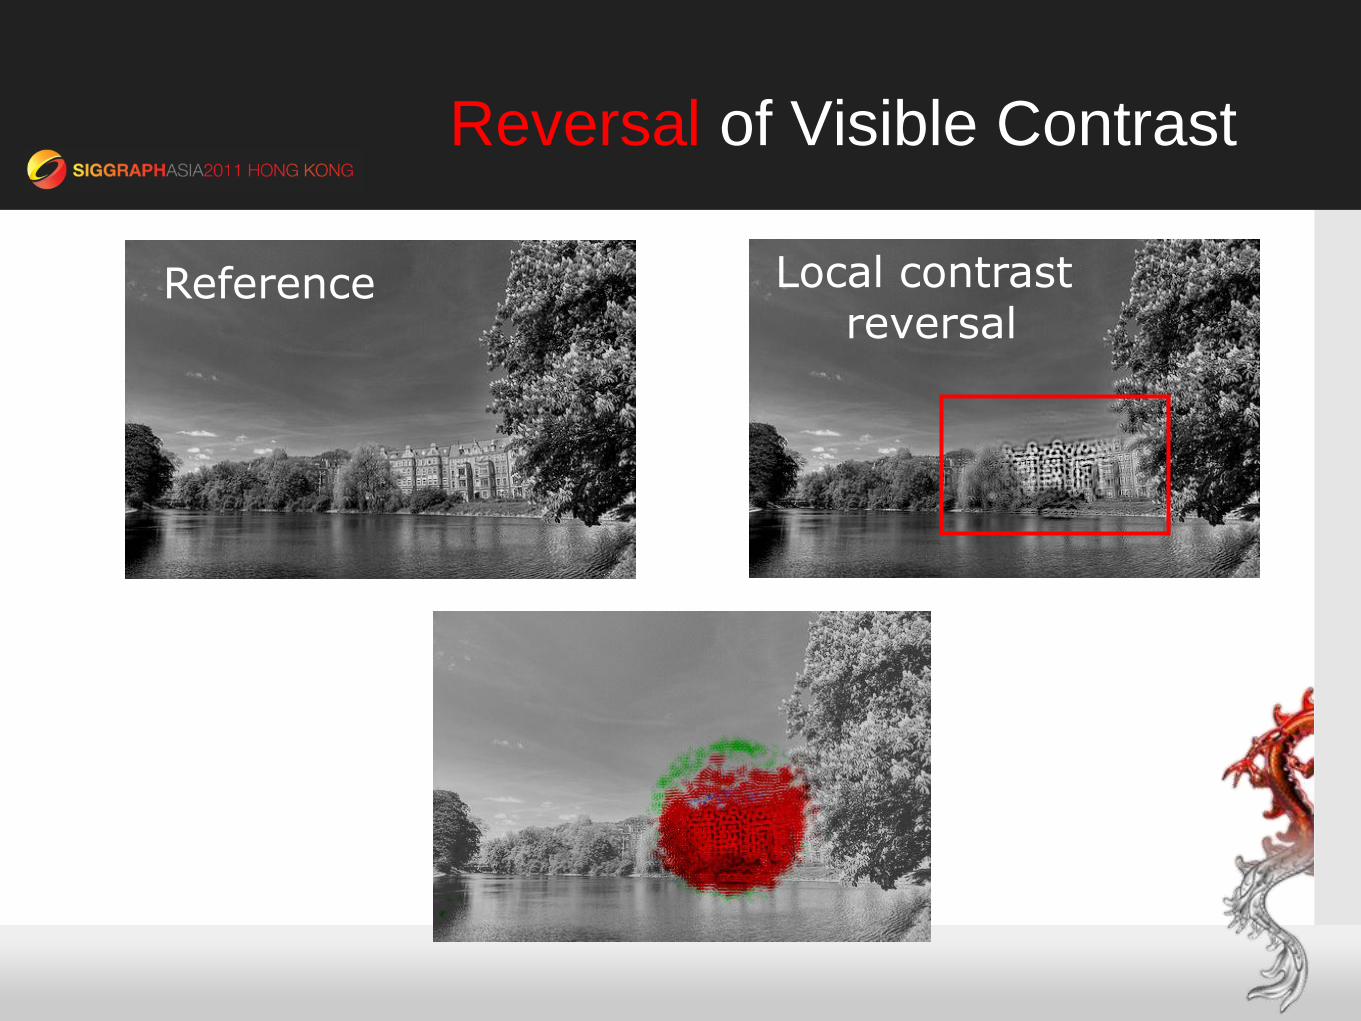
Reversal of Visible Contrast
Reference Local contrast reversal
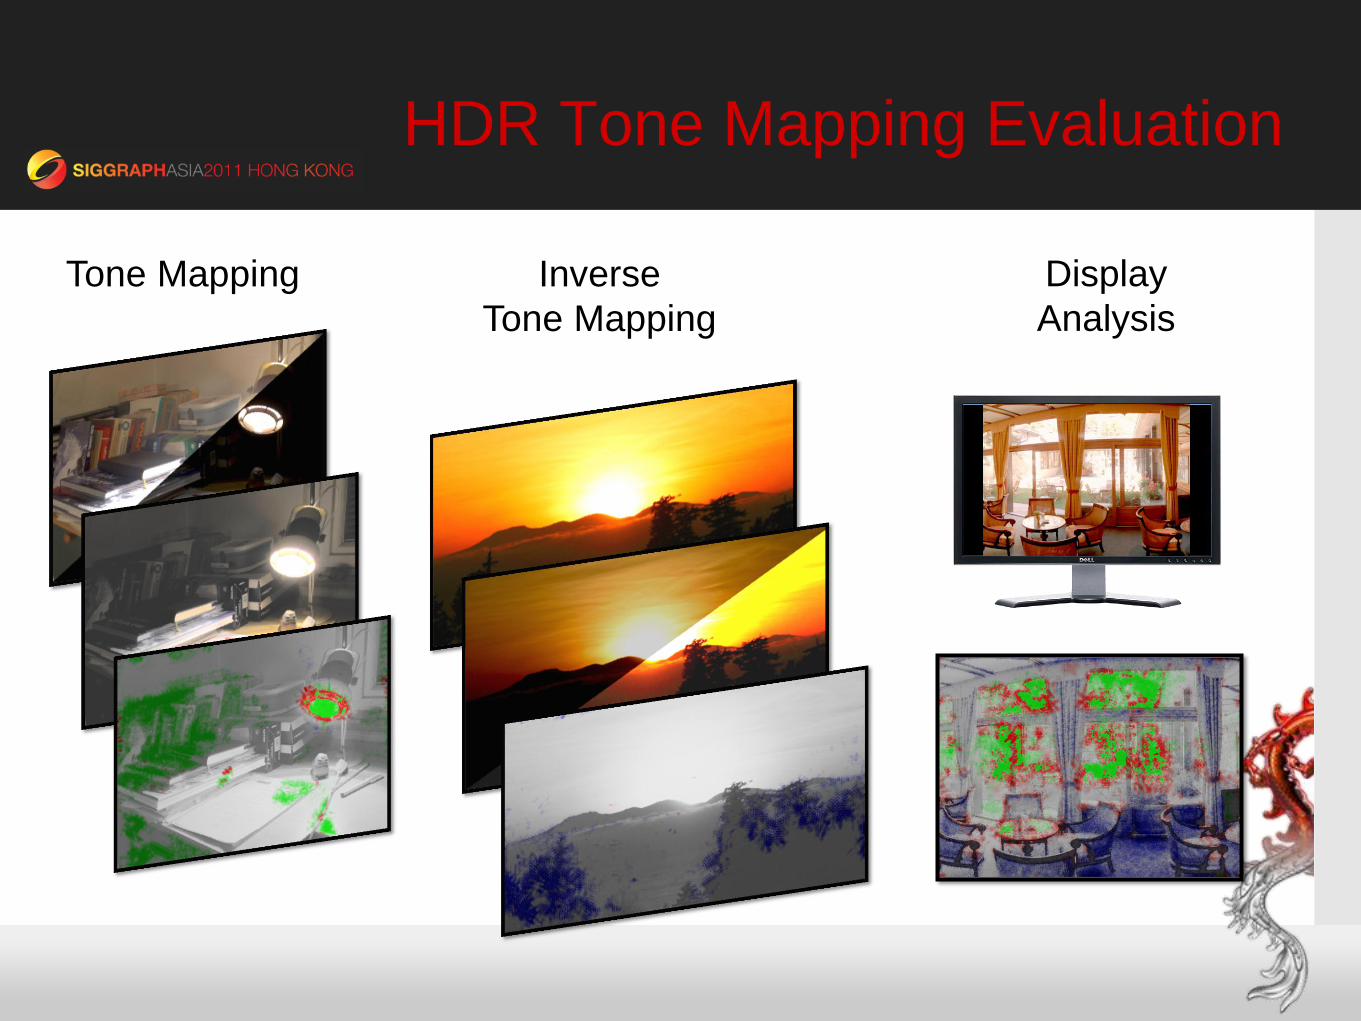
HDR Tone Mapping Evaluation
Tone Mapping Inverse
Tone Mapping
Display
Analysis
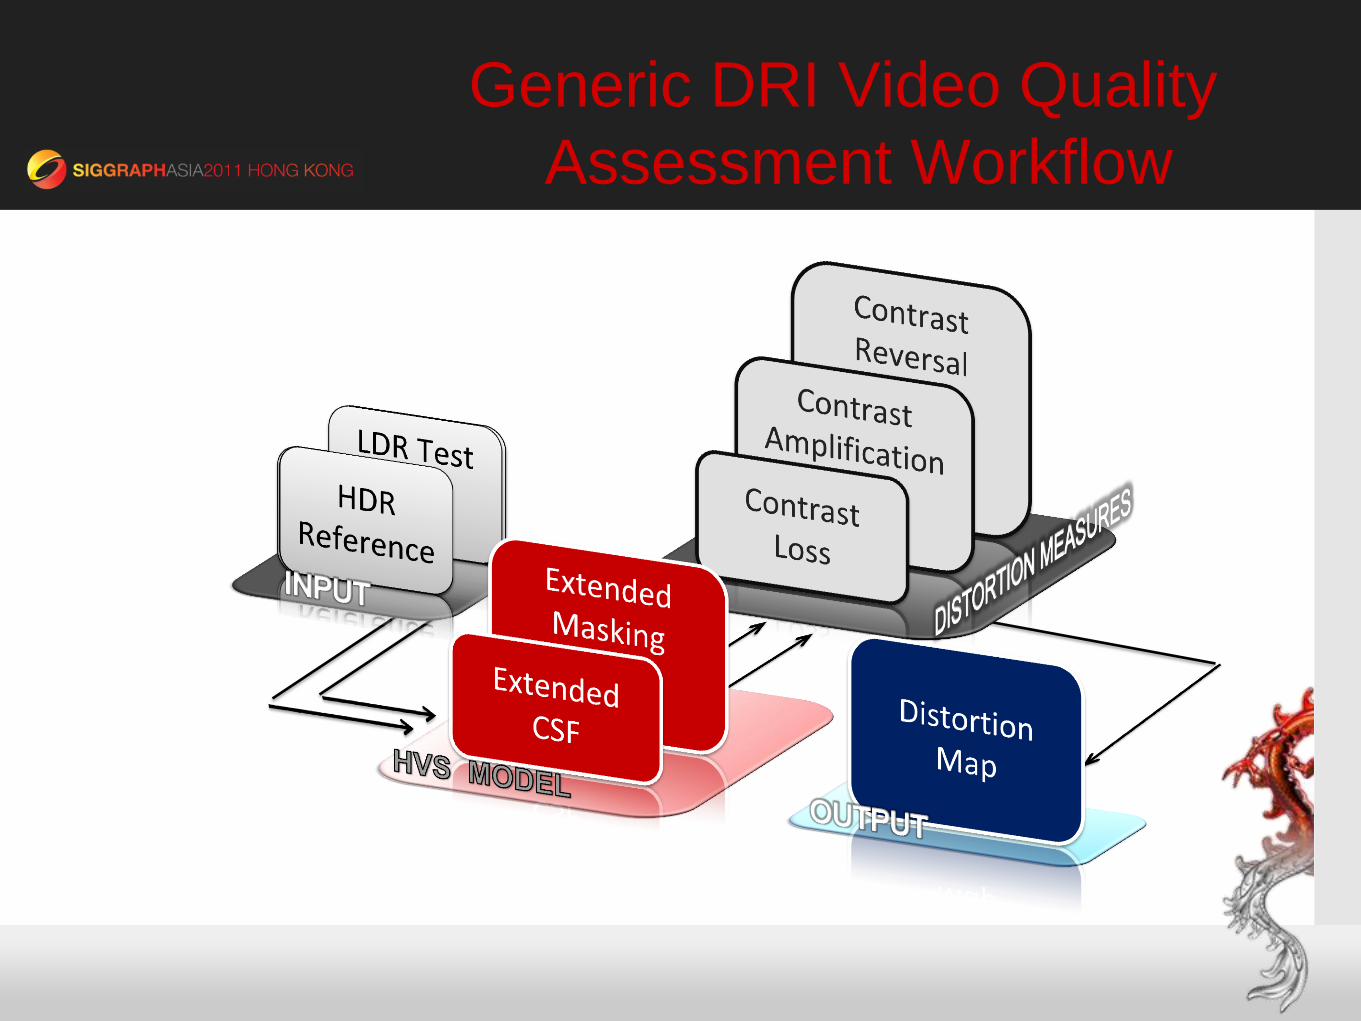
Generic DRI Video Quality
Assessment Workflow
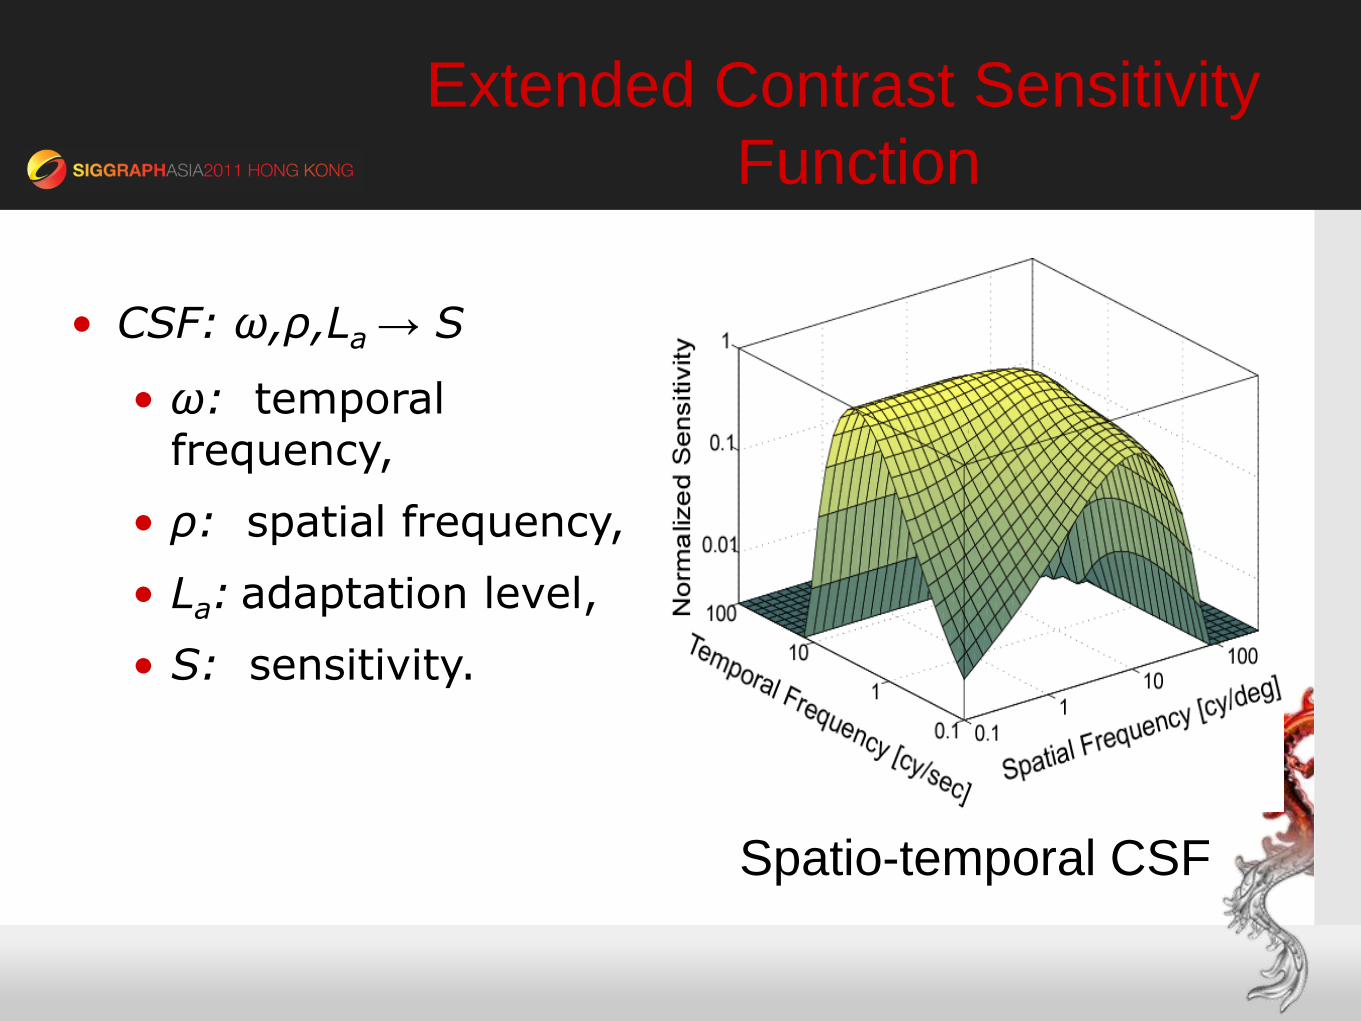
Extended Contrast Sensitivity
Function
• CSF: ω,ρ,La → S
• ω: temporal frequency,
• ρ: spatial frequency,
• La: adaptation level,
• S: sensitivity.
Spatio-temporal CSF
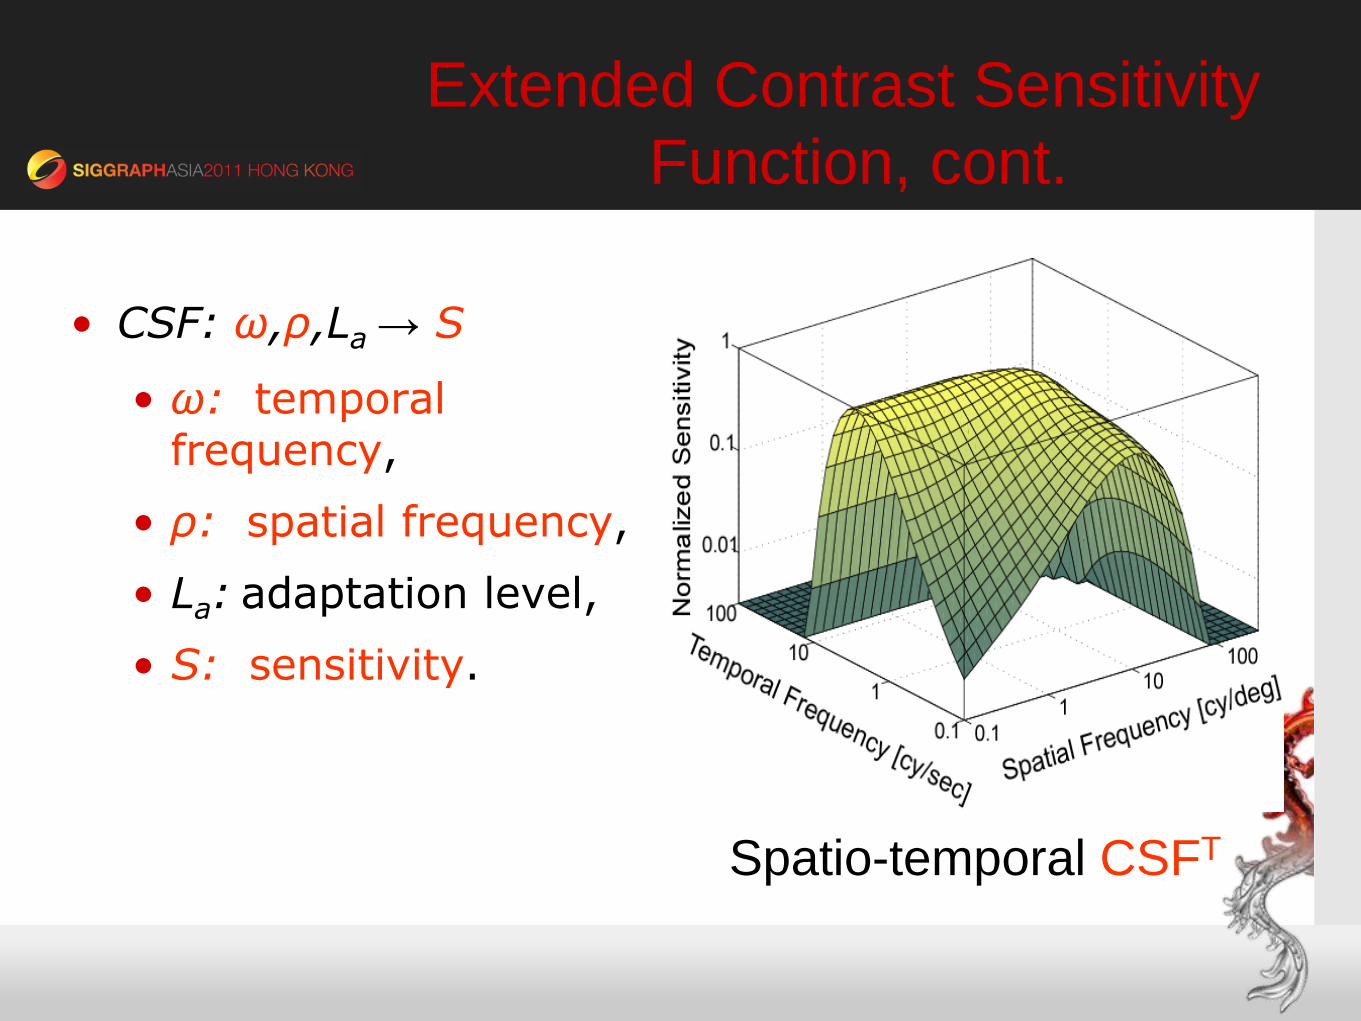
• CSF: ω,ρ,La → S
• ω: temporal frequency,
• ρ: spatial frequency,
• La: adaptation level,
• S: sensitivity.
Extended Contrast Sensitivity
Function, cont.
Spatio-temporal CSFT
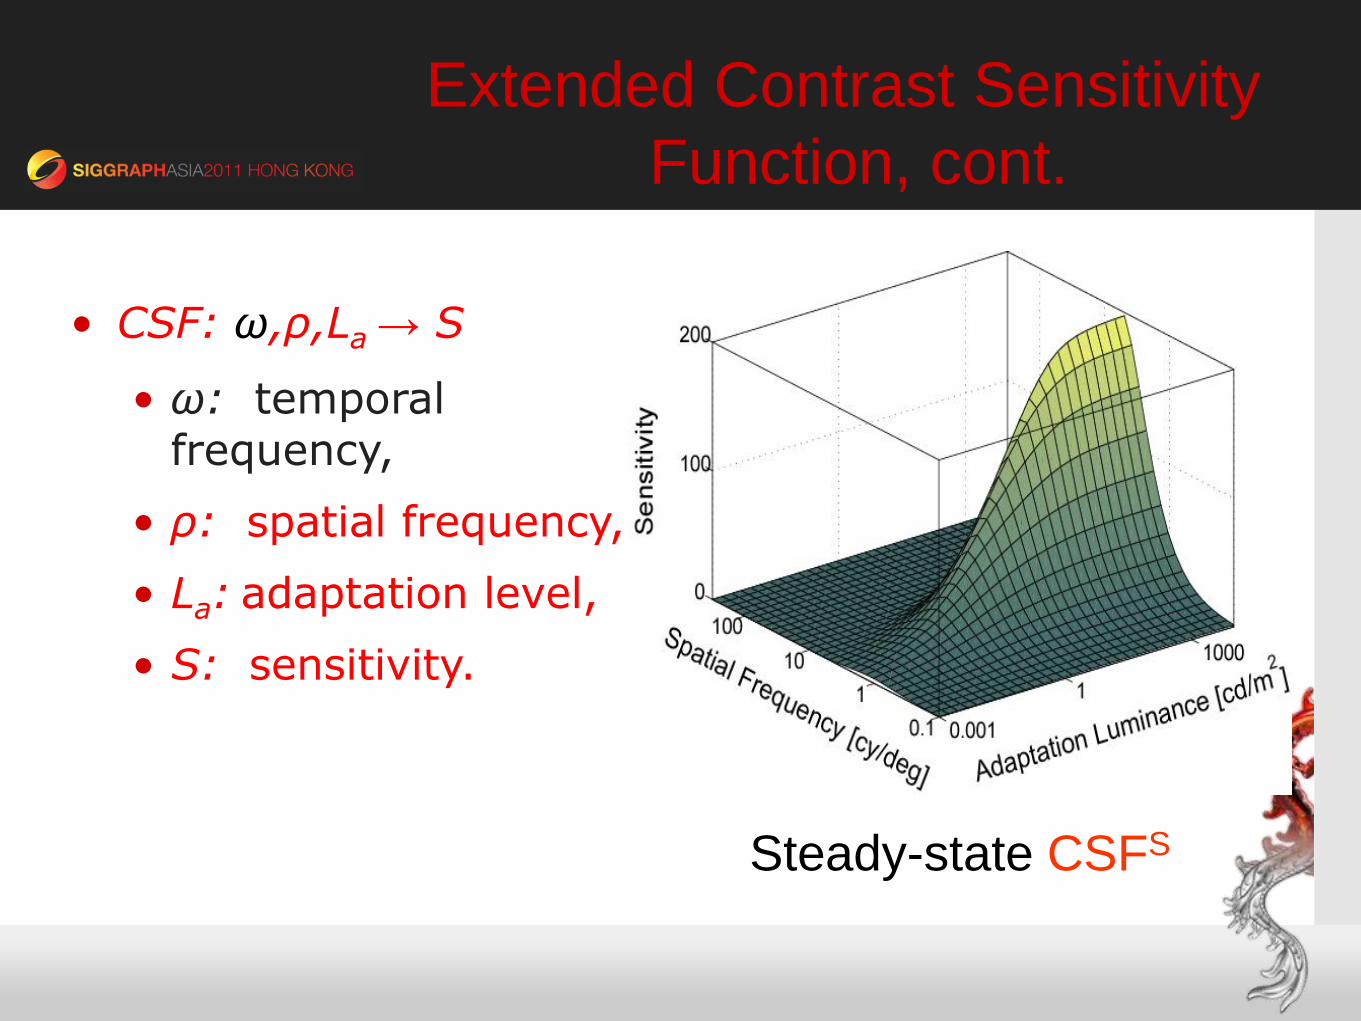
Extended Contrast Sensitivity
Function, cont.
Steady-state CSFS
• CSF: ω,ρ,La → S
• ω: temporal frequency,
• ρ: spatial frequency,
• La: adaptation level,
• S: sensitivity.
( )
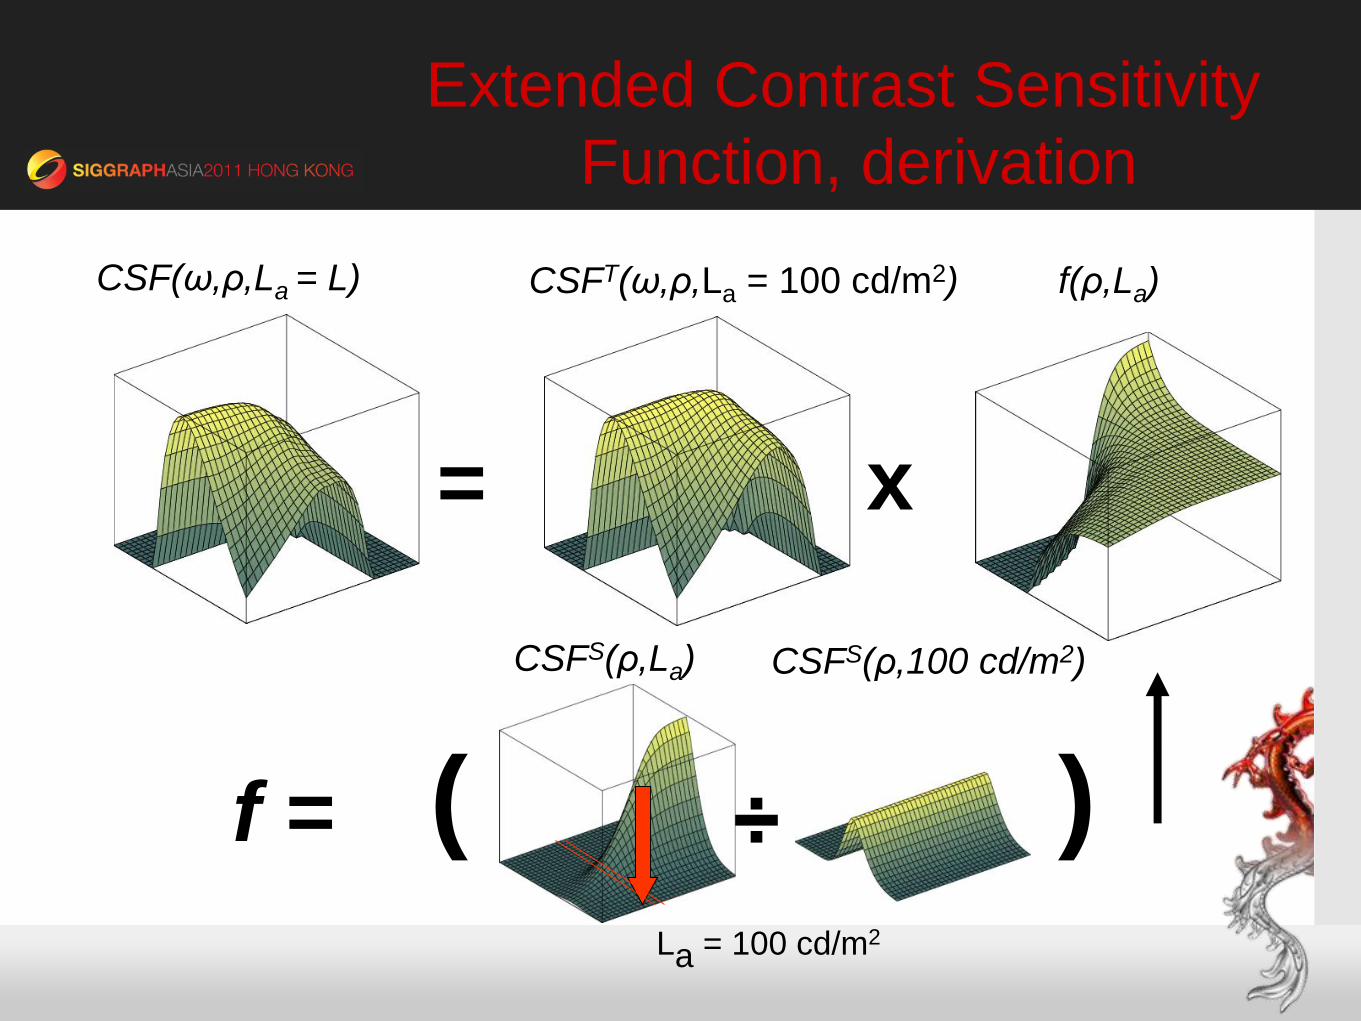
Extended Contrast Sensitivity
Function, derivation
=
CSF(ω,ρ,La = L) CSFT(ω,ρ,La = 100 cd/m2) f(ρ,La)
x
÷ f =
CSFS(ρ,La) CSFS(ρ,100 cd/m2)
La = 100 cd/m2
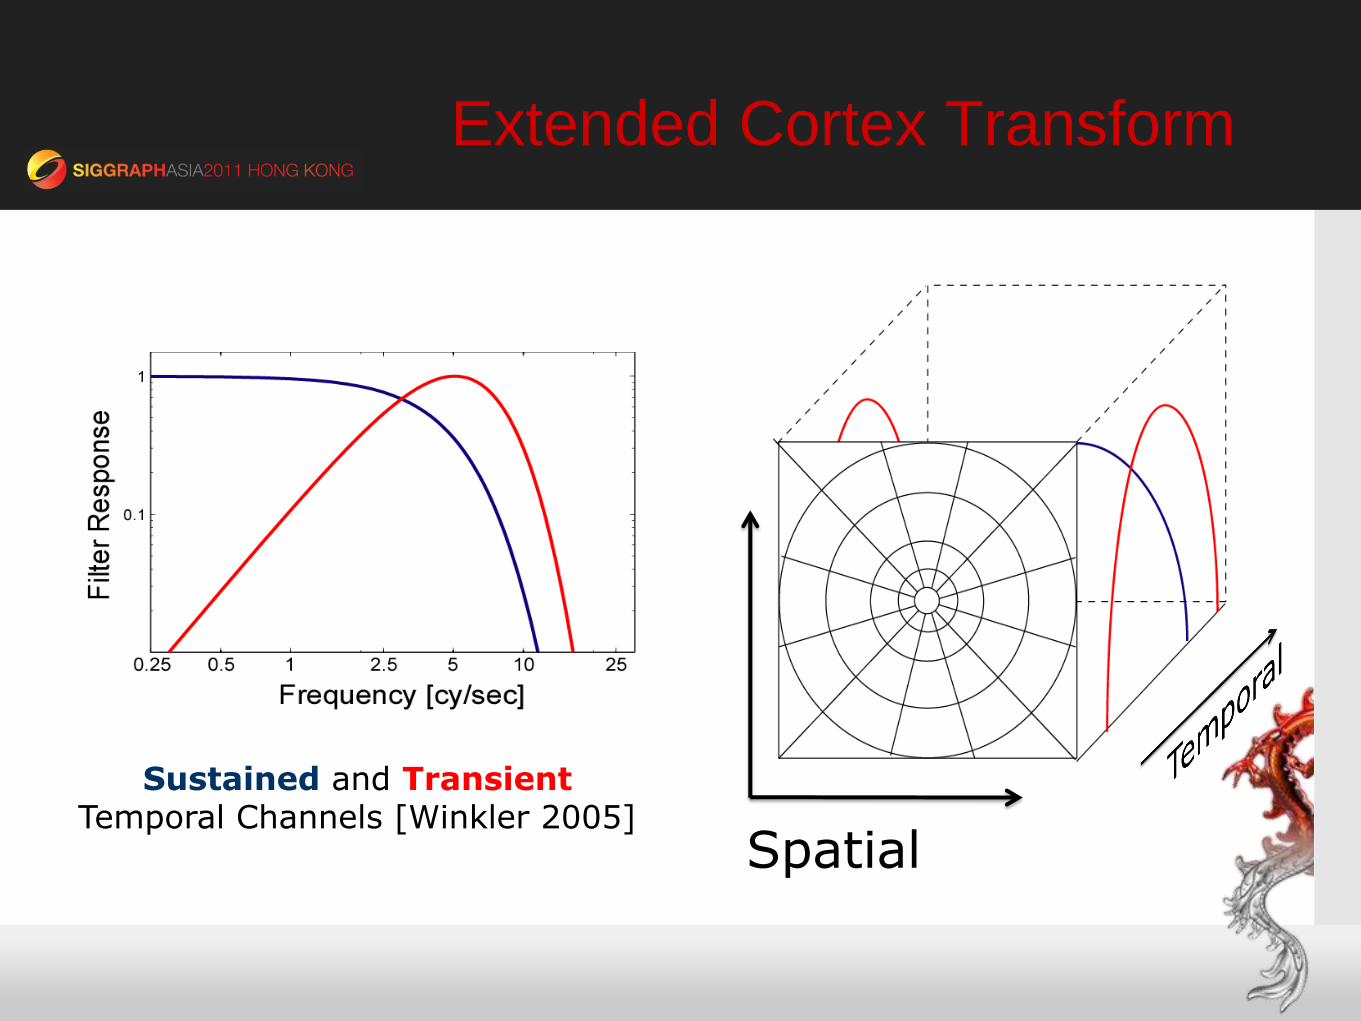
Extended Cortex Transform
Sustained and Transient Temporal Channels [Winkler 2005]
Spatial
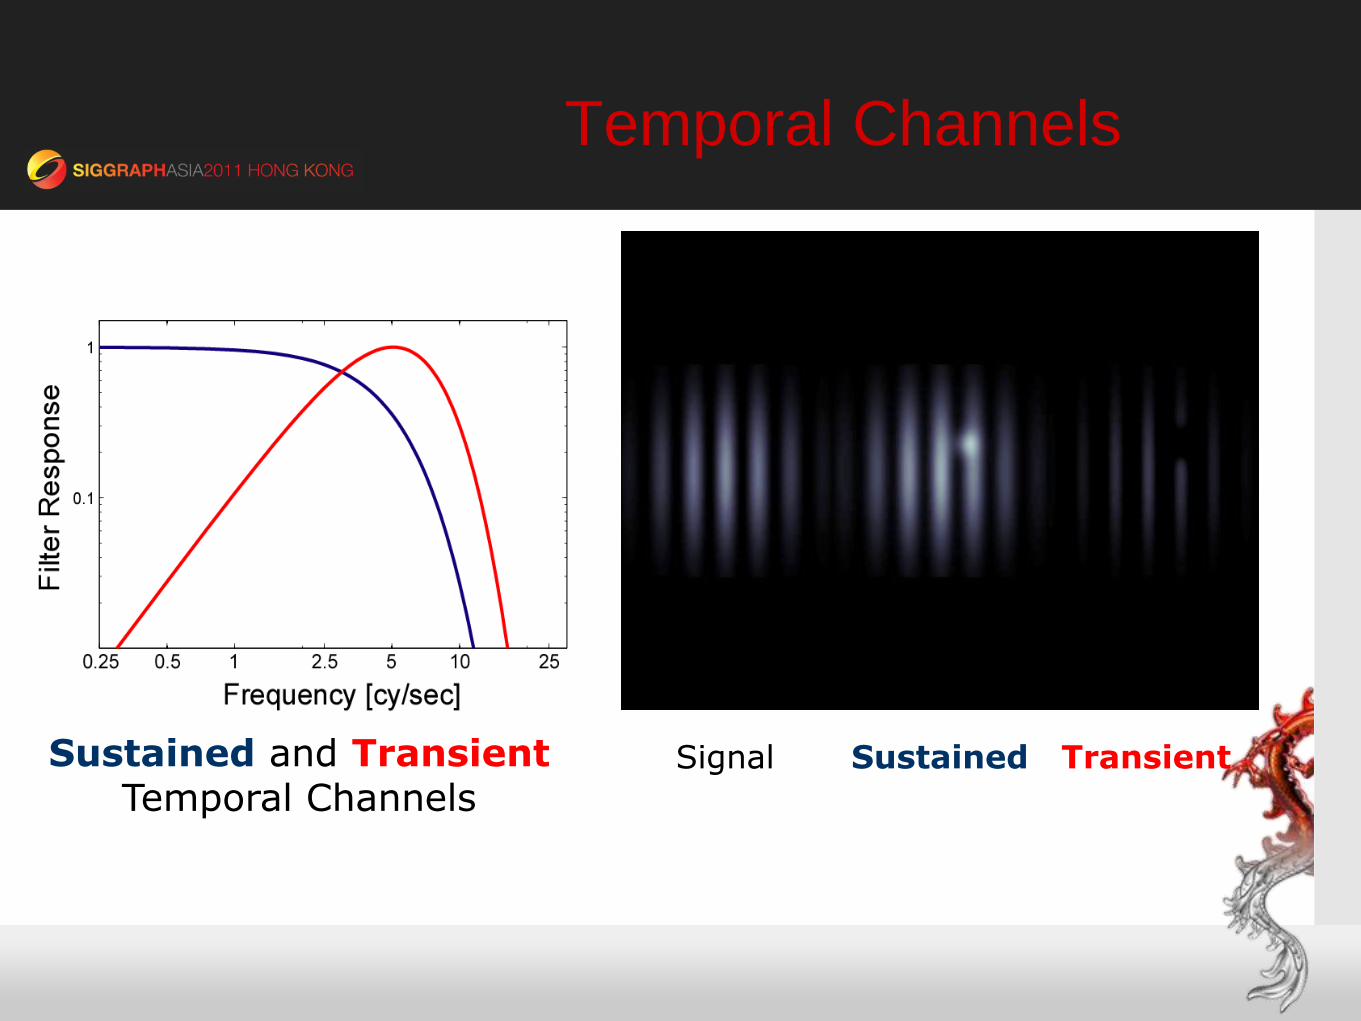
Temporal Channels
Sustained and Transient Temporal Channels
Transient Sustained Signal
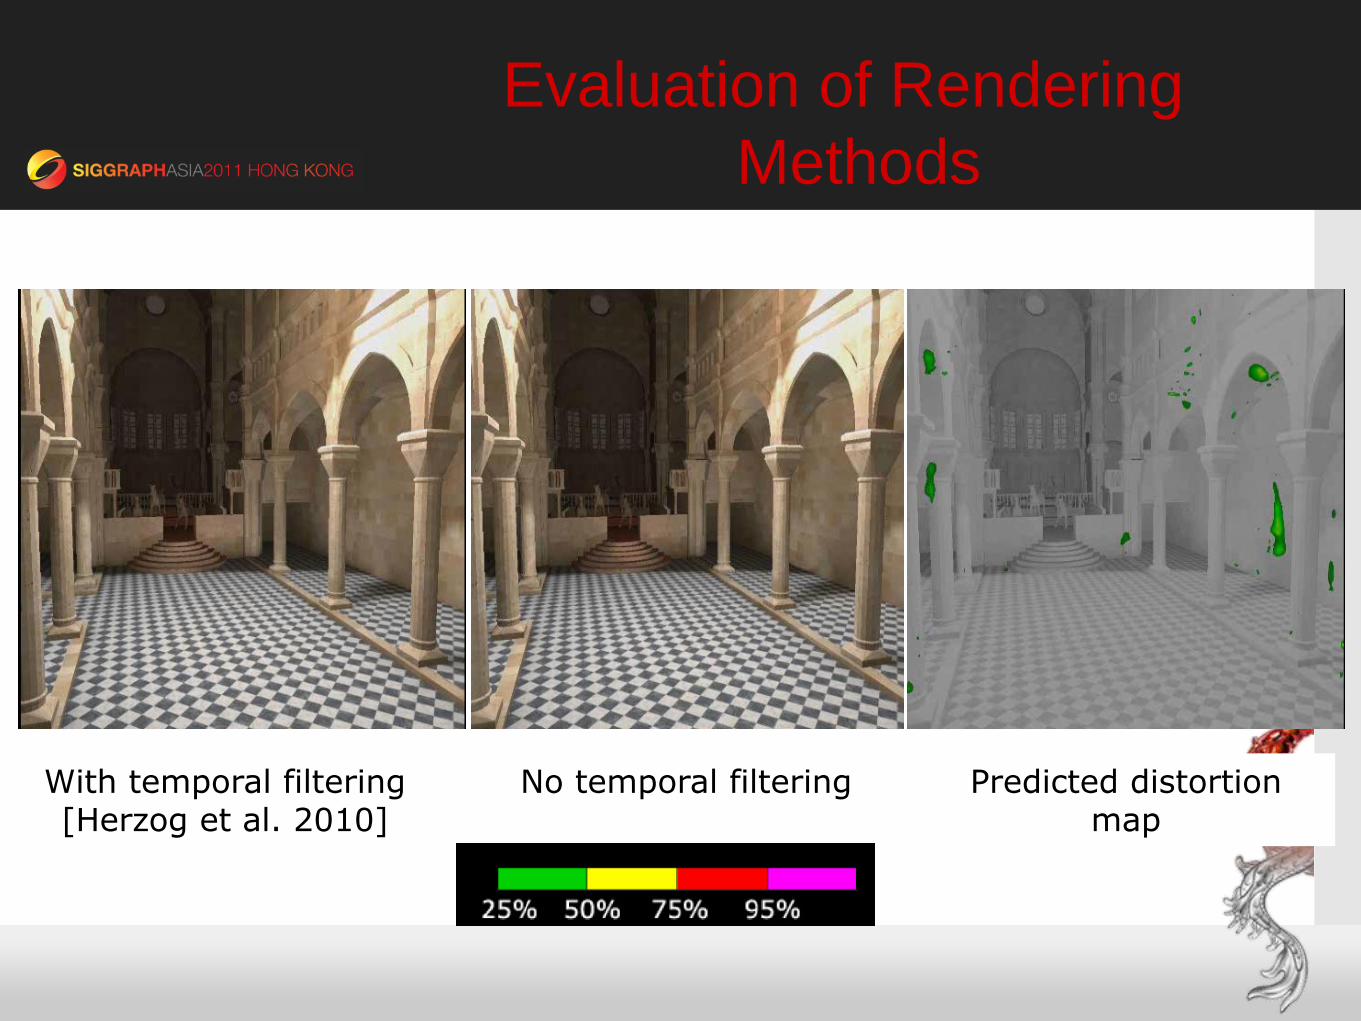
Evaluation of Rendering
Methods
No temporal filtering With temporal filtering [Herzog et al. 2010]
Predicted distortion map
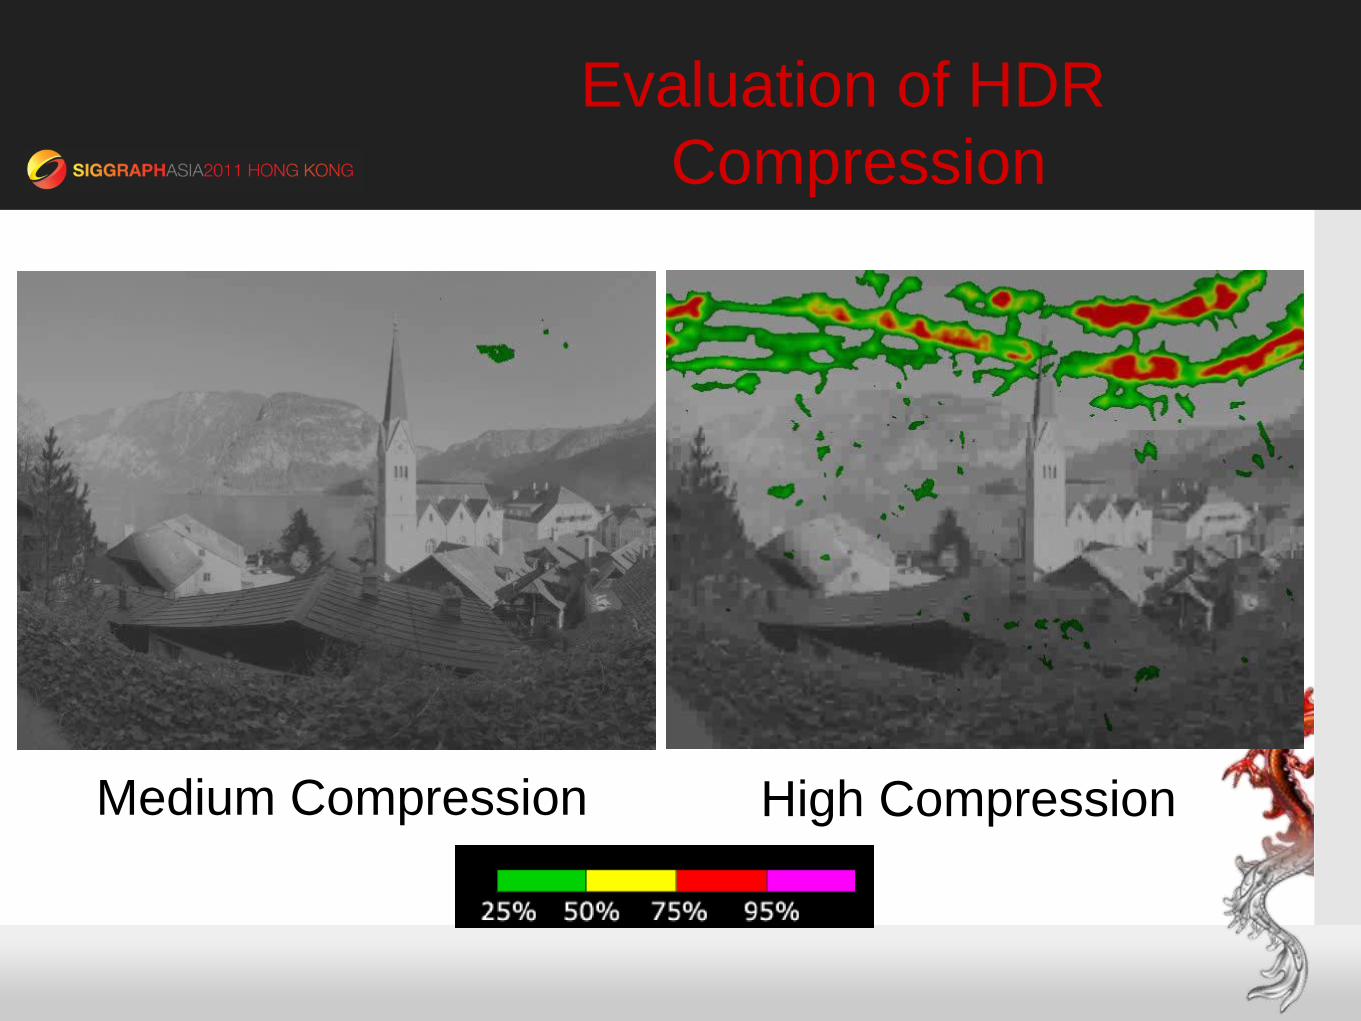
Evaluation of HDR
Compression
Medium Compression High Compression
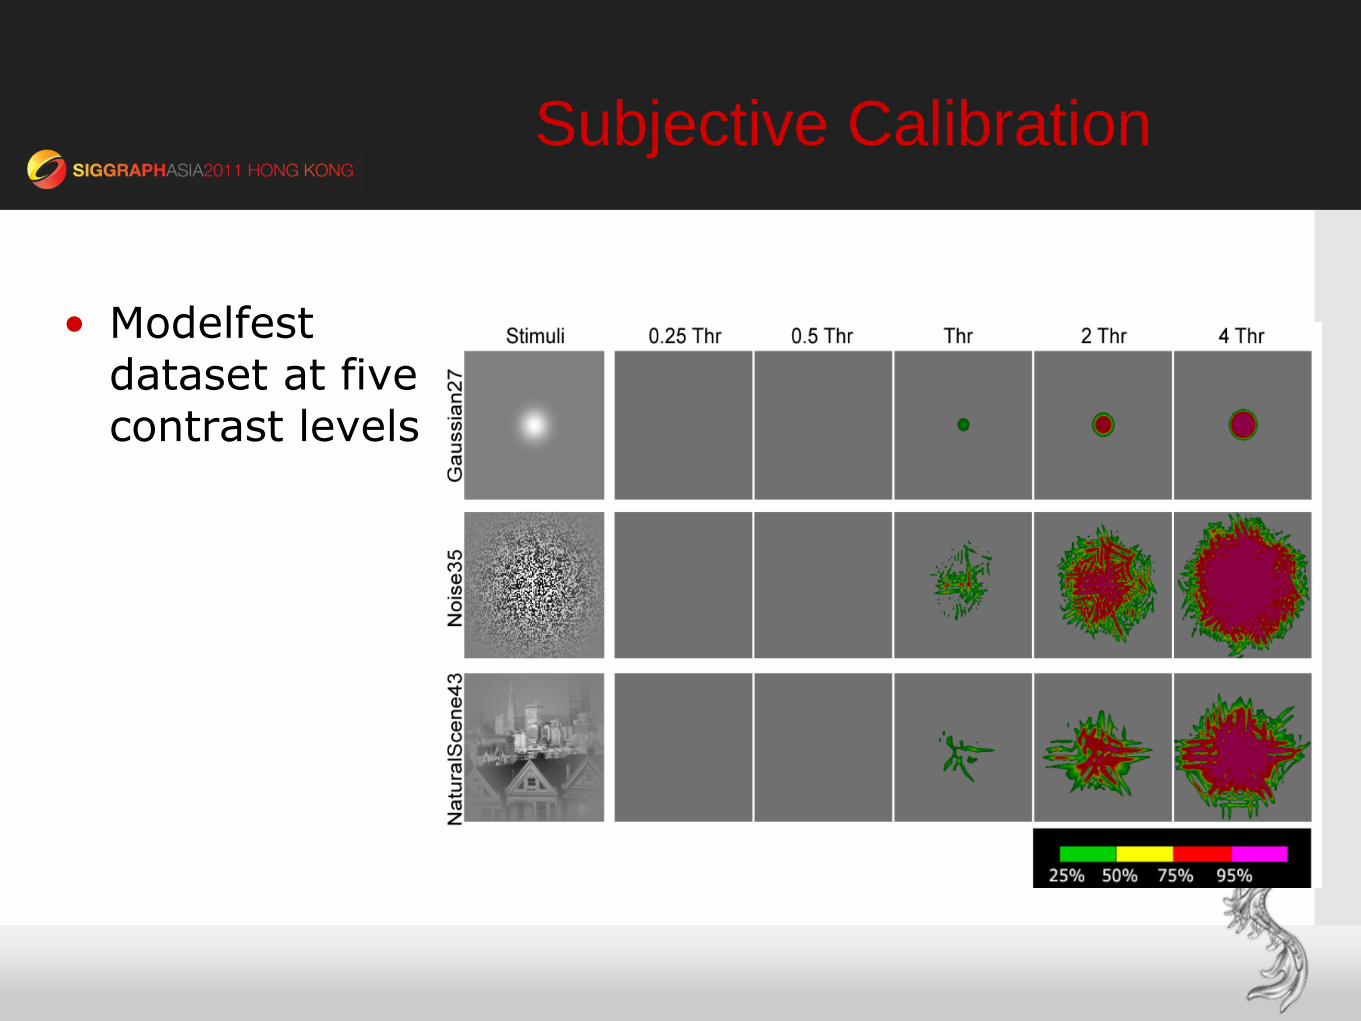
• Modelfest dataset at five contrast levels
Subjective Calibration
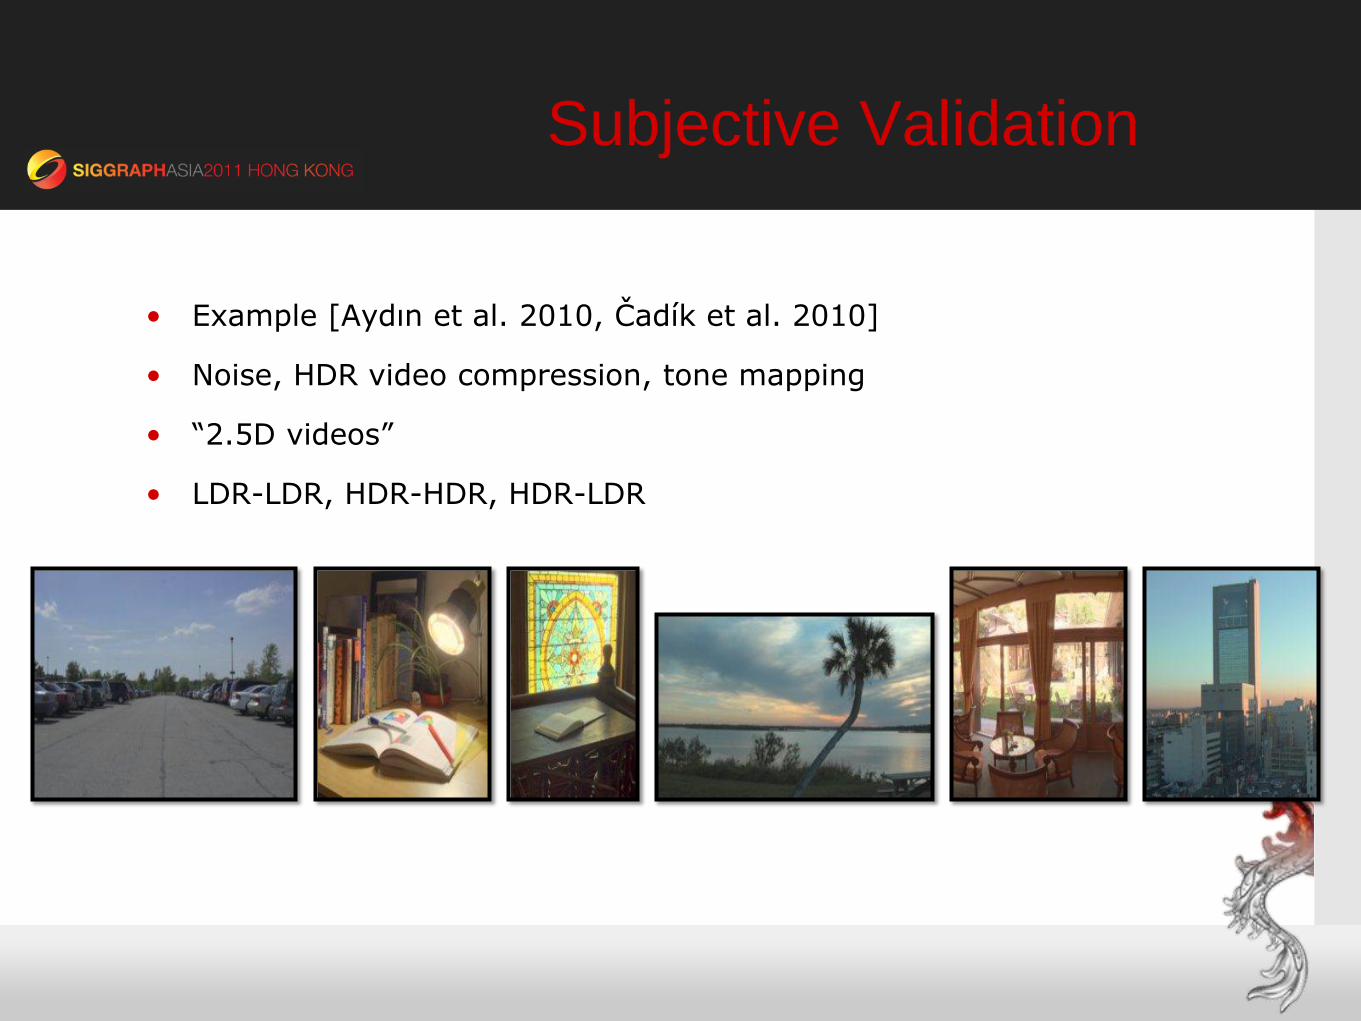
Subjective Validation
• Example [Aydın et al. 2010, Čadík et al. 2010]
• Noise, HDR video compression, tone mapping
• “2.5D videos”
• LDR-LDR, HDR-HDR, HDR-LDR
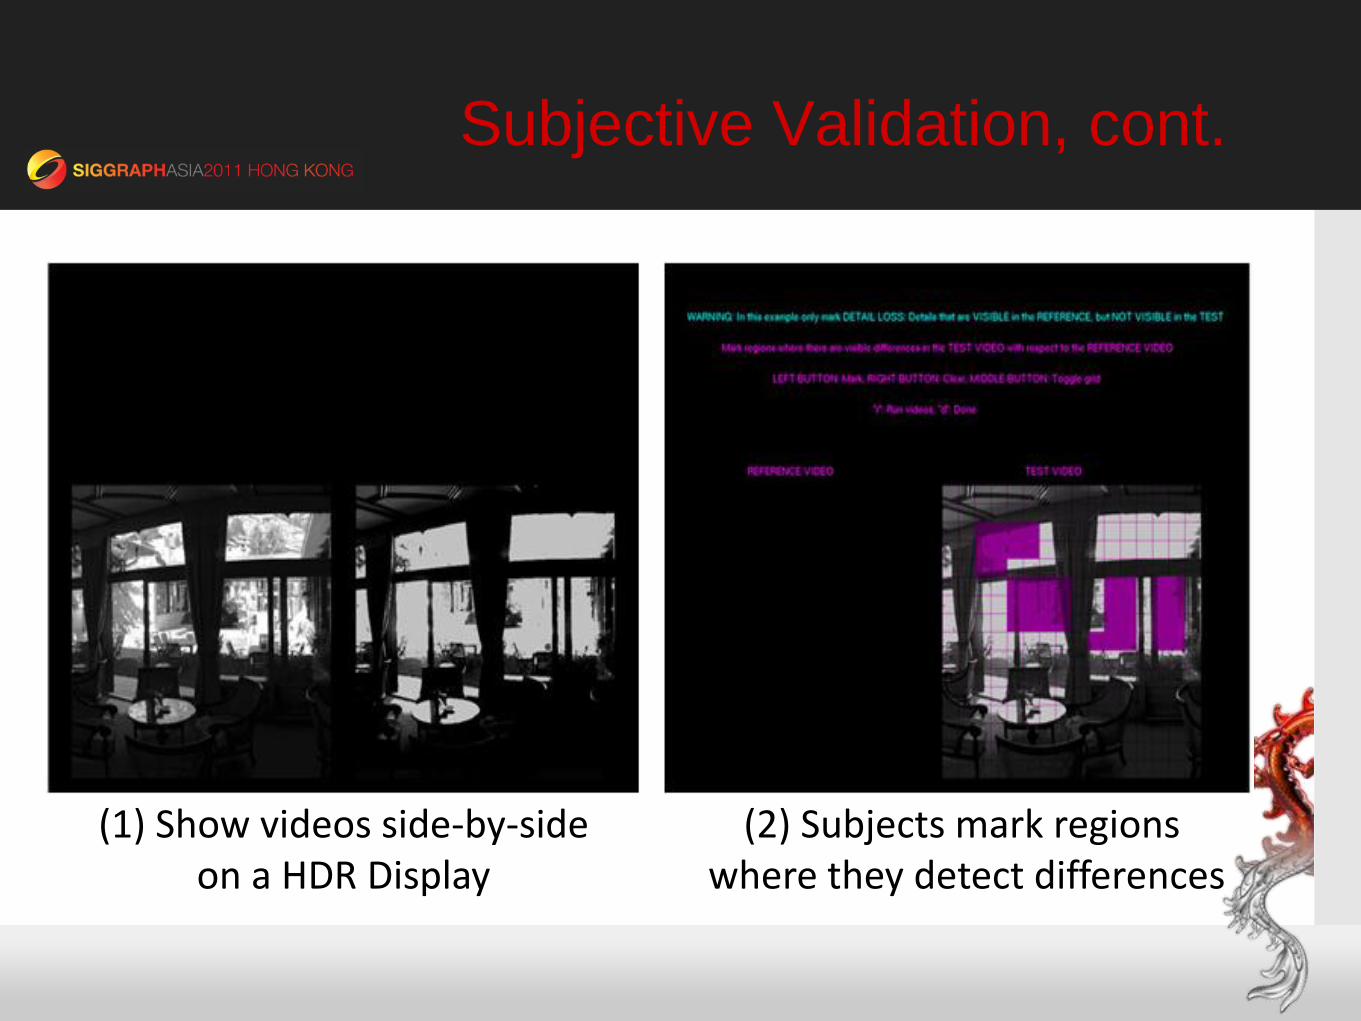
Subjective Validation, cont.
(1) Show videos side-by-side on a HDR Display
(2) Subjects mark regions where they detect differences
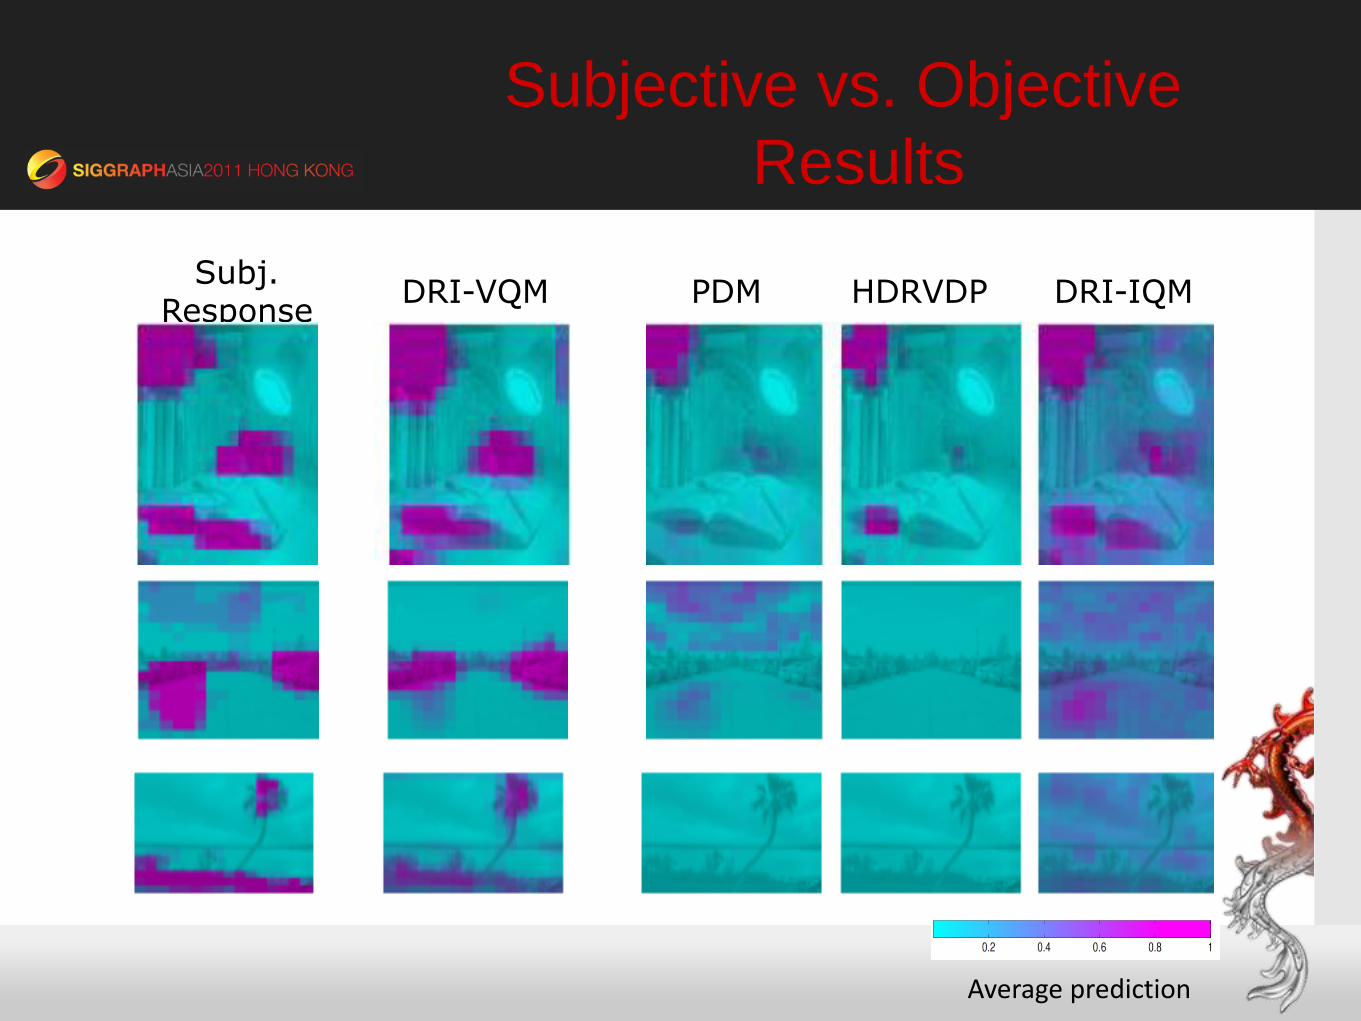
Subjective vs. Objective
Results
Subj. Response
Average prediction
DRI-VQM PDM HDRVDP DRI-IQM
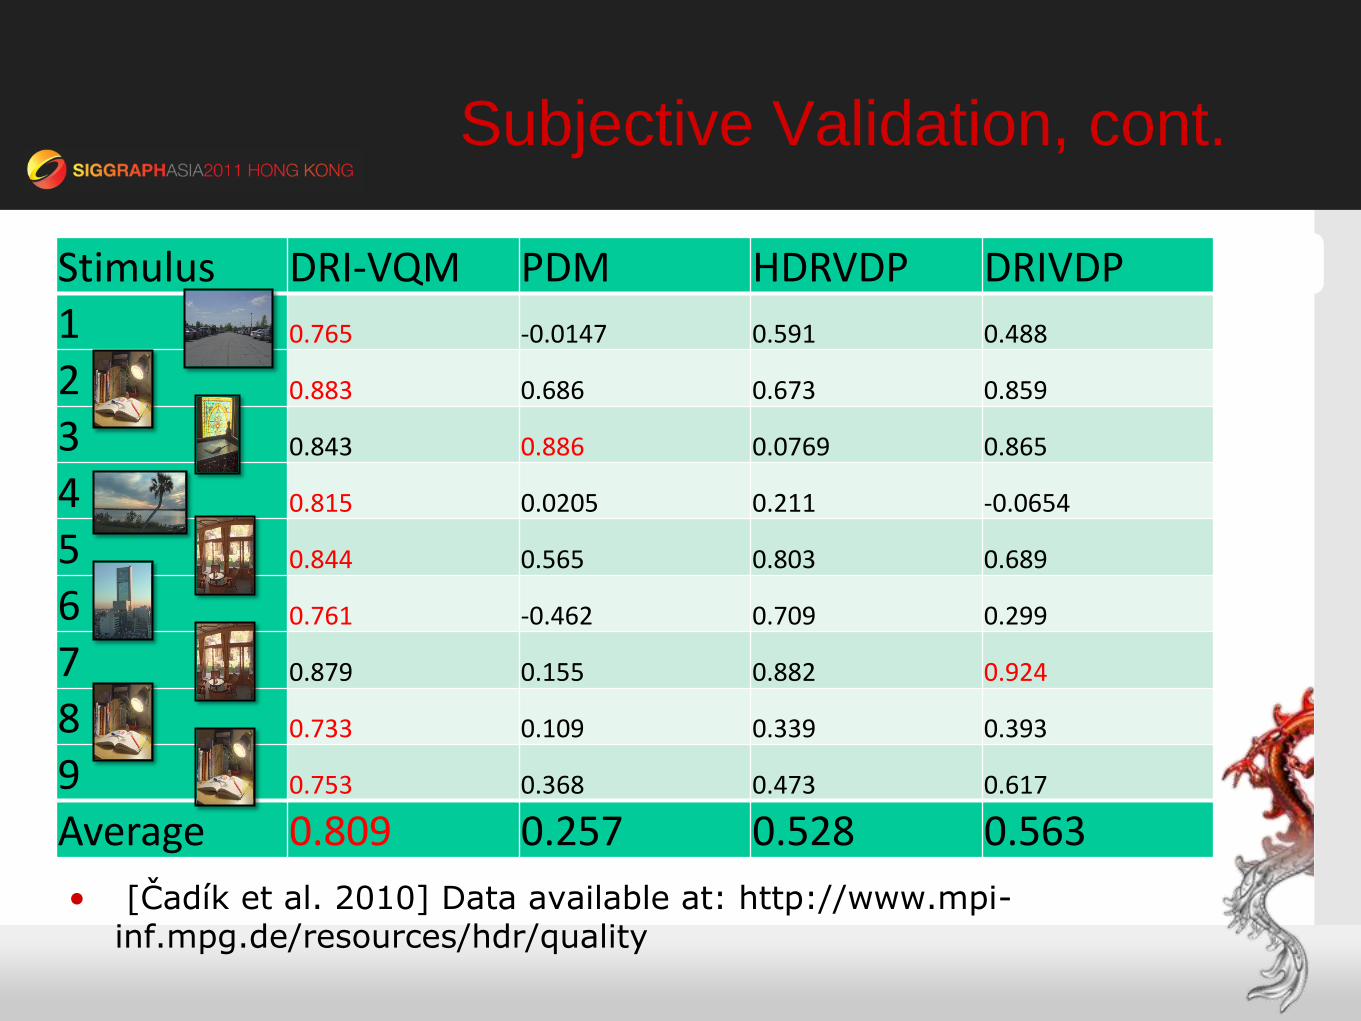
Subjective Validation, cont.
• [Čadík et al. 2010] Data available at: http://www.mpi-inf.mpg.de/resources/hdr/quality
Stimulus DRI-VQM PDM HDRVDP DRIVDP 1 0.765 -0.0147 0.591 0.488
2 0.883 0.686 0.673 0.859
3 0.843 0.886 0.0769 0.865
4 0.815 0.0205 0.211 -0.0654
5 0.844 0.565 0.803 0.689
6 0.761 -0.462 0.709 0.299
7 0.879 0.155 0.882 0.924
8 0.733 0.109 0.339 0.393
9 0.753 0.368 0.473 0.617
Average 0.809 0.257 0.528 0.563
Conclusions
• A number of established metrics are available as source code or web service
• SSIM: https://ece.uwaterloo.ca/~z70wang/research/ssim/
• HDRVDP : http://sourceforge.net/projects/hdrvdp/files/hdrvdp/
• DRI-IQM and DRI-VQM:
http://drim.mpi-inf.mpg.de/
• Researchers are starting using these metrics instead of user studies.
• Future directions:
• Metrics for retargeted images [Liu et al. 2011]
• Better HVS models [Mantiuk et al. 2011]
• Smarter distortion measures.