Traffic Calming Signs - Caltrans 06, 2012 · Traffic Calming Signs . Request to Experiment –...
70
Traffic Calming Signs Request to Experiment – Final Report Todd Greenwood, City Traffic Engineer City of Stockton Jeff Knowles, Sponsor City of Vacaville April 6, 2012
Transcript of Traffic Calming Signs - Caltrans 06, 2012 · Traffic Calming Signs . Request to Experiment –...

Traffic Calming Signs
Request to Experiment – Final Report
Todd Greenwood, City Traffic Engineer City of Stockton
Jeff Knowles, Sponsor
City of Vacaville
April 6, 2012

Request to Experiment-Final Report Page | 1
City of Stockton Traffic Calming Sign Experiment
Final Report
PROBLEM: In 2010, four years after adopting vertical measures into the City of Stockton Traffic Calming Toolbox, nearly 270 speed humps and cushions had been installed in 24 different neighborhoods. Although marked in accordance with the California Manual on Traffic Control Devices (CA-MUTCD), the City received numerous complaints from drivers claiming difficulty noticing speed hump warning signs and/or the chevron marked speed humps/cushions in the street. Local residents complained of too many traffic calming signs polluting their neighborhoods. As a possible solution to these two concerns, City staff proposed changes including two signs, “SPEED HUMPS AHEAD” to be used on street segments and “SPEED HUMP AREA” for neighborhood areas with limited access. Rather than placing “SPEED HUMP” signs at each measure, the proposal included replacing those signs with “BUMP” pavement markings installed 50 feet in advance of each speed hump or cushion. This solution was proposed since some municipalities have already adopted these variations of the W17-1 sign including City of Sacramento (see Speed Hump Program Guidelines Amended by Council 01/27/04), and Los Angeles as shown on the LADOT Community Services website http://ladot.lacity.org/tf_Speed_Humps.htm (website photo at right). None of these signs have been approved by the California Traffic Control Devices Committee (CTCDC). The City of Stockton was advised to and did submit a Request to Experiment proposing to change the signage and markings for speed humps and cushions to address the resident concerns. On February 2, 2011 the California Traffic Control Devices Committee (CTCDC) approved the City of Stockton request to experiment with traffic calming signage within six neighborhood areas and six street segments. BACKGROUND: Prior to conducting the experiment the City of Stockton installed a W17-1 Speed Hump Warning and W13-1 Advisory Speed Warning sign in advance of each vertical measure (speed hump/speed cushion/speed table). In a series of measures between intersections, the W13-1 Advisory Speed Warning signs could be eliminated on all but the first or outer most measures as per the CA-MUTCD. However, a Speed Hump Warning sign (W17-1) would still be posted in each direction at subsequent measures. In some neighborhoods this did contribute to sign pollution.

Request to Experiment-Final Report Page | 2
In addition to signs each vertical measure was, and continues to be, marked with a number of retro-reflective chevrons. Stockton maintains a dense urban forest which contributes to the visibility issues of traffic calming measures even with the retro-reflective chevrons. The 2012 California Manual on Uniform Traffic Control Devices (CA-MUTCD) provides the following guidance for use of the Speed Hump (W17-1) Warning sign including a series of humps: Section 2C.29 SPEED HUMP Sign (W17-1) Guidance: 01 The SPEED HUMP (W17-1) sign (see Figure 2C-6) should be used to give warning of a vertical deflection in the roadway that is designed to limit the speed of traffic. 02 If used, the SPEED HUMP sign should be supplemented by an Advisory Speed plaque (see Section 2C.08). Option: 03 If a series of speed humps exists in close proximity, an Advisory Speed plaque may be eliminated on all but the first SPEED HUMP sign in the series. 04 The legend SPEED BUMP may be used instead of the legend SPEED HUMP on the W17-1 sign. Support: 05 Speed humps generally provide more gradual vertical deflection than speed bumps. Speed bumps limit the speed of traffic more severely than speed humps. Other forms of speed humps include speed tables and raised intersections. However, these differences in engineering terminology are not well known by the public, so for signing purposes these terms are interchangeable.
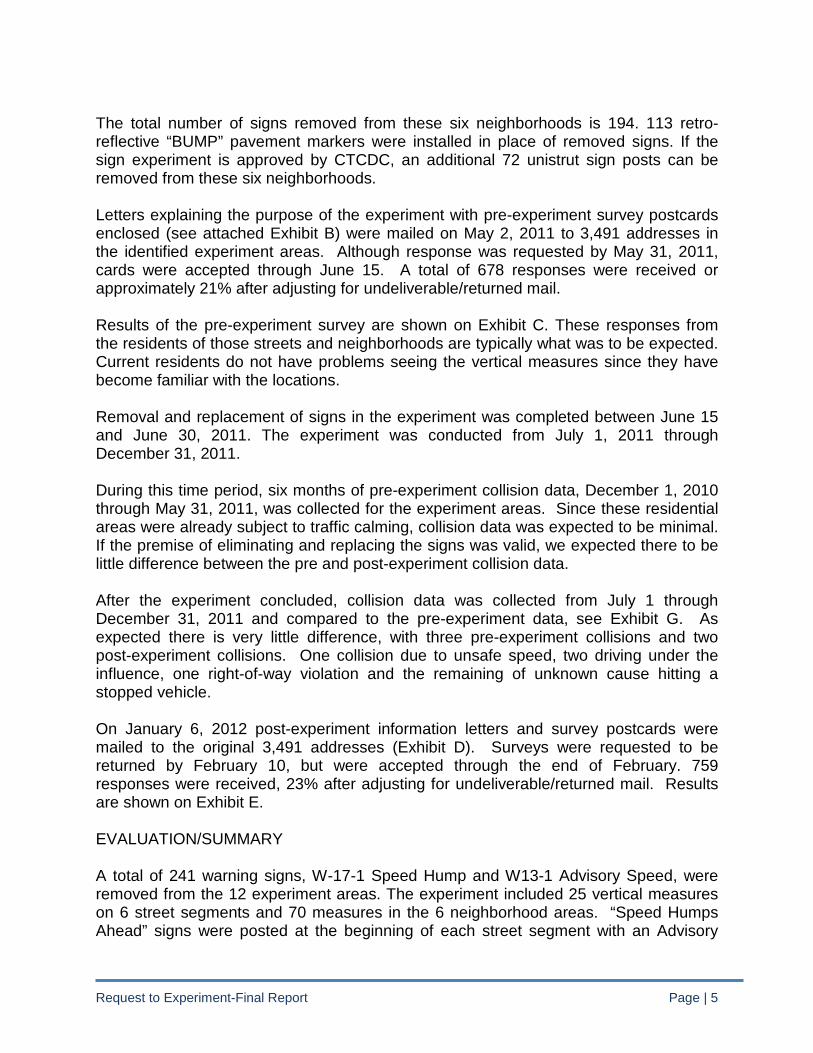
Mariposa Avenue, Stockton - 6 Speed Hump Warning Signs in each direction. (Measures are 350' to 500' apart between intersections.)
Request to Experiment-Final Report Page | 3
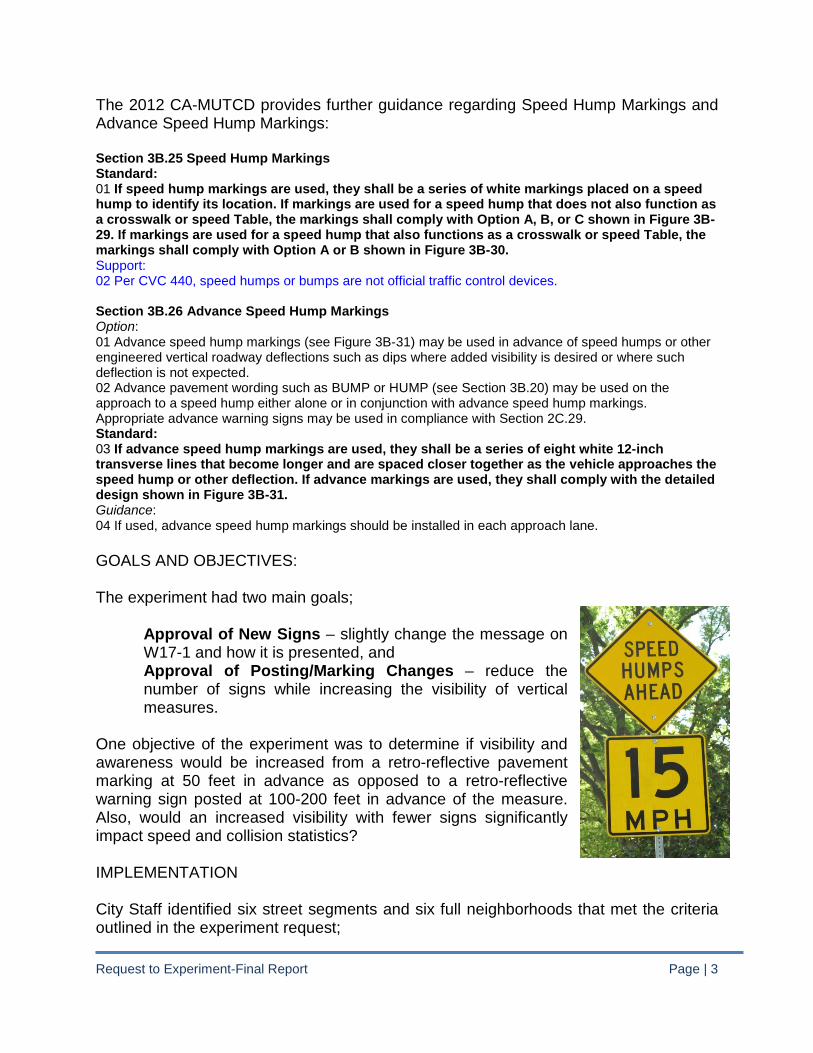
The 2012 CA-MUTCD provides further guidance regarding Speed Hump Markings and Advance Speed Hump Markings: Section 3B.25 Speed Hump Markings Standard: 01 If speed hump markings are used, they shall be a series of white markings placed on a speed hump to identify its location. If markings are used for a speed hump that does not also function as a crosswalk or speed Table, the markings shall comply with Option A, B, or C shown in Figure 3B-29. If markings are used for a speed hump that also functions as a crosswalk or speed Table, the markings shall comply with Option A or B shown in Figure 3B-30. Support: 02 Per CVC 440, speed humps or bumps are not official traffic control devices. Section 3B.26 Advance Speed Hump Markings Option: 01 Advance speed hump markings (see Figure 3B-31) may be used in advance of speed humps or other engineered vertical roadway deflections such as dips where added visibility is desired or where such deflection is not expected. 02 Advance pavement wording such as BUMP or HUMP (see Section 3B.20) may be used on the approach to a speed hump either alone or in conjunction with advance speed hump markings. Appropriate advance warning signs may be used in compliance with Section 2C.29. Standard: 03 If advance speed hump markings are used, they shall be a series of eight white 12-inch transverse lines that become longer and are spaced closer together as the vehicle approaches the speed hump or other deflection. If advance markings are used, they shall comply with the detailed design shown in Figure 3B-31. Guidance: 04 If used, advance speed hump markings should be installed in each approach lane. GOALS AND OBJECTIVES: The experiment had two main goals;
Approval of New Signs – slightly change the message on W17-1 and how it is presented, and Approval of Posting/Marking Changes – reduce the number of signs while increasing the visibility of vertical measures.
One objective of the experiment was to determine if visibility and awareness would be increased from a retro-reflective pavement marking at 50 feet in advance as opposed to a retro-reflective warning sign posted at 100-200 feet in advance of the measure. Also, would an increased visibility with fewer signs significantly impact speed and collision statistics? IMPLEMENTATION City Staff identified six street segments and six full neighborhoods that met the criteria outlined in the experiment request;

Request to Experiment-Final Report Page | 4
• Previously traffic calmed with vertical measures, • Three or more measures on a single street, • Limited access points to a network of neighborhood
streets. These areas are identified on the Vicinity Map (Exhibit A). Pre-Experiment speed surveys were conducted on March 31, 2011 in 18 locations (one on each street segment and two in each neighborhood area). These results as well as the Post-Experiment speed surveys of January 11, 2012 are shown on Exhibit F. Prior to the experiment, photos were taken of vertical measures and signage in each selected area from 100’, 150’, 200’ and 250’ from the measure. Once the experiment began after July 1, 2011, these same photos were repeated for comparison in gauging visibility. These comparisons are shown in Exhibit H. The six street segments selected for the experiment were as follows:
:Street Segment
Approx Length in Feet
Number of
Vertical Measures
Number of W17-1
Signs Removed
Number of W13-1
Signs Removed
New Ahead Sign
Added
Net Difference
Lafayette St 1940 3 8 4 5 -7 Mariposa Av 2975 6 12 6 7 -11 Mayfair Av 1900 4 8 4 3 -9 Robinhood Dr 1500 3 6 4 3 -7 Rosemarie Ln 1325 3 6 4 3 -7 Waudman Av 3000 6 8 0 2 -6 The total number of signs on these six street segments was reduced by 47. Fifty retro-reflective “BUMP” pavement legends were installed in place of the removed signs. If the sign experiment is approved by CTCDC, 24 unistrut sign posts can be removed from these six streets. The six neighborhoods identified to participate in the experiment were as follows:
Neighborhoodhood Area
Approx. Size in Sq Ft
Number of
Access Points
Number of
Vertical Measures
Number of W17-1
Signs Removed
Number of W13-1
Signs Removed
New “Area” Sign
Added
Net Differ-ence
Country Greens 4.5 mil 2 8 16 13 2 -27 LVW-Embarcadero 4.1 mil 4 13 26 24 4 -46 Little John Creek 5.7 mil 3 13 26 24 3 -47 River Oaks/River Bluff 4.5 mil 3 8 16 14 3 -27 Stonewood/Sunnyoak 5.9 mil 5 13 16 14 5 -25 Weston Ranch-Crestmore 3.9 mil 3 15 13 12 3 -22
Request to Experiment-Final Report Page | 5
The total number of signs removed from these six neighborhoods is 194. 113 retro-reflective “BUMP” pavement markers were installed in place of removed signs. If the sign experiment is approved by CTCDC, an additional 72 unistrut sign posts can be removed from these six neighborhoods. Letters explaining the purpose of the experiment with pre-experiment survey postcards enclosed (see attached Exhibit B) were mailed on May 2, 2011 to 3,491 addresses in the identified experiment areas. Although response was requested by May 31, 2011, cards were accepted through June 15. A total of 678 responses were received or approximately 21% after adjusting for undeliverable/returned mail. Results of the pre-experiment survey are shown on Exhibit C. These responses from the residents of those streets and neighborhoods are typically what was to be expected. Current residents do not have problems seeing the vertical measures since they have become familiar with the locations. Removal and replacement of signs in the experiment was completed between June 15 and June 30, 2011. The experiment was conducted from July 1, 2011 through December 31, 2011. During this time period, six months of pre-experiment collision data, December 1, 2010 through May 31, 2011, was collected for the experiment areas. Since these residential areas were already subject to traffic calming, collision data was expected to be minimal. If the premise of eliminating and replacing the signs was valid, we expected there to be little difference between the pre and post-experiment collision data. After the experiment concluded, collision data was collected from July 1 through December 31, 2011 and compared to the pre-experiment data, see Exhibit G. As expected there is very little difference, with three pre-experiment collisions and two post-experiment collisions. One collision due to unsafe speed, two driving under the influence, one right-of-way violation and the remaining of unknown cause hitting a stopped vehicle. On January 6, 2012 post-experiment information letters and survey postcards were mailed to the original 3,491 addresses (Exhibit D). Surveys were requested to be returned by February 10, but were accepted through the end of February. 759 responses were received, 23% after adjusting for undeliverable/returned mail. Results are shown on Exhibit E. EVALUATION/SUMMARY A total of 241 warning signs, W-17-1 Speed Hump and W13-1 Advisory Speed, were removed from the 12 experiment areas. The experiment included 25 vertical measures on 6 street segments and 70 measures in the 6 neighborhood areas. “Speed Humps Ahead” signs were posted at the beginning of each street segment with an Advisory

Request to Experiment-Final Report Page | 6
Speed Warning sign. The “Speed Hump Area” sign was posted with the Advisory Speed sign at the access points of each neighborhood. If the proposed signs are approved by CTCDC, a total of 96 sign posts can also be removed from these areas. 163 “BUMP” pavement legends were installed fifty feet in advance of each vertical measure to replace the signs. As expected there was very little difference between the pre-experiment and post-experiment collision data. Of the 3 pre-experiment collisions and 2 post-experiment collisions, none were the result of or involved with the traffic calming measures. The results of 18 speed surveys conducted on January 11, 2012 indicate that the 85th percentile speeds increased in 15 areas after signs were removed. Although this speed varied from approximately 1 mph up to nearly 8 mph in one location, the overall average increase was less than 3 mph. Data collected for the other 3 areas was determined to be unreliable and was not included in this assessment (see Exhibit F). Empirical data based upon the resident surveys and unsolicited comments provide mixed results. Generally the physical measures appear to be more visible with “BUMP” pavement markings (question 4). Where residents originally felt there were not too many warning signs in their neighborhoods (question 5), once the signs were removed they felt there are enough warning signs. Finally where nearly 50% of residents originally felt other drivers did not have trouble seeing the speed humps (question 8), that number has dropped by half after signs were removed. Photographic comparisons show the “BUMP” pavement markings are visible from 250’ in most locations although shade and glare do affect visibility at all distances. The photos submitted were taken during daytime hours, however all pavement markings used are retro-reflective which are easily seen during nighttime hours. Posted warning signs also are subject to similar visibility constraints of shade and glare, but are also subject to being obscured by tree and vegetation cover and parked vehicles. CONCLUSIONS/RECOMMENDATIONS Since the experiment areas were already subject to traffic calming, few conclusions can be drawn from collision data. Speed surveys offer slightly more information although it cannot be determined if 85th percentile speeds increased as a result of fewer warning signs or if there were other extenuating circumstances such as weather conditions (a wet/grey March 2011 as opposed to a dry/clear January 2012). Photographic comparisons offer some evidence of an advance and repetitive warning of the approaching vertical measure since the pavement markings can be seen easily and consistently from 250 feet. The City of Stockton would recommend continued use of the “BUMP” pavement legend to draw attention to vertical traffic calming measures.

Request to Experiment-Final Report Page | 7
Section 2C-29.01 of the CA-MUTCD 2012 uses “should” rather than “shall” in regard to usage of the W17-1 sign, which renders it as “Guidance” rather than a “Standard”. Section 3B-26.02 allows advance word legends such as “BUMP” on the approach to a speed hump either alone or in conjunction with advance speed hump markings. The only question to be resolved is whether or not the two sign modifications are acceptable to the CTCDC. There is no evidence provided from the experiment that the signs were ineffective, misunderstood, or created more problems than were resolved. Based on before and after collision data, there was no indication that changing the signs made a difference – in terms of safety. Based on the findings of this experiment, there is no indication that the proposed signs should be precluded from use. It is recommended that Section 2C.29 of the CA-MUTCD 2012 edition be revised as follows: Option: If a series of speed humps exists in close proximity, the optional “SPEED HUMPS AHEAD” sign may replace the first SPEED HUMP sign in the series provided additional warning of speed humps is provided through signs or pavement markings at the speed humps. If speed humps exist on a network of streets within an area accessible by a limited number of access points to the area, the optional SPEED HUMP AREA sign may be placed at each access point to the area provided additional warning of speed humps is provided through signs or markings at the speed humps. The CTCDC approval and ultimately Caltrans adoption of these signs could provide local municipalities with options and legitimize signs currently in use throughout the State. ::ODMA\GRPWISE\COS.PW.PW_Library:193818.1

Request to Experiment-Final Report Page | 8
Exhibits Exhibit A Vicinity Map Exhibit B Pre-Experiment Resident Survey Letter and Business Reply Mail Postcard Exhibit C Pre-Experiment Survey Results Exhibit D Post-Experiment Resident Survey Letter and Business Reply Mail Postcard Exhibit E Post Experiment Survey Results Exhibit F Pre and Post-Experiment Speed Survey Comparisons Exhibit G Pre and Post-Experiment Collision Comparisons Exhibit H Pre and Post-Experiment Photographic Comparisons

Vicinity Map
Traffic Calming Experiment Locations
Country Greens Neighborhood Speed Hump “Area” Sign
LVW-Embarcadero Neighborhood Speed Hump “Area” Sign
Little Johns Creek Neighborhood Speed Hump “Area” Sign
River Oaks/River Bluff Neighborhood Speed Hump “Area” Sign
Stonewood/Sunnyoak Neighborhood Speed Hump “Area” Sign
Weston Ranch-Crestmore Neighborhood Speed Hump “Area” Sign
Caldwell Village-Monterey Area - Mariposa Av Speed Humps “Ahead” Sign
Lafayette Park Area - Lafayette St Speed Humps “Ahead” Sign
Mayfair West Area - Mayfair Av Speed Humps “Ahead” Sign
Sherwood Manor Area - Robinhood Dr Speed Humps “Ahead” Sign
Oak Grove Area - Waudman Av Speed Humps “Ahead” Sign
Venetian Bridges-Angelico Area - Rosemarie Ln Speed Humps „Ahead” Sign
Exhibit A


Speed Survey ComparisonsExhibit F
Location Limit 1 Limit 2 Speed LimitBi-Directional
Volume
Average Speed
(EB or NB) 85th %
Average Speed
(WB or SB) 85th %
Mariposa Av Manchester Av Kensington Wy 25 267 21 24.8 21 25.9
Mariposa Av Manchester Av Kensington Wy 25 231 21 27 21 27.5
Waudman Av Brattle Pl Blue Fox Wy 25 1485 23 27.8 23.2 26.8
Waudman Av Brattle Pl Blue Fox Wy 25 1572 24 29.8 25 30.3
Mayfair Av Claremont Av El Dorado St 25 765 36 44.5 36 43.2
Mayfair Av Claremont Av El Dorado St 25 680 22 27.8 23 28.3
Robinhood Dr Banbury Dr Ridgeway Av 35 1681 27 32 27 31.7
Robinhood Dr Banbury Dr Ridgeway Av 35 1483 24 29.6 27 33.3
Rose Marie Ln Venezia Bl Piccardo Cl 30 3051 26 30.4 26 29.5
Rose Marie Ln Venezia Bl Piccardo Cl 30 2920 27 32.4 27 32.6
Lafayette St Golden Gate Av Broadway Av 25 698 26 29.2 26 30.4
Lafayette St Golden Gate Av Broadway Av 25 685 27 33.8 26 33.4
Togninali Ln Osceola Kimball Ln 25 1443 23 28.4 24 30.1
Togninali Ln Osceola Kimball Ln 25 1363 27 33.6 28 34.4
Togninali Ln Kimball Ln Yutan Ln 25 1491 23 27.8 23 27.3
Togninali Ln Kimball Ln Yutan Ln 25 1276 25 30 25 29.6
Sutherland Dr Springriver Cl (W) Springriver Cl (E) 25 1100 22 27.8 22 28.6
Sutherland Dr Springriver Cl (W) Springriver Cl (E) 25 1046 22 29.7 24 30.3
Bluegrass Dr Warm Springs Cl Deer Creek Cl 25 1194 26 32 26 31.4
Bluegrass Dr Warm Springs Cl Deer Creek Cl 25 1104 30 37 28 34.5
Forteen Mile Dr Peterburg Cl Cumberland Pl 30 717 45 52.3 45 55.2
Forteen Mile Dr Peterburg Cl Cumberland Pl 30 620 28 34.6 28 35.7
Sea Gull Ln Land View Dr Morgan Pl 25 985 25 29.2 25 28.4
Sea Gull Ln Land View Dr Morgan Pl 25 623 28 33.9 26 32.5
River Bluff Ln Whistler Wy River Oaks Dr 25 888 23 26.8 23 27.3
River Bluff Ln Whistler Wy River Oaks Dr 25 807 24 30.2 25 29.6
River Oaks Dr Point Reys Cl River Falls Cl 25 647 22 26.6 23 25.7
River Oaks Dr Point Reys Cl River Falls Cl 25 562 27 34.5 21 27.3
Ponce DeLeon Dr Glenbriar Dr Oak Knoll Ct 25 3359 26 30.1 26 30.7
Ponce DeLeon Dr Glenbriar Dr Oak Knoll Ct 25 2754 20 24.3 21 24.8
Sunnyoak Wy Spring Oak Wy Valley Oak Dr 25 865 25 29.8 25 30.7
Sunnyoak Wy Spring Oak Wy Valley Oak Dr 25 797 27 33.5 27 32.8
Mist Trail Dr Paintbrush Dr Wesley Ln 25 402 20 25 20 24
Mist Trail Dr Paintbrush Dr Wesley Ln 25 367 21 27.4 20 25.7
Boo Ln Paintbrush Dr Wesley Ln 25 294 21 26.1 21 26.8
Boo Ln Paintbrush Dr Wesley Ln 25 233 22 28.9 20 27.1
PRE SURVEYS - Thursday March 31, 2011 BOLD = Increase Document #172727POST SURVEYS - Tuesday Jan. 10, 2012 * = Overall Decrease

Request to Experiment Traffic Calming SignsPre/Post Collision Stats
Exhibit G
Location Limit 1 Limit 2SegmentLength ADT
Dateof
ADT
CollisionRate per
MVM#
Collisions
Due toUnsafeSpeed
Mariposa Av Pershing Av Dwight Wy 0.57 267 3/31/11 0Mariposa Av Pershing Av Dwight Wy 0.57 231 3/31/11 0Waudman Av Bainbridge Pl Don Av 0.58 1485 3/31/11 6.42 1Waudman Av Bainbridge Pl Don Av 0.58 1572 3/31/11 0Mayfair Av Claremont Av El Dorado St 0.26 765 3/31/11 0Mayfair Av Claremont Av El Dorado St 0.26 680 3/31/11 0Robinhood Dr El Dorado St Holiday 0.44 1681 3/31/11 0Robinhood Dr El Dorado St Holiday 0.44 1483 3/31/11 0Rose Marie Ln Venezia Bl Romano Dr 0.26 3051 3/31/11 0Rose Marie Ln Venezia Bl Romano Dr 0.26 2920 3/31/11 7.18 1Lafayette St Sequoia Ct Garden Av 0.51 698 3/31/11 0Lafayette St Sequoia Ct Garden Av 0.51 685 3/31/11 0Togninali Ln Pock Ln 99 Frntg 0.62 1443 3/31/11 0Togninali Ln Pock Ln 99 Frntg 0.62 1363 3/31/11 0Sutherland Dr Springriver Cl (E) Blue Grass 0.15 1100 3/31/11 0Sutherland Dr Springriver Cl (E) Blue Grass 0.15 1046 3/31/11 0Bluegrass Dr Castle Oaks Sutherland 0.46 1194 3/31/11 9.9 1Bluegrass Dr Castle Oaks Sutherland 0.46 1104 3/31/11 0Fourteen Mile Dr Petersburg Cl (W) Cumberland Pl 0.48 717 3/31/11 0Fourteen Mile Dr Petersburg Cl (W) Cumberland Pl 0.48 620 3/31/11 0Sea Gull Ln Land View Dr Morgan Pl 0.24 985 3/31/11 0Sea Gull Ln Land View Dr Morgan Pl 0.24 623 3/31/11 0River Bluff Ln Whistler Wy River Oaks Dr 0.21 888 3/31/11 0River Bluff Ln Whistler Wy River Oaks Dr 0.21 807 3/31/11 0River Oaks Dr Whistler Wy River Bluff Ln 0.46 647 3/31/11 0River Oaks Dr Whistler Wy River Bluff Ln 0.46 562 3/31/11 0Ponce DeLeon Dr Davis Rd Lower Sacramento 0.5 3359 3/31/11 0Ponce DeLeon Dr Davis Rd Lower Sacramento 0.5 2754 3/31/11 3.97 1Sunnyoak Wy Stonewood Dr Lower Sacramento 0.29 865 3/31/11 0Sunnyoak Wy Stonewood Dr Lower Sacramento 0.29 797 3/31/11 0Mist Trail Dr Paintbrush Dr Abruzzi Cl 0.58 402 3/31/11 0Mist Trail Dr Paintbrush Dr Abruzzi Cl 0.58 367 3/31/11 0Boo Ln William Moss Blvd Warlow Ln 0.25 294 3/31/11 73.4 1 1Boo Ln William Moss Blvd Warlow Ln 0.25 233 3/31/11 0
POST Collision Stats: 7/1/2011 - 12/31/2011PRE Collision Stats: 12/01/10 - 5/31/2011

Lafayette Park – Lafayette St 100’ Before and After
Exhibit H Page 1 of 48

Lafayette Park – Lafayette St 150’ Before and After
Exhibit H Page 2 of 48

Lafayette Park – Lafayette St 200’ Before and After
Exhibit H Page 3 of 48

Lafayette Park – Lafayette St 250’ Before and After
Exhibit H Page 4 of 48

Caldwell Village – Mariposa Av 100 feet – Before and After
Exhibit H Page 5 of 48

Caldwell Village – Mariposa Av 150 feet – Before and After
Exhibit H Page 6 of 48

Caldwell Village – Mariposa Av 200 feet – Before and After
Exhibit H Page 7 of 48

Caldwell Village – Mariposa Av 250 feet – Before and After
Exhibit H Page 8 of 48

Mayfair West – Mayfair Av 100 feet – Before and After
Exhibit H Page 9 of 48

Mayfair West – Mayfair Av 150 feet – Before and After
Exhibit H Page 10 of 48

Mayfair West – Mayfair Av 200 feet – Before and After
Exhibit H Page 11 of 48

Mayfair West – Mayfair Av 250 feet – Before and After
Exhibit H Page 12 of 48

Sherwood Manor Area – Robinhood Drive 100 Feet – Before and After
Exhibit H Page 13 of 48

Sherwood Manor Area – Robinhood Drive 150 Feet – Before and After
Exhibit H Page 14 of 48

Sherwood Manor Area – Robinhood Drive 200 Feet – Before and After
Exhibit H Page 15 of 48

Sherwood Manor Area – Robinhood Drive 250 Feet – Before and After
Exhibit H Page 16 of 48
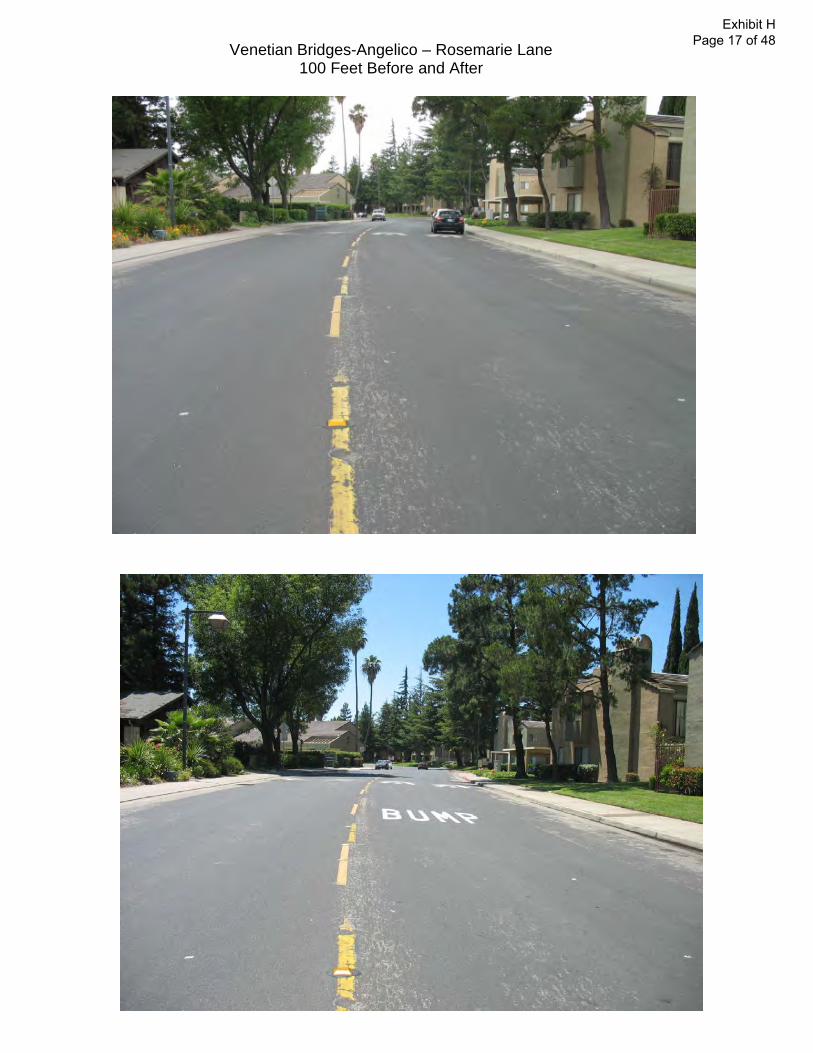
Venetian Bridges-Angelico – Rosemarie Lane 100 Feet Before and After
Exhibit H Page 17 of 48

Venetian Bridges-Angelico – Rosemarie Lane 150 Feet Before and After
Exhibit H Page 18 of 48

Venetian Bridges-Angelico – Rosemarie Lane 200 Feet Before and After
Exhibit H Page 19 of 48

Venetian Bridges-Angelico – Rosemarie Lane 250 Feet Before and After
Exhibit H Page 20 of 48

Oak Grove – Waudman Av 100 feet – Before and After Photos
Exhibit H Page 21 of 48

Oak Grove – Waudman Av 150 feet – Before and After Photos
Exhibit H Page 22 of 48

Oak Grove – Waudman Av 200 feet – Before and After Photos
Exhibit H Page 23 of 48

Oak Grove – Waudman Av 250 feet – Before and After Photos
Exhibit H Page 24 of 48

Country Greens Area – Blue Grass Dr 100 feet – Before and After
Exhibit H Page 25 of 48

Country Greens Area – Blue Grass Dr 150 feet – Before and After
Exhibit H Page 26 of 48

Country Greens Area – Blue Grass Dr 200 feet – Before and After
Exhibit H Page 27 of 48

Country Greens Area – Blue Grass Dr 250 feet – Before and After
Exhibit H Page 28 of 48

Lincoln Village West – Embarcadero Fourteen Mile Drive
100 feet Before and After
Exhibit H Page 29 of 48

Lincoln Village West – Embarcadero Fourteen Mile Drive
150 feet Before and After
Exhibit H Page 30 of 48
Lincoln Village West – Embarcadero Fourteen Mile Drive
200 feet Before and After
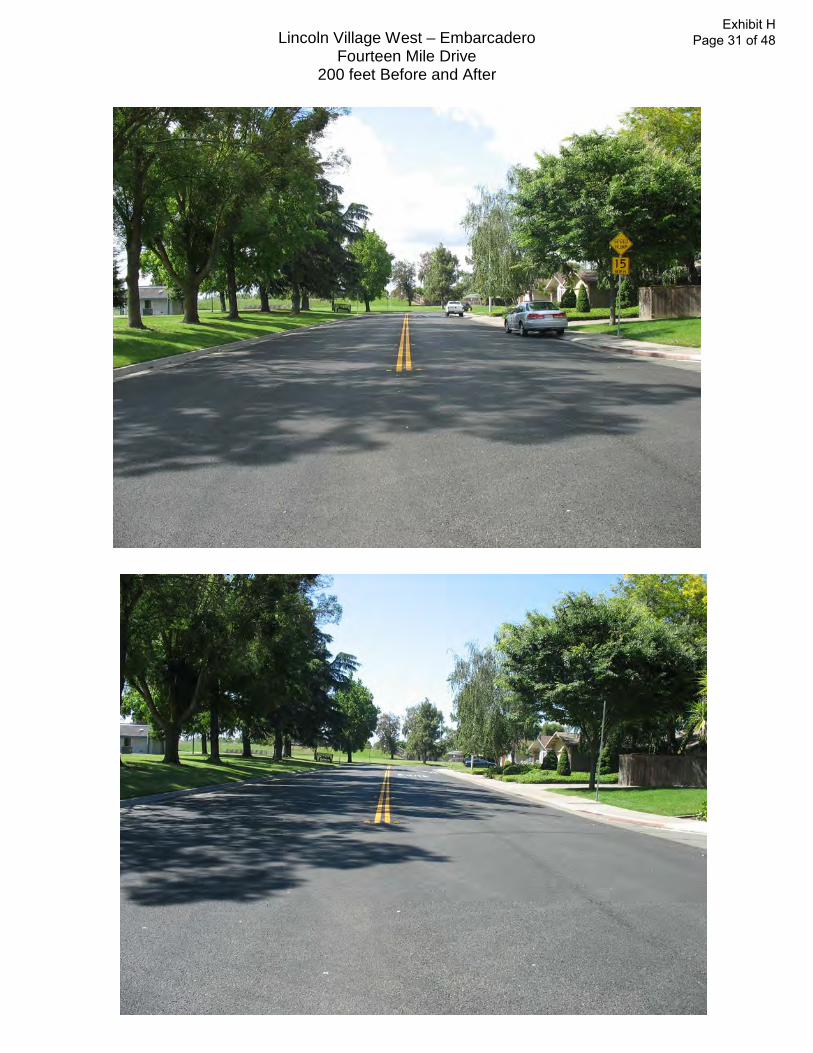
Exhibit H Page 31 of 48
Lincoln Village West – Embarcadero Fourteen Mile Drive
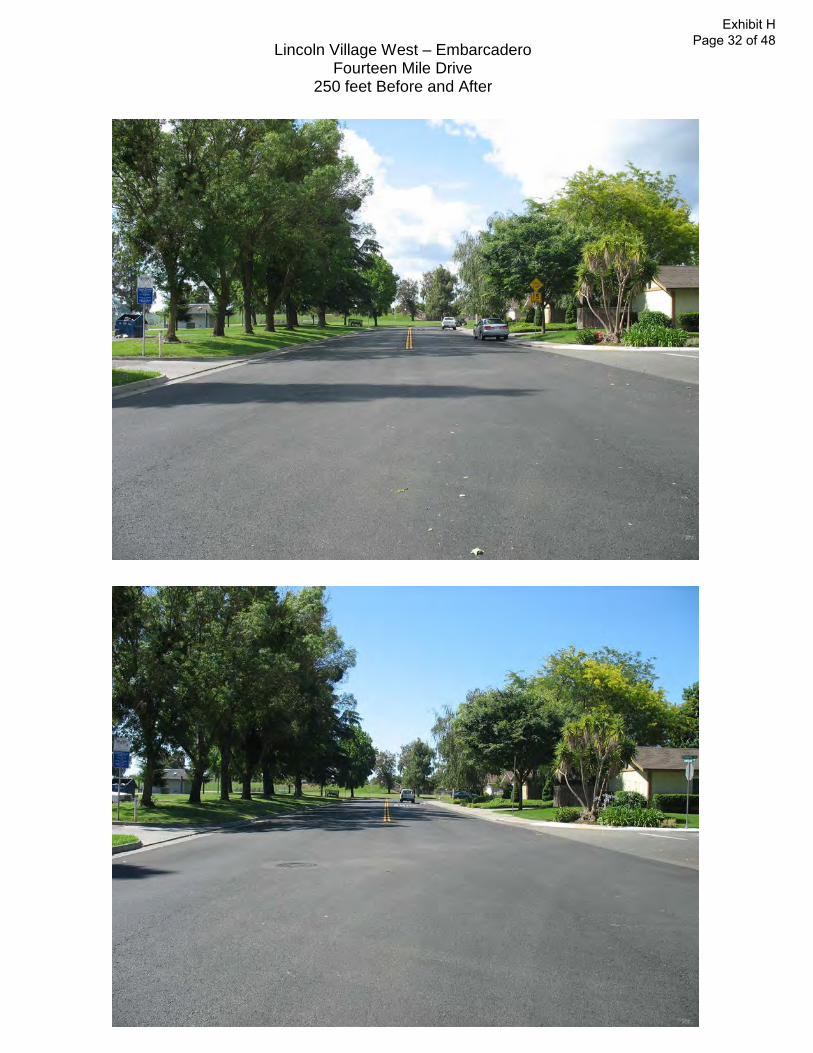
250 feet Before and After
Exhibit H Page 32 of 48

Little Johns Creek – Togninali Ln 100 feet – Before and After
Exhibit H Page 33 of 48

Little Johns Creek – Togninali Ln 150 feet – Before and After
Exhibit H Page 34 of 48

Little Johns Creek – Togninali Ln 200 feet – Before and After
Exhibit H Page 35 of 48

Little Johns Creek – Togninali Ln 250 feet – Before and After
Exhibit H Page 36 of 48

River Oaks-River Bluff – Creek Trail Ci 100 feet Before and After
Exhibit H Page 37 of 48

River Oaks-River Bluff – Creek Trail Ci 150 feet Before and After
Exhibit H Page 38 of 48

River Oaks-River Bluff – Creek Trail Ci 200 feet Before and After
Exhibit H Page 39 of 48

River Oaks-River Bluff – Creek Trail Ci 250 feet Before and After
Exhibit H Page 40 of 48

Stonewood-Sunnyoak – Golden Oak Wy 100 feet Before and After
Exhibit H Page 41 of 48

Stonewood-Sunnyoak – Golden Oak Wy 150 feet Before and After
Exhibit H Page 42 of 48

Stonewood-Sunnyoak – Golden Oak Wy 200 feet Before and After
Exhibit H Page 43 of 48
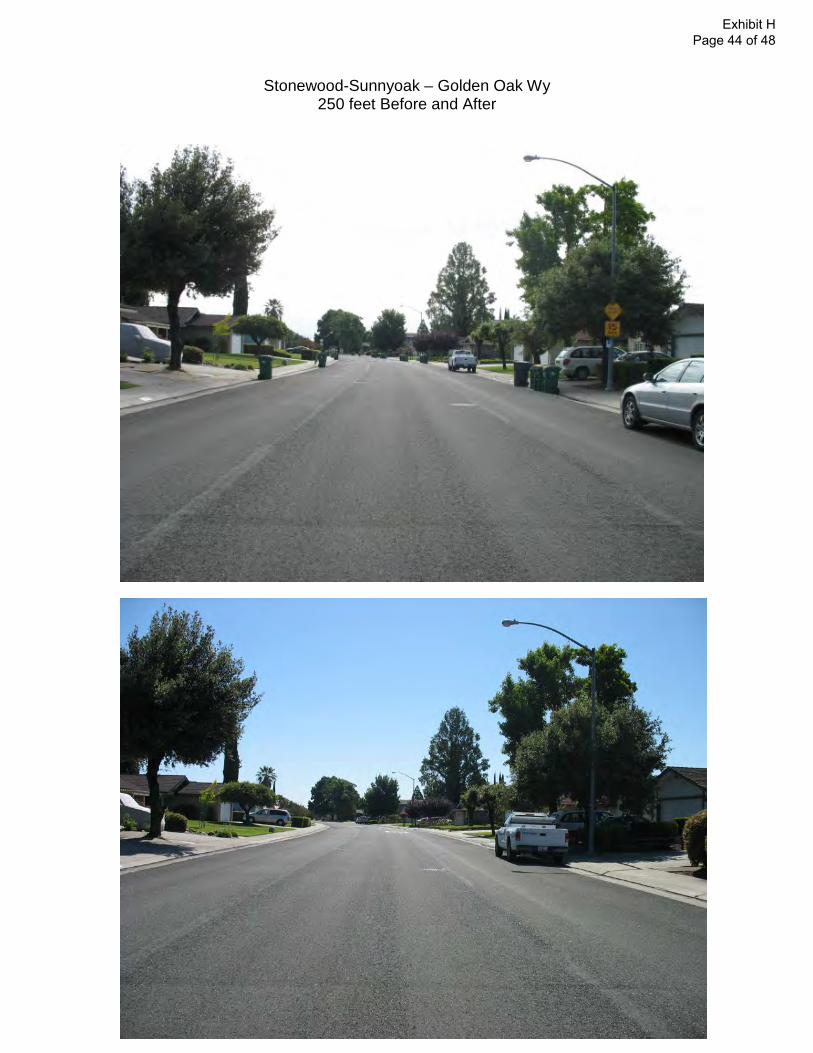
Stonewood-Sunnyoak – Golden Oak Wy 250 feet Before and After
Exhibit H Page 44 of 48

Weston Ranch – Crestmore Neighborhood 100 Feet – Before and After
Exhibit H Page 45 of 48

Weston Ranch – Crestmore 150 Feet - Before and After
Exhibit H Page 46 of 48
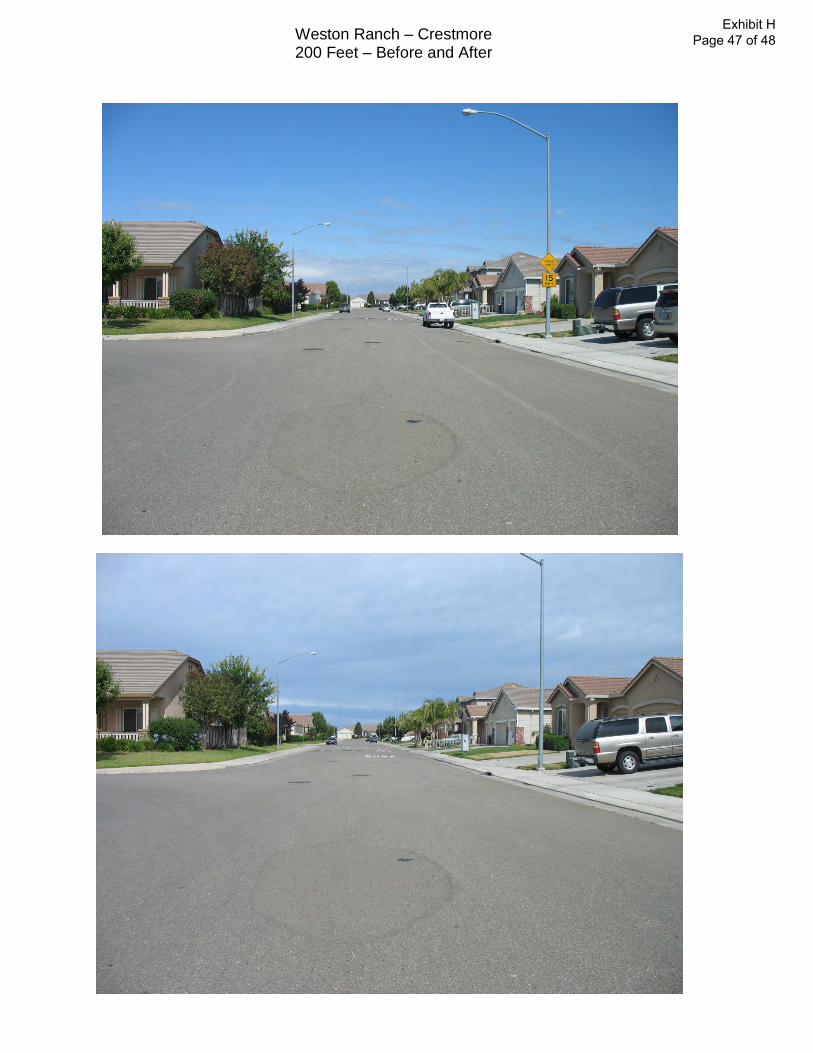
Weston Ranch – Crestmore 200 Feet – Before and After
Exhibit H Page 47 of 48

Weston Ranch – Crestmore 250 Feet – Before and After
Exhibit H Page 48 of 48