Toward a vulnerability/adaptation methodology
24
Toward a vulnerability/adaptation methodology Thomas E. Downing Stuart Franklin Sukaina Bharwani Cindy Warwick Gina Ziervogel Stockholm Environment Institute Oxford With contributions from Mike Brklacich, Carleton University Kirstin Dow, SEI and other colleagues
-
Upload
evan-hopkins -
Category
Documents
-
view
38 -
download
0
description
Toward a vulnerability/adaptation methodology. Thomas E. Downing Stuart Franklin Sukaina Bharwani Cindy Warwick Gina Ziervogel Stockholm Environment Institute Oxford With contributions from Mike Brklacich, Carleton University Kirstin Dow, SEI and other colleagues. - PowerPoint PPT Presentation
Transcript of Toward a vulnerability/adaptation methodology
Toward a vulnerability/adaptation methodology
Thomas E. DowningStuart Franklin
Sukaina BharwaniCindy WarwickGina Ziervogel
Stockholm Environment InstituteOxford
With contributions from Mike Brklacich, Carleton University
Kirstin Dow, SEIand other colleagues
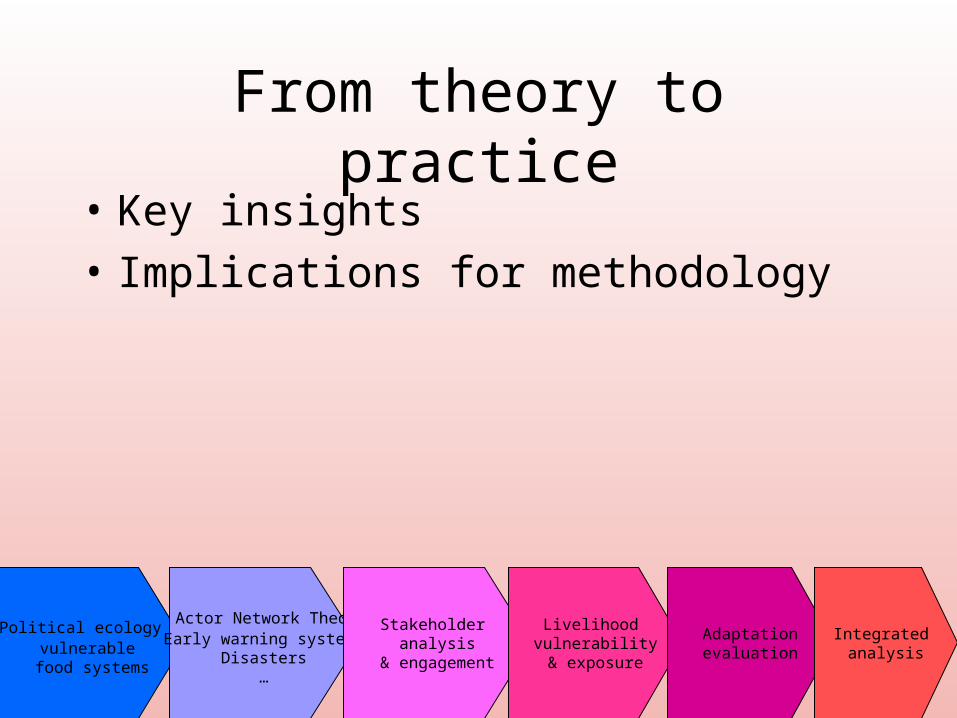
From theory to practice
Political ecology of vulnerable
food systems
Actor Network TheoryEarly warning systems
Disasters…
Stakeholder analysis
& engagement
Livelihood vulnerability& exposure
Adaptationevaluation
Integrated analysis
• Key insights
• Implications for methodology
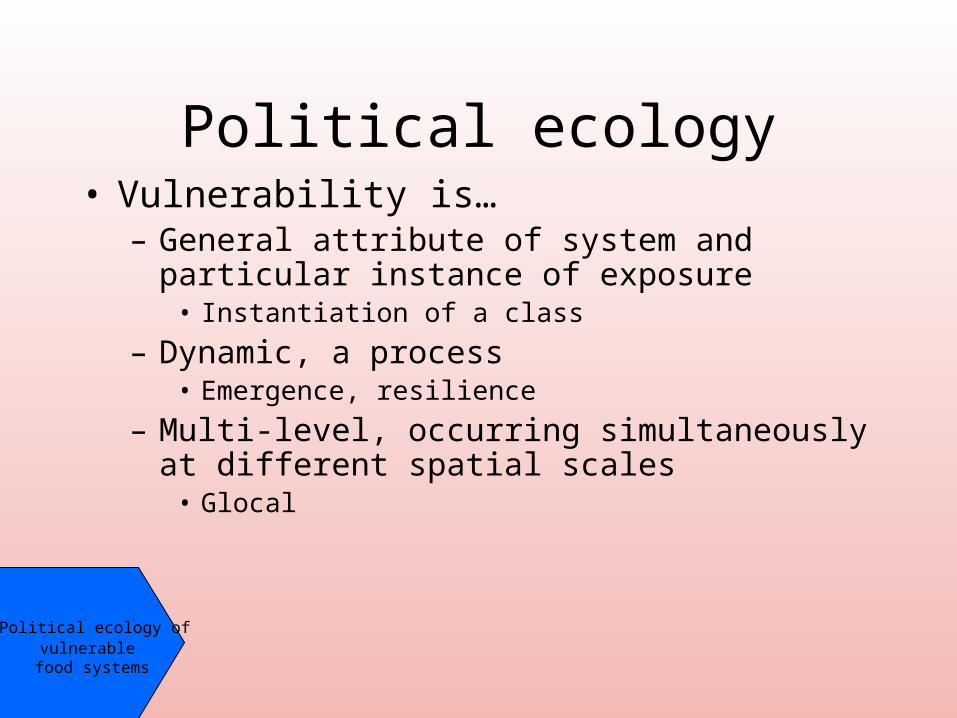
Political ecology
Political ecology of vulnerable
food systems
• Vulnerability is…– General attribute of system and particular instance of
exposure• Instantiation of a class
– Dynamic, a process• Emergence, resilience
– Multi-level, occurring simultaneously at different spatial scales
• Glocal
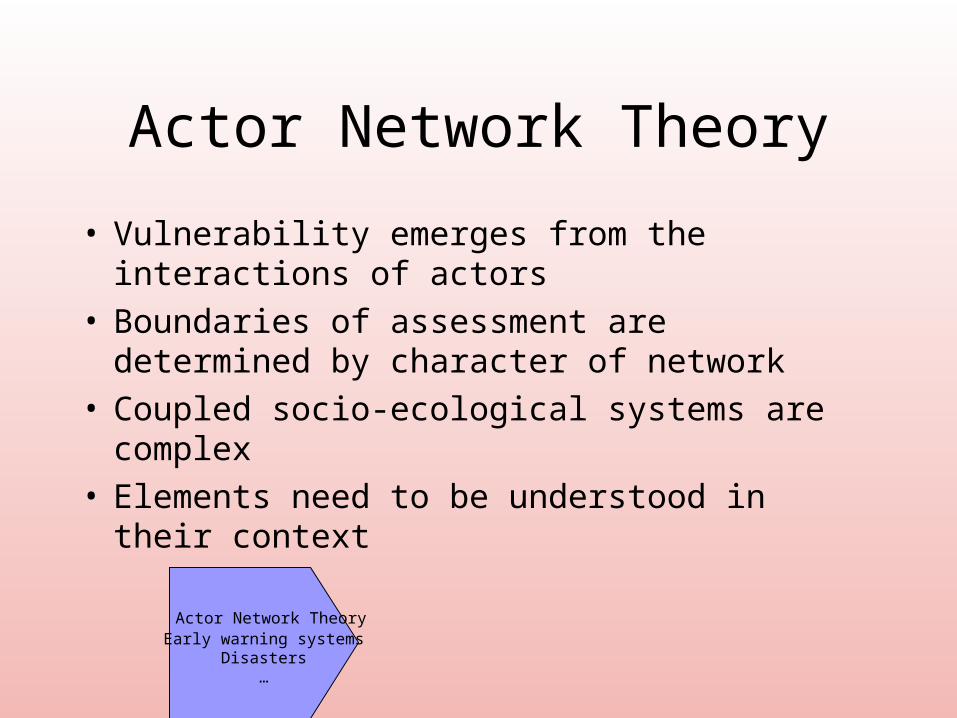
Actor Network Theory
• Vulnerability emerges from the interactions of actors
• Boundaries of assessment are determined by character of network
• Coupled socio-ecological systems are complex• Elements need to be understood in their context
Actor Network TheoryEarly warning systems
Disasters…
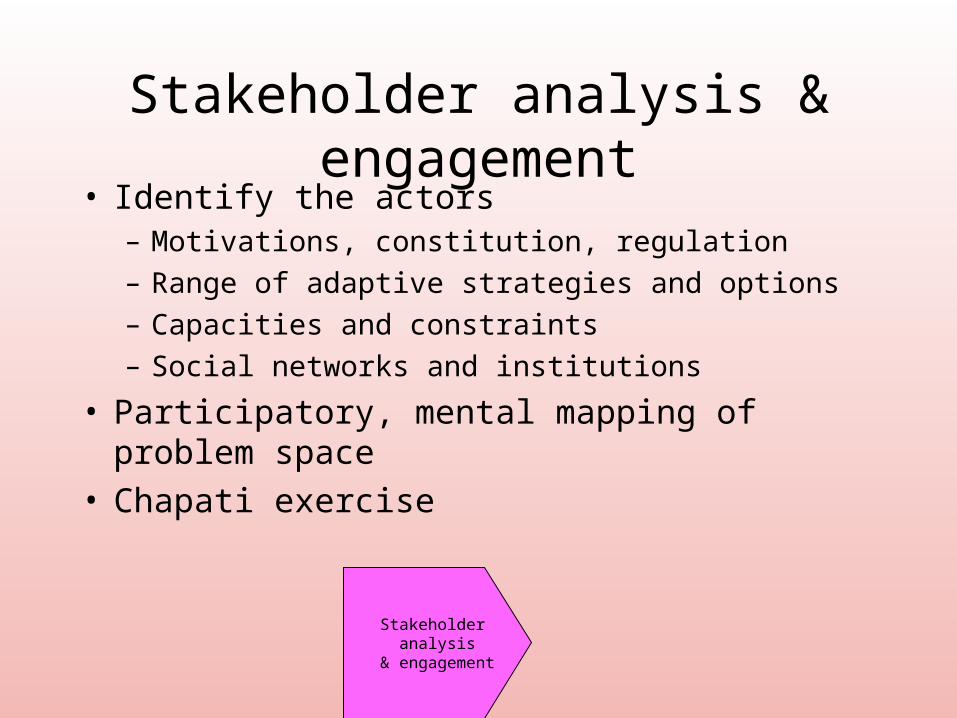
Stakeholder analysis & engagement• Identify the actors
– Motivations, constitution, regulation
– Range of adaptive strategies and options
– Capacities and constraints
– Social networks and institutions
• Participatory, mental mapping of problem space• Chapati exercise
Stakeholder analysis
& engagement
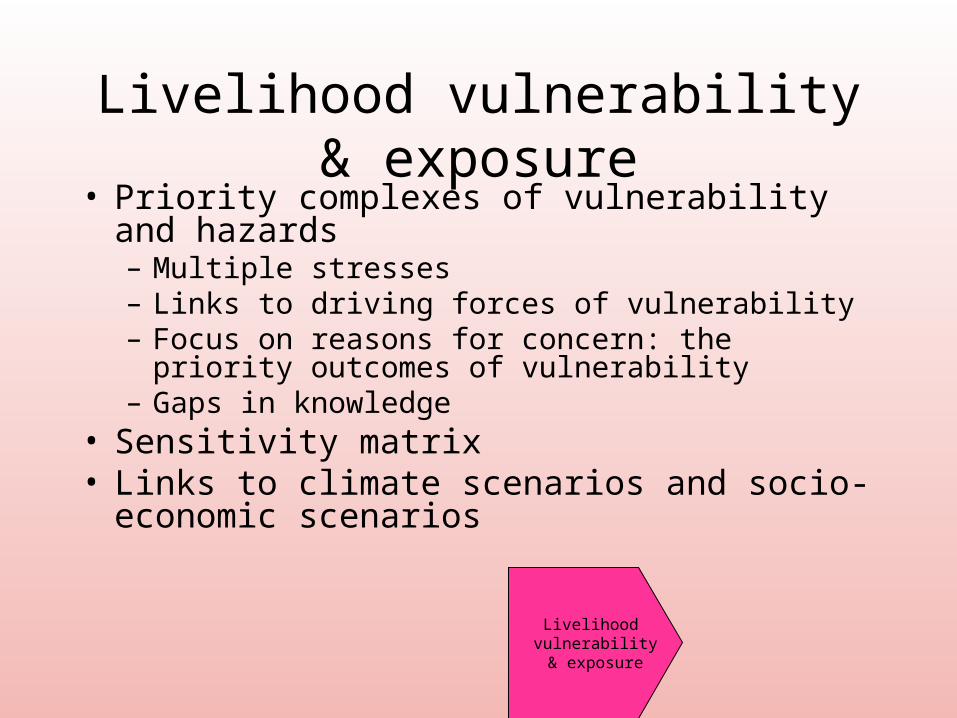
Livelihood vulnerability & exposure• Priority complexes of vulnerability and hazards
– Multiple stresses– Links to driving forces of vulnerability– Focus on reasons for concern: the priority outcomes of
vulnerability– Gaps in knowledge
• Sensitivity matrix• Links to climate scenarios and socio-economic
scenarios
Livelihood vulnerability& exposure
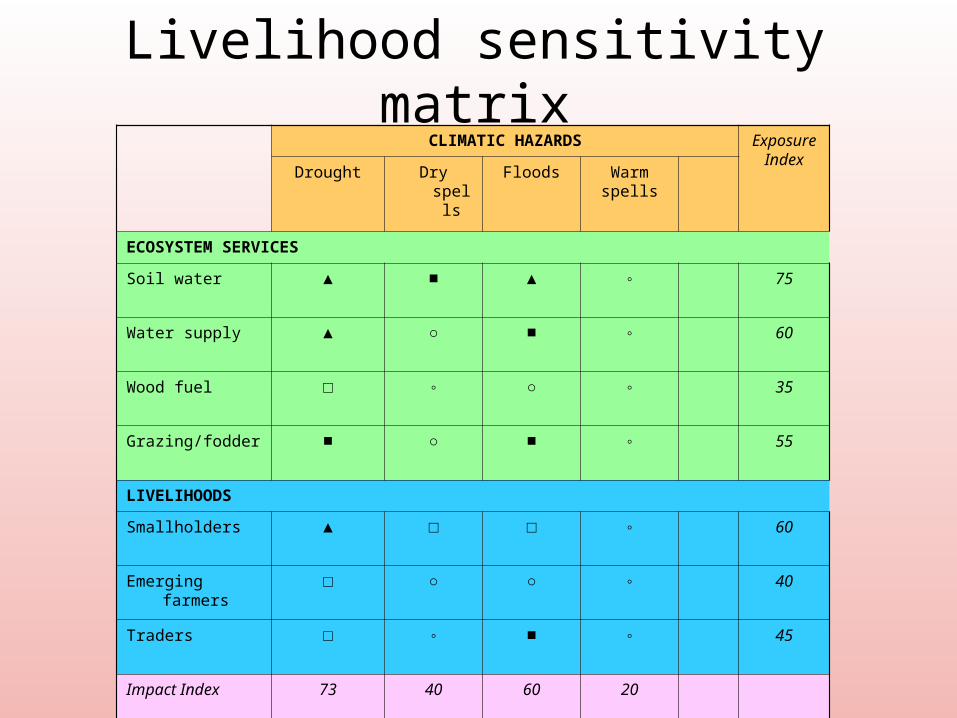
Livelihood sensitivity matrixCLIMATIC HAZARDS Exposure
IndexDrought Dry spells Floods Warm
spells
ECOSYSTEM SERVICES
Soil water ▲ ■ ▲ ◦ 75
Water supply ▲ ○ ■ ◦ 60
Wood fuel □ ◦ ○ ◦ 35
Grazing/fodder ■ ○ ■ ◦ 55
LIVELIHOODS
Smallholders ▲ □ □ ◦ 60
Emerging farmers □ ○ ○ ◦ 40
Traders □ ◦ ■ ◦ 45
Impact Index 73 40 60 20
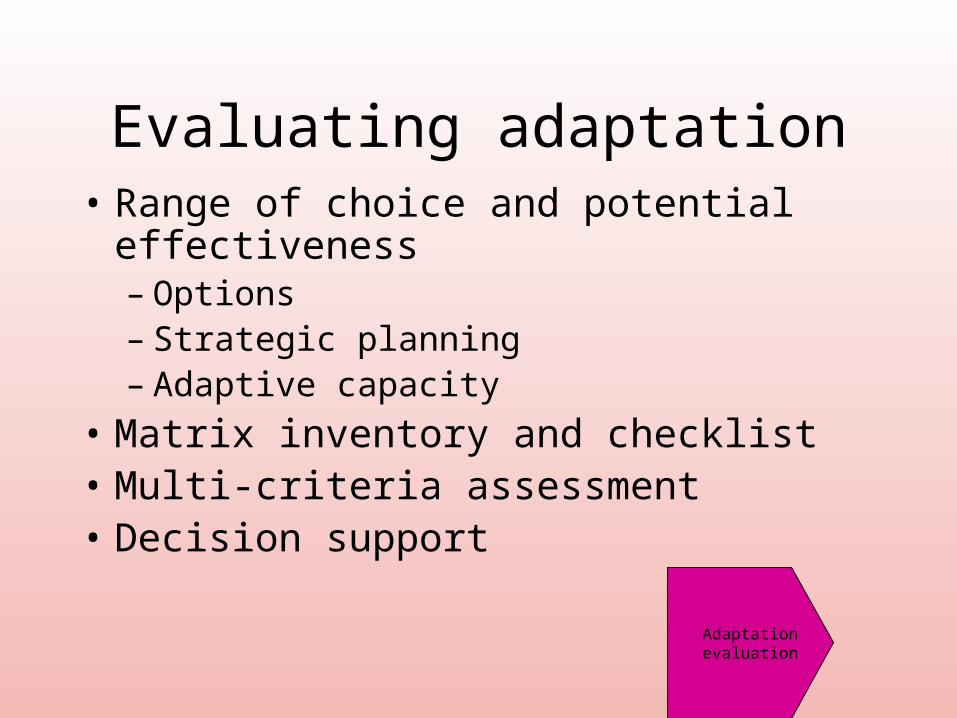
Evaluating adaptation• Range of choice and potential effectiveness
– Options– Strategic planning– Adaptive capacity
• Matrix inventory and checklist• Multi-criteria assessment• Decision support
Adaptationevaluation
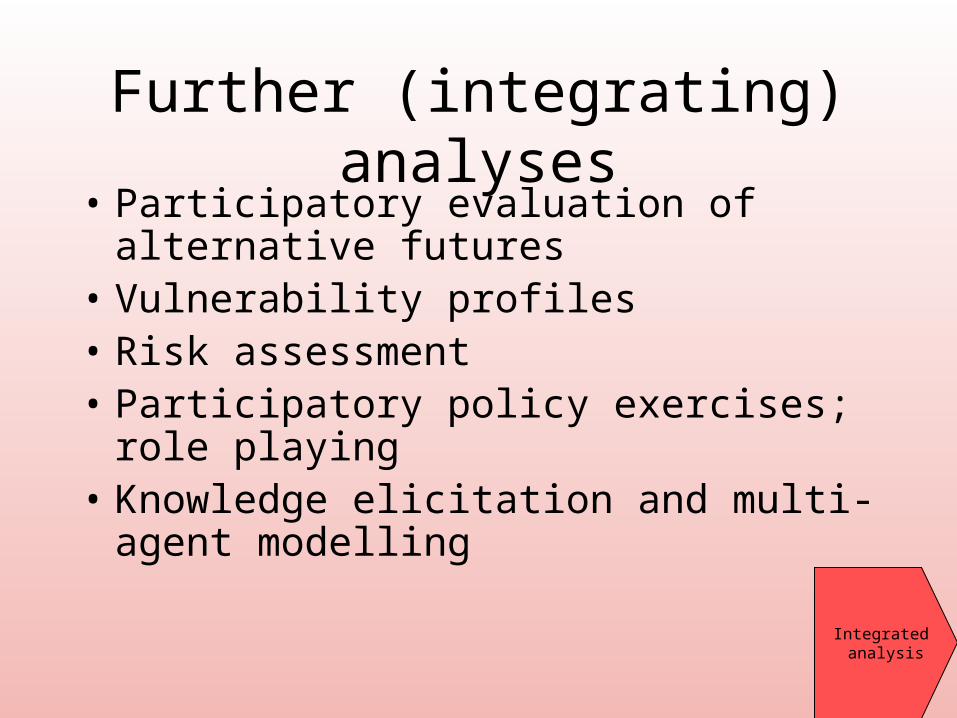
Further (integrating) analyses• Participatory evaluation of alternative
futures• Vulnerability profiles• Risk assessment• Participatory policy exercises; role playing• Knowledge elicitation and multi-agent
modelling
Integrated analysis

Morning exercises• Objectives
– Present core methodology for grounded vulnerability assessment– Build on your expertise and confidence in conducting V&A
studies– Demonstrate facilitation techniques
• Process– Brainstorm on livelihoods– Groups on livelihood sensitivity– Report back– Groups on socio-economic scenarios– Report back– Lunch and evaluation– Further methods– Wrap up
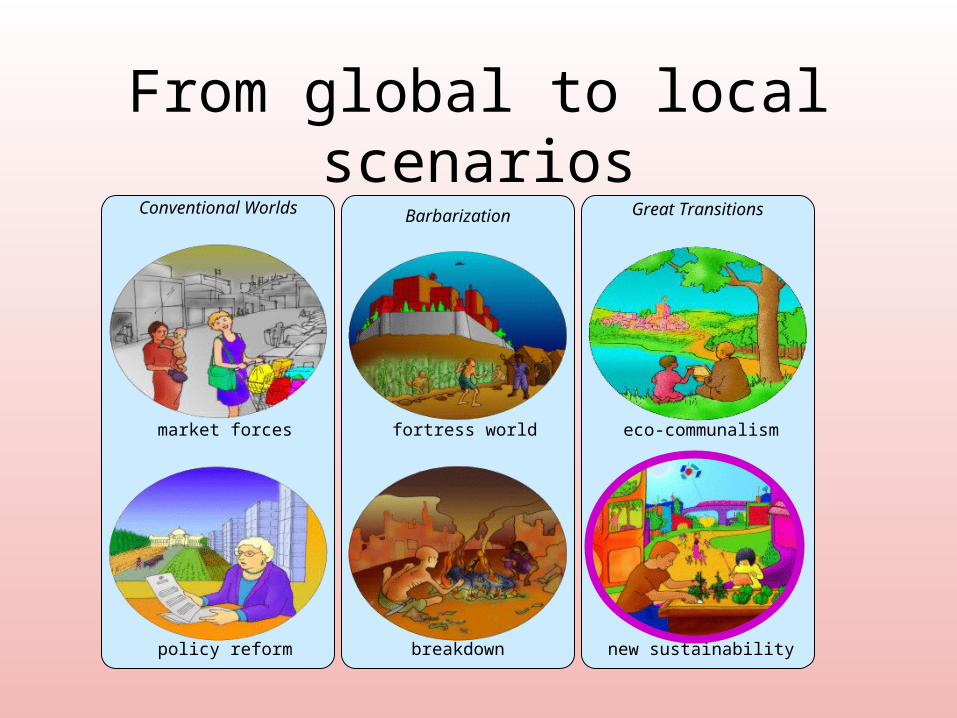
From global to local scenariosConventional Worlds Barbarization Great Transitions
policy reform
market forces
breakdown
fortress world
new sustainability
eco-communalism
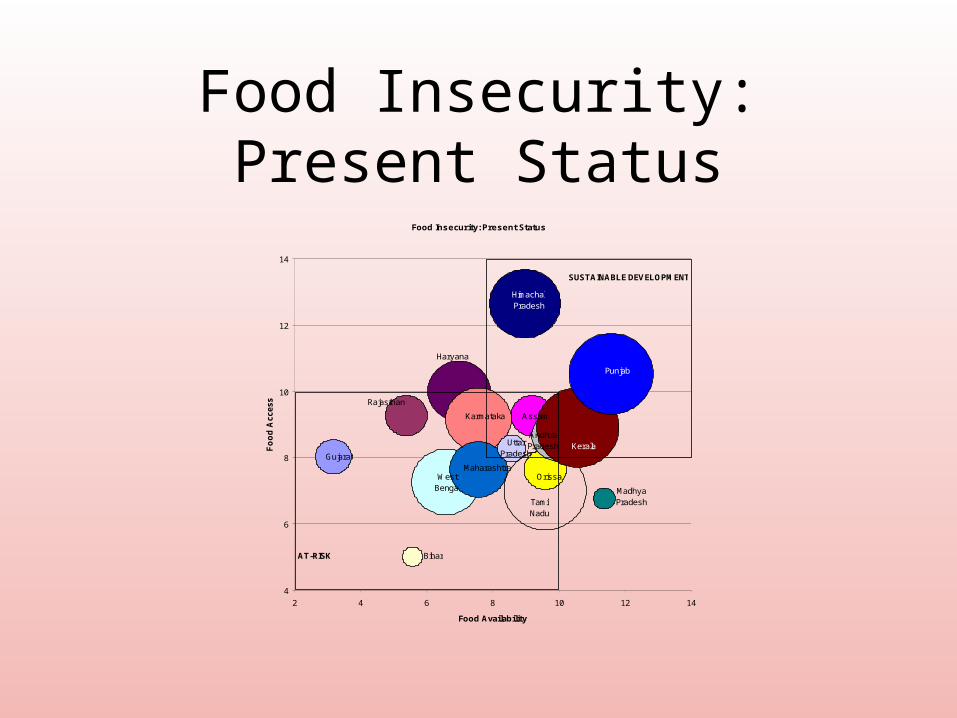
Food Insecurity: Present Status
Food Insecurity: Present Status
4
6
8
10
12
14
2 4 6 8 10 12 14
Food Availability
Fo
od
Access
SUSTAINABLE DEVELOPMENT
AT-RISK
Orissa
Bihar
HimachalPradesh
Gujarat
Punjab
WestBengal
TamilNadu
Rajasthan
Maharashtra
Haryana
Karmataka
UttarPradesh
Assam
AndhraPradesh Kerala
MadhyaPradesh
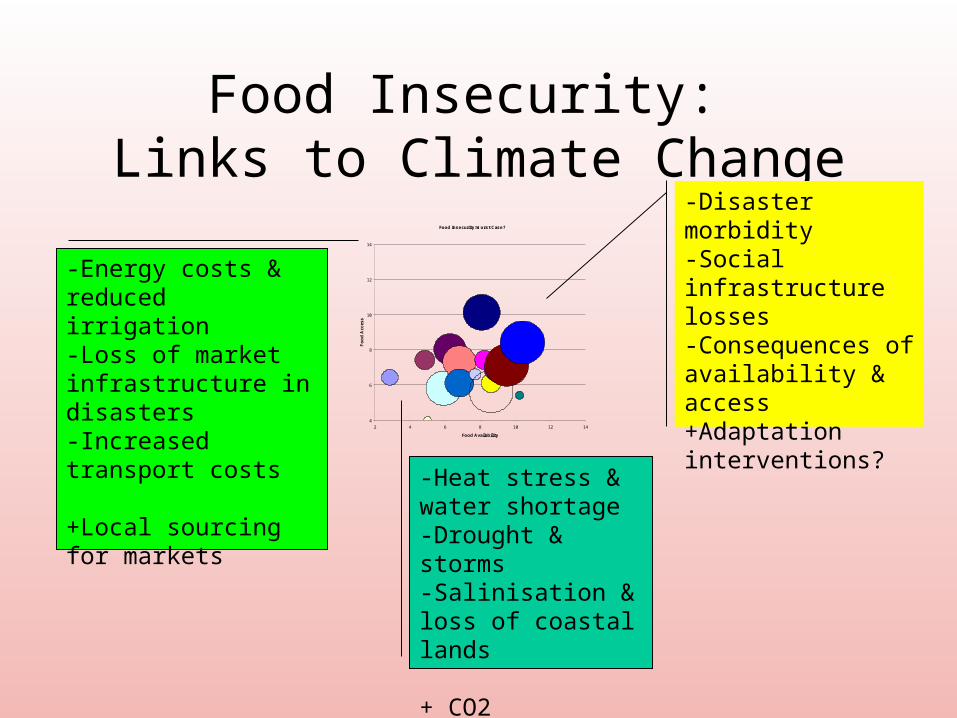
Food Insecurity: Links to Climate Change
Food Insecurity: Worst Case?
4
6
8
10
12
14
2 4 6 8 10 12 14
Food Availability
Fo
od
Access
-Disaster morbidity-Social infrastructure losses-Consequences of availability & access+Adaptation interventions?
-Energy costs & reduced irrigation-Loss of market infrastructure in disasters-Increased transport costs
+Local sourcing for markets
-Heat stress & water shortage-Drought & storms-Salinisation & loss of coastal lands
+ CO2 enrichment
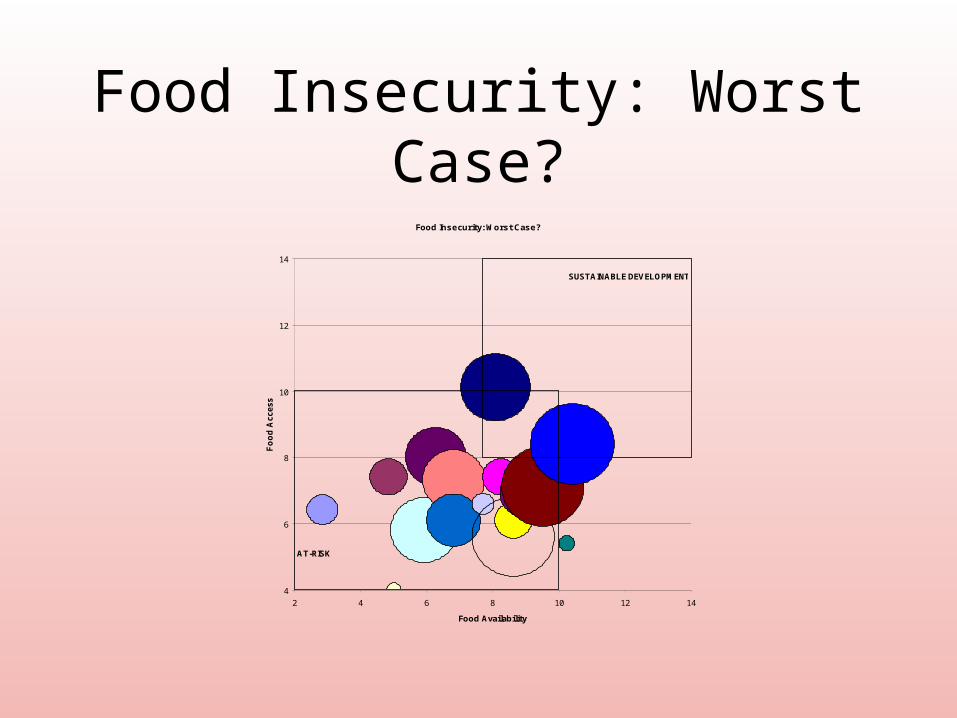
Food Insecurity: Worst Case?
Food Insecurity: Worst Case?
4
6
8
10
12
14
2 4 6 8 10 12 14
Food Availability
Fo
od
Access
AT-RISK
SUSTAINABLE DEVELOPMENT
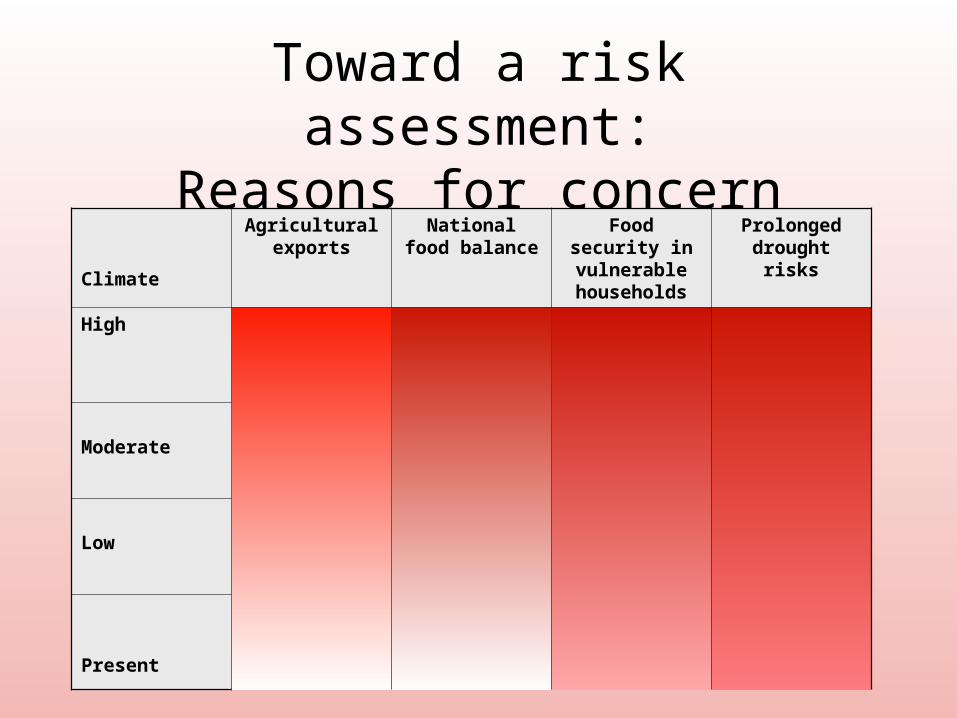
Toward a risk assessment:Reasons for concern
Climate
Agricultural exports
National food balance
Food security in vulnerable households
Prolonged drought risks
High
Moderate
Low
Present
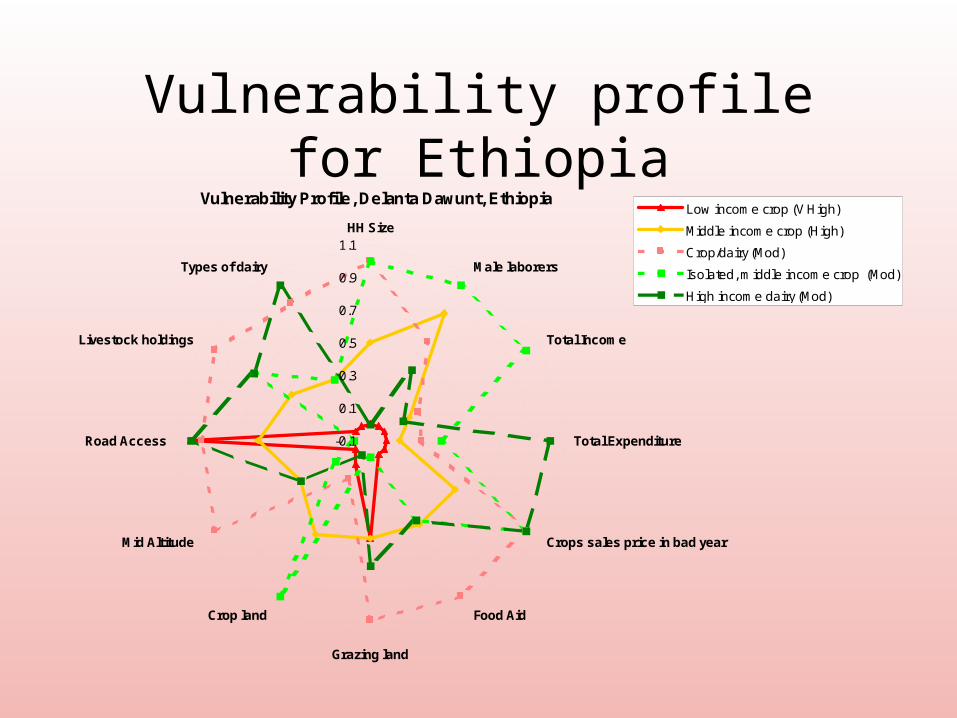
Vulnerability Profile, Delanta Dawunt, Ethiopia
-0.1
0.1
0.3
0.5
0.7
0.9
1.1HH Size
Male laborers
Total Income
Total Expenditure
Crops sales price in bad year
Food Aid
Grazing land
Crop land
Mid Altitude
Road Access
Livestock holdings
Types of dairy
Low income crop (V High)
Middle income crop (High)
Crop/dairy (Mod)
Isolated, middle income crop (Mod)
High income dairy (Mod)
Vulnerability profile for Ethiopia
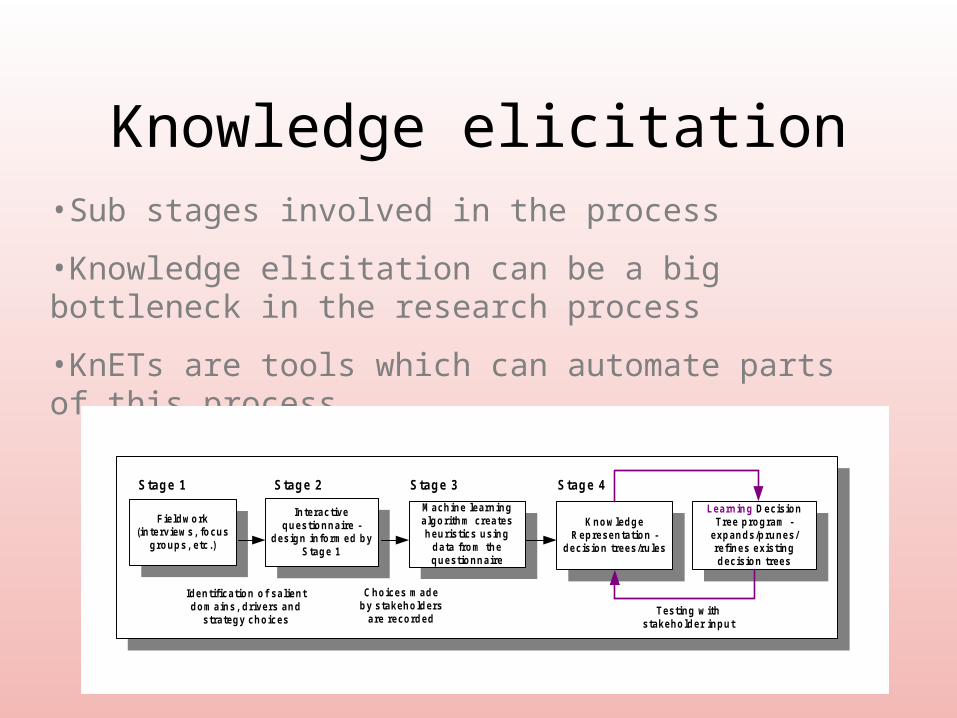
Knowledge elicitation•Sub stages involved in the process
•Knowledge elicitation can be a big bottleneck in the research process
•KnETs are tools which can automate parts of this process
Fieldw ork(interview s, focus
groups, etc.)
Interactivequestionnaire -
design inform ed byStage 1
M achine learningalgorithm createsheuristics using
data from thequestionnaire
Learning DecisionTree program -
expands/prunes/refines existingdecision trees
Know ledgeRepresentation -
decision trees/rules
Choices m adeby stakeholders
are recorded
Identification of salientdom ains, drivers and
strategy choicesTesting w ith
stakeholder input
Stage 1 Stage 2 Stage 4Stage 3
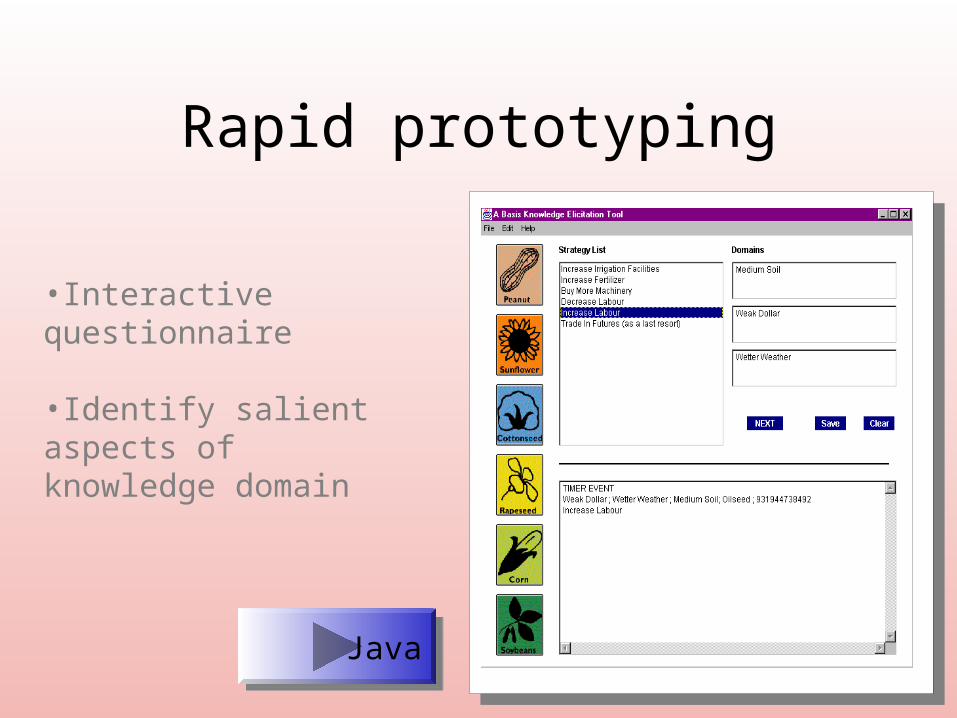
Rapid prototyping
•Interactive questionnaire
•Identify salient aspects of knowledge domain
JavaJava
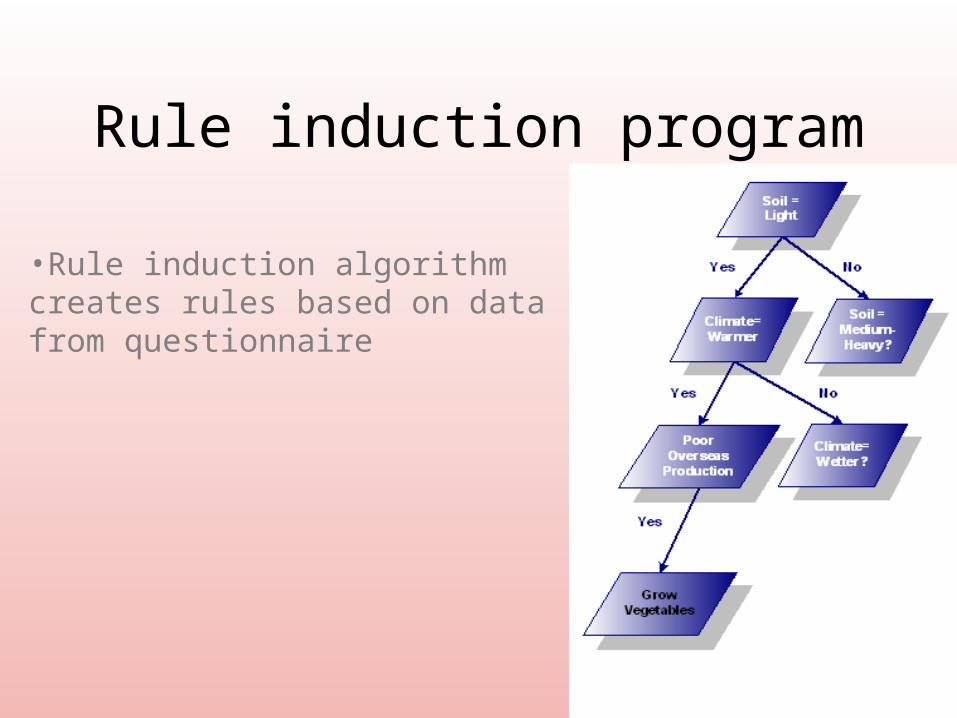
Rule induction program
•Rule induction algorithm creates rules based on data from questionnaire
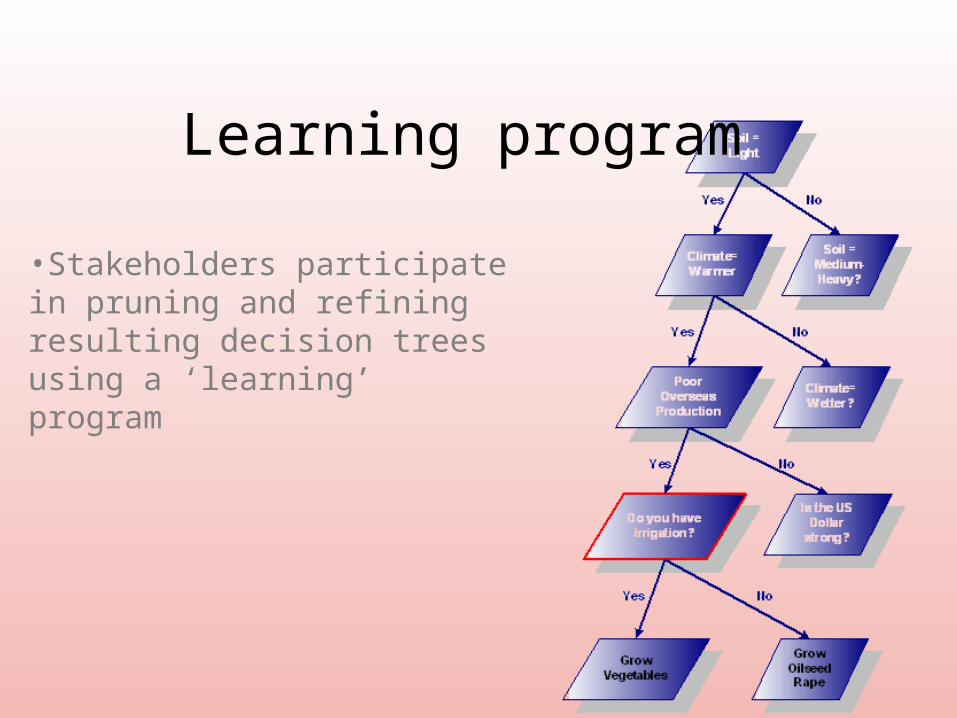
Learning program
•Stakeholders participate in pruning and refining resulting decision trees using a ‘learning’ program
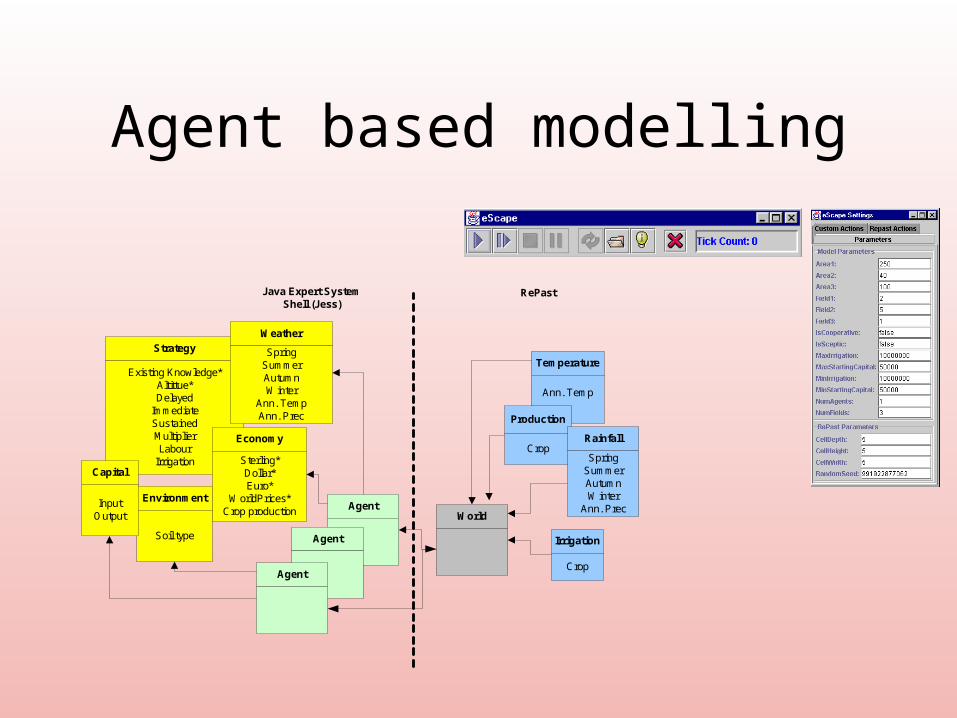
Agent based modelling
Temperature
Ann. Temp
Strategy
Existing Knowledge*Altittue*Delayed
ImmediateSustainedMultiplierLabour
Irrigation
Environment
Soil type
Economy
Sterling*Dollar*Euro*
WorldPrices*Crop production
Weather
SpringSummerAutumnWinter
Ann. TempAnn. Prec
Capital
InputOutput
Production
Crop
Irrigation
Crop
Rainfall
SpringSummerAutumnWinter
Ann. PrecWorld
Agent
Agent
Agent
Java Expert SystemShell (Jess)
RePast
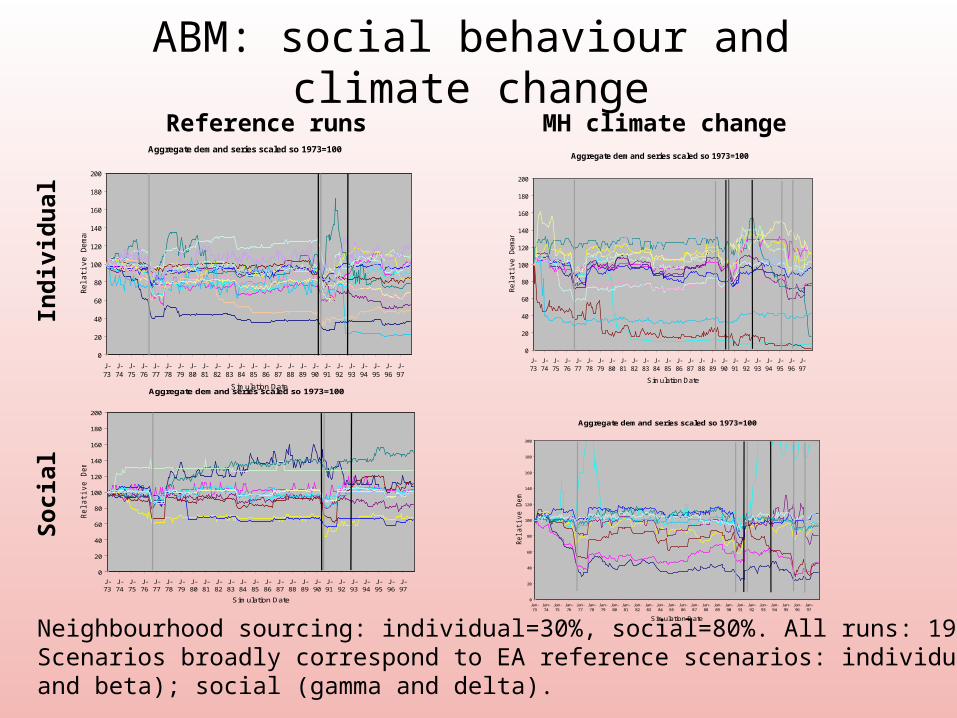
ABM: social behaviour and climate change
Aggregate demand series scaled so 1973=100
0
20
40
60
80
100
120
140
160
180
200
Jan-73
Jan-74
Jan-75
Jan-76
Jan-77
Jan-78
Jan-79
Jan-80
Jan-81
Jan-82
Jan-83
Jan-84
Jan-85
Jan-86
Jan-87
Jan-88
Jan-89
Jan-90
Jan-91
Jan-92
Jan-93
Jan-94
Jan-95
Jan-96
Jan-97
Simulation Date
Rela
tive D
em
and
Aggregate demand series scaled so 1973=100
0
20
40
60
80
100
120
140
160
180
200
J-73
J-74
J-75
J-76
J-77
J-78
J-79
J-80
J-81
J-82
J-83
J-84
J-85
J-86
J-87
J-88
J-89
J-90
J-91
J-92
J-93
J-94
J-95
J-96
J-97
Simulation Date
Rela
tive D
em
and
Aggregate demand series scaled so 1973=100
0
20
40
60
80
100
120
140
160
180
200
J-73
J-74
J-75
J-76
J-77
J-78
J-79
J-80
J-81
J-82
J-83
J-84
J-85
J-86
J-87
J-88
J-89
J-90
J-91
J-92
J-93
J-94
J-95
J-96
J-97
Simulation Date
Rel
ativ
e D
eman
d
Ind
ivid
ual
So
cial
Reference runs MH climate change
Neighbourhood sourcing: individual=30%, social=80%. All runs: 1973=100.Scenarios broadly correspond to EA reference scenarios: individual (alphaand beta); social (gamma and delta).
Aggregate demand series scaled so 1973=100
0
20
40
60
80
100
120
140
160
180
200
J-73
J-74
J-75
J-76
J-77
J-78
J-79
J-80
J-81
J-82
J-83
J-84
J-85
J-86
J-87
J-88
J-89
J-90
J-91
J-92
J-93
J-94
J-95
J-96
J-97
Simulation Date
Rel
ativ
e D
eman
d
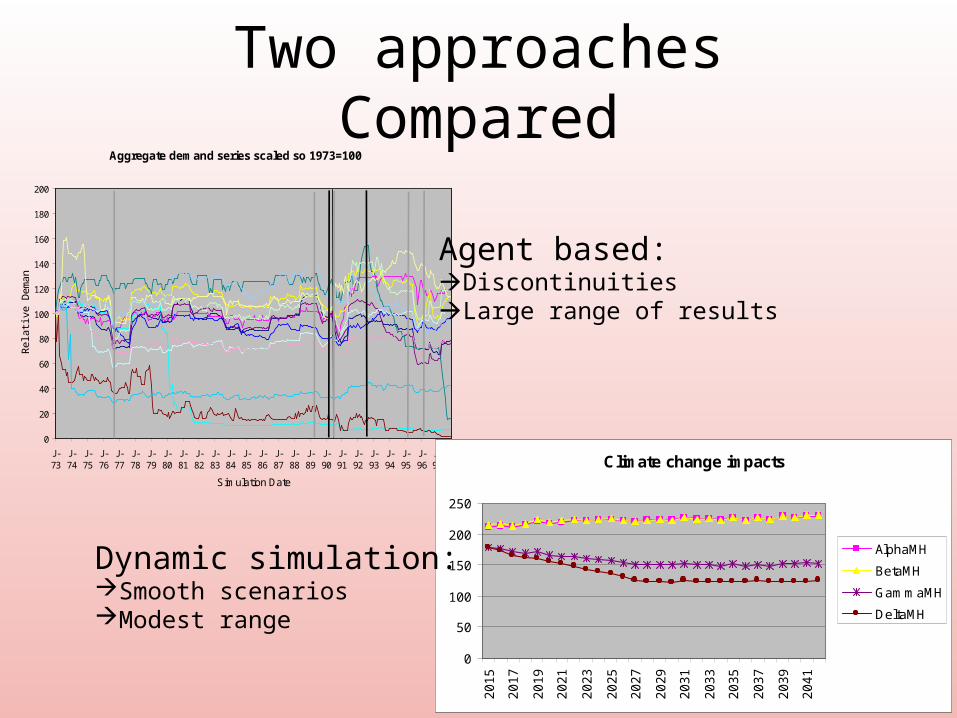
Two approaches Compared
Aggregate demand series scaled so 1973=100
0
20
40
60
80
100
120
140
160
180
200
J-73
J-74
J-75
J-76
J-77
J-78
J-79
J-80
J-81
J-82
J-83
J-84
J-85
J-86
J-87
J-88
J-89
J-90
J-91
J-92
J-93
J-94
J-95
J-96
J-97
Simulation Date
Rel
ativ
e D
eman
d
Climate change impacts
0
50
100
150
200
2502
01
5
20
17
20
19
20
21
20
23
20
25
20
27
20
29
20
31
20
33
20
35
20
37
20
39
20
41
AlphaMH
BetaMH
GammaMH
DeltaMH
Agent based:DiscontinuitiesLarge range of results
Dynamic simulation:Smooth scenariosModest range
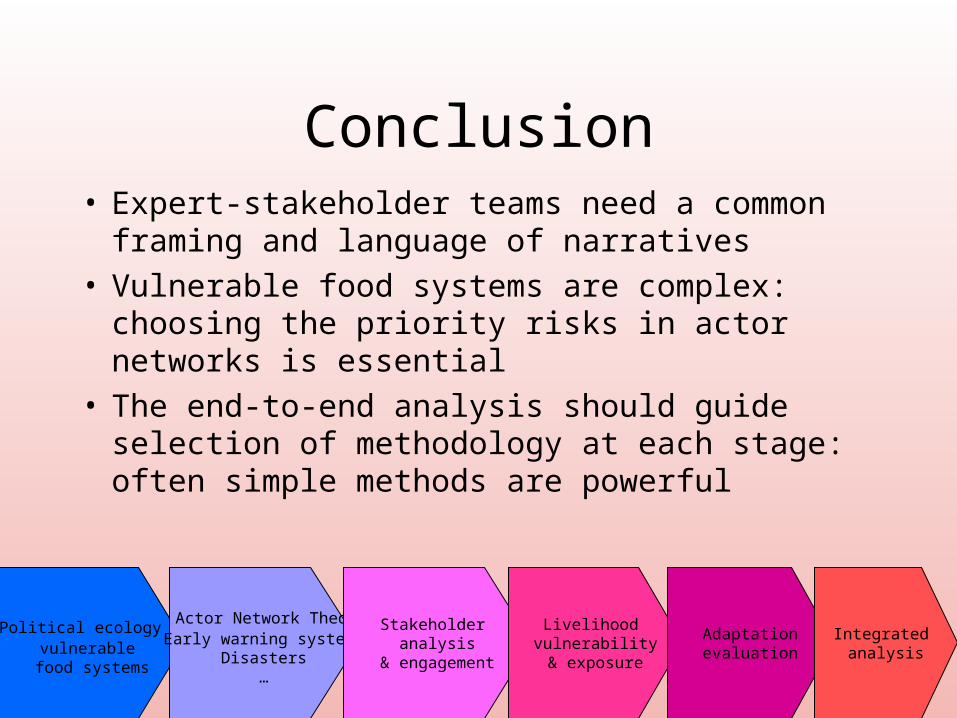
Conclusion• Expert-stakeholder teams need a common framing
and language of narratives• Vulnerable food systems are complex: choosing
the priority risks in actor networks is essential• The end-to-end analysis should guide selection of
methodology at each stage: often simple methods are powerful
Political ecology of vulnerable
food systems
Actor Network TheoryEarly warning systems
Disasters…
Stakeholder analysis
& engagement
Livelihood vulnerability& exposure
Adaptationevaluation
Integrated analysis