Maryland Adaptation and Vulnerability...
22
Maryland Adaptation and Vulnerability Assessment June 2, 2016 Maryland State Highway Administration
Transcript of Maryland Adaptation and Vulnerability...

Maryland Adaptation and Vulnerability Assessment
June 2, 2016
Maryland State Highway Administration

Pilot Study Objectives
• Assess Vulnerability to SHA’s Assets
• Develop Approaches to Address Current and Future Risk
• Provide Recommendations for Policy or Process Changes
“Improve Resiliency of Maryland’s Transportation System”
Floating Debris Lodged in a Bridge during Flood Event at Seneca Creek in Germantown, MD
Photo Source: (FEMA/Skolnik 2006)

Key Step
Identify Climate StressorsStudied in Detail for Maryland
• USACE Procedures Established in Circular No. 1165-2-212 (2013)
• Newer LiDAR and Assign Nearest Tidal Station
Sea Level Change
• HAZUS-MH 2.1 (Category 3 Storm Used)
• Stillwater Depth Grids DevelopedStorm Surge
• Micro-scale Data Obtained from C-MIP
• Riverine Modeling in HAZUS-MH2.1 (future)
Precipitation

2050 & 2100 Sea Level ChangeEastern Shore Regional GIS Cooperative – Salisbury University
Methodology – USACE: Sea-Level Change Considerations for Civil Works Programs, October 2013

Permanent Inundation for Anne Arundel
2050 2100

Permanent Inundation Somerset County
2050 2100

• Two Pilot Counties
• Initial Screening of Assets
• Tools Used– Vulnerability Assessment
Scoring Tool
– Hazard Vulnerability Index
Climate Change Impact ZoneSomerset County, MD
Key Step
Assess Vulnerability

Initial Screening
• Climate Change Impact Zone Map Created Using GIS
• Eliminate assets at low to no risk prior to use of VAST
• Used SLOSH (Cat 3), 2100 MHHW, FEMA 100 year Floodplain, plus 50 ft buffer
Climate Change Impact ZoneAnne Arundel, MD
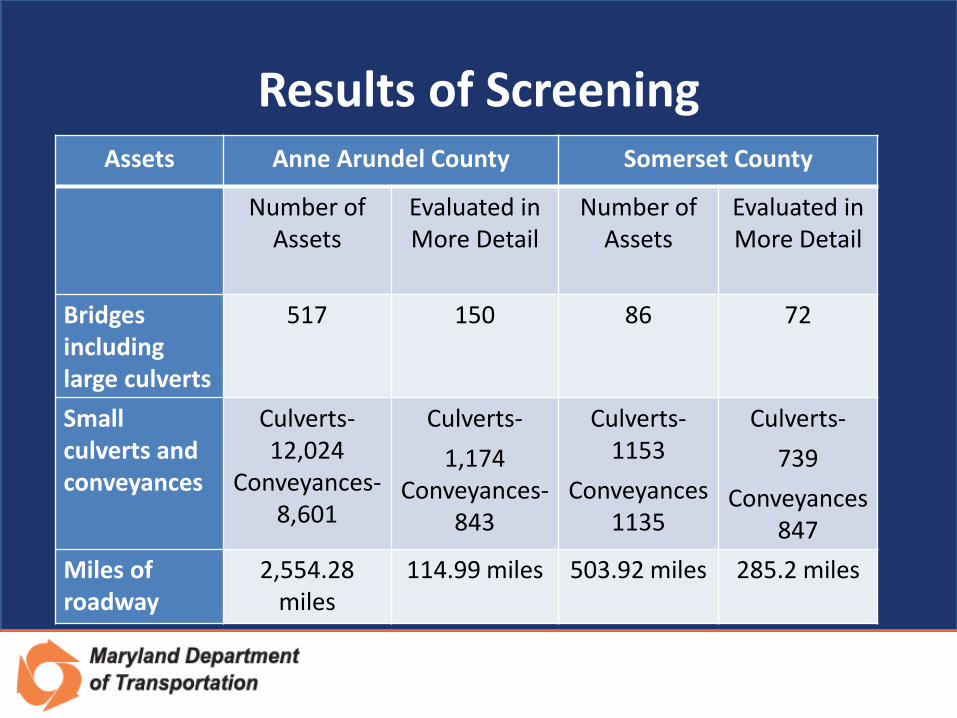
Results of ScreeningAssets Anne Arundel County Somerset County
Number of Assets
Evaluated in More Detail
Number of Assets
Evaluated in More Detail
Bridges including large culverts
517 150 86 72
Small culverts and conveyances
Culverts-12,024
Conveyances-8,601
Culverts-
1,174 Conveyances-
843
Culverts-1153
Conveyances1135
Culverts-
739
Conveyances847
Miles of roadway
2,554.28 miles
114.99 miles 503.92 miles 285.2 miles

VAST - Input and Results
• 150 bridge assets in Anne Arundel County
• 72 bridge assets in Somerset County
• Input Information
– Asset data
– Exposure data
– Sensitivity data
– Adaptive Capacity data
• Output
– Vulnerability Score for all structures
– 10 most vulnerable assets to each climate stressor
– Maps and tables showing most vulnerable structures

FHWA Vulnerability Assessment Scoring Tool Results
Vulnerability to Precipitation
Structure
IDVAST Score
Evacuation
Route
134 3.1 Yes
44 2.8 No
30 2.8 No
43 2.8 No
45 2.8 No
46 2.8 No
1 2.6 No
22 2.6 No
95 2.5 Yes

Hazard Vulnerability Index (HVI)

HVI for Anne Arundel County 2050 2100

HVI for Somerset County
2050 2100

Vulnerable Areas at Risk

HVI for Annapolis 2050

HVI for Annapolis 2100

Results • Anne Arundel County and Somerset County
– Permanent Inundation
– 2050 & 2100 Sea Level Change (USACE method)
– 2050 & 2100 Sea Level Change with 100 Year Storm Event (HAZUS-MH)
– Storm Surge Considerations (Still Water)
– Hazard Vulnerability Index (HVI)
– Vulnerability Scores from VAST for bridges
– Vulnerable Areas at Risk
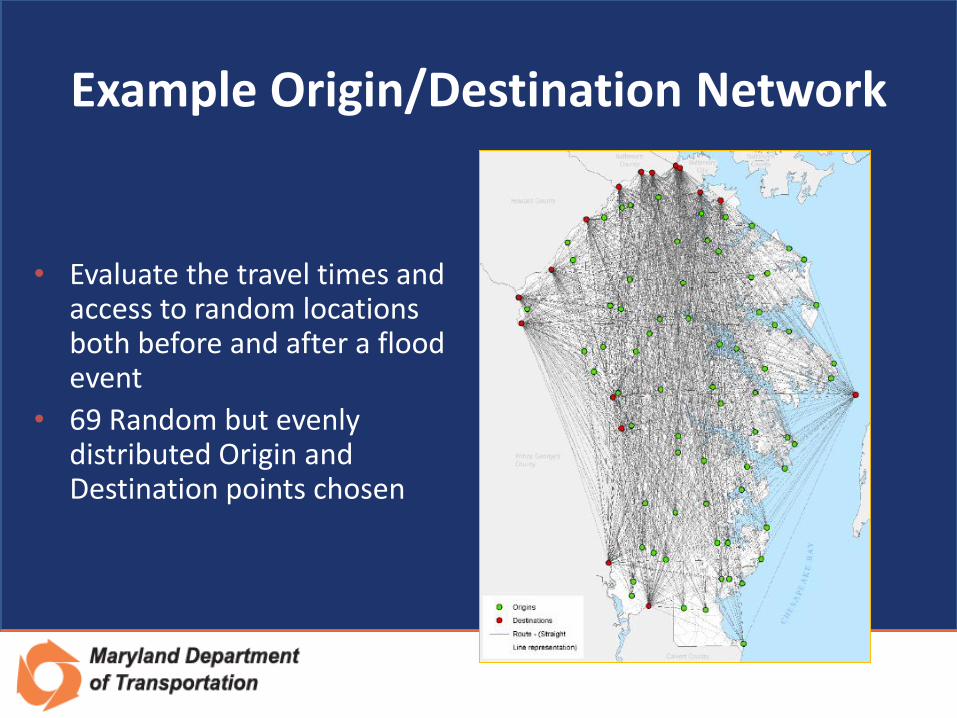
Example Origin/Destination Network
• Evaluate the travel times and access to random locations both before and after a flood event
• 69 Random but evenly distributed Origin and Destination points chosen

Percentage of Traversible Trace Paths in AA County with MSL SLC
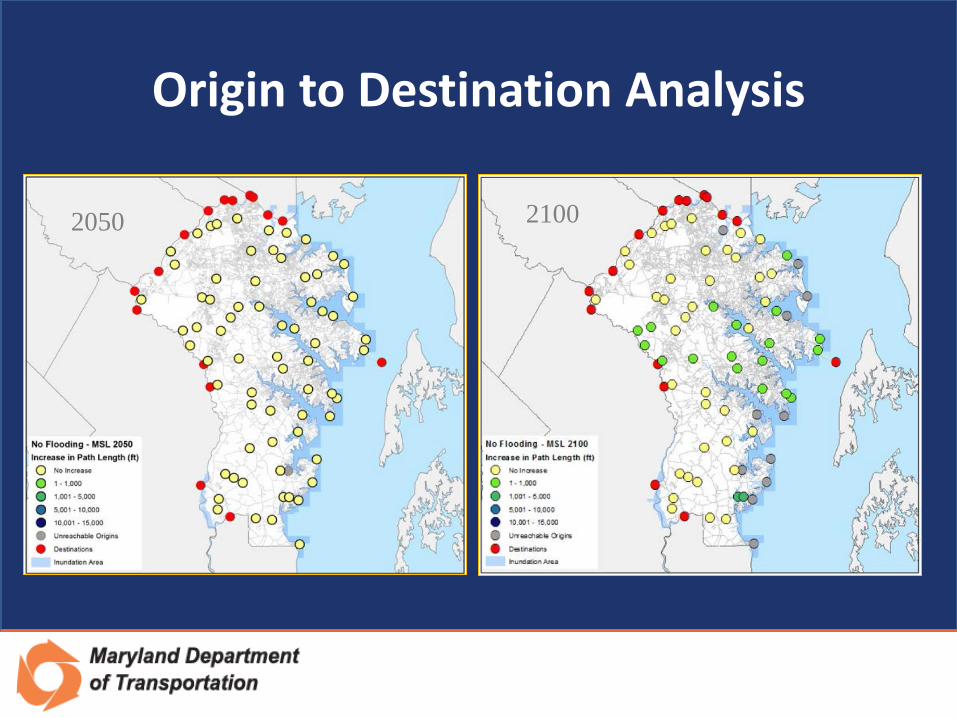
Origin to Destination Analysis
21002050

Questions
http://www.fhwa.dot.gov/environment/climate_change/adaptation/ongoing_and_current_res
earch/vulnerability_assessment_pilots/2013-2015_pilots/index.cfm
Elizabeth Habic Office of Planning and Preliminary [email protected]
Climate Change Adaptation Plan with Detailed Vulnerability Assessment, October 2014