Tourism Sector Recovery Plan COVID-19 respons
115
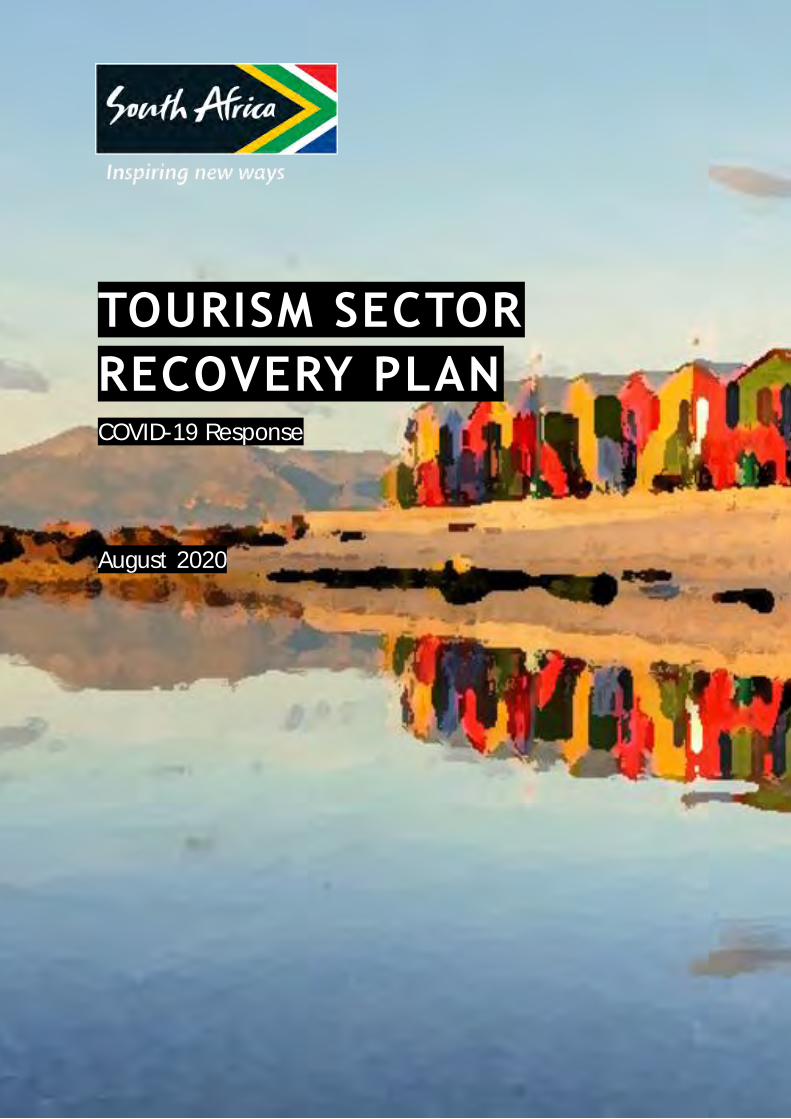
TOURISM SECTOR RECOVERY PLAN COVID-19 Response August 2020
Transcript of Tourism Sector Recovery Plan COVID-19 respons
TOURISM SECTOR
RECOVERY PLAN COVID-19 Response
August 2020
Page | 1
TABLE OF CONTENTS
Executive Summary ....................................................................................................................................................................... 5
Introduction .................................................................................................................................................................................. 15
The Impact of the COVID-19 Pandemic ............................................................................................................................. 21
Economic Impact of COVID-19 ........................................................................................................................................ 21
Tourism Impact of COVID-19 ............................................................................................................................................ 23
Epidemiological Scenarios ....................................................................................................................................................... 29
Interventions by International Organisations .................................................................................................................. 40
Recommendations And Recovery Phases ......................................................................................................................... 47
Protecting and Rejuvenating Supply.............................................................................................................................. 48
Reigniting Demand ............................................................................................................................................................... 49
Strengthening Enabling Capability ................................................................................................................................. 50
Phase 1: Protecting Supply (0-3 Months) .......................................................................................................................... 52
Proposed Interventions ....................................................................................................................................................... 52
Modelling and Simulation of Interventions................................................................................................................. 67
Phase 2: Matching Supply and Demand (3-9 Months) ................................................................................................ 70
Proposed Interventions ....................................................................................................................................................... 70
Modelling and Simulation of Interventions................................................................................................................. 80
Phase 3: Growth Interventions (9-24 Months) ................................................................................................................ 83
Proposed Interventions ....................................................................................................................................................... 83
Modelling and Simulation of Interventions................................................................................................................. 88
Impact and Investment ............................................................................................................................................................. 90
Conclusion ..................................................................................................................................................................................... 95
Glossary of Terms ....................................................................................................................................................................... 97
References ..................................................................................................................................................................................... 98
Acknowledgements .................................................................................................................................................................. 101
Appendix - Tourism Demand Modelling ......................................................................................................................... 103
Page | 2
LIST OF TABLES
Table 1: South African Spend and Arrivals ........................................................................................................................ 16
Table 2: Contribution of each sub-sector to Tourism output and employment in South Africa ................ 17
Table 3: Comparison of tourism performance per country........................................................................................ 18
Table 4: Year on Year Percentage Changes for Hotel Rooms in South Africa .................................................... 26
Table 5: Movement restrictions and travel-related limitations per lockdown level ......................................... 38
Table 6: Actions for Recommendation 1 ........................................................................................................................... 53
Table 7: Accountabilities for Recommendation 1 .......................................................................................................... 53
Table 8: Actions for Recommendation 2 ........................................................................................................................... 57
Table 9: Accountabilities for Recommendation 2 .......................................................................................................... 57
Table 10: Operational considerations associated with protocols implementation .......................................... 61
Table 11: Actions for Recommendation 3 ......................................................................................................................... 62
Table 12: Accountabilities for Recommendation 3 ........................................................................................................ 62
Table 13: Key Aviation Metrics, South Africa 2019. ....................................................................................................... 63
Table 14: Top 30 International Airlines Capacity Share vs Network Capacity .................................................... 64
Table 15: Major International Airlines Revenue Structure from South Africa ..................................................... 65
Table 16: Actions for Recommendation 4 ......................................................................................................................... 67
Table 17: Accountabilities for Recommendation 4 ........................................................................................................ 67
Table 18: Actions for Recommendation 5 ......................................................................................................................... 71
Table 19: Accountabilities for Recommendation 5 ........................................................................................................ 72
Table 20: Actions for Recommendation 6 ......................................................................................................................... 75
Table 21: Accountabilities for Recommendation 6 ........................................................................................................ 75
Table 22: Actions for Recommendation 7 ......................................................................................................................... 80
Table 23: Accountabilities for Recommendation 7 ........................................................................................................ 80
Table 24: Actions for Recommendation 8 ......................................................................................................................... 84
Table 25: Accountabilities for Recommendation 8 ........................................................................................................ 85
Table 26: Actions for Recommendation 9 ......................................................................................................................... 86
Table 27: Accountabilities for Recommendation 9 ........................................................................................................ 86
Table 28: Actions for Recommendation 10 ...................................................................................................................... 87
Table 29: Accountabilities for Recommendation 10 ..................................................................................................... 88
Table 30: Summary of the impact of recommended interventions ........................................................................ 91
Table 31: Summary of expected revenue loss ................................................................................................................. 91
Table 32: Tourism budget for major destination marketing organisations in each country ........................ 93
Table 33: Baseline Pre-COVID Revenue Forecast (no interventions) .................................................................... 105
Table 34: Baseline Post-COVID Revenue Forecast (no interventions) ................................................................. 106
Table 35: Baseline Pre-COVID Revenue Loss Projection (no interventions) ...................................................... 107
Table 36: COVID Revenue Forecast Results with Phase 1 Interventions ............................................................. 108
Table 37: COVID Revenue Loss Projection with Phase 1 Interventions implemented .................................. 109
Table 38: COVID Revenue Forecast Results with Phase 2 Interventions ............................................................. 110
Table 39: COVID Revenue Loss Projection with Phase 2 Interventions implemented .................................. 111
Table 40: COVID Revenue Forecast Results with Phase 3 Interventions ............................................................. 112
Table 41: COVID Revenue Loss Projection with Phase 3 Interventions implemented .................................. 113
Table 42: Summary of job loss scenarios under Phase 1,2,3 interventions ....................................................... 114
Page | 3
LIST OF FIGURES
Figure 1: Strategic Recommendations................................................................................................................................... 9
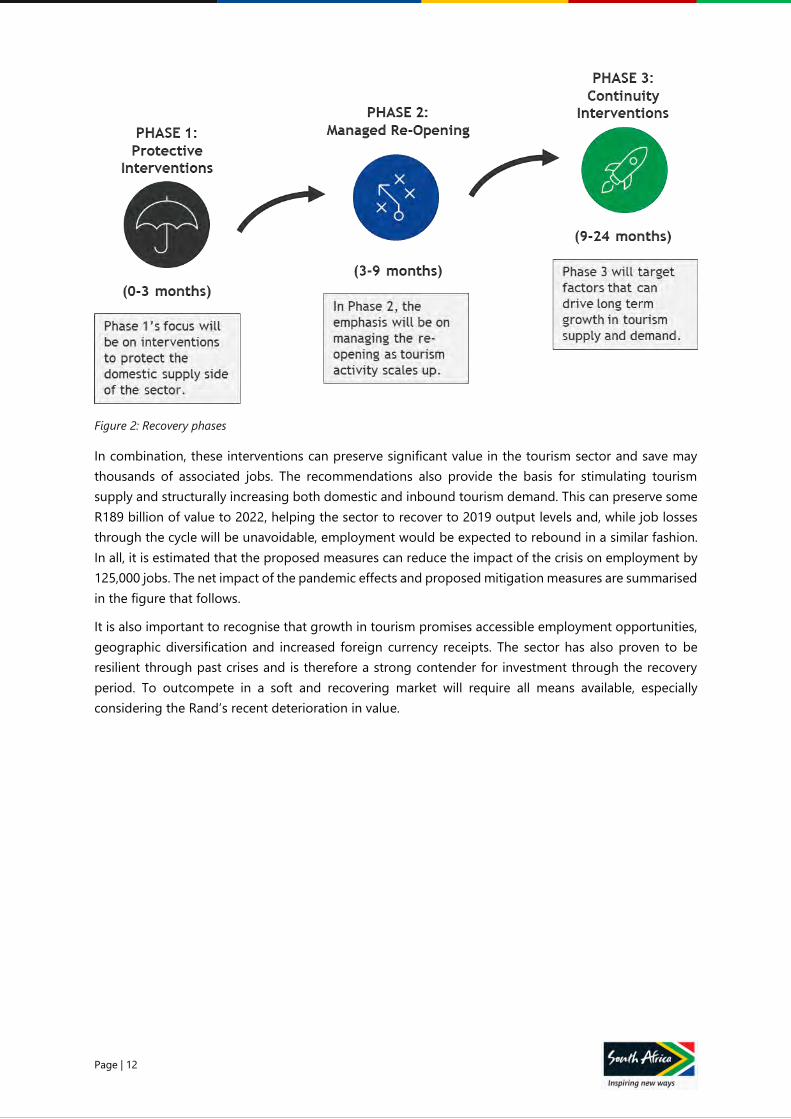
Figure 2: Recovery phases ....................................................................................................................................................... 12
Figure 3: Impact of recovery plan recommendations on sector output .............................................................. 13
Figure 4: Illustration of the collaborative process .......................................................................................................... 15
Figure 5: Tourism Value Chain ............................................................................................................................................... 17
Figure 6: Revenue distribution across the sector .......................................................................................................... 18
Figure 7: Impact of COVID-19 on global GDP and Unemployment ...................................................................... 21
Figure 8: Impact of COVID-19 on South African GDP and Unemployment ....................................................... 22
Figure 9: Impact of COVID-19 on International Tourism Arrivals and GDP ....................................................... 23
Figure 10: Global interest in Booking sites ...................................................................................................................... 24
Figure 11: Consumer confidence in post-COVID economic conditions ............................................................... 24
Figure 12: Local interest in booking sites ......................................................................................................................... 25
Figure 13: Three dimensions of the pandemic ................................................................................................................ 29
Figure 14: Heatmap of pandemic situation for South Africa's source countries ............................................... 30
Figure 15: Pandemic shape of source countries (end-May 2020) ........................................................................... 31
Figure 16: Example of how interpolation was used to estimate the peak of source countries ................... 32
Figure 17: Core forecast of when international travel will resume for source countries ................................ 33
Figure 18: Booking window of each Region for South Africa ................................................................................... 33
Figure 19: Medium and Low Road scenario for Domestic opening of source countries ............................... 34
Figure 20: COVID-19 pandemic in South Africa ............................................................................................................. 36
Figure 21: Optimistic and pessimistic case for key COVID-19 factors ................................................................... 37
Figure 22: Initial sector-level risk assessments ................................................................................................................ 37
Figure 23: Three main themes from DMO responses .................................................................................................. 40
Figure 24: Overview of COVID-19 responses from 15 countries ............................................................................. 42
Figure 25: Global Tourism arrivals after global crises ................................................................................................... 45
Figure 26: Strategic Recommendations ............................................................................................................................. 48
Figure 27: Recovery phases..................................................................................................................................................... 50
Figure 28: Support interventions implemented by Government, Private Sector and Tourism .................... 54
Figure 29: Expected Supply Survival Rate ......................................................................................................................... 55
Figure 30: Expected Impact of Sector Reopening on Supply Survival ........ Error! Bookmark not defined.
Figure 31: TBCSA COVID-19 protocols for Tourism Industry Operations ........................................................... 58
Figure 32: Risk assessment per sub-sector along TBCSA protocols ....................................................................... 59
Figure 33: Risk assessment per sub-sector along the tourism value chain ......................................................... 60
Figure 34: Airline Risk Matrix, Top 30 International Airlines Serving South Africa .......................................... 63
Figure 35: Major International Airport Pairs Ex South Africa ..................................................................................... 65
Figure 36: Post from globally successful, Bloemfontein born visual artist, Trevor Stuurman ...................... 74
Figure 37: Traveller Segmentation - Free Spirits ............................................................................................................ 77
Figure 38: Traveller Segmentation – Cultural Travellers .............................................................................................. 78
Figure 39: Overall impact of recommendations ............................................................................................................. 92

Page | 4
EXECUTIVE SUMMARY
Page | 5
E X E C U T I V E S U M M A R Y
OVERVIEW
The COVID-19 pandemic has had a profound impact on the global tourism sector. Governments across
the world had to implement necessary measures to contain the spread of the coronavirus such that the
capacity of the health system is not overwhelmed by the rate of transmission. A direct impact of this was
a restriction of movement globally that had an adverse impact of the global capacity utilization of the
tourism sector. Different regions of the world as a result of the impact of the coronavirus experienced a
fundamental disruptions in the generation of value in the sector, employment, domestic and
international movements, sectoral linkages, cost servicing ability, ability to generate foreign reserves
amongst other variables in the global tourism value chain.
The World Travel and Tourism Council (WTTC) in its 2020 travel and tourism recovery scenarios projects
the global travel and tourism GDP to experience losses in the tune of $2,686 billion in the upside
scenario, $3,435 billion in the baseline scenario and the worst case scenario of $5,543 billion for the year
2020. The WTTC further projects that global travel and tourism will experience 98.2 million job losses on
the upside scenario, 121.1 million job losses for the baseline scenario and 197.5 million job losses for
the worst-case scenario. In relation to International arrivals, WTTC estimates a 41% drop in global
international arrivals in the upside scenario, 53% drop in the baseline scenario and 73% drop in the
worst-case scenario for 2020. While for global domestic tourism it estimates a drop of 26% in the upside
scenario, 34% in the baseline scenario and drop of 64% in the worst-case scenario.
Tourism in South Africa as is the case in the global economy has been thrown into crisis by the COVID-
19 pandemic, putting thousands of businesses and jobs at risk. The priority for the sector is to resume
operations as early as it is safe to do so, but re-opening will just be the start of a difficult recovery. The
situation requires an urgent response, but also a recognition of the constraints that hamper South
Africa’s tourism development.
As a truly aspirational destination, combining powerful social justice history, breath-taking natural
beauty, and warm, welcoming and diverse people, South Africa’s tourism potential is not limited to pre-
crisis performance. This recovery plan proposes a series of measures to protect and rejuvenate supply,
reignite demand and strengthen enabling capability. Together, these actions can preserve some R189
billion of value, helping the sector to recover to 2019 output and employment levels in 2022 and
positioning the sector for long-term sustainable growth.
SITUATION (PRE-CRISIS)
South Africa is geopolitically distinctive and possesses natural and cultural diversity that supports a
globally compelling tourism proposition. The sector accounts for 2,9% of GDP (8,6% indirect), supports
about 725,000 direct jobs (1,49 million direct and indirect) and accounts for 8,2% of total investment
activity in 2019. Perhaps most importantly, inbound tourism generates R82,5 billion in direct foreign
spend (R126,7 billion total tourism expenditure), contributing an equivalent of 9,2% of total national
exports.
South Africa’s tourism base is significant, and the country is one of the world’s most popular long-haul
destinations. However, it has not reached its full potential and has the prospects of accelerating the
country’s recovery in the post COVID19 environment. 2019 saw 10,23 million international arrivals and
7,11 million domestic holiday trips. The African continent accounts for nearly three quarters of arrivals.
Although, the continent accounts for less than half of total spend so far, these arrivals
Page | 6
must also be seen in the context of a growing middle class in the continent and the prospects it provides
for the future. Key to growing value in tourist expenditure will be an increase in the market share from
high income global source markets, such as the UK, Germany and the USA, as well as high spending,
pre-Covid fastest growing markets such as China.
Tourism supports a vibrant and complex value chain that is not characterised by significant market
concentration or deep vertical integration like many others in South Africa. Growth in tourism promises
accessible employment opportunities, geographic diversification and increased foreign currency
receipts. The sector is therefore a strategic development priority and a catalyst in growing other linked
sector.
COMPLICATING FACTORS
However, tourism’s contribution to economic output and employment is flat on pre-2008 levels, while
global tourism growth has outstripped South Africa’s performance in the past decade. Compounding
these challenges is the impact of the COVID-19 pandemic. As already pointed out, the virus has
devastated the global travel trade and South Africa has not been spared.
Hoteliers large and small have closed establishments, attractions are shut and airlines have ceased
operations. Many businesses will not survive the shutdown. It is estimated that R54,2 billion in output
may already have been lost between mid-March and the end of May. The sector now faces a potential
75% revenue reduction in 2020, putting a further R149,7 billion in output, 438,000 jobs and R80,2 billion
in foreign receipts at risk.
The current global shutdown has no precedent, but history shows that tourism is resilient and can
rebound strongly from periods of crisis. Several features are common to successful recoveries; market
and consumer diversification, large-scale ROI-driven investment, effective messaging and product
differentiation. Globally, destination marketing organisations (DMOs) and multilateral organisations
have therefore focussed their COVID-19 crisis response on risk mitigation, safely restarting operations
and reimagining the sector. These global approach inform South Africa’s response.
OPPORTUNITY STATEMENT
The priority for tourism is to resume operations as early as it is safe to do so. This will minimise economic
and employment impacts and position the country for broader economic recovery. Thereafter, the sector
will need to develop clarity on how South Africa can outcompete in a market where every destination
will be chasing recovery. By extension, South Africa’s tourism ‘recovery’ cannot just mean a return to
pre-crisis levels and practices, but rather a growth trajectory that realises the country’s vast and diverse
tourism potential.
SCENARIOS, OUTLOOK AND TRAVEL POLICY
Current estimates forecast a global re-opening between August 2020 and early 2021. This scenario
assumes that the generally observed global recovery trajectory persists and that progress towards
enhanced treatments for COVID-19 continues. South Africa itself looks set to emerge more slowly than
many regions, although key source markets in Europe and North America are also facing a fragile
recovery.
It is therefore likely that tourism recovery will experience a number of phases, from hyper-local
community attractions, through broader domestic tourism, followed potentially by regional markets and
then the resumption of world-wide international travel. Strong domestic demand will be critical to
performance in the second half of 2020, while East Asian, Australasian and some markets in the African
continent currently show the most attractive combination of readiness and favourable seasonality to
Page | 7
contribute to early demand. All these, dependent on continued stability in transmissions from such
markets.
To facilitate gradual re-opening, the tourism sector, guided by the country’s Risk Adjusted Strategy, has
been pro-active in establishing biosecurity protocols that reduce transmission risk across all sub-sectors
and can adapt to changing requirements and best practice. These will be rolled out under a self-
regulation framework in conjunction with the government’s risk-adjusted strategy and will determine
when and how various industries within the tourism value chain are able to resume operations. Further,
to ensure that there is a consistent approach between affiliates and non-affiliates of the various business
representative groups, Norms and Standards for safe tourism operations will be developed to serve as
the minimum safety requirements for operations across the various sub-sectors.
As the world heads towards a new equilibrium, enduring restrictions on global mobility, such as reduced
air access, immigration stringency and complex port of entry procedures, are expected to soften travel
demand into 2021. While consumer sentiment indicates an enduring desire to travel, education and
transparency will be required to underwrite confidence and rebuild trust. Traveller behaviours and the
propensity of older segments to travel are certain to shift as a result of heightened health risks. Reduced
disposable income resulting from recessionary factors will have further downside implications for
demand.
RECOMMENDATIONS
Tourism recovery depends on early, responsible resumption coupled with a compelling and carefully
executed strategy for re-entry. The outlook is fluid and necessitates a balanced set of interventions that
consider both supply and demand-side support in line with a gradual easing of internal restrictions,
ideally timed to coincide with the traditional August-November international booking window.
Opportunities to strengthen sector enablement are also apparent.
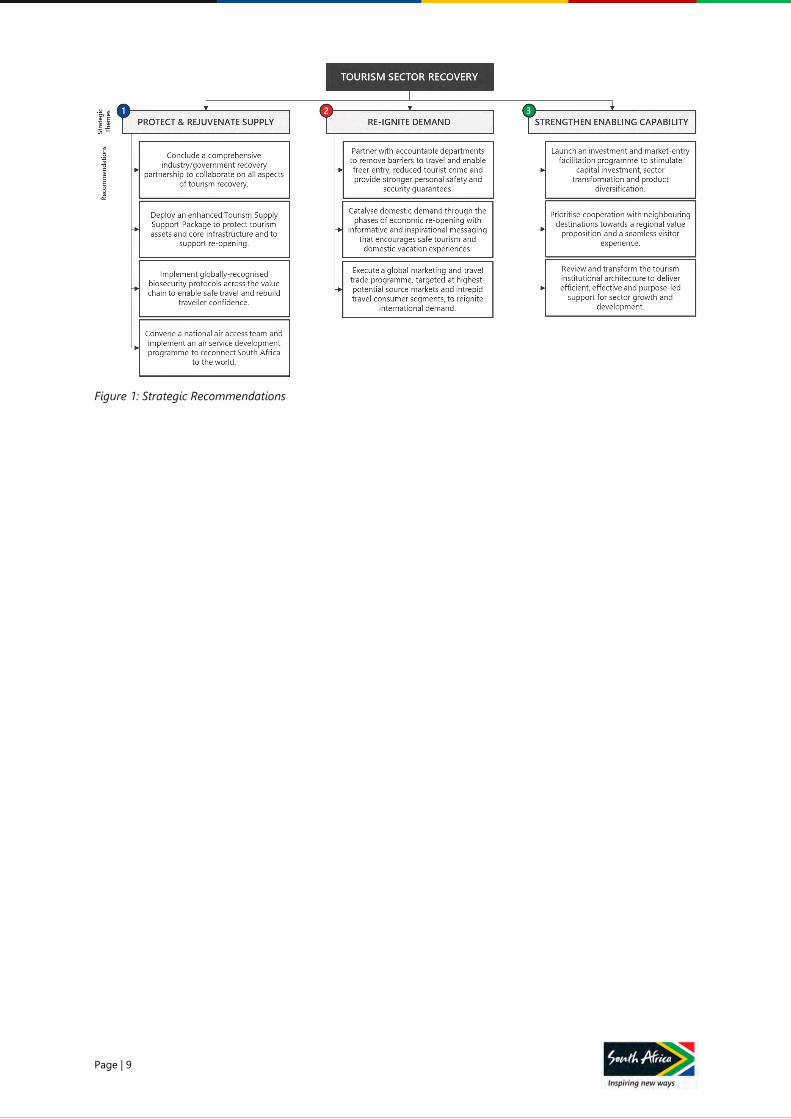
Three strategic themes are central to South Africa’s recovery: Re-Igniting Demand, Rejuvenating Supply
and Strengthening Enabling Capability. Underneath these themes, ten strategic recommendations are
proposed along with specific actions, timeframes and accountabilities.
Page | 8
Strategic Recommendations
1. Conclude a comprehensive industry/government recovery partnership to collaborate on all
aspects of tourism recovery guided by this recovery plan.
2. Government has R200 billion facility working together with the SARB and commercial banks that
tourism businesses are encouraged to apply for in order to access liquidity to protect tourism
assets, and core infrastructure
3. Introduce national Norms and Standards for safe tourism operations, inspired by globally
recognised biosecurity protocols across the value chain to enable safe travel and rebuild traveller
confidence
4. Enhance air access and implement an air service development programme to reconnect South
Africa to the world
5. Continue to work with sister departments to build on the work already done to increase ease of
access into South Africa for the purposes of stimulating the tourism, continue to intensify work
on tourism safety using our safety monitors programme and partnership with the police and
relevant stakeholders, finalise the introduction of e-visa programme for priority markets and
ensure effectiveness in the licensing of tour operators.
6. Catalyse domestic demand through the phases of economic re-opening with informative and
inspirational messaging that encourages safe tourism and domestic vacation experiences
7. Execute a global marketing and travel trade programme, targeted at highest-potential source
markets (in terms of volume and value) and intrepid travel consumer segments, to reignite
international demand
8. Launch an investment and market-entry facilitation programme to stimulate capital investment,
sector transformation and product diversification
9. Prioritise cooperation with neighbouring destinations towards a regional value proposition and a
seamless visitor experience through contributing the implementation of the SADC tourism
strategy
10. Review and transform the tourism policy and institutional architecture to deliver efficient,
effective and purpose-led support for sector growth and development
Page | 9
Figure 1: Strategic Recommendations
Page | 10
Protecting and Rejuvenating Supply
Supply-side interventions should initially focus on business continuity risks, aligning the value-chain to
new biosecurity standards, preserving air access, as well as investment facilitation and market access.
A number of general business continuity support interventions already exist, while Tourism-specific
measures to date include the R200 million Tourism Relief Fund, the waiver on Tourism Grading fees, and
the Tourist Guide Relief package to the tune of R30 million. Furthermore, Government has created a
R200 billion COVID-19 facility working together with the South African Reserve Bank and commercial
banks. This facility can be accessed by businesses in different sectors of the South African economy, this
facility will also benefit tourism businesses. To this end, tourism businesses are encouraged to make use
of this facility.
To facilitate early and safe re-opening, government welcomes the fact that the sector has established
biosecurity standards to reduce transmission risk. These standards align to global guidance, are designed
to be rolled out along the value chain within a self-regulation framework and can adapt to accommodate
new requirements. Several tourism sub-sectors are therefore candidates for early resumption and initial
steps to allow business travel operations to be used as a proof-point for broader re-opening.
Inbound air service and domestic and regional connectivity are critical for tourism recovery. To maximise
survival potential, domestic airlines need to resume commercially sustainable operations as soon as it is
safe and viable to do so. It is important to point out that domestic air travel has already commenced
within the context of government’s risk adjusted strategy, albeit in line with the permitted inter provincial
movement. The net assessment of airline and route risk suggests that for strategic and commercial
reasons the current roster of international airlines operating to South Africa looks reasonably secure.
However, a number of airlines and routes appear to be at risk based on 2019 data and the capacity
shortfall created by SAA will be substantial in the short-term. An Air Service Development (ASD)
programme should be convened to support connectivity to major source markets and develop access
to new markets. Strategic partnerships with airlines within the various regions of the world will enhance
efforts of recovery. The shall be explored carefully wit( the view to maximize the strategic partnership.
Many tourism businesses will not re-open or will be forced to close. This creates a risk of creating supply
constraints and creates two related imperatives; to attract capital investment into the sector, and to
further transformation and inclusion objectives in doing so. A concerted focus on supply rejuvenation is
therefore required, formalised under a collaborative investment promotion and market-entry facilitation
programme. This approach can be highly supportive of transformation objectives if it is underpinned by
a focus on enhancing SMME visibility, mobilising multi-stakeholder collaboration, developing
community assets and transforming spatial and ownership patterns.
Reigniting Demand
Reigniting demand requires a robust domestic marketing strategy, the agility to respond decisively
through an uncertain global re-opening phase and responsiveness to changes in consumer preference
that require a focus on intrepid, experiential traveller segments.
Leisure travel appetite post-crisis will be weighted towards the VFR and FIT segments, where authentic,
lower-density itineraries will be popular. Higher net-worth, experiential travel consumers, the ‘Intrepid
Traveller’, represent the highest potential segment and one that is common to most priority markets.
Consumers will place greater focus on their health and wellbeing and value for money, will avoid
crowded places and will plan thoroughly when making travel decisions. The trend towards independent,
digital distribution and booking will accelerate. Corporate domestic travel can be expected to revive
relatively early, however conventions and exhibitions, which rely on trust and certainty will be amongst
the last to recover.
Page | 11
Domestic tourism will initially be oriented towards hyper-local and local experiences, specifically day
trips and weekend retreats as well as business travel to critical customers, sites and suppliers. Visitor
attractions and experiences will play a crucial role in this early phase, helping to build confidence. The
risk adjusted approach by government has started to gradually allow demand to meet supply while
balancing this with managing the rate of transmission and the burden thereof on our health system.
Building on this, substitution leisure tourism, where South Africans who would previously have travelled
abroad choose instead to travel domestically, will represent an opportunity to capture and consolidate
new demand. Successfully executing across these first two phases will create the opportunity to
structurally change the domestic market as experience-based local travel becomes entrenched and
aspirational across a broad base of society.
In a market of scarce resources and uncertain timing, identifying the highest-potential inbound target
segments is foundational to the recovery strategy. However, the pandemic is forcing a rethink of
segmentation and more than ever, traveller psychology will be driven by universal factors. This presents
an opportunity for South Africa to shift to a psychographic-based segmentation to drive differentiation
since many competitors will revert to pre-crisis segmentation. ‘Intrepid Travellers’ are among the highest
spending global travellers for whom travel is a significant part of their lives. They are also the segment
that is most resilient to perceived issues around security. Recovery marketing should position the tourism
brand around the travel values of these segments and align them with the country’s exceptional cultural,
adventure and natural experiences.
The return of global tourism will see varying rates of recovery in source markets and marketing
investment must be carefully conserved to achieve maximum impact through the recovery cycle. This
can be best achieved by refining focus to nine overseas priority markets (Germany, the UK, France,
China, India, Netherlands, Australia, the USA and Canada) and high-potential regional markets (Tanzania,
Kenya, Nigeria and the DRC). A selection of other markets,1 can also deliver incremental growth, and
will need to be carefully considered in the emerging environment.
This targeting strategy, overlaid with re-opening timeframes in each market and a focus on multi-year
investment budgeting, discretionary travel and priority consumer segments can optimise resources and
fundamentally increase return on investment for destination marketing activities. In conjunction, high-
intensity barrier messaging can leverage South Africa’s responsible management of the crisis, the health-
oriented shift in safety and security concerns and favourable price/value for money conditions to
communicate a compelling proposition to potential travellers.
Strengthening Enabling Capability
While not a function of the pandemic, the piloting and roll-out of the proposed e-visa system to simplify
the visa and entry process, continuing clarification of birth certificate requirements for minors and the
expansion of visa-free entry agreements to cover more source markets remain critical. To this end, we
will continue to intensify our efforts in this regard.
From a tourism safety perspective, we will continue to work with the police to continue to deal with
hotspots and continue to roll out our comprehensive programme on tourist safety.
1 Suggested: Uganda, Ghana, Angola, Ethiopia, Botswana, Namibia, Sweden, Italy, Brazil
Page | 12
Figure 2: Recovery phases
In combination, these interventions can preserve significant value in the tourism sector and save may
thousands of associated jobs. The recommendations also provide the basis for stimulating tourism
supply and structurally increasing both domestic and inbound tourism demand. This can preserve some
R189 billion of value to 2022, helping the sector to recover to 2019 output levels and, while job losses
through the cycle will be unavoidable, employment would be expected to rebound in a similar fashion.
In all, it is estimated that the proposed measures can reduce the impact of the crisis on employment by
125,000 jobs. The net impact of the pandemic effects and proposed mitigation measures are summarised
in the figure that follows.
It is also important to recognise that growth in tourism promises accessible employment opportunities,
geographic diversification and increased foreign currency receipts. The sector has also proven to be
resilient through past crises and is therefore a strong contender for investment through the recovery
period. To outcompete in a soft and recovering market will require all means available, especially
considering the Rand’s recent deterioration in value.
Page | 13
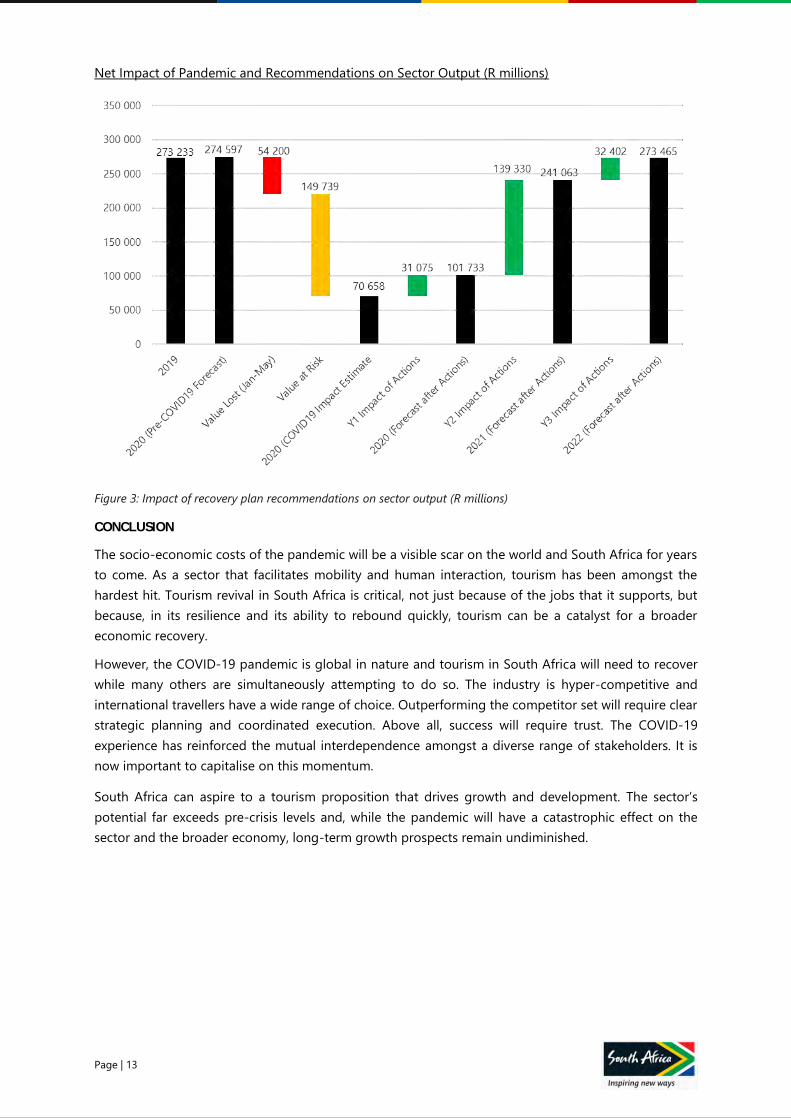
Net Impact of Pandemic and Recommendations on Sector Output (R millions)
Figure 3: Impact of recovery plan recommendations on sector output (R millions)
CONCLUSION
The socio-economic costs of the pandemic will be a visible scar on the world and South Africa for years
to come. As a sector that facilitates mobility and human interaction, tourism has been amongst the
hardest hit. Tourism revival in South Africa is critical, not just because of the jobs that it supports, but
because, in its resilience and its ability to rebound quickly, tourism can be a catalyst for a broader
economic recovery.
However, the COVID-19 pandemic is global in nature and tourism in South Africa will need to recover
while many others are simultaneously attempting to do so. The industry is hyper-competitive and
international travellers have a wide range of choice. Outperforming the competitor set will require clear
strategic planning and coordinated execution. Above all, success will require trust. The COVID-19
experience has reinforced the mutual interdependence amongst a diverse range of stakeholders. It is
now important to capitalise on this momentum.
South Africa can aspire to a tourism proposition that drives growth and development. The sector’s
potential far exceeds pre-crisis levels and, while the pandemic will have a catastrophic effect on the
sector and the broader economy, long-term growth prospects remain undiminished.

Page | 14
INTRODUCTION
Page | 15
I N T R O D U C T I O N
SCOPE, OBJECTIVES AND ACKNOWLEDGEMENTS
The COVID-19 pandemic of 2020 has had a profound impact on societies and economies across the
world. As an industry that facilitates mobility and human interaction, the travel and tourism sector has
been amongst the hardest hit. Ubiquitous national-level restrictions have sharply curtailed tourism
activity everywhere and the local industry has not been spared. While a gradual re-opening of society is
underway, the pandemic in the country has not yet reached its peak and the long process towards
recovery is just beginning.
As tourism crises elsewhere have demonstrated, tourism is capable of bouncing back strongly. A
rebound is not guaranteed, however, and in the current pandemic every other global tourism destination
will be attempting to recover simultaneously. The opportunity presented by this global reset should also
not be underestimated; forward bookings have been cleared out, air routes will have to be renegotiated
and traveller priorities will change. There may never be a bigger opportunity to fundamentally reposition
South Africa as a tourism destination in the eyes of the world.
A clear and differentiated strategy is therefore essential. To capture the opportunity requires an urgent
response to the current crisis, but also a recognition of the structural factors that have acted as a drag
on tourism growth. By developing plausible recovery scenarios for the return of travel, this report informs
the timing, shape and geography of recovery potential. Alongside this, measures to address the
structural performance gap combine to direct implementation and the prioritisation of effort and
resources.
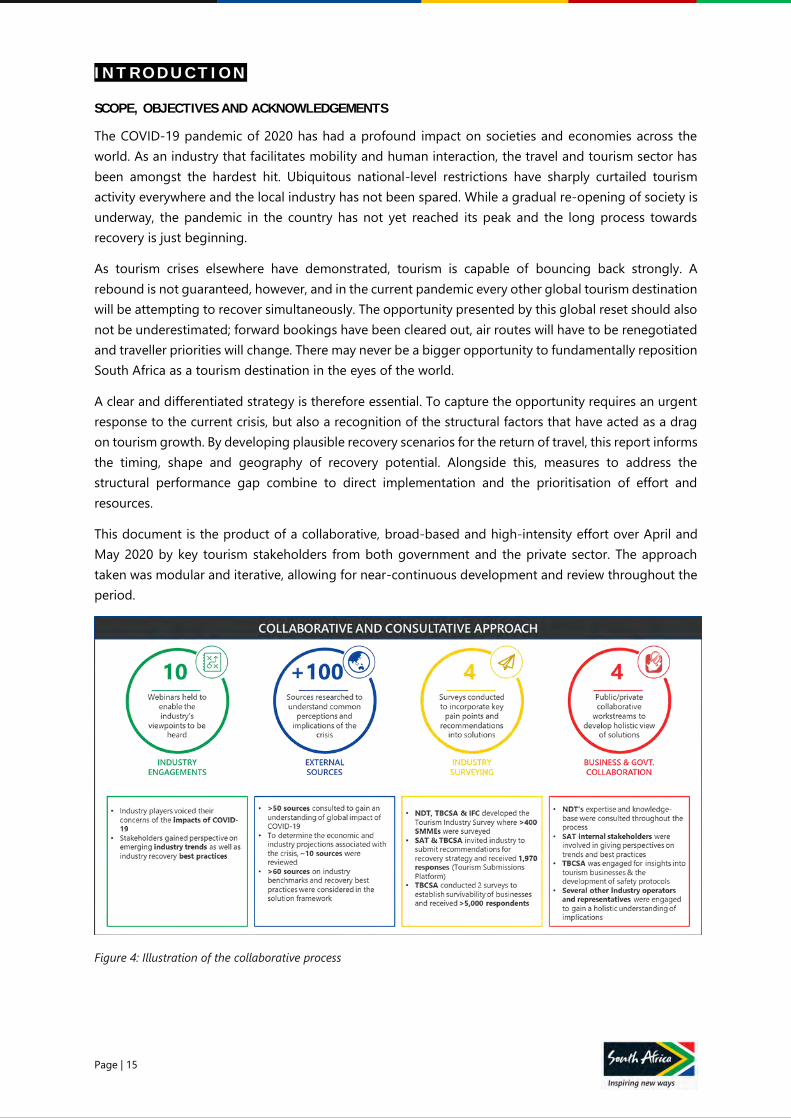
This document is the product of a collaborative, broad-based and high-intensity effort over April and
May 2020 by key tourism stakeholders from both government and the private sector. The approach
taken was modular and iterative, allowing for near-continuous development and review throughout the
period.
Figure 4: Illustration of the collaborative process
Page | 16
TOURISM IN SOUTH AFRICA
Overview and Economic Contribution
South Africa is geopolitically distinctive and possesses natural and cultural diversity that supports a
globally compelling tourism proposition. As the sixth most biodiverse country in the world (African Wild
Life Foundation, 2018) and by far the most diverse for its size, South Africa is blessed with outstanding
ecological richness. Seven distinct biomes occur within the country’s borders and these are showcased
within five world heritage sites, twenty-two national parks and hundreds of game and nature reserves.
Natural riches are mirrored by a demographic diversity whose ancient roots, deep and varied cultures
and complex history combine to create a rich tapestry of human experience. The country’s recent
liberation from Apartheid and the construction of a multi-racial democratic dispensation is a touchstone
for universal aspirations of peace, freedom, equality and dignity. These core differentiators are reflected
in a tourism value proposition that offers high-quality, value-for-money experiences spanning wildlife
and safari, the scenic outdoors, beaches, adventure tourism, cultural and city lifestyles.
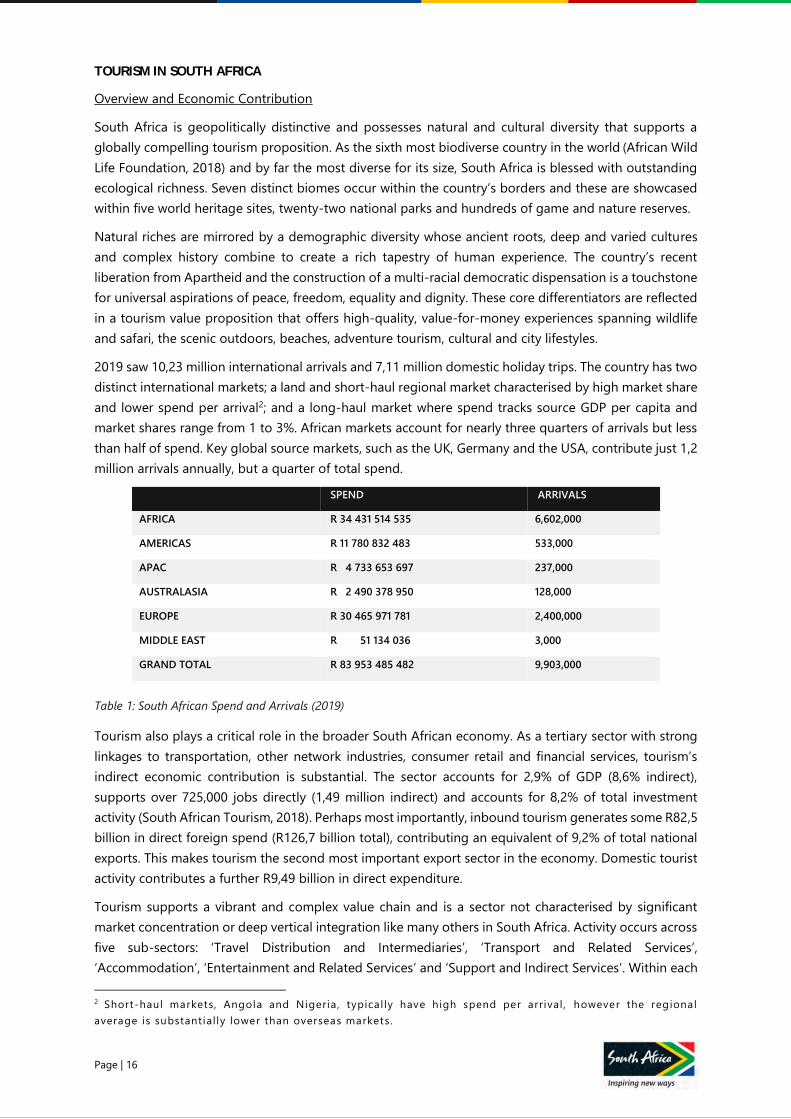
2019 saw 10,23 million international arrivals and 7,11 million domestic holiday trips. The country has two
distinct international markets; a land and short-haul regional market characterised by high market share
and lower spend per arrival2; and a long-haul market where spend tracks source GDP per capita and
market shares range from 1 to 3%. African markets account for nearly three quarters of arrivals but less
than half of spend. Key global source markets, such as the UK, Germany and the USA, contribute just 1,2
million arrivals annually, but a quarter of total spend.
SPEND ARRIVALS
AFRICA R 34 431 514 535 6,602,000
AMERICAS R 11 780 832 483 533,000
APAC R 4 733 653 697 237,000
AUSTRALASIA R 2 490 378 950 128,000
EUROPE R 30 465 971 781 2,400,000
MIDDLE EAST R 51 134 036 3,000
GRAND TOTAL R 83 953 485 482 9,903,000
Table 1: South African Spend and Arrivals (2019)
Tourism also plays a critical role in the broader South African economy. As a tertiary sector with strong
linkages to transportation, other network industries, consumer retail and financial services, tourism’s
indirect economic contribution is substantial. The sector accounts for 2,9% of GDP (8,6% indirect),
supports over 725,000 jobs directly (1,49 million indirect) and accounts for 8,2% of total investment
activity (South African Tourism, 2018). Perhaps most importantly, inbound tourism generates some R82,5
billion in direct foreign spend (R126,7 billion total), contributing an equivalent of 9,2% of total national
exports. This makes tourism the second most important export sector in the economy. Domestic tourist
activity contributes a further R9,49 billion in direct expenditure.
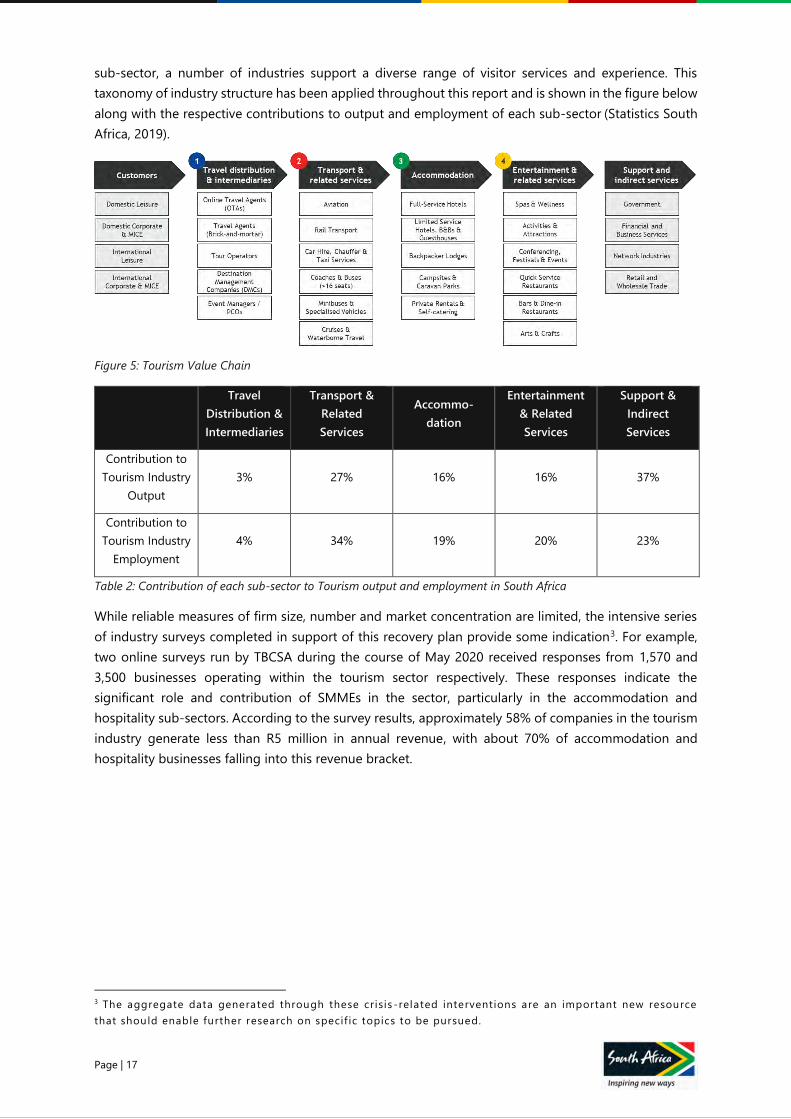
Tourism supports a vibrant and complex value chain and is a sector not characterised by significant
market concentration or deep vertical integration like many others in South Africa. Activity occurs across
five sub-sectors: ‘Travel Distribution and Intermediaries’, ‘Transport and Related Services’,
‘Accommodation’, ‘Entertainment and Related Services’ and ‘Support and Indirect Services’. Within each
2 Short-haul markets, Angola and Nigeria, typically have high spend per arrival , however the regional
average is substantially lower than overseas markets.
Page | 17
sub-sector, a number of industries support a diverse range of visitor services and experience. This
taxonomy of industry structure has been applied throughout this report and is shown in the figure below
along with the respective contributions to output and employment of each sub-sector (Statistics South
Africa, 2019).
Figure 5: Tourism Value Chain
Travel
Distribution &
Intermediaries
Transport &
Related
Services
Accommo-
dation
Entertainment
& Related
Services
Support &
Indirect
Services
Contribution to
Tourism Industry
Output
3% 27% 16% 16% 37%
Contribution to
Tourism Industry
Employment
4% 34% 19% 20% 23%
Table 2: Contribution of each sub-sector to Tourism output and employment in South Africa
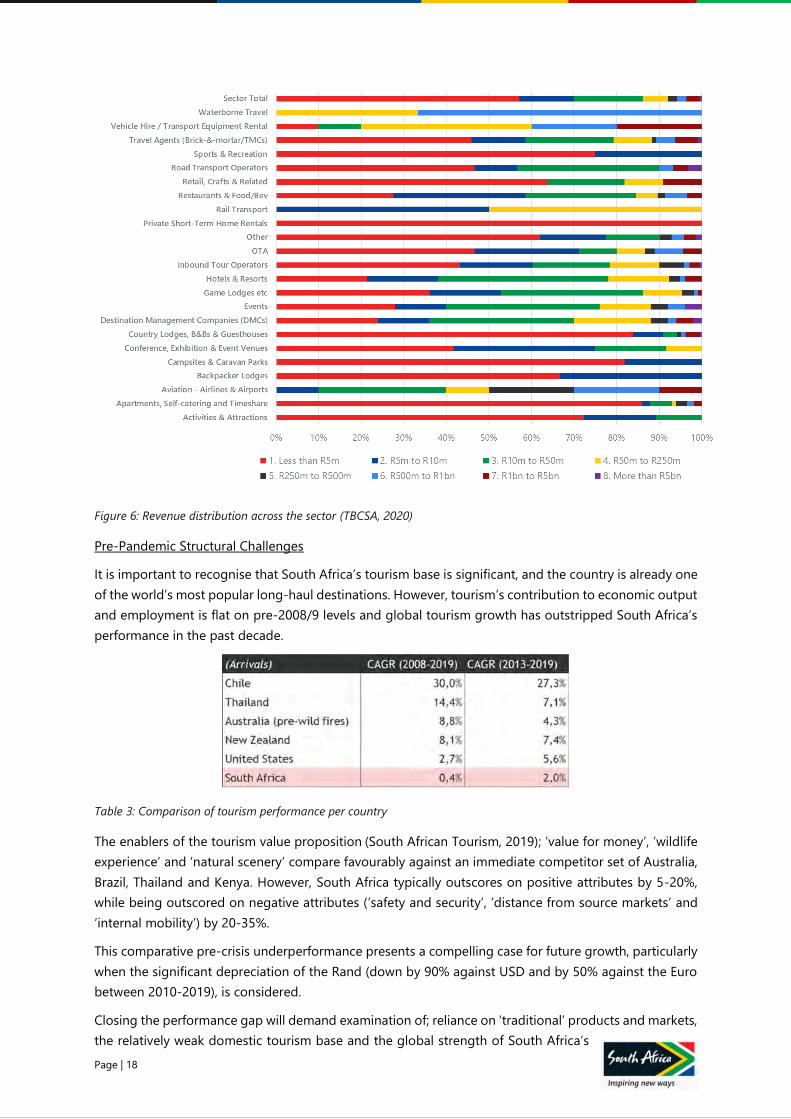
While reliable measures of firm size, number and market concentration are limited, the intensive series
of industry surveys completed in support of this recovery plan provide some indication3. For example,
two online surveys run by TBCSA during the course of May 2020 received responses from 1,570 and
3,500 businesses operating within the tourism sector respectively. These responses indicate the
significant role and contribution of SMMEs in the sector, particularly in the accommodation and
hospitality sub-sectors. According to the survey results, approximately 58% of companies in the tourism
industry generate less than R5 million in annual revenue, with about 70% of accommodation and
hospitality businesses falling into this revenue bracket.
3 The aggregate data generated through these crisis -related interventions are an important new resource
that should enable further research on specif ic topics to be pursued.
Page | 18
Figure 6: Revenue distribution across the sector (TBCSA, 2020)
Pre-Pandemic Structural Challenges
It is important to recognise that South Africa’s tourism base is significant, and the country is already one
of the world’s most popular long-haul destinations. However, tourism’s contribution to economic output
and employment is flat on pre-2008/9 levels and global tourism growth has outstripped South Africa’s
performance in the past decade.
Table 3: Comparison of tourism performance per country
The enablers of the tourism value proposition (South African Tourism, 2019); ‘value for money’, ‘wildlife
experience’ and ‘natural scenery’ compare favourably against an immediate competitor set of Australia,
Brazil, Thailand and Kenya. However, South Africa typically outscores on positive attributes by 5-20%,
while being outscored on negative attributes (‘safety and security’, ‘distance from source markets’ and
‘internal mobility’) by 20-35%.
This comparative pre-crisis underperformance presents a compelling case for future growth, particularly
when the significant depreciation of the Rand (down by 90% against USD and by 50% against the Euro
between 2010-2019), is considered.
Closing the performance gap will demand examination of; reliance on ‘traditional’ products and markets,
the relatively weak domestic tourism base and the global strength of South Africa’s
Page | 19
nation destination brand4. Underpinning these factors is the legacy of exclusion and persistent
inequality, which erects barriers to entry, disincentivises innovation and creates policy complexity5.
International inbound tourism is a sector that has, to a large extent, emerged in the post-Apartheid
period and is therefore a product of the democratic new South Africa. Growth in tourism creates
accessible employment opportunities, drives geographic diversification of development, and supports
rural communities as well as increasing foreign currency receipts, thereby contributing significantly to
the expansion of final demand. The sector is therefore a strategic development priority.
4 Domestic tr ips dropped by ~13.8% from 2017 to 2018 and fel l short of the 2018 target by ~23% . South
Africa has, by far, the largest Travel & Tourism industry in Sub -Saharan Afr ica ranking second regional ly
and 61st globally on the index
5 Though the tourism industry is one of the sectors with low B-BBEE non-compliance, black ownership in the
tourism sector has reduced from ~41% in 2017 to ~34% in 2018 (B -BBEE Commission, 2019), further
entrenching the legacy of exclusion .
Page | 20
THE IMPACT OF THE
COVID-19 PANDEMIC
Page | 21
T H E I M P A C T O F T H E C O V I D - 1 9 P A N D E M I C
ECONOMIC IMPACT OF COVID-19
Impact on the Global Economy
In the short time from late December, when reports emerged in Wuhan, China, of a deadly pneumonia-
like illness that was causing concern, to the beginning of February when the virus, now identified as
SARS-COV-2, took hold in Italy and initiated a worldwide lockdown that still endures more than four
months later, COVID-19 has had a rapid and far-reaching effect on global society.
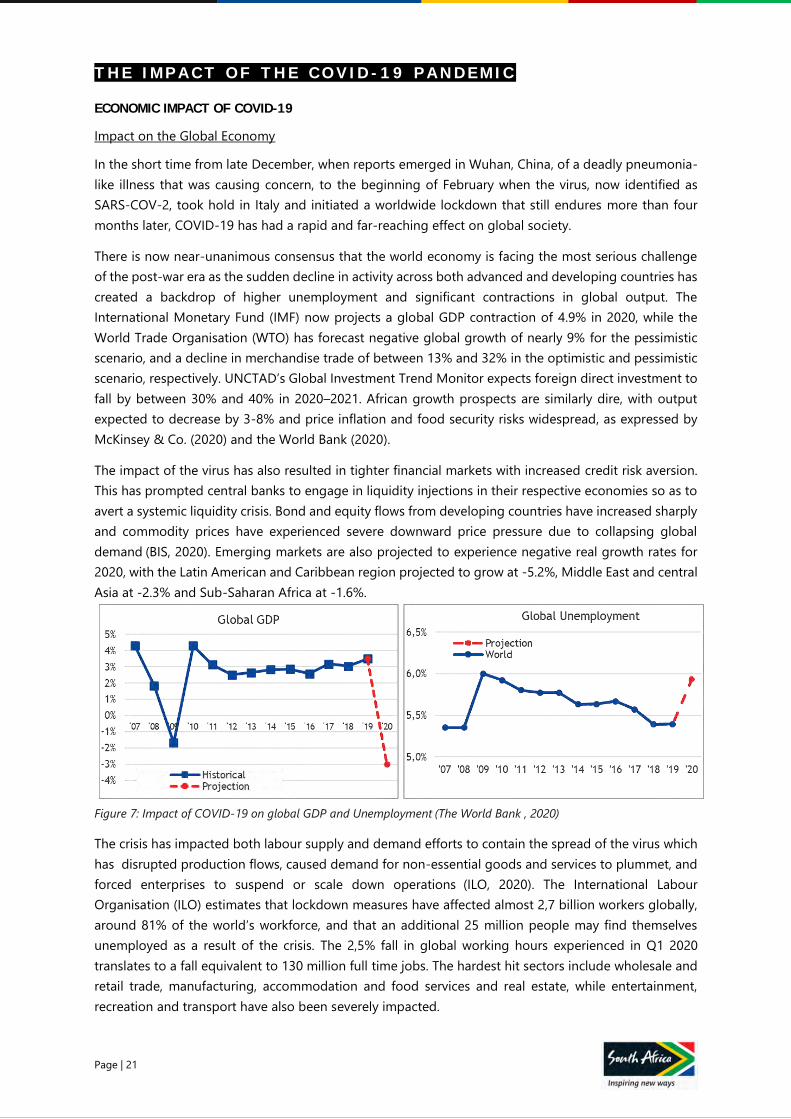
There is now near-unanimous consensus that the world economy is facing the most serious challenge
of the post-war era as the sudden decline in activity across both advanced and developing countries has
created a backdrop of higher unemployment and significant contractions in global output. The
International Monetary Fund (IMF) now projects a global GDP contraction of 4.9% in 2020, while the
World Trade Organisation (WTO) has forecast negative global growth of nearly 9% for the pessimistic
scenario, and a decline in merchandise trade of between 13% and 32% in the optimistic and pessimistic
scenario, respectively. UNCTAD’s Global Investment Trend Monitor expects foreign direct investment to
fall by between 30% and 40% in 2020–2021. African growth prospects are similarly dire, with output
expected to decrease by 3-8% and price inflation and food security risks widespread, as expressed by
McKinsey & Co. (2020) and the World Bank (2020).
The impact of the virus has also resulted in tighter financial markets with increased credit risk aversion.
This has prompted central banks to engage in liquidity injections in their respective economies so as to
avert a systemic liquidity crisis. Bond and equity flows from developing countries have increased sharply
and commodity prices have experienced severe downward price pressure due to collapsing global
demand (BIS, 2020). Emerging markets are also projected to experience negative real growth rates for
2020, with the Latin American and Caribbean region projected to grow at -5.2%, Middle East and central
Asia at -2.3% and Sub-Saharan Africa at -1.6%.
Figure 7: Impact of COVID-19 on global GDP and Unemployment (The World Bank , 2020)
The crisis has impacted both labour supply and demand efforts to contain the spread of the virus which
has disrupted production flows, caused demand for non-essential goods and services to plummet, and
forced enterprises to suspend or scale down operations (ILO, 2020). The International Labour
Organisation (ILO) estimates that lockdown measures have affected almost 2,7 billion workers globally,
around 81% of the world’s workforce, and that an additional 25 million people may find themselves
unemployed as a result of the crisis. The 2,5% fall in global working hours experienced in Q1 2020
translates to a fall equivalent to 130 million full time jobs. The hardest hit sectors include wholesale and
retail trade, manufacturing, accommodation and food services and real estate, while entertainment,
recreation and transport have also been severely impacted.
Page | 22
Impact on the Domestic Economy
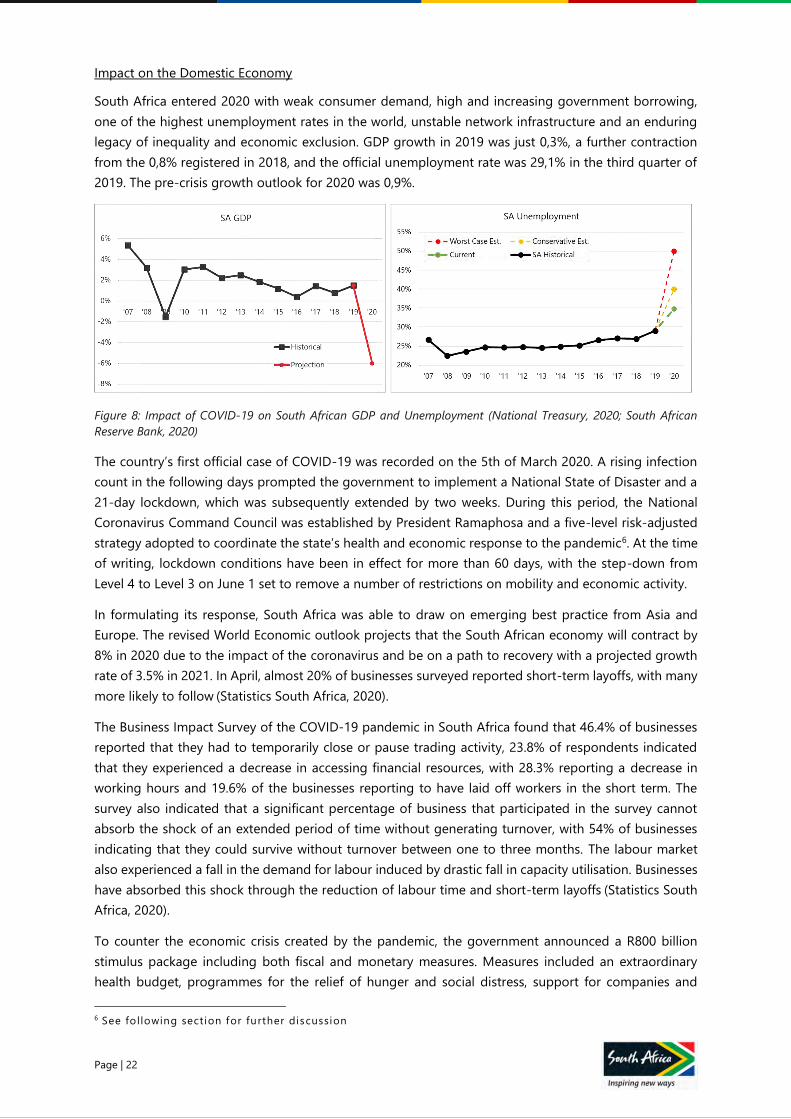
South Africa entered 2020 with weak consumer demand, high and increasing government borrowing,
one of the highest unemployment rates in the world, unstable network infrastructure and an enduring
legacy of inequality and economic exclusion. GDP growth in 2019 was just 0,3%, a further contraction
from the 0,8% registered in 2018, and the official unemployment rate was 29,1% in the third quarter of
2019. The pre-crisis growth outlook for 2020 was 0,9%.
Figure 8: Impact of COVID-19 on South African GDP and Unemployment (National Treasury, 2020; South African
Reserve Bank, 2020)
The country’s first official case of COVID-19 was recorded on the 5th of March 2020. A rising infection
count in the following days prompted the government to implement a National State of Disaster and a
21-day lockdown, which was subsequently extended by two weeks. During this period, the National
Coronavirus Command Council was established by President Ramaphosa and a five-level risk-adjusted
strategy adopted to coordinate the state’s health and economic response to the pandemic6. At the time
of writing, lockdown conditions have been in effect for more than 60 days, with the step-down from
Level 4 to Level 3 on June 1 set to remove a number of restrictions on mobility and economic activity.
In formulating its response, South Africa was able to draw on emerging best practice from Asia and
Europe. The revised World Economic outlook projects that the South African economy will contract by
8% in 2020 due to the impact of the coronavirus and be on a path to recovery with a projected growth
rate of 3.5% in 2021. In April, almost 20% of businesses surveyed reported short-term layoffs, with many
more likely to follow (Statistics South Africa, 2020).
The Business Impact Survey of the COVID-19 pandemic in South Africa found that 46.4% of businesses
reported that they had to temporarily close or pause trading activity, 23.8% of respondents indicated
that they experienced a decrease in accessing financial resources, with 28.3% reporting a decrease in
working hours and 19.6% of the businesses reporting to have laid off workers in the short term. The
survey also indicated that a significant percentage of business that participated in the survey cannot
absorb the shock of an extended period of time without generating turnover, with 54% of businesses
indicating that they could survive without turnover between one to three months. The labour market
also experienced a fall in the demand for labour induced by drastic fall in capacity utilisation. Businesses
have absorbed this shock through the reduction of labour time and short-term layoffs (Statistics South
Africa, 2020).
To counter the economic crisis created by the pandemic, the government announced a R800 billion
stimulus package including both fiscal and monetary measures. Measures included an extraordinary
health budget, programmes for the relief of hunger and social distress, support for companies and
6 See following section for further discussion
Page | 23
workers and a R200 billion guaranteed loan scheme to supply liquidity to distressed businesses
supported by National Treasury, the SARB and the major commercial banks.
TOURISM IMPACT OF COVID-19
Impact on the Global Tourism Economy
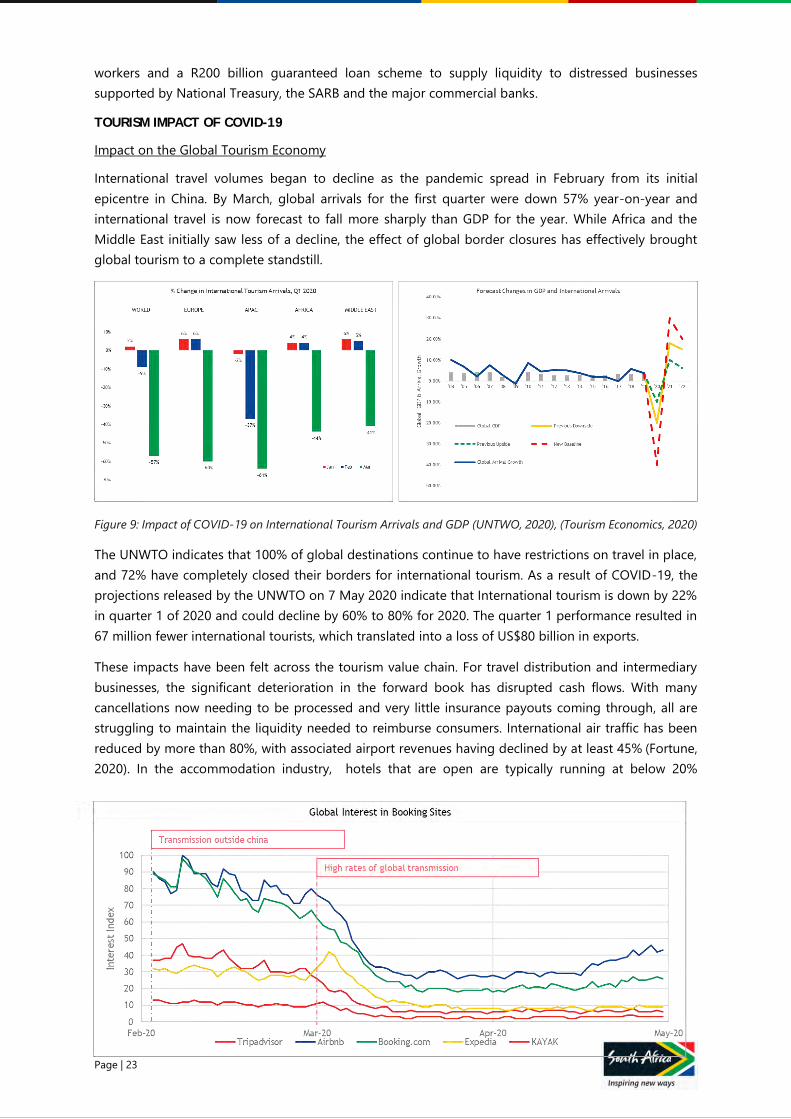
International travel volumes began to decline as the pandemic spread in February from its initial
epicentre in China. By March, global arrivals for the first quarter were down 57% year-on-year and
international travel is now forecast to fall more sharply than GDP for the year. While Africa and the
Middle East initially saw less of a decline, the effect of global border closures has effectively brought
global tourism to a complete standstill.
Figure 9: Impact of COVID-19 on International Tourism Arrivals and GDP (UNTWO, 2020), (Tourism Economics, 2020)
The UNWTO indicates that 100% of global destinations continue to have restrictions on travel in place,
and 72% have completely closed their borders for international tourism. As a result of COVID-19, the
projections released by the UNWTO on 7 May 2020 indicate that International tourism is down by 22%
in quarter 1 of 2020 and could decline by 60% to 80% for 2020. The quarter 1 performance resulted in
67 million fewer international tourists, which translated into a loss of US$80 billion in exports.
These impacts have been felt across the tourism value chain. For travel distribution and intermediary
businesses, the significant deterioration in the forward book has disrupted cash flows. With many
cancellations now needing to be processed and very little insurance payouts coming through, all are
struggling to maintain the liquidity needed to reimburse consumers. International air traffic has been
reduced by more than 80%, with associated airport revenues having declined by at least 45% (Fortune,
2020). In the accommodation industry, hotels that are open are typically running at below 20%
Page | 24
occupancy. In the United States alone, restaurants are expected to register $255 billion in losses in just
three months while the jobs of 7 million employees are at risk.
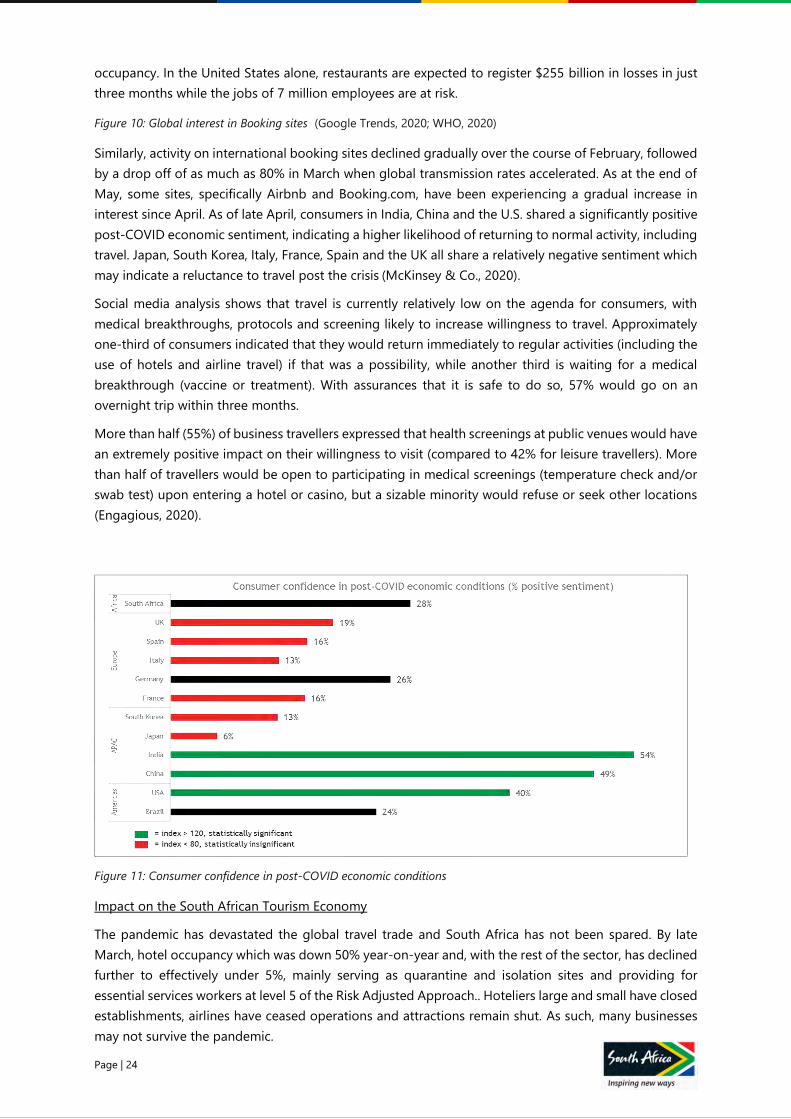
Figure 10: Global interest in Booking sites (Google Trends, 2020; WHO, 2020)
Similarly, activity on international booking sites declined gradually over the course of February, followed
by a drop off of as much as 80% in March when global transmission rates accelerated. As at the end of
May, some sites, specifically Airbnb and Booking.com, have been experiencing a gradual increase in
interest since April. As of late April, consumers in India, China and the U.S. shared a significantly positive
post-COVID economic sentiment, indicating a higher likelihood of returning to normal activity, including
travel. Japan, South Korea, Italy, France, Spain and the UK all share a relatively negative sentiment which
may indicate a reluctance to travel post the crisis (McKinsey & Co., 2020).
Social media analysis shows that travel is currently relatively low on the agenda for consumers, with
medical breakthroughs, protocols and screening likely to increase willingness to travel. Approximately
one-third of consumers indicated that they would return immediately to regular activities (including the
use of hotels and airline travel) if that was a possibility, while another third is waiting for a medical
breakthrough (vaccine or treatment). With assurances that it is safe to do so, 57% would go on an
overnight trip within three months.
More than half (55%) of business travellers expressed that health screenings at public venues would have
an extremely positive impact on their willingness to visit (compared to 42% for leisure travellers). More
than half of travellers would be open to participating in medical screenings (temperature check and/or
swab test) upon entering a hotel or casino, but a sizable minority would refuse or seek other locations
(Engagious, 2020).
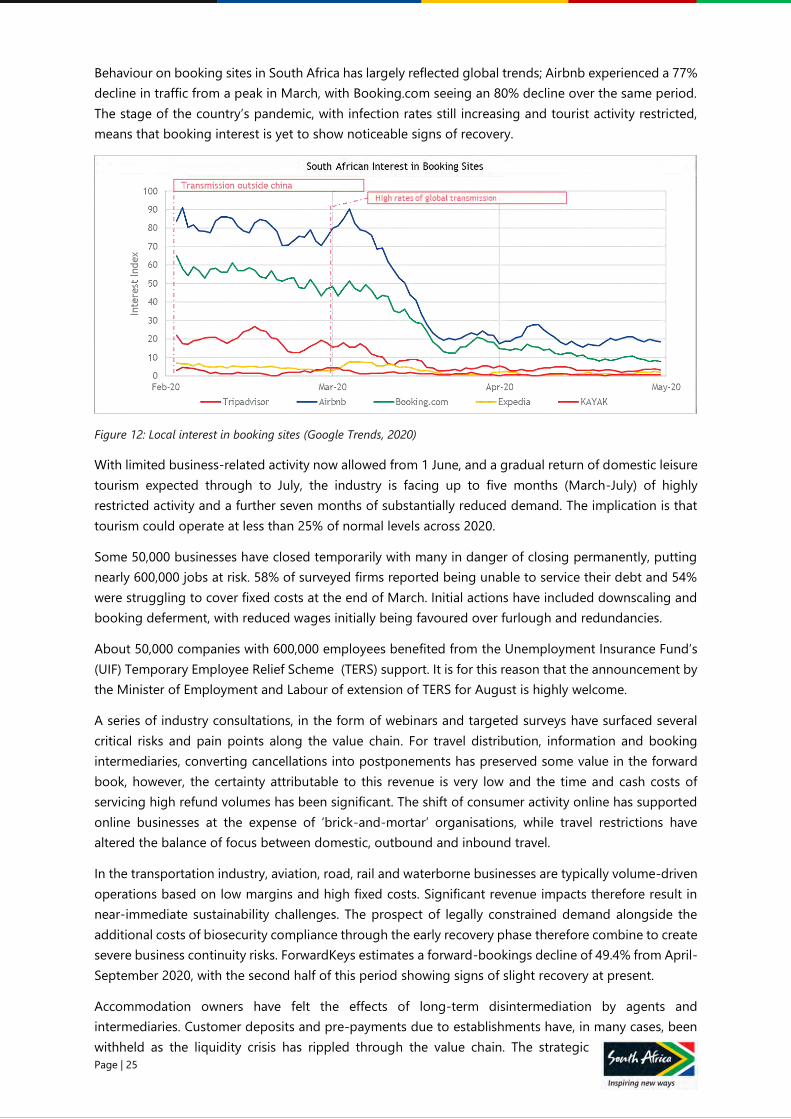
Figure 11: Consumer confidence in post-COVID economic conditions
Impact on the South African Tourism Economy
The pandemic has devastated the global travel trade and South Africa has not been spared. By late
March, hotel occupancy which was down 50% year-on-year and, with the rest of the sector, has declined
further to effectively under 5%, mainly serving as quarantine and isolation sites and providing for
essential services workers at level 5 of the Risk Adjusted Approach.. Hoteliers large and small have closed
establishments, airlines have ceased operations and attractions remain shut. As such, many businesses
may not survive the pandemic.
Page | 25
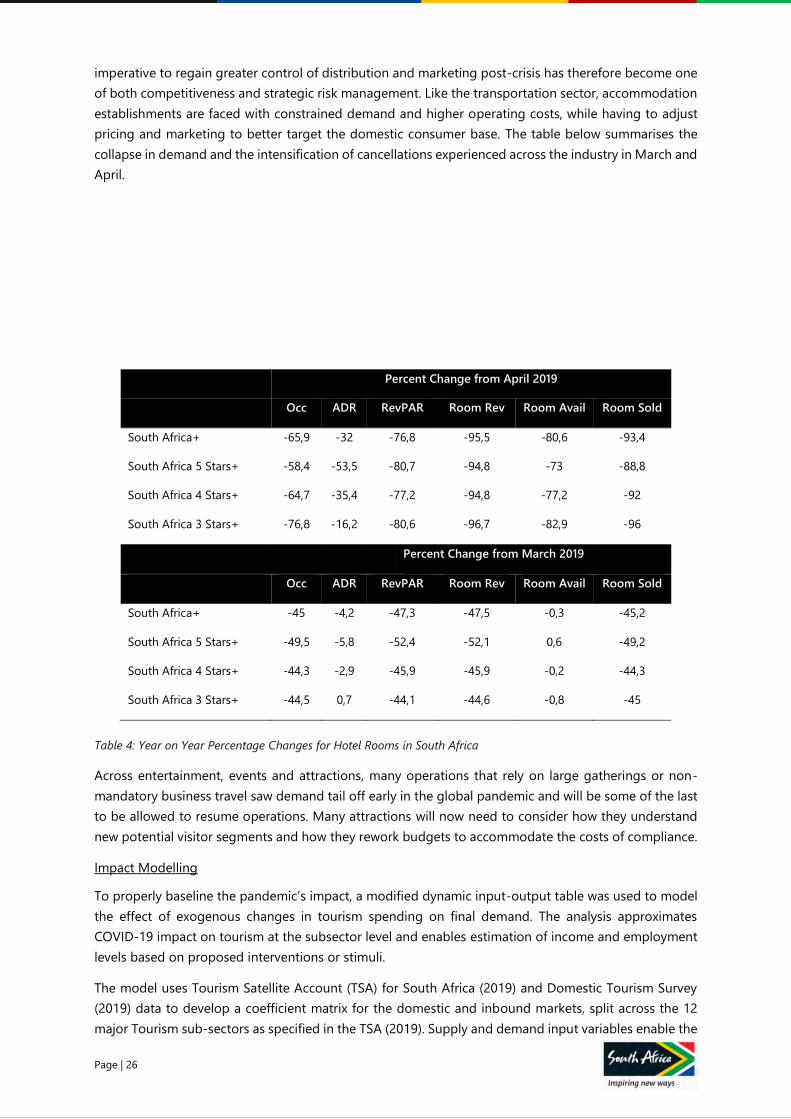
Behaviour on booking sites in South Africa has largely reflected global trends; Airbnb experienced a 77%
decline in traffic from a peak in March, with Booking.com seeing an 80% decline over the same period.
The stage of the country’s pandemic, with infection rates still increasing and tourist activity restricted,
means that booking interest is yet to show noticeable signs of recovery.
Figure 12: Local interest in booking sites (Google Trends, 2020)
With limited business-related activity now allowed from 1 June, and a gradual return of domestic leisure
tourism expected through to July, the industry is facing up to five months (March-July) of highly
restricted activity and a further seven months of substantially reduced demand. The implication is that
tourism could operate at less than 25% of normal levels across 2020.
Some 50,000 businesses have closed temporarily with many in danger of closing permanently, putting
nearly 600,000 jobs at risk. 58% of surveyed firms reported being unable to service their debt and 54%
were struggling to cover fixed costs at the end of March. Initial actions have included downscaling and
booking deferment, with reduced wages initially being favoured over furlough and redundancies.
About 50,000 companies with 600,000 employees benefited from the Unemployment Insurance Fund’s
(UIF) Temporary Employee Relief Scheme (TERS) support. It is for this reason that the announcement by
the Minister of Employment and Labour of extension of TERS for August is highly welcome.
A series of industry consultations, in the form of webinars and targeted surveys have surfaced several
critical risks and pain points along the value chain. For travel distribution, information and booking
intermediaries, converting cancellations into postponements has preserved some value in the forward
book, however, the certainty attributable to this revenue is very low and the time and cash costs of
servicing high refund volumes has been significant. The shift of consumer activity online has supported
online businesses at the expense of ‘brick-and-mortar’ organisations, while travel restrictions have
altered the balance of focus between domestic, outbound and inbound travel.
In the transportation industry, aviation, road, rail and waterborne businesses are typically volume-driven
operations based on low margins and high fixed costs. Significant revenue impacts therefore result in
near-immediate sustainability challenges. The prospect of legally constrained demand alongside the
additional costs of biosecurity compliance through the early recovery phase therefore combine to create
severe business continuity risks. ForwardKeys estimates a forward-bookings decline of 49.4% from April-
September 2020, with the second half of this period showing signs of slight recovery at present.
Accommodation owners have felt the effects of long-term disintermediation by agents and
intermediaries. Customer deposits and pre-payments due to establishments have, in many cases, been
withheld as the liquidity crisis has rippled through the value chain. The strategic
Page | 26
imperative to regain greater control of distribution and marketing post-crisis has therefore become one
of both competitiveness and strategic risk management. Like the transportation sector, accommodation
establishments are faced with constrained demand and higher operating costs, while having to adjust
pricing and marketing to better target the domestic consumer base. The table below summarises the
collapse in demand and the intensification of cancellations experienced across the industry in March and
April.
Percent Change from April 2019
Occ ADR RevPAR Room Rev Room Avail Room Sold
South Africa+ -65,9 -32 -76,8 -95,5 -80,6 -93,4
South Africa 5 Stars+ -58,4 -53,5 -80,7 -94,8 -73 -88,8
South Africa 4 Stars+ -64,7 -35,4 -77,2 -94,8 -77,2 -92
South Africa 3 Stars+ -76,8 -16,2 -80,6 -96,7 -82,9 -96
Percent Change from March 2019
Occ ADR RevPAR Room Rev Room Avail Room Sold
South Africa+ -45 -4,2 -47,3 -47,5 -0,3 -45,2
South Africa 5 Stars+ -49,5 -5,8 -52,4 -52,1 0,6 -49,2
South Africa 4 Stars+ -44,3 -2,9 -45,9 -45,9 -0,2 -44,3
South Africa 3 Stars+ -44,5 0,7 -44,1 -44,6 -0,8 -45
Table 4: Year on Year Percentage Changes for Hotel Rooms in South Africa
Across entertainment, events and attractions, many operations that rely on large gatherings or non-
mandatory business travel saw demand tail off early in the global pandemic and will be some of the last
to be allowed to resume operations. Many attractions will now need to consider how they understand
new potential visitor segments and how they rework budgets to accommodate the costs of compliance.
Impact Modelling
To properly baseline the pandemic’s impact, a modified dynamic input-output table was used to model
the effect of exogenous changes in tourism spending on final demand. The analysis approximates
COVID-19 impact on tourism at the subsector level and enables estimation of income and employment
levels based on proposed interventions or stimuli.
The model uses Tourism Satellite Account (TSA) for South Africa (2019) and Domestic Tourism Survey
(2019) data to develop a coefficient matrix for the domestic and inbound markets, split across the 12
major Tourism sub-sectors as specified in the TSA (2019). Supply and demand input variables enable the
Page | 27
impact on projected revenue under various scenarios to be assessed7. This approach enables specific
answers to be developed to policy questions such as: the short, medium and long-term effects on
revenue, likely associated job losses and the sub-sectors and regions that are most at risk.
To standardise input assumptions across a wide variety of variables and different scenarios, a supporting
supply/demand input model was developed. This model draws on survey data gathered during the
project phase (TBCSA, 2020) to simulate demand and supply inputs based on permissible demand under
the risk-adjusted strategy, tourism product supply based on survival estimates given ‘no revenue’
conditions and potential demand suppression as a result of consumer reticence to travel. The
supply/demand input model also accommodates specific assumptions developed to quantify the
recommendations presented in the following section.
Before the pandemic effects became apparent, expectations were that the sector would enjoy something
of a rebound year in 2020. Anecdotal accounts suggest that 2019/20 had started well, bookings for the
remainder of the season were strong and operators were looking at healthy demand for the 2020/21
season to follow. SA Tourism was similarly targeting 8,7% year-on-year growth in inbound arrivals. This
generates a base pre-COVID-19 scenario of total internal tourism expenditure (inbound and domestic)
for 2020 of about R273 billion.
As the scale of the crisis grew in the early months of 2020 and the realities of worldwide virus
transmission became apparent, global demand began to soften, and the hard travel restrictions
implemented between February and March abruptly curtailed tourism activity. The impact of this hard
stop in terms of value already lost between February and May is estimated at R54,2 billion.
The prevailing outlook for sector re-opening has been driven by government’s risk-adjusted strategy,
which initially indicated full domestic re-opening in Q4 2020 and inbound re-opening in early 2021.
Under this scenario, and before President Ramaphosa’s decision to take the county down to Level 3 on
1 June, the forecasted revenue loss for the remainder of the year was R149,7 billion, with as many as
438,000 jobs likely to be lost.
7 See appendix for methodology
Page | 28
EPIDEMIOLOGICAL
SCENARIOS
Page | 29
E P I D E M I O L O G I C A L S C E N A R I O S
SCENARIO DEVELOPMENT
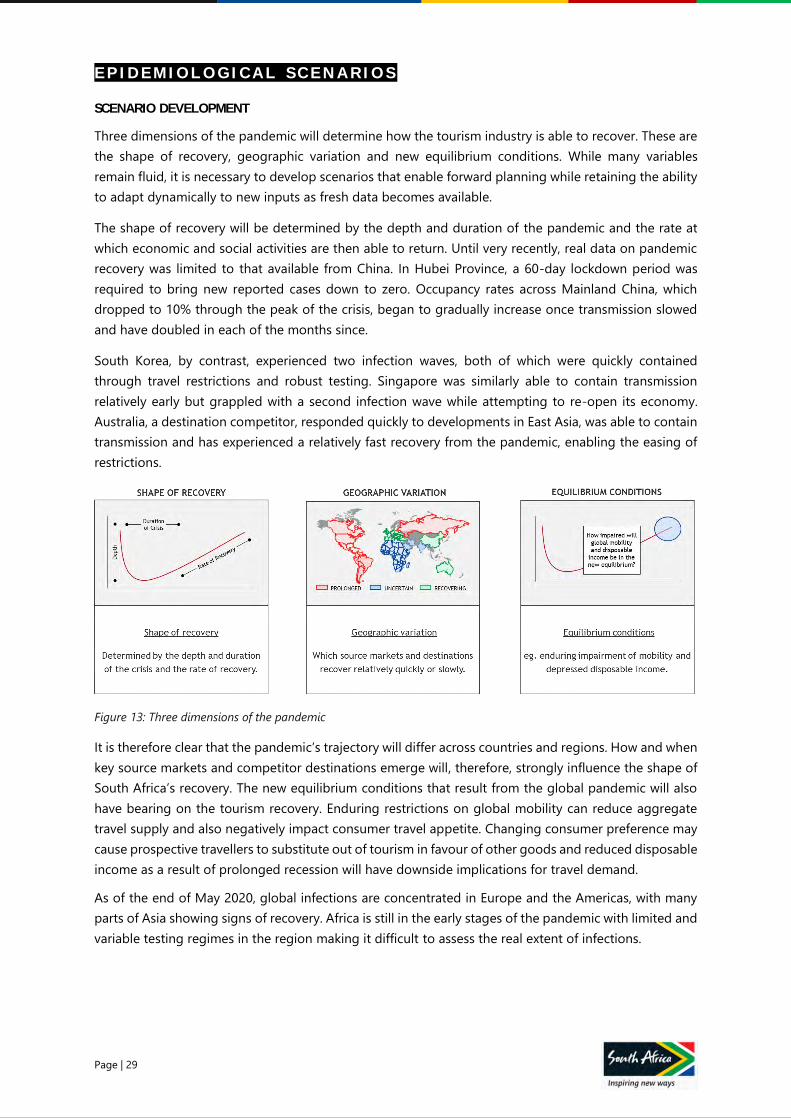
Three dimensions of the pandemic will determine how the tourism industry is able to recover. These are
the shape of recovery, geographic variation and new equilibrium conditions. While many variables
remain fluid, it is necessary to develop scenarios that enable forward planning while retaining the ability
to adapt dynamically to new inputs as fresh data becomes available.
The shape of recovery will be determined by the depth and duration of the pandemic and the rate at
which economic and social activities are then able to return. Until very recently, real data on pandemic
recovery was limited to that available from China. In Hubei Province, a 60-day lockdown period was
required to bring new reported cases down to zero. Occupancy rates across Mainland China, which
dropped to 10% through the peak of the crisis, began to gradually increase once transmission slowed
and have doubled in each of the months since.
South Korea, by contrast, experienced two infection waves, both of which were quickly contained
through travel restrictions and robust testing. Singapore was similarly able to contain transmission
relatively early but grappled with a second infection wave while attempting to re-open its economy.
Australia, a destination competitor, responded quickly to developments in East Asia, was able to contain
transmission and has experienced a relatively fast recovery from the pandemic, enabling the easing of
restrictions.
Figure 13: Three dimensions of the pandemic
It is therefore clear that the pandemic’s trajectory will differ across countries and regions. How and when
key source markets and competitor destinations emerge will, therefore, strongly influence the shape of
South Africa’s recovery. The new equilibrium conditions that result from the global pandemic will also
have bearing on the tourism recovery. Enduring restrictions on global mobility can reduce aggregate
travel supply and also negatively impact consumer travel appetite. Changing consumer preference may
cause prospective travellers to substitute out of tourism in favour of other goods and reduced disposable
income as a result of prolonged recession will have downside implications for travel demand.
As of the end of May 2020, global infections are concentrated in Europe and the Americas, with many
parts of Asia showing signs of recovery. Africa is still in the early stages of the pandemic with limited and
variable testing regimes in the region making it difficult to assess the real extent of infections.
Page | 30
Figure 14: Heatmap of pandemic situation for South Africa's source countries
Across East Asia and Australasia, China and South Korea are well into the recovery phase, while Japan
and Malaysia are approaching the tail end of their initial infection curve. Australia and New Zealand
acted fast to contain the crisis and are now in recovery, while the UAE, India and Singapore continue to
experience rising rates of infection8.
In Europe, countries are beginning to recover from the crisis with a general decline in cases per day
being observed. Sweden and the UK continue to see high rates of transmission and associated mortality.
The Americas continue to experience high rates of infection with the general epidemiological trajectory
not having made significant strides towards recovery. While the United States now appears to have
reached its peak, the early stages of recovery have proven slow and fragile. In Latin America, case growth
in Brazil, Ecuador and Peru is of particular concern and the region may become the next epicentre of the
pandemic.
Closer to home, sparsely populated neighbours, Namibia and Botswana, have experienced limited
transmission thus far and are already beginning to re-open for domestic leisure tourism. By contrast,
Zambia, Angola and Nigeria are all continuing to see accelerating infection rates. Across the region,
limited testing and unreliable reporting are likely to hamper attempts at uniform regional re-opening,
however, selective bilateral agreements may become possible as the pandemic unfolds. A summary of
the virus trajectory and phase of pandemic (recovering, near-recovery, crisis phase) for South Africa’s
key source markets is provided below.
8 Graphs indicate 10-roll ing case average per mi ll ion therefore Y -axis not shown.
Page | 31
Figure 15: Pandemic shape of source countries (end-May 2020)
Page | 32
To simulate the likely timing and sequence of source market re-opening, forecasts were developed for
South Africa and its 44 primary source markets9.
Pandemic data for individual countries was sourced from OurWorldInData10 and manipulated to obtain
the pandemic duration, maximum number of deaths per day, date of peak daily mortality and days since
peak daily mortality. Date of peak daily mortality and peak value had to be determined for each country
and if a country had not yet reached its peak, these were estimated either by extrapolation or by setting
a peak number and peak factor. A linear recovery equation was found for three benchmark countries;
South Korea (plateau), China (steep) and the United States (very steep). Based on the shape of each
country curve, the appropriate benchmark equation was applied to determine when the country could
be expected to reach zero daily deaths. Gradients and limitations were adjusted to apply more optimistic
or pessimistic assumptions and develop alternative scenarios. An example of the model output is
included in the figure below.
Lastly, using China as a benchmark, where it took 60 days to open partially and a further 30 days for full
domestic opening, the Oxford Lockdown Stringency Index (LSI) was used to approximate the number of
days it would take from the point of recording zero daily deaths to full opening per source country. It
must be noted that the risk of second-wave infections in re-opening countries currently remains the
most critical unknown variable. While a lack of data makes this ‘w-shaped’ eventuality difficult to model,
the likely extended crisis timeframes that such an outcome would entail are catered for in subsequent
scenarios discussed below.
GLOBAL SOURCE MARKET SCENARIOS AND TRAVEL POLICY
The result is a forecasted global re-opening between August 2020 and early 2021. This scenario assumes
that the general observed recovery trajectory persists and that progress towards enhanced treatments
for COVID-19 by the end of 2020 continue, with an accessible vaccine coming to market by the end of
2021. Since indications of international border re-openings remain speculative at the time of writing,
these dates represent the earliest likely date at which international travel will resume.
9 Note: At the t ime of analysis there was insuffic ient data to estimate the recovery for Nigeria, Angola,
Ethiopia, Zambia, Uganda, Malawi, Namibia, Zimbabwe, Botswana, Mozambique and Swazi land
10 A Harvard-based open data source platform
Figure 16: Example of how extrapolation was used to estimate the peak of source countries
Page | 33
Figure 17: Core forecast of when international travel will resume for source countries
From this scenario, likely booking windows and domestic and international travel windows can be
inferred and this produces two notable implications for demand generation. Firstly, South Africa’s
traditional overseas booking window will be critical to recovery. This period runs from August –
November each year, with actual travel happening an average of four months later from the time of
booking.
In 2020, the window may well correspond to the global re-opening phase and the period from when
many markets will be able to travel again. Since seasonality and the societal structure of holidays and
traditional leisure periods will not change much as a result of the pandemic, it can be expected that this
window will remain relevant in the post-COVID-19 travel market. Successfully planning and executing
marketing initiatives for the booking window should therefore be seen as a critical success factor.
Figure 18: Booking window of each Region for South Africa
Second, East Asian, Australasian and some African markets show the most attractive combination of
readiness and favourable seasonality to contribute to recovery. While the outlooks for Singapore, India
and parts of the Middle East remain uncertain, China, South Korea, Australia and New
Page | 34
Zealand will all be at the forefront of the global re-emergence. Japan and Malaysia currently appear to
be on track to join this grouping. In Africa, with Namibia and Botswana having experienced very limited
total infections thus far, the dilemma facing these neighbours is whether to open their borders to revive
their economies and risk a far worse incidence of the pandemic. Suggestions of creating ‘safe’ groupings
of countries to facilitate easier international travel in a shorter time frame are likely to gain momentum
as the viable window draws nearer.
What is clear is that traditional core source markets in Europe, the United Kingdom and North America
are likely to be some of the last to emerge from the crisis. In order to salvage the Northern Hemisphere
summer season, many European countries currently in the early phases of recovery are exploring
aggressive re-opening timeframes. Greece has announced that it will re-open for foreign tourists on 1
June and Spain has said it will do so on 1 July. While this policy may bear fruit, there is also a high risk
attached that transmission increases once again as mobility restrictions are removed.
The risk of localised or global reinfection waves continue to threaten the global economic recovery and
the strength and consistency of projected recovery profiles therefore come with low levels of certainty
attached. As countries begin the process of re-opening, there remains a strong likelihood that
trajectories out of lock down conditions will prove far more fragile than hoped and that contagion risk
in neighbouring countries or regions will force many nations to remain closed off from the world well
into 2021. For this reason, two further global scenarios bear consideration; a more fragile recovery that
contains isolated setbacks and takes longer, but still reflects an extension of the current global trajectory,
and a prolonged pandemic where the search for a vaccine proves elusive, herd immunity does not
successfully contain transmission and multiple re-infection waves result.
Figure 19: Medium and Low Road scenario for Domestic opening of source countries
Under the first of these scenarios, the timeframe for early Asian/Australasian re-opening moves from
July/August 2020 to November 2020, while core markets (the UK, Germany and the US) can only be
expected to return after April 2021. The second scenario paints an even bleaker picture, with
international outbound travel from Asia picking up between May and July 2021 and travel from core
markets only returning from Nov 2021.
Page | 35
The stronger recovery scenario in Figure 17 places greater emphasis on demand generation and short-
term measures to support supply. In both of the more pessimistic scenarios, the 2020/21 summer season
will be seriously affected, with even the following year’s peak months being under threat. This will have
grave implications for supply-side survival. Given the modelling outputs and qualitative data emerging
from the market, however, the stronger international recovery scenario remains the core outlook.
Alongside pandemic recovery, the nature of source market economic recovery will impact disposable
income and travel appetite. Current indications are that negative growth impacts are well correlated with
lockdown stringency; however, this does not yet account for the greater risk attached to aggressive re-
opening. Destinations experiencing severe currency weakness, such as South Africa, will benefit from
short-term competitiveness increases, but similar effects in source markets, such as the United Kingdom,
will serve to dampen demand. The relative cost of travel is likely to increase as safety measures add
overheads to the tourism value chain. Higher airline ticket prices seem inevitable in order to
accommodate social distancing measures and accommodation providers may also be forced to raise
prices due to intensive hygiene protocols.
Containment of the virus ultimately requires effective treatment and vaccine lead times will be a key
indicator of the duration of the stabilisation phase. This will inform visa policies and port of entry
protocols as countries without sufficient herd immunity or access to treatment will seek to limit viral
vectors. In the interim, temporary and semi-permanent restrictions on traveller mobility are inevitable
and unlikely to be standardised across markets. Measures such as immunity certification, pre- and post-
travel quarantine and mandatory visitor tracking will reassure travellers but also impede the visitor
experience.
NATIONAL SCENARIOS AND TRAVEL POLICY
Tourism recovery will depend both on the local pandemic experience and that of global source markets.
It is therefore necessary to develop a perspective on likely local opening scenarios. South Africa was
exposed to the virus only after it had begun to ravage Europe after spreading from East Asia. Based on
scientific guidance and available best practice, South Africa was able to act quickly to limit community
transmission after an initial wave of imported infections.
South Africa’s pandemic curve thus far resembles the ‘plateau’ shape of countries such as South Korea,
Australia and Singapore more than it does the ‘exponential growth’ experience of China, Italy, the United
Kingdom and the United States. The implication is therefore that, having successfully ‘flattened the curve’
in order to prevent health services from being overwhelmed, the country now faces a more prolonged,
but less acute battle against the pandemic.
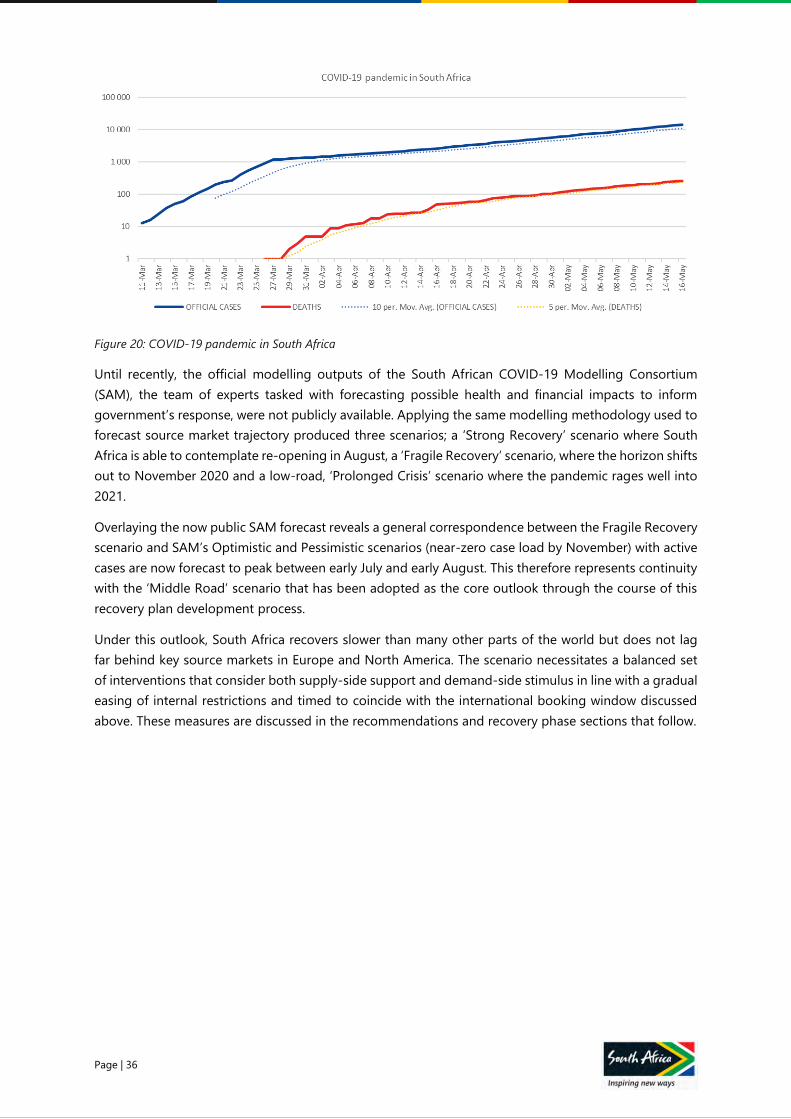
Page | 36
Figure 20: COVID-19 pandemic in South Africa
Until recently, the official modelling outputs of the South African COVID-19 Modelling Consortium
(SAM), the team of experts tasked with forecasting possible health and financial impacts to inform
government’s response, were not publicly available. Applying the same modelling methodology used to
forecast source market trajectory produced three scenarios; a ‘Strong Recovery’ scenario where South
Africa is able to contemplate re-opening in August, a ‘Fragile Recovery’ scenario, where the horizon shifts
out to November 2020 and a low-road, ‘Prolonged Crisis’ scenario where the pandemic rages well into
2021.
Overlaying the now public SAM forecast reveals a general correspondence between the Fragile Recovery
scenario and SAM’s Optimistic and Pessimistic scenarios (near-zero case load by November) with active
cases are now forecast to peak between early July and early August. This therefore represents continuity
with the ‘Middle Road’ scenario that has been adopted as the core outlook through the course of this
recovery plan development process.
Under this outlook, South Africa recovers slower than many other parts of the world but does not lag
far behind key source markets in Europe and North America. The scenario necessitates a balanced set
of interventions that consider both supply-side support and demand-side stimulus in line with a gradual
easing of internal restrictions and timed to coincide with the international booking window discussed
above. These measures are discussed in the recommendations and recovery phase sections that follow.
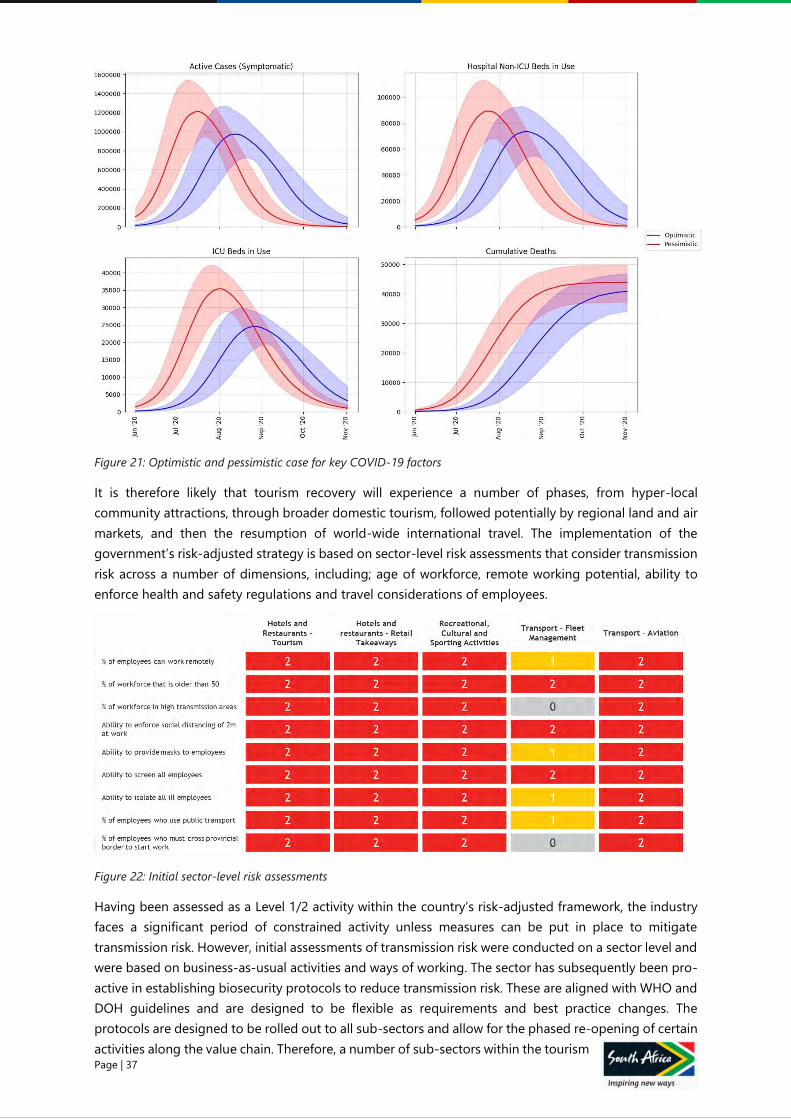
Page | 37
Figure 21: Optimistic and pessimistic case for key COVID-19 factors
It is therefore likely that tourism recovery will experience a number of phases, from hyper-local
community attractions, through broader domestic tourism, followed potentially by regional land and air
markets, and then the resumption of world-wide international travel. The implementation of the
government’s risk-adjusted strategy is based on sector-level risk assessments that consider transmission
risk across a number of dimensions, including; age of workforce, remote working potential, ability to
enforce health and safety regulations and travel considerations of employees.
Figure 22: Initial sector-level risk assessments
Having been assessed as a Level 1/2 activity within the country’s risk-adjusted framework, the industry
faces a significant period of constrained activity unless measures can be put in place to mitigate
transmission risk. However, initial assessments of transmission risk were conducted on a sector level and
were based on business-as-usual activities and ways of working. The sector has subsequently been pro-
active in establishing biosecurity protocols to reduce transmission risk. These are aligned with WHO and
DOH guidelines and are designed to be flexible as requirements and best practice changes. The
protocols are designed to be rolled out to all sub-sectors and allow for the phased re-opening of certain
activities along the value chain. Therefore, a number of sub-sectors within the tourism
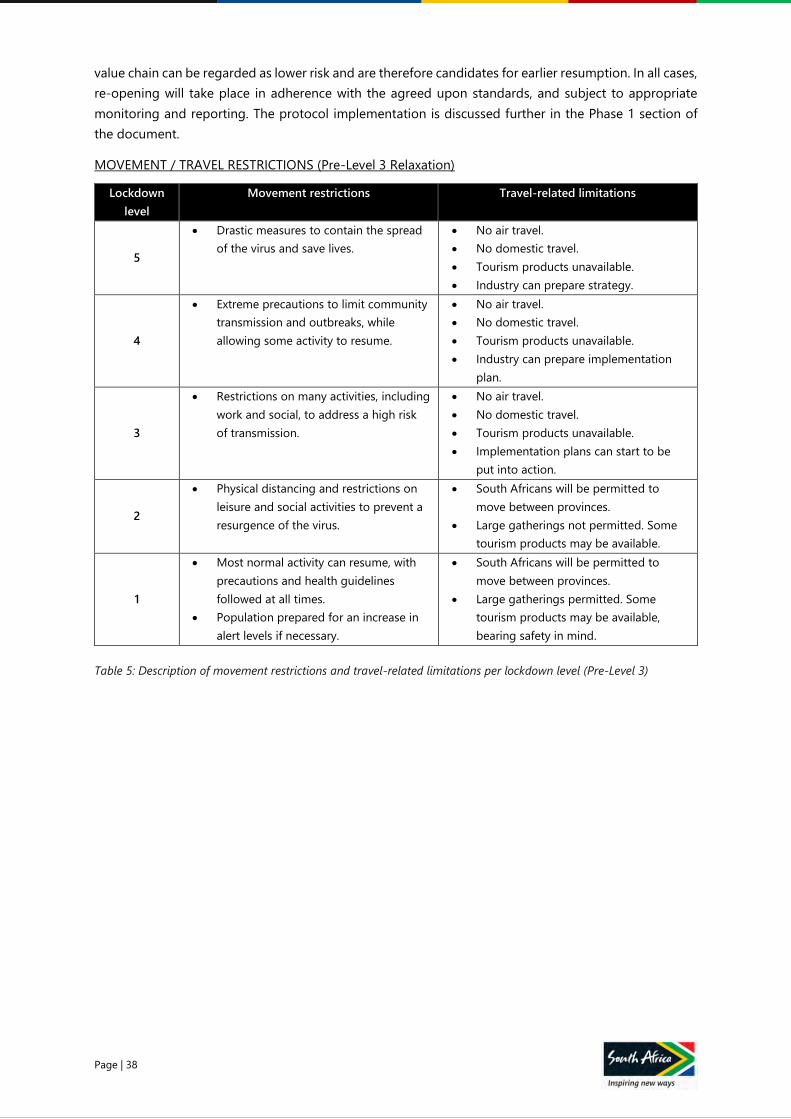
Page | 38
value chain can be regarded as lower risk and are therefore candidates for earlier resumption. In all cases,
re-opening will take place in adherence with the agreed upon standards, and subject to appropriate
monitoring and reporting. The protocol implementation is discussed further in the Phase 1 section of
the document.
MOVEMENT / TRAVEL RESTRICTIONS (Pre-Level 3 Relaxation)
Lockdown
level
Movement restrictions Travel-related limitations
5
• Drastic measures to contain the spread
of the virus and save lives.
• No air travel.
• No domestic travel.
• Tourism products unavailable.
• Industry can prepare strategy.
4
• Extreme precautions to limit community
transmission and outbreaks, while
allowing some activity to resume.
• No air travel.
• No domestic travel.
• Tourism products unavailable.
• Industry can prepare implementation
plan.
3
• Restrictions on many activities, including
work and social, to address a high risk
of transmission.
• No air travel.
• No domestic travel.
• Tourism products unavailable.
• Implementation plans can start to be
put into action.
2
• Physical distancing and restrictions on
leisure and social activities to prevent a
resurgence of the virus.
• South Africans will be permitted to
move between provinces.
• Large gatherings not permitted. Some
tourism products may be available.
1
• Most normal activity can resume, with
precautions and health guidelines
followed at all times.
• Population prepared for an increase in
alert levels if necessary.
• South Africans will be permitted to
move between provinces.
• Large gatherings permitted. Some
tourism products may be available,
bearing safety in mind.
Table 5: Description of movement restrictions and travel-related limitations per lockdown level (Pre-Level 3)
Page | 39
INTERVENTIONS BY
INTERNATIONAL
ORGANISATIONS
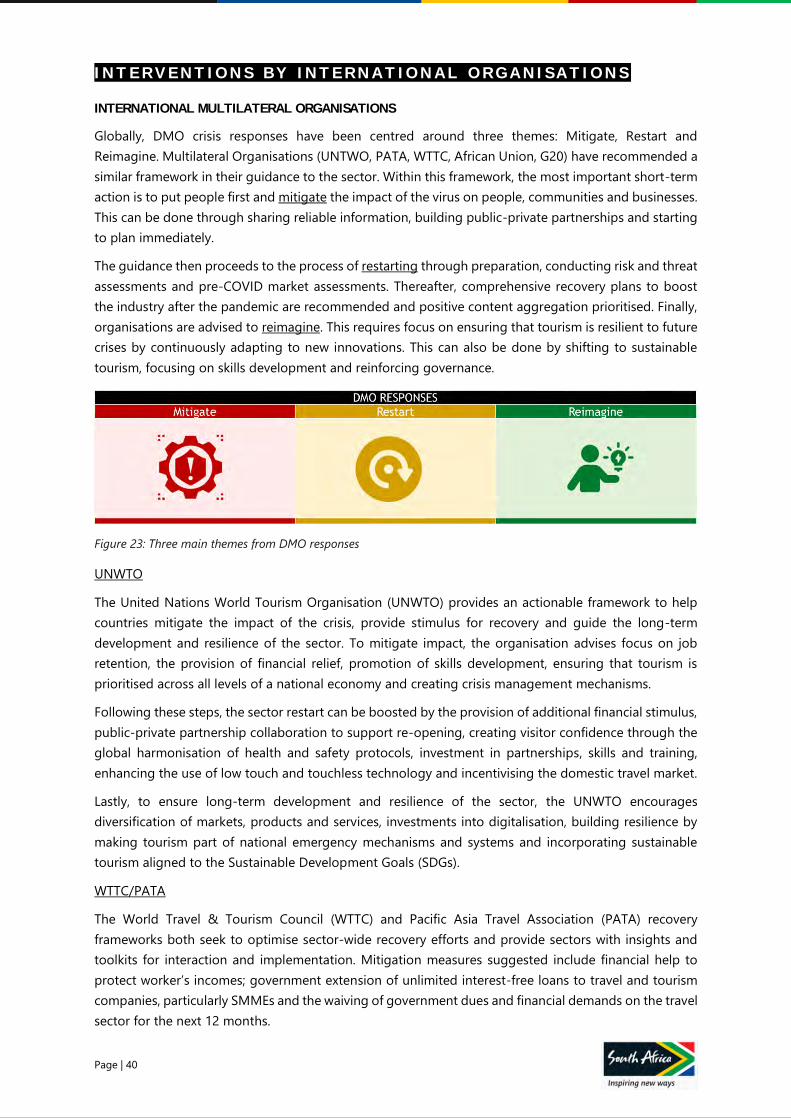
Page | 40
I N T E R V E N T I O N S B Y I N T E R N A T I O N A L O R G A N I S A T I O N S
INTERNATIONAL MULTILATERAL ORGANISATIONS
Globally, DMO crisis responses have been centred around three themes: Mitigate, Restart and
Reimagine. Multilateral Organisations (UNTWO, PATA, WTTC, African Union, G20) have recommended a
similar framework in their guidance to the sector. Within this framework, the most important short-term
action is to put people first and mitigate the impact of the virus on people, communities and businesses.
This can be done through sharing reliable information, building public-private partnerships and starting
to plan immediately.
The guidance then proceeds to the process of restarting through preparation, conducting risk and threat
assessments and pre-COVID market assessments. Thereafter, comprehensive recovery plans to boost
the industry after the pandemic are recommended and positive content aggregation prioritised. Finally,
organisations are advised to reimagine. This requires focus on ensuring that tourism is resilient to future
crises by continuously adapting to new innovations. This can also be done by shifting to sustainable
tourism, focusing on skills development and reinforcing governance.
Figure 23: Three main themes from DMO responses
UNWTO
The United Nations World Tourism Organisation (UNWTO) provides an actionable framework to help
countries mitigate the impact of the crisis, provide stimulus for recovery and guide the long-term
development and resilience of the sector. To mitigate impact, the organisation advises focus on job
retention, the provision of financial relief, promotion of skills development, ensuring that tourism is
prioritised across all levels of a national economy and creating crisis management mechanisms.
Following these steps, the sector restart can be boosted by the provision of additional financial stimulus,
public-private partnership collaboration to support re-opening, creating visitor confidence through the
global harmonisation of health and safety protocols, investment in partnerships, skills and training,
enhancing the use of low touch and touchless technology and incentivising the domestic travel market.
Lastly, to ensure long-term development and resilience of the sector, the UNWTO encourages
diversification of markets, products and services, investments into digitalisation, building resilience by
making tourism part of national emergency mechanisms and systems and incorporating sustainable
tourism aligned to the Sustainable Development Goals (SDGs).
WTTC/PATA
The World Travel & Tourism Council (WTTC) and Pacific Asia Travel Association (PATA) recovery
frameworks both seek to optimise sector-wide recovery efforts and provide sectors with insights and
toolkits for interaction and implementation. Mitigation measures suggested include financial help to
protect worker’s incomes; government extension of unlimited interest-free loans to travel and tourism
companies, particularly SMMEs and the waiving of government dues and financial demands on the travel
sector for the next 12 months.
Page | 41
Emphasis is also placed on the building of a seamless traveller journey that integrates and supports
health and security initiatives both before and after a vaccine is available. As a second phase, WTTC plans
to work to develop a vision for the Future of Travel and Tourism, considering issues such as sustainability,
the future of work, technologies and health and security.
Initiatives to restart the sector focus on mapping the signposts to recovery by means of a dashboard
highlighting qualitative and quantitative travel and tourism macro and health data on a global and
regional level. WTTC is developing global standards for new operational health protocols, ensuring
governments take into account and integrate the needs of the private sector within these policies. Lastly,
re-imagining and preparing for the future is facilitated by sharing experiences, success stories and best
practices between governments and advocating on behalf of the sector to ensure enabling and
supportive policies are implemented.
African Union
The African Union’s current initiatives mainly focus on the mitigation and restart phases.
Mitigation focuses on uniting African countries around a common continental response and mobilising
attention and resources to cushion COVID-19 impacts on the tourism industry. This includes the
establishment of a COVID-19 Fund and working with multilateral financial institutions and partners,
including the African Development Bank and the World Bank to raise capital. South Africa has pledged
$6 million to this cause, $4 million for the COVID-19 Fund and $2 million for the Centre for Disease
Control and Prevention. In the short to medium term, the African Union emphasises the need for
cushioning of the African tourism industry by the provision of direct financial assistance, loans, loan
guarantees and support for the micro, small and medium enterprises, tax relief, reduction, waiver or
deferral of government-imposed taxes and fees.
Sector restart is supported via the setting up of a high-level task force, incorporating representation
from governments, the AU, academia and other tourism stakeholders, to develop and implement a
comprehensive Post-COVID-19 Continental Tourism Recovery Strategy. Sector restart includes a focus
on efforts to promote and develop regional tourism on the continent and calls on all Member States
who have not yet done so to join the Single African Air Transport Market. The African Union has also
called on Regional Economic Communities, the African Civil Aviation Commission, the African
Development Bank, UNWTO, WTTC, international development partners, to provide technical expertise,
resources and support for the implementation of the above actions.
G20
The G20 emphasises collaboration and co-ordination with the sector to ensure that tourism can become
more inclusive, robust and resilient.
The G20 commits to working together to provide sector support in mitigating the social and economic
impacts of the pandemic. It welcomes measures to maintain businesses and support households most
impacted by the crisis, safeguarding employment, and ensuring support for developing and low-income
countries. The grouping is committed to continued coordination with health, immigration, security, and
other relevant authorities to minimise undue restrictions for essential travel during the crisis, and
supports the coordination of appropriate removal of travel restrictions proportionate to the prevailing
national and international pandemic conditions. The G20 recognises the importance of ensuring the
safety and well-being of workers in travel and tourism, and commits to working together to support an
inclusive and sustainable recovery in the sector.
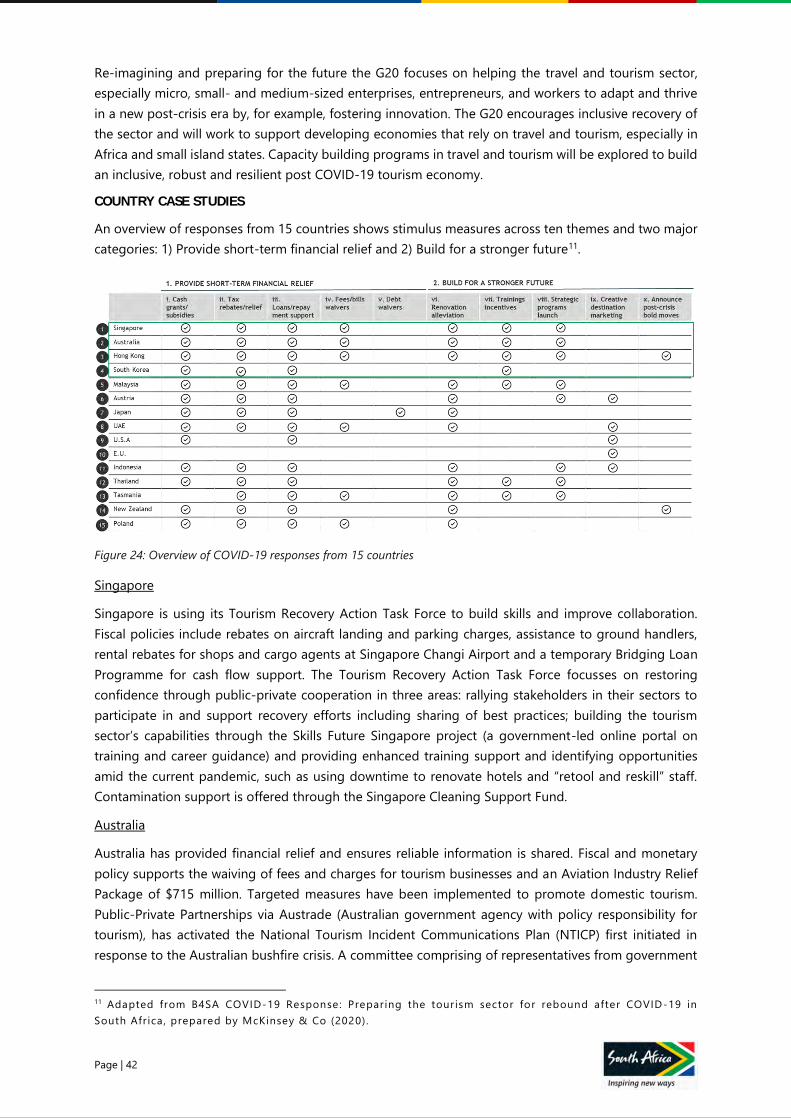
Page | 42
Re-imagining and preparing for the future the G20 focuses on helping the travel and tourism sector,
especially micro, small- and medium-sized enterprises, entrepreneurs, and workers to adapt and thrive
in a new post-crisis era by, for example, fostering innovation. The G20 encourages inclusive recovery of
the sector and will work to support developing economies that rely on travel and tourism, especially in
Africa and small island states. Capacity building programs in travel and tourism will be explored to build
an inclusive, robust and resilient post COVID-19 tourism economy.
COUNTRY CASE STUDIES
An overview of responses from 15 countries shows stimulus measures across ten themes and two major
categories: 1) Provide short-term financial relief and 2) Build for a stronger future11.
Figure 24: Overview of COVID-19 responses from 15 countries
Singapore
Singapore is using its Tourism Recovery Action Task Force to build skills and improve collaboration.
Fiscal policies include rebates on aircraft landing and parking charges, assistance to ground handlers,
rental rebates for shops and cargo agents at Singapore Changi Airport and a temporary Bridging Loan
Programme for cash flow support. The Tourism Recovery Action Task Force focusses on restoring
confidence through public-private cooperation in three areas: rallying stakeholders in their sectors to
participate in and support recovery efforts including sharing of best practices; building the tourism
sector’s capabilities through the Skills Future Singapore project (a government-led online portal on
training and career guidance) and providing enhanced training support and identifying opportunities
amid the current pandemic, such as using downtime to renovate hotels and “retool and reskill” staff.
Contamination support is offered through the Singapore Cleaning Support Fund.
Australia
Australia has provided financial relief and ensures reliable information is shared. Fiscal and monetary
policy supports the waiving of fees and charges for tourism businesses and an Aviation Industry Relief
Package of $715 million. Targeted measures have been implemented to promote domestic tourism.
Public-Private Partnerships via Austrade (Australian government agency with policy responsibility for
tourism), has activated the National Tourism Incident Communications Plan (NTICP) first initiated in
response to the Australian bushfire crisis. A committee comprising of representatives from government
11 Adapted from B4SA COVID-19 Response: Preparing the tourism sector for rebound after COVID-19 in
South Afr ica, prepared by McKinsey & Co (2020).
Page | 43
and key tourism industry bodies is the main conduit to distribute consistent, reliable information on the
developing crisis. The committee holds regular meetings and receives direct advice from the Department
of Health. The travel and tourism industry is further supported by the Australian governments’ $76
million Rebuilding Australia’s Tourism Package.
Hong Kong
Hong Kong has developed a three-phase plan and identified short-term markets. The current phase 1
period focuses on a Resilience–Recovery plan for the tourism industry, phase 2 focuses on recovery;
promoting domestic tourism and geographic spread and phase 3, the relaunch phase, will see the
launching of a new tourism brand campaign. Their research has shown that wellness-themed, short-haul
trips will be favoured and young-middle-aged segments in Mainland China, Japan, Korea and Taiwan
are likely to be the country’s first tourists. In total HK$400 million (~£41,8 million) in funds were allocated
to support promotions by trade. However, renewed social unrest and political protests are likely to
negatively impact tourism recovery.
South Korea
South Korea has developed an extensive response plan to ensure travel and tourism survives and thrives
after the crisis. Fiscal policies include a range of tax and regulatory measures, supporting rental fees for
micro-business owners and an emergency relief fund for all affected SMEs including tourism SMEs with
a total of KRW 250 billion ($23,5 million). Market intelligence is gathered through the Tourism Business
Support Centre to monitor the challenges and difficulties of tourism establishments during the COVID-
19 pandemic and a consultation channel set up with Public-Private Partnerships to focus on jobs and
skills. The government has designated the travel and tourism sector as a "special employment support
sector” and aims to support job retention in the industry. The state has conducted a bi-weekly Public-
Private Tourism Stakeholder Virtual Meeting to evaluate and mitigate the crisis. A total of KRW 300
billion ($243 million) has been mobilised from the National Tourism Fund.
RECOVERY BENCHMARKS
The current global shutdown has no precedent, but the recent experience of emerging economies such
as Turkey, Thailand and Egypt suggest that tourism can rebound strongly after periods of crisis. This
mirrors the experience of Asian economies, such as South Korea, which had to rebuild their tourism
reputation following the SARS and MERS pandemics of the past two decades.
Turkey
Terrorism, regional war and domestic unrest deterred Turkey’s tourists in 2016 and arrivals dropped by
25% from 2015-2016. Recovery measures included a shift in focus to high growth territories eg China,
implementation of clear and deliberate messaging that the country was safe to visit and an extended
product offering to encompass historical, cultural, culinary and health tourism themes supported by
improved infrastructure eg airlines. The impact was positive. Visitor numbers rebounded strongly in 2017
and by 2018 had passed their pre-crisis levels. Turkey has now averaged 21% growth in the past three
years.
Thailand
In 2004 the Tsunami hit six southern provinces of Thailand. Visitor numbers fell by 40% in 2005 and
tourism infrastructure damage was in the region of $1 billion. Recovery measures included shifting focus
to tourist destinations within Thailand that had not been affected by the Tsunami; and a focus on new
markets (China, Japan, Australia) as well as the introduction of new products and initiation of high-profile
events to attract world media attention. By 2006, tourist arrivals had increased by 20% and was higher
than pre-Tsunami values.
Page | 44
Egypt
The Arab Spring Uprising and toppling of President Mubarak in 2011 impacted tourist arrivals negatively
and the country saw a decline of 30% in 2011. Additionally, by 2014, revenue from tourism sites had
dropped by 95%. Recovery measures consisted of a shift in focus to domestic tourism, the targeting of
new tourism segments and the development of a five pillar Strategy for Tourism including infrastructure
and tourism development. By 2019, tourist arrivals exceeded pre-Arab Spring Uprising values having
shown a 36% growth for the 2018-2019 period.
South Korea
In 2015, South Korea experienced the largest MERS outbreak outside of the Middle East. Tourist arrivals
dropped by more than 50% in six months and revenue growth went to a record low of ~-49% in July
2015. A Post-MERS 100-day Tourism Recovery Plan was implemented which involved inviting foreign
industry players through sponsored programs, waiving visa fees, offering special tour packages and
capitalising on traditional holiday periods in neighbouring countries such as China. A year later, tourist
arrivals exceeded pre-MERS levels, showing a 50% YoY revenue growth.
CONCLUSION
Global tourism has proved resilient against pandemic events of the past two decades, though the scale
of the disruption in 2020 is far more severe. Innate resilience cannot be taken for granted; however,
these cases emphasise the role of strategy in charting the respective recoveries. While each set of
conditions is unique, a number of features are common to successful recoveries:
Market diversification is key: When core source markets become constrained, focus must shift to growth
territories. Successful recoveries often achieve structural change because they force investment into new
regions while traditional markets return organically over time.
ROI-driven investment: Similarly, the temptation to revert to pre-crisis investment allocations must be
resisted. To maximise impact, resources should rather be corralled into a series of multi-year investment
‘bets’ made against clear assessments of opportunity cost and supported by carefully phased marketing
communications and travel trade engagement programmes.
Barrier Messaging: Since currency depreciation often accompanies a crisis period, recovering
destinations have successfully combined price and value for money propositions with high-intensity,
always-on communication campaigns focussed on subtle safety and security barrier messaging.
Differentiation extends past marketing: New source markets bring new visitor preferences and product
development opportunities. In Turkey, traditional perceptions of ‘sun, sand and sea’ were extended to
encompass historical, cultural, culinary and health tourism themes. This has seen the growth of new
products and enabled new entrants into the sector.
There is no silver bullet: While it is tempting to look for a single high-impact intervention (eg ramping
marketing spend, dramatic price cuts or dropping visa restrictions), such actions alone do not get the
job done. A comprehensive strategy that takes account of all available levers and drives across-the-
board reform is required. The successful features of the crisis response should be preserved for the
recovery. Similarly, transformation initiatives that have long been planned should be accelerated.
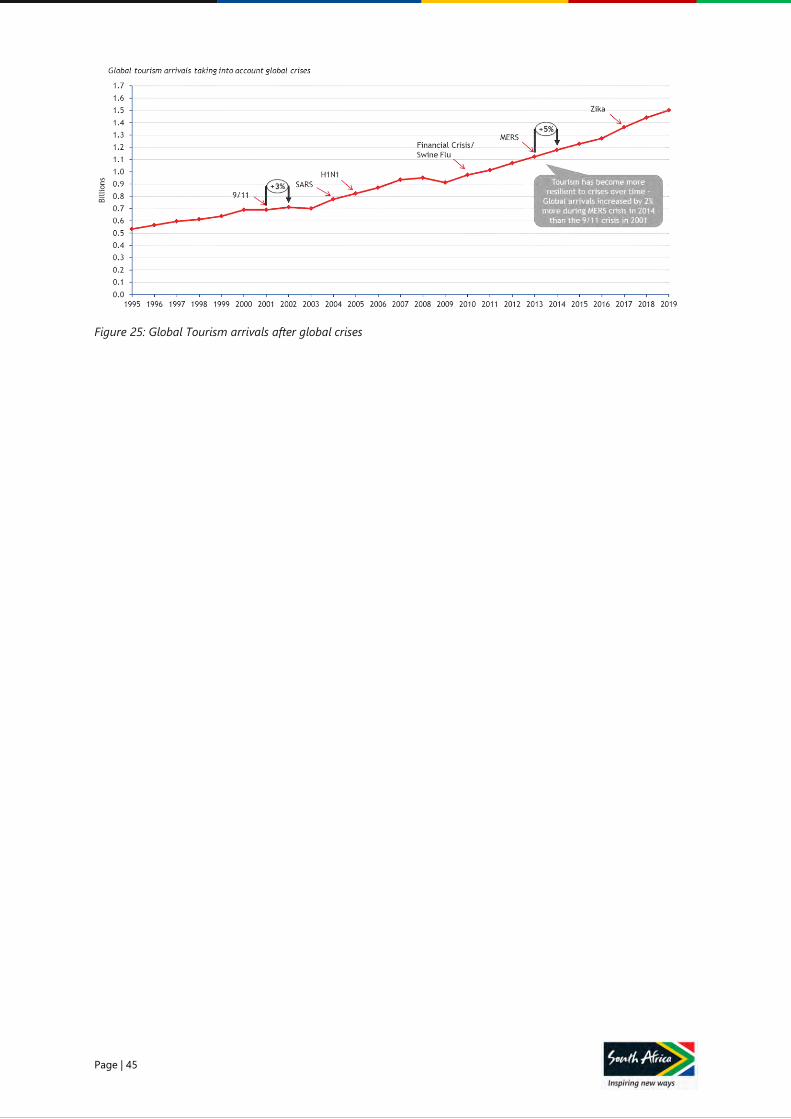
Page | 45
Figure 25: Global Tourism arrivals after global crises
Page | 46
RECOMMENDATIONS
AND RECOVERY PHASES
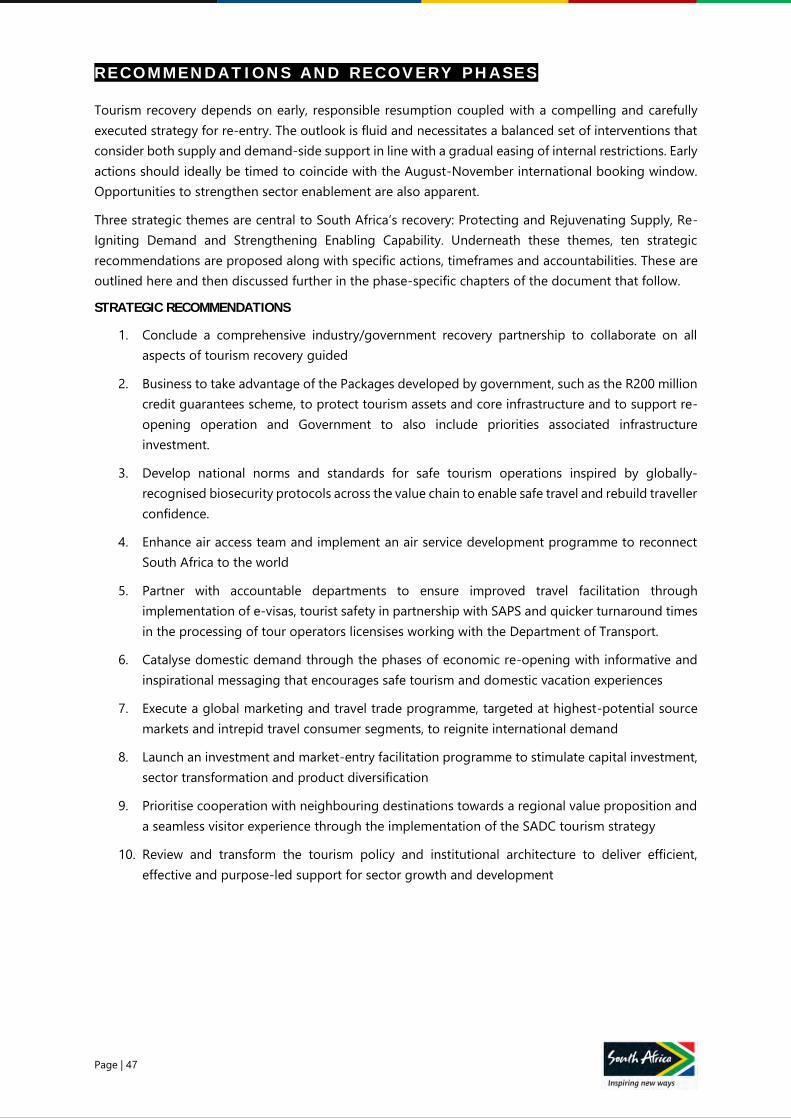
Page | 47
R E C O M M E N D A T I O N S A N D R E C O V E R Y P H A S E S
Tourism recovery depends on early, responsible resumption coupled with a compelling and carefully
executed strategy for re-entry. The outlook is fluid and necessitates a balanced set of interventions that
consider both supply and demand-side support in line with a gradual easing of internal restrictions. Early
actions should ideally be timed to coincide with the August-November international booking window.
Opportunities to strengthen sector enablement are also apparent.
Three strategic themes are central to South Africa’s recovery: Protecting and Rejuvenating Supply, Re-
Igniting Demand and Strengthening Enabling Capability. Underneath these themes, ten strategic
recommendations are proposed along with specific actions, timeframes and accountabilities. These are
outlined here and then discussed further in the phase-specific chapters of the document that follow.
STRATEGIC RECOMMENDATIONS
1. Conclude a comprehensive industry/government recovery partnership to collaborate on all
aspects of tourism recovery guided
2. Business to take advantage of the Packages developed by government, such as the R200 million
credit guarantees scheme, to protect tourism assets and core infrastructure and to support re-
opening operation and Government to also include priorities associated infrastructure
investment.
3. Develop national norms and standards for safe tourism operations inspired by globally-
recognised biosecurity protocols across the value chain to enable safe travel and rebuild traveller
confidence.
4. Enhance air access team and implement an air service development programme to reconnect
South Africa to the world
5. Partner with accountable departments to ensure improved travel facilitation through
implementation of e-visas, tourist safety in partnership with SAPS and quicker turnaround times
in the processing of tour operators licensises working with the Department of Transport.
6. Catalyse domestic demand through the phases of economic re-opening with informative and
inspirational messaging that encourages safe tourism and domestic vacation experiences
7. Execute a global marketing and travel trade programme, targeted at highest-potential source
markets and intrepid travel consumer segments, to reignite international demand
8. Launch an investment and market-entry facilitation programme to stimulate capital investment,
sector transformation and product diversification
9. Prioritise cooperation with neighbouring destinations towards a regional value proposition and
a seamless visitor experience through the implementation of the SADC tourism strategy
10. Review and transform the tourism policy and institutional architecture to deliver efficient,
effective and purpose-led support for sector growth and development
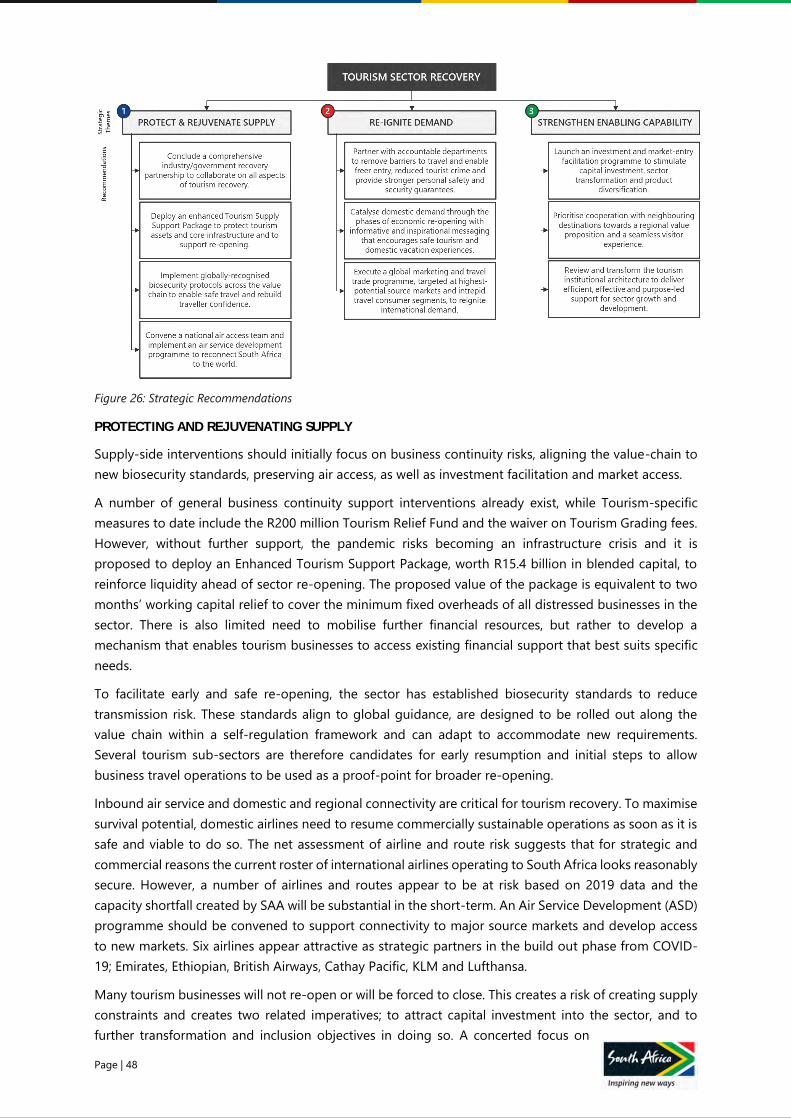
Page | 48
Figure 26: Strategic Recommendations
PROTECTING AND REJUVENATING SUPPLY
Supply-side interventions should initially focus on business continuity risks, aligning the value-chain to
new biosecurity standards, preserving air access, as well as investment facilitation and market access.
A number of general business continuity support interventions already exist, while Tourism-specific
measures to date include the R200 million Tourism Relief Fund and the waiver on Tourism Grading fees.
However, without further support, the pandemic risks becoming an infrastructure crisis and it is
proposed to deploy an Enhanced Tourism Support Package, worth R15.4 billion in blended capital, to
reinforce liquidity ahead of sector re-opening. The proposed value of the package is equivalent to two
months’ working capital relief to cover the minimum fixed overheads of all distressed businesses in the
sector. There is also limited need to mobilise further financial resources, but rather to develop a
mechanism that enables tourism businesses to access existing financial support that best suits specific
needs.
To facilitate early and safe re-opening, the sector has established biosecurity standards to reduce
transmission risk. These standards align to global guidance, are designed to be rolled out along the
value chain within a self-regulation framework and can adapt to accommodate new requirements.
Several tourism sub-sectors are therefore candidates for early resumption and initial steps to allow
business travel operations to be used as a proof-point for broader re-opening.
Inbound air service and domestic and regional connectivity are critical for tourism recovery. To maximise
survival potential, domestic airlines need to resume commercially sustainable operations as soon as it is
safe and viable to do so. The net assessment of airline and route risk suggests that for strategic and
commercial reasons the current roster of international airlines operating to South Africa looks reasonably
secure. However, a number of airlines and routes appear to be at risk based on 2019 data and the
capacity shortfall created by SAA will be substantial in the short-term. An Air Service Development (ASD)
programme should be convened to support connectivity to major source markets and develop access
to new markets. Six airlines appear attractive as strategic partners in the build out phase from COVID-
19; Emirates, Ethiopian, British Airways, Cathay Pacific, KLM and Lufthansa.
Many tourism businesses will not re-open or will be forced to close. This creates a risk of creating supply
constraints and creates two related imperatives; to attract capital investment into the sector, and to
further transformation and inclusion objectives in doing so. A concerted focus on
Page | 49
supply rejuvenation is therefore required, formalised under a collaborative investment promotion and
market-entry facilitation programme. This approach can be highly supportive of transformation
objectives if it is underpinned by a focus on enhancing SMME visibility, mobilising multi-stakeholder
collaboration, developing community assets and transforming spatial and ownership patterns.
REIGNITING DEMAND
Reigniting demand requires a robust domestic marketing strategy, the agility to respond decisively
through an uncertain global re-opening phase and responsiveness to changes in consumer preference
that require a focus on intrepid, experiential traveller segments.
Leisure travel appetite post-crisis will be weighted towards the VFR and FIT segments, where authentic,
lower-density itineraries will be popular. Higher net-worth, experiential travel consumers, the ‘Intrepid
Traveller’, represent the highest potential segment and one that is common to most priority markets.
Consumers will place greater focus on their health and wellbeing, value for money, will avoid crowded
places and will plan thoroughly when making travel decisions. The trend towards independent, digital
distribution and booking will accelerate. Corporate domestic travel can be expected to revive relatively
early, however conventions and exhibitions, which rely on trust and certainty will be amongst the last to
recover.
Domestic tourism will initially be oriented towards hyper-local and local experiences, specifically day
trips and weekend retreats as well as business travel to critical customers, sites and suppliers. Visitor
attractions and experiences will play a crucial role in this early phase, helping to build confidence.
Thereafter, substitution leisure tourism, where South Africans who would previously have travelled
abroad choose instead to travel domestically, will represent an opportunity to capture new demand.
Successfully executing across these first two phases will create the opportunity to structurally change
the domestic market as experience-based local travel becomes entrenched and aspirational across a
broad base of society.
In a market of scarce resources and uncertain timing, identifying the highest-potential inbound target
segments is foundational to the recovery strategy. However, the pandemic is forcing a rethink of
segmentation and more than ever, traveller psychology will be driven by universal factors. This presents
an opportunity for South Africa to shift to a psychographic-based segmentation to drive differentiation
since many competitors will revert to pre-crisis segmentation. ‘Intrepid Travellers’ are among the highest
spending global travellers for whom travel is a significant part of their lives. They are also the segment
that is most resilient to perceived issues around security. Recovery marketing should position the tourism
brand around the travel values of these segments and align them with the country’s exceptional cultural,
adventure and natural experiences.
The return of global tourism will see varying rates of recovery in source markets and marketing
investment must be carefully conserved to achieve maximum impact through the recovery cycle. This
can be best achieved by refining focus to nine Tier 1 overseas markets (Germany, the UK, France, China,
India, Netherlands, Australia, the USA and Canada) and high-potential regional markets (Tanzania,
Kenya, Nigeria and the DRC). A selection of Tier 2 secondary markets,12 can also deliver incremental
growth though are a lower priority.
This targeting strategy, overlaid with re-opening timeframes in each market and a focus on multi-year
investment budgeting, discretionary travel and priority consumer segments can optimise resources and
fundamentally increase return on investment for destination marketing activities. In conjunction, high-
intensity barrier messaging can leverage South Africa’s responsible management of the crisis, the health-
12 Suggested: Uganda, Ghana, Angola, Ethiopia, Botswana, Namibia, Sweden, Italy, Brazil
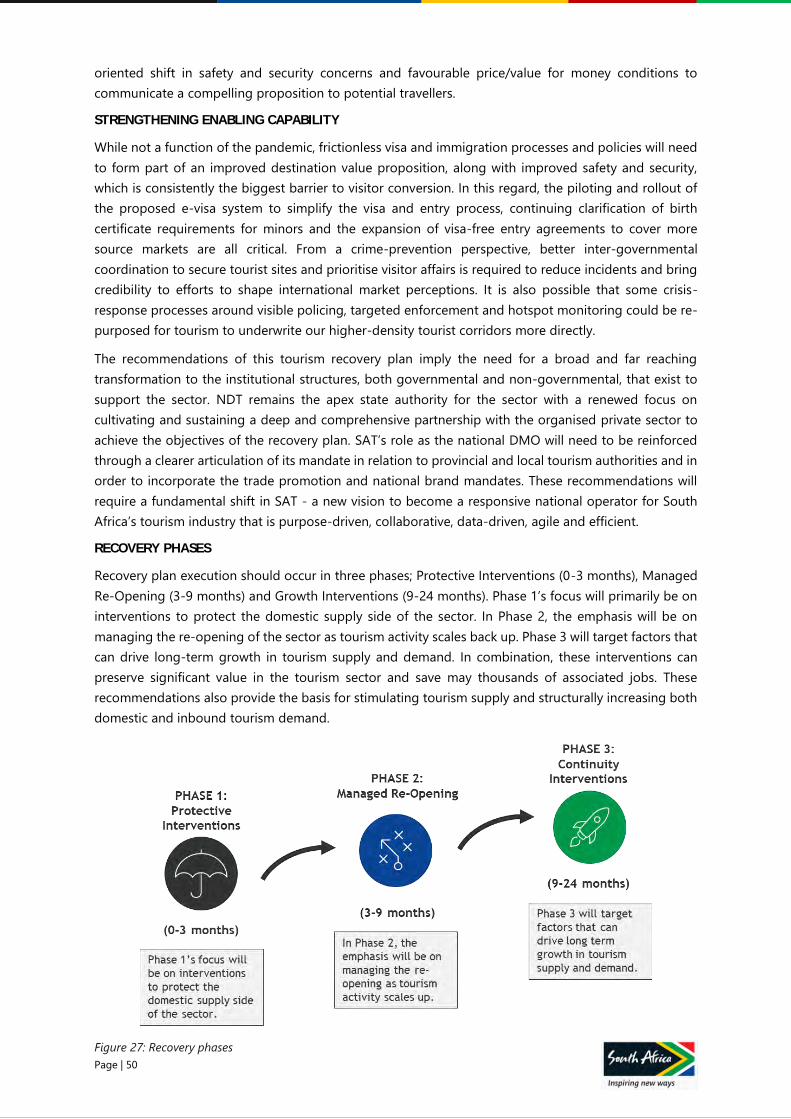
Page | 50
oriented shift in safety and security concerns and favourable price/value for money conditions to
communicate a compelling proposition to potential travellers.
STRENGTHENING ENABLING CAPABILITY
While not a function of the pandemic, frictionless visa and immigration processes and policies will need
to form part of an improved destination value proposition, along with improved safety and security,
which is consistently the biggest barrier to visitor conversion. In this regard, the piloting and rollout of
the proposed e-visa system to simplify the visa and entry process, continuing clarification of birth
certificate requirements for minors and the expansion of visa-free entry agreements to cover more
source markets are all critical. From a crime-prevention perspective, better inter-governmental
coordination to secure tourist sites and prioritise visitor affairs is required to reduce incidents and bring
credibility to efforts to shape international market perceptions. It is also possible that some crisis-
response processes around visible policing, targeted enforcement and hotspot monitoring could be re-
purposed for tourism to underwrite our higher-density tourist corridors more directly.
The recommendations of this tourism recovery plan imply the need for a broad and far reaching
transformation to the institutional structures, both governmental and non-governmental, that exist to
support the sector. NDT remains the apex state authority for the sector with a renewed focus on
cultivating and sustaining a deep and comprehensive partnership with the organised private sector to
achieve the objectives of the recovery plan. SAT’s role as the national DMO will need to be reinforced
through a clearer articulation of its mandate in relation to provincial and local tourism authorities and in
order to incorporate the trade promotion and national brand mandates. These recommendations will
require a fundamental shift in SAT - a new vision to become a responsive national operator for South
Africa’s tourism industry that is purpose-driven, collaborative, data-driven, agile and efficient.
RECOVERY PHASES
Recovery plan execution should occur in three phases; Protective Interventions (0-3 months), Managed
Re-Opening (3-9 months) and Growth Interventions (9-24 months). Phase 1’s focus will primarily be on
interventions to protect the domestic supply side of the sector. In Phase 2, the emphasis will be on
managing the re-opening of the sector as tourism activity scales back up. Phase 3 will target factors that
can drive long-term growth in tourism supply and demand. In combination, these interventions can
preserve significant value in the tourism sector and save may thousands of associated jobs. These
recommendations also provide the basis for stimulating tourism supply and structurally increasing both
domestic and inbound tourism demand.
Figure 27: Recovery phases
Page | 51
PHASE 1: PROTECTING
SUPPLY (0-3 Months)
Page | 52
P H A S E 1 : P R O T E C T I N G S U P P L Y ( 0 - 3 M o n t h s )
The initial phase of tourism recovery runs for three months from May through to July 2020. The emphasis
during this period is on taking the critical actions needed to preserve tourism supply and to prepare the
sector for a gradual and careful re-opening. On the 25th of May, following consultations with President
Ramaphosa, Tourism Minister Kubayi-Ngubane publicly highlighted the risk of massive job losses in the
sector if meaningful re-opening could not be achieved by September (Department of Tourism, 2020).
While the pandemic trajectory may ultimately prevent this opening timeframe, the focus of Phase 1 is to
responsibly implement all possible measures within the sector to allow the earliest possible re-opening
window, while taking measures to support distressed businesses.
Four strategic recommendations therefore demand immediate implementation during this phase; the
conclusion of an overarching industry/government recovery partnership, the deployment of an
enhanced Tourism Supply Support Package, the implementation of globally recognised biosecurity
protocols and the creation of a dedicated national air access team.
In addition, planning should begin in parallel for Phase 2 and 3 priorities so as to ensure that the
necessary lead times for optimal execution are met. Planning measures include; refinement to the visa
regime, strengthened partnerships with law enforcement, the design of a domestic marketing campaign
to catalyse domestic travel and the design of a global marketing programme to target the Q3 booking
window. Further longer-term priorities such as the deployment of an investment and market-entry
facilitation programme, regional cooperation and transformation of the tourism institutional architecture
should also be progressed as far as possible. Planning interventions are discussed in detail in the Phase
2 and 3 sections that follow.
PROPOSED INTERVENTIONS
1 Conclude a comprehensive industry/government recovery partnership to collaborate
on all aspects of tourism recovery
A feature of leading DMOs is their ability to develop meaningful partnerships with the private sector,
thereby enabling more effective competition in the global marketplace. Such partnerships are typically
based on cooperative marketing, communications and travel trade programs where DMOs collaborate
on the design with the private sector and match funding. This ensures brand alignment and an ability to
effectively target consumer and trade audiences with common messages, improving the destination’s
ability to connect with prospective consumers and drive bookings and visitation. Such partnerships also
facilitate coherent product and experience development and innovation and data and research sharing.
Destination Canada, Visit Britain, Tourism Ireland and Tourism Australia have successfully developed and
launched cooperative partnerships with their respective private sector partners for over a decade. As an
example, Destination Canada now leverages all marketing, communications and travel trade
engagement budgets to a minimum 1:1 ratio with private sector partners, drawn from the travel and
tourism industry as well other sectors. In South Africa, it would be important to evaluate material
conditions on the ground before such is Implemented on a case by case basis given the extent of
development of the sector across the different provinces.
While many established mechanisms exist for cooperation between government and the private tourism
sector, the pandemic has necessitated an intensified level of engagement. This experience has reinforced
the mutual interdependence and alignment of interests amongst a diverse range of industry
stakeholders. To capitalise, an industry/government recovery partnership should be formalised to
collectively realise a refreshed vision for the sector,led by the Department of Tourism and working with
its marketing group entity South African Tourism and Industry rerentatives (mainly representational by
the TBCSA). A success factor in such a partnership will be inclusivity. The scope of the
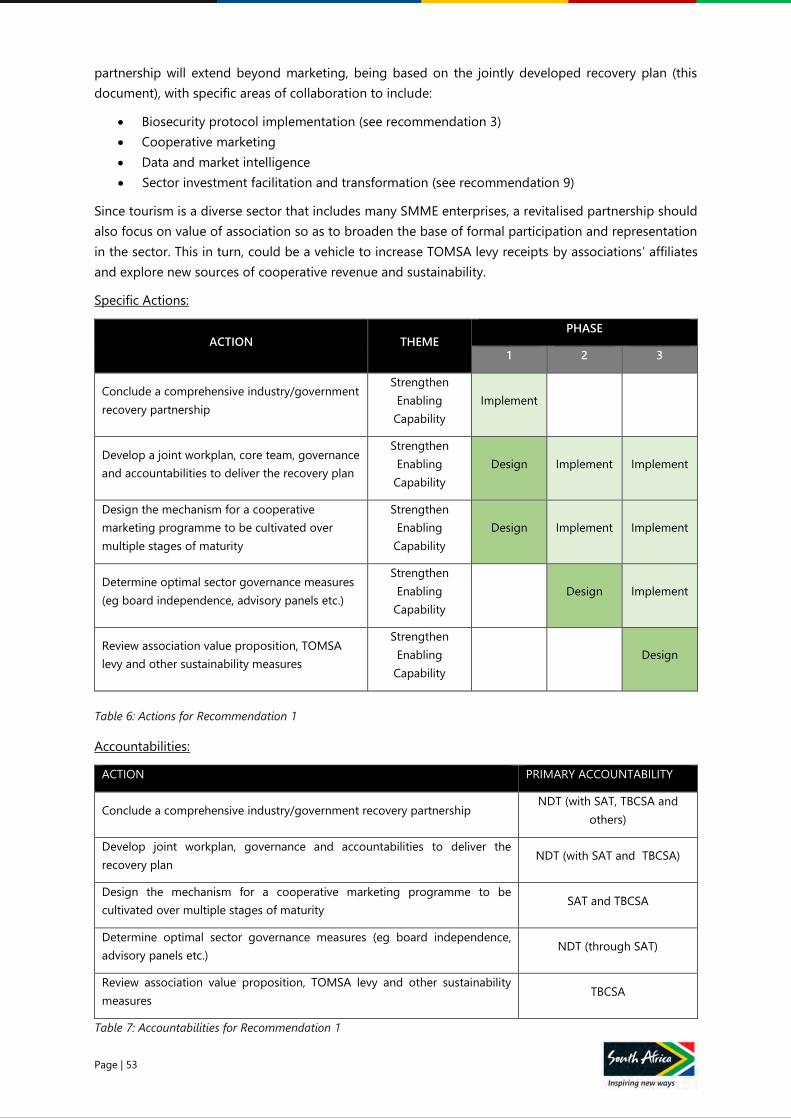
Page | 53
partnership will extend beyond marketing, being based on the jointly developed recovery plan (this
document), with specific areas of collaboration to include:
• Biosecurity protocol implementation (see recommendation 3)
• Cooperative marketing
• Data and market intelligence
• Sector investment facilitation and transformation (see recommendation 9)
Since tourism is a diverse sector that includes many SMME enterprises, a revitalised partnership should
also focus on value of association so as to broaden the base of formal participation and representation
in the sector. This in turn, could be a vehicle to increase TOMSA levy receipts by associations’ affiliates
and explore new sources of cooperative revenue and sustainability.
Specific Actions:
ACTION THEME PHASE
1 2 3
Conclude a comprehensive industry/government
recovery partnership
Strengthen
Enabling
Capability
Implement
Develop a joint workplan, core team, governance
and accountabilities to deliver the recovery plan
Strengthen
Enabling
Capability
Design Implement Implement
Design the mechanism for a cooperative
marketing programme to be cultivated over
multiple stages of maturity
Strengthen
Enabling
Capability
Design Implement Implement
Determine optimal sector governance measures
(eg board independence, advisory panels etc.)
Strengthen
Enabling
Capability
Design Implement
Review association value proposition, TOMSA
levy and other sustainability measures
Strengthen
Enabling
Capability
Design
Table 6: Actions for Recommendation 1
Accountabilities:
ACTION PRIMARY ACCOUNTABILITY
Conclude a comprehensive industry/government recovery partnership NDT (with SAT, TBCSA and
others)
Develop joint workplan, governance and accountabilities to deliver the
recovery plan NDT (with SAT and TBCSA)
Design the mechanism for a cooperative marketing programme to be
cultivated over multiple stages of maturity SAT and TBCSA
Determine optimal sector governance measures (eg board independence,
advisory panels etc.) NDT (through SAT)
Review association value proposition, TOMSA levy and other sustainability
measures TBCSA
Table 7: Accountabilities for Recommendation 1
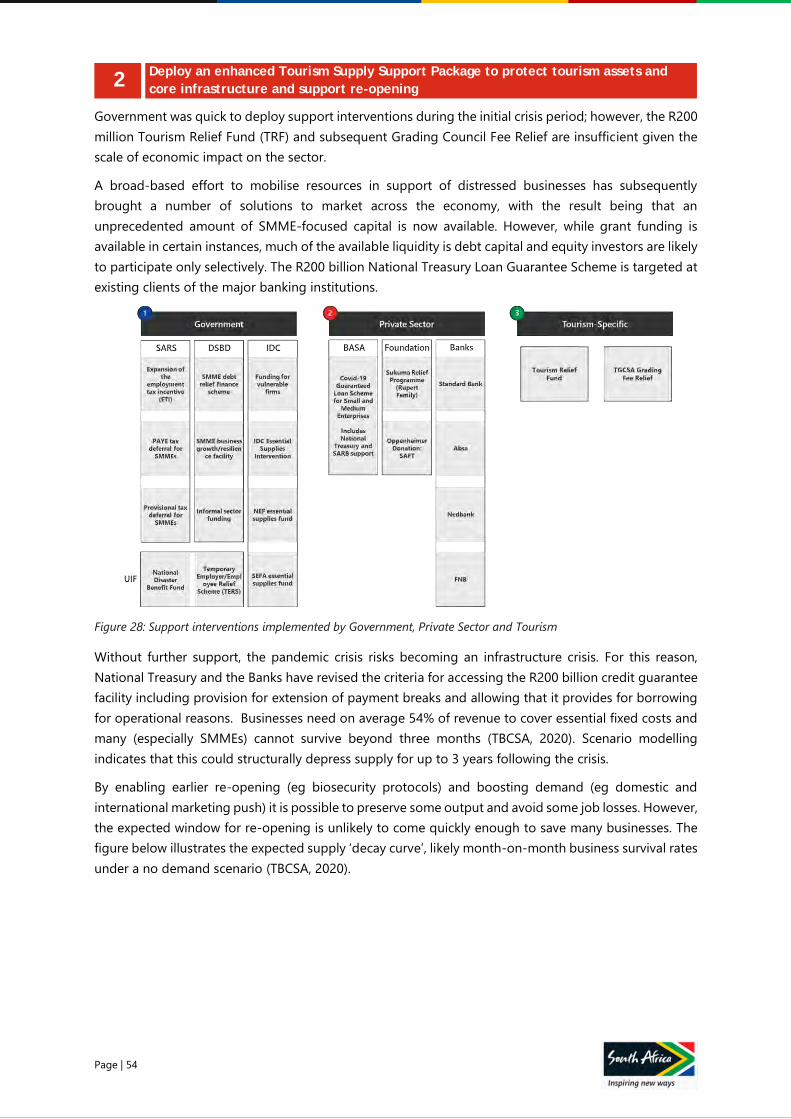
Page | 54
2 Deploy an enhanced Tourism Supply Support Package to protect tourism assets and
core infrastructure and support re-opening
Government was quick to deploy support interventions during the initial crisis period; however, the R200
million Tourism Relief Fund (TRF) and subsequent Grading Council Fee Relief are insufficient given the
scale of economic impact on the sector.
A broad-based effort to mobilise resources in support of distressed businesses has subsequently
brought a number of solutions to market across the economy, with the result being that an
unprecedented amount of SMME-focused capital is now available. However, while grant funding is
available in certain instances, much of the available liquidity is debt capital and equity investors are likely
to participate only selectively. The R200 billion National Treasury Loan Guarantee Scheme is targeted at
existing clients of the major banking institutions.
Figure 28: Support interventions implemented by Government, Private Sector and Tourism
Without further support, the pandemic crisis risks becoming an infrastructure crisis. For this reason,
National Treasury and the Banks have revised the criteria for accessing the R200 billion credit guarantee
facility including provision for extension of payment breaks and allowing that it provides for borrowing
for operational reasons. Businesses need on average 54% of revenue to cover essential fixed costs and
many (especially SMMEs) cannot survive beyond three months (TBCSA, 2020). Scenario modelling
indicates that this could structurally depress supply for up to 3 years following the crisis.
By enabling earlier re-opening (eg biosecurity protocols) and boosting demand (eg domestic and
international marketing push) it is possible to preserve some output and avoid some job losses. However,
the expected window for re-opening is unlikely to come quickly enough to save many businesses. The
figure below illustrates the expected supply ‘decay curve’, likely month-on-month business survival rates
under a no demand scenario (TBCSA, 2020).
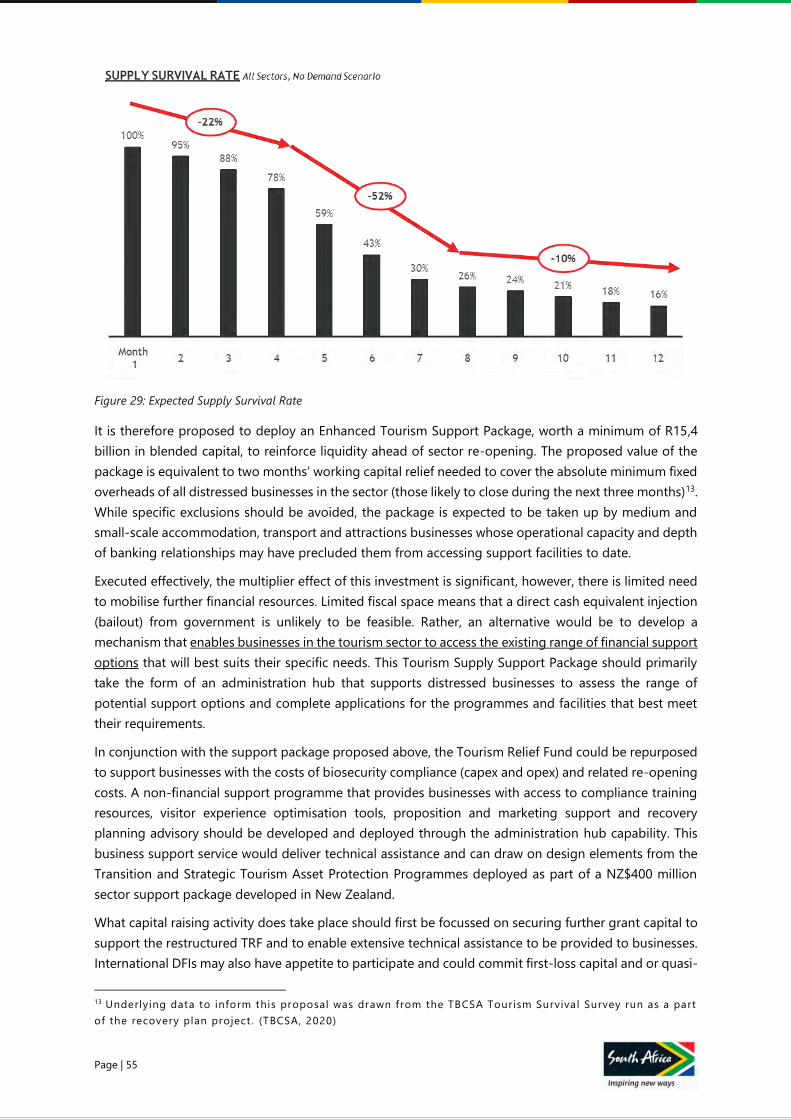
Page | 55
Figure 29: Expected Supply Survival Rate
It is therefore proposed to deploy an Enhanced Tourism Support Package, worth a minimum of R15,4
billion in blended capital, to reinforce liquidity ahead of sector re-opening. The proposed value of the
package is equivalent to two months’ working capital relief needed to cover the absolute minimum fixed
overheads of all distressed businesses in the sector (those likely to close during the next three months)13.
While specific exclusions should be avoided, the package is expected to be taken up by medium and
small-scale accommodation, transport and attractions businesses whose operational capacity and depth
of banking relationships may have precluded them from accessing support facilities to date.
Executed effectively, the multiplier effect of this investment is significant, however, there is limited need
to mobilise further financial resources. Limited fiscal space means that a direct cash equivalent injection
(bailout) from government is unlikely to be feasible. Rather, an alternative would be to develop a
mechanism that enables businesses in the tourism sector to access the existing range of financial support
options that will best suits their specific needs. This Tourism Supply Support Package should primarily
take the form of an administration hub that supports distressed businesses to assess the range of
potential support options and complete applications for the programmes and facilities that best meet
their requirements.
In conjunction with the support package proposed above, the Tourism Relief Fund could be repurposed
to support businesses with the costs of biosecurity compliance (capex and opex) and related re-opening
costs. A non-financial support programme that provides businesses with access to compliance training
resources, visitor experience optimisation tools, proposition and marketing support and recovery
planning advisory should be developed and deployed through the administration hub capability. This
business support service would deliver technical assistance and can draw on design elements from the
Transition and Strategic Tourism Asset Protection Programmes deployed as part of a NZ$400 million
sector support package developed in New Zealand.
What capital raising activity does take place should first be focussed on securing further grant capital to
support the restructured TRF and to enable extensive technical assistance to be provided to businesses.
International DFIs may also have appetite to participate and could commit first-loss capital and or quasi-
13 Underlying data to inform this proposal was drawn from the TBCSA Tourism Survival Survey run as a part
of the recovery plan project . (TBCSA, 2020)
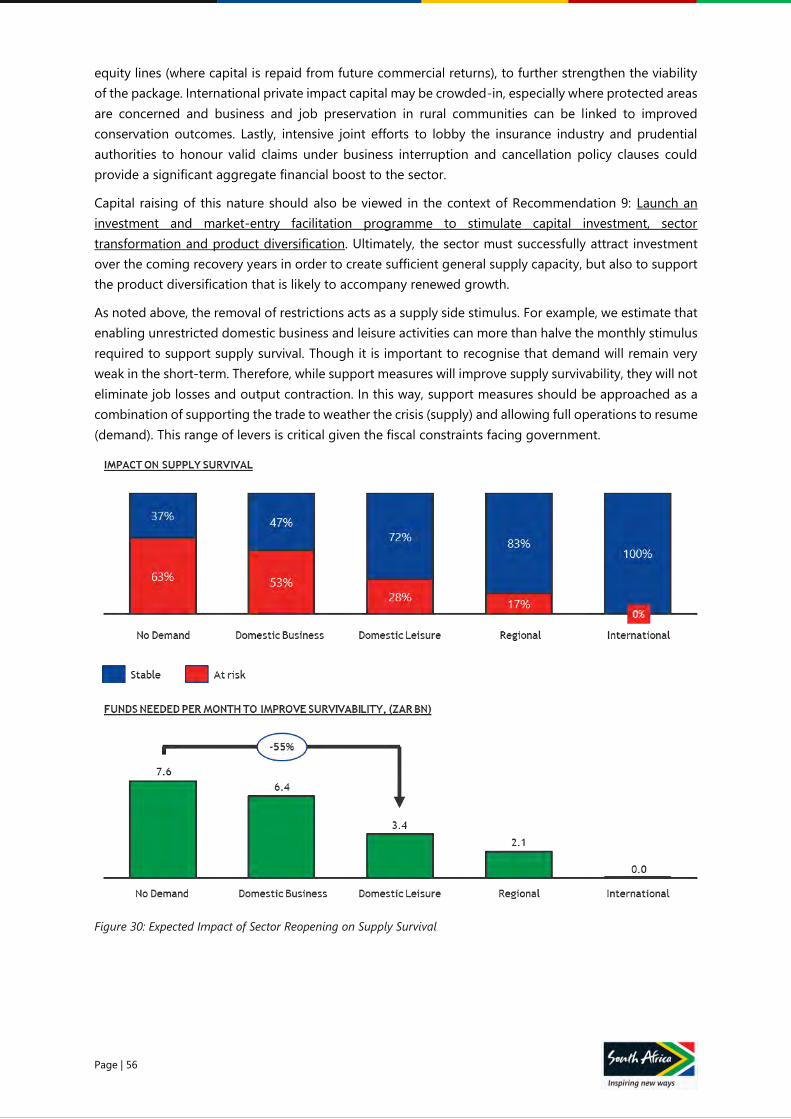
Page | 56
equity lines (where capital is repaid from future commercial returns), to further strengthen the viability
of the package. International private impact capital may be crowded-in, especially where protected areas
are concerned and business and job preservation in rural communities can be linked to improved
conservation outcomes. Lastly, intensive joint efforts to lobby the insurance industry and prudential
authorities to honour valid claims under business interruption and cancellation policy clauses could
provide a significant aggregate financial boost to the sector.
Capital raising of this nature should also be viewed in the context of Recommendation 9: Launch an
investment and market-entry facilitation programme to stimulate capital investment, sector
transformation and product diversification. Ultimately, the sector must successfully attract investment
over the coming recovery years in order to create sufficient general supply capacity, but also to support
the product diversification that is likely to accompany renewed growth.
As noted above, the removal of restrictions acts as a supply side stimulus. For example, we estimate that
enabling unrestricted domestic business and leisure activities can more than halve the monthly stimulus
required to support supply survival. Though it is important to recognise that demand will remain very
weak in the short-term. Therefore, while support measures will improve supply survivability, they will not
eliminate job losses and output contraction. In this way, support measures should be approached as a
combination of supporting the trade to weather the crisis (supply) and allowing full operations to resume
(demand). This range of levers is critical given the fiscal constraints facing government.
Figure 30: Expected Impact of Sector Reopening on Supply Survival
Page | 57
Specific Actions:
ACTION THEME PHASE
1 2 3
Announce an extended Tourism Supply
Support Package
Protect and
Rejuvenate Supply
Design &
Implement
Mobilise an administration hub to facilitate
support services to distressed businesses
Protect and
Rejuvenate Supply
Design &
Implement Implement Implement
Restructure the Tourism Relief Fund to
support the costs of biosecurity compliance
and re-opening
Protect and
Rejuvenate Supply
Design &
Implement Implement Implement
Develop a non-financial programme to
provide access to training, marketing and
recovery support
Protect and
Rejuvenate Supply Design Implement Implement
Identify incremental capital requirements and
execute a targeted capital raising
programme
Protect and
Rejuvenate Supply Design Implement Implement
Table 8: Actions for Recommendation 2
Accountabilities:
ACTION PRIMARY ACCOUNTABILITY
Mobilise an administration hub to facilitate support services to distressed
businesses
NDT (with TBCSA and SAT)
Develop a non-financial programme to provide access to training, marketing and
recovery support
NDT (with SAT)
Identify incremental capital requirements and execute a targeted capital raising
programme
TBCSA (with NDT)
Table 9: Accountabilities for Recommendation 2
3 Implement globally recognised biosecurity protocols across the value chain to enable
safe travel and rebuild traveller confidence.
Central to the ability to travel again is the need for operational protocols that minimise transmission risk
across the tourism value chain. TBCSA has led the development of a comprehensive set of protocols
under which the sector can begin to operate and self-regulate. These cover customer measures, staff
measures, operational measures and facilities measures and their implementation is designed to enable
the re-rating of certain parts of the sector and the opportunity for partial re-opening in the short-term.
The protocols will evolve as the pandemic’s trajectory develops and as new data emerges over optimal
prevention practices. It will also be critical to continuously benchmark local protocols against global
standards to ensure that expectations in key source markets are met and exceeded. In addition,
communication is required that educates travellers and balances the inspiration to travel with the
inevitable likelihood that, despite best efforts, new infections will be recorded.
To support implementation of the protocols across the industry, compliance training, visitor experience
optimisation tools and procurement support will be required. Technology-led
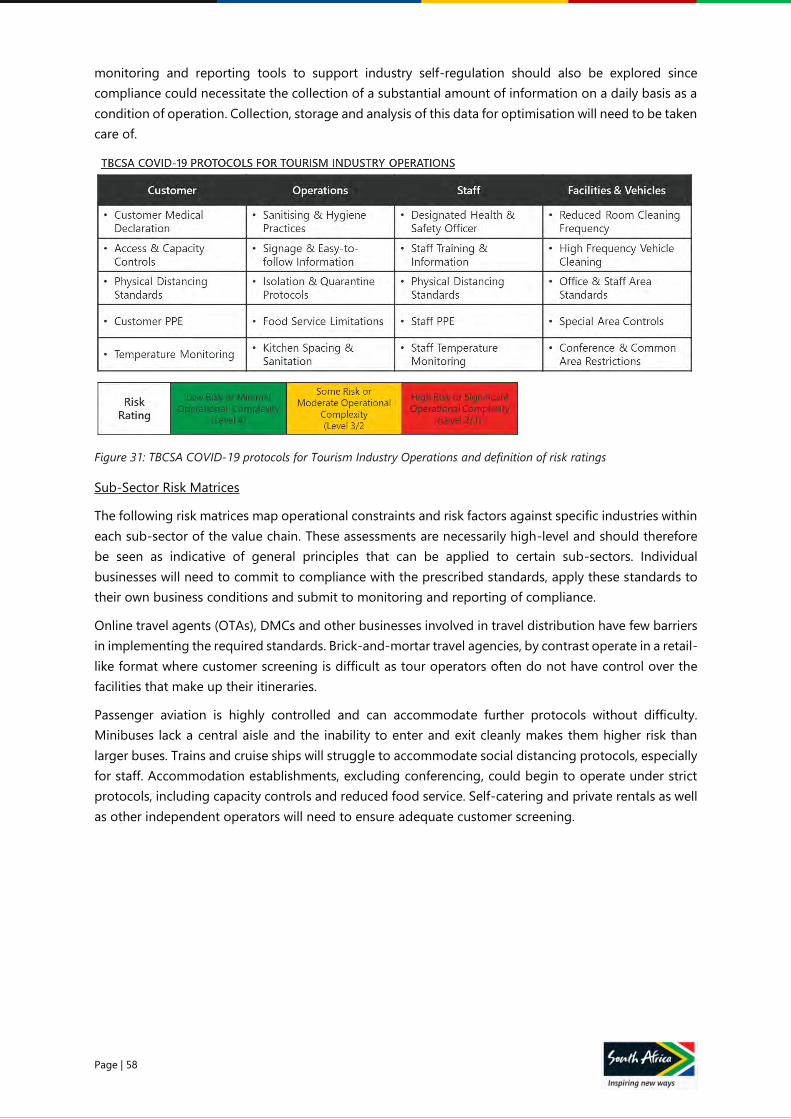
Page | 58
monitoring and reporting tools to support industry self-regulation should also be explored since
compliance could necessitate the collection of a substantial amount of information on a daily basis as a
condition of operation. Collection, storage and analysis of this data for optimisation will need to be taken
care of.
Figure 31: TBCSA COVID-19 protocols for Tourism Industry Operations and definition of risk ratings
Sub-Sector Risk Matrices
The following risk matrices map operational constraints and risk factors against specific industries within
each sub-sector of the value chain. These assessments are necessarily high-level and should therefore
be seen as indicative of general principles that can be applied to certain sub-sectors. Individual
businesses will need to commit to compliance with the prescribed standards, apply these standards to
their own business conditions and submit to monitoring and reporting of compliance.
Online travel agents (OTAs), DMCs and other businesses involved in travel distribution have few barriers
in implementing the required standards. Brick-and-mortar travel agencies, by contrast operate in a retail-
like format where customer screening is difficult as tour operators often do not have control over the
facilities that make up their itineraries.
Passenger aviation is highly controlled and can accommodate further protocols without difficulty.
Minibuses lack a central aisle and the inability to enter and exit cleanly makes them higher risk than
larger buses. Trains and cruise ships will struggle to accommodate social distancing protocols, especially
for staff. Accommodation establishments, excluding conferencing, could begin to operate under strict
protocols, including capacity controls and reduced food service. Self-catering and private rentals as well
as other independent operators will need to ensure adequate customer screening.

Page | 59
Figure 32: Risk assessment per sub-sector, along TBCSA protocols
Attractions vary in risk levels and for many, following all protocols can allow for safe operation. Dine-in
restaurants must adopt simplified electronic/board menus, reduce staffing/suppliers and implement
frequent deep cleaning. Conferencing, festivals and events will only open under strict capacity
restrictions and according to WHO guidelines.
Therefore, a number of sub-sectors within the tourism value chain can be regarded as lower risk and are
candidates for earlier resumption. In all cases, re-opening will take place in adherence with the agreed
upon standards, and subject to appropriate monitoring and reporting.
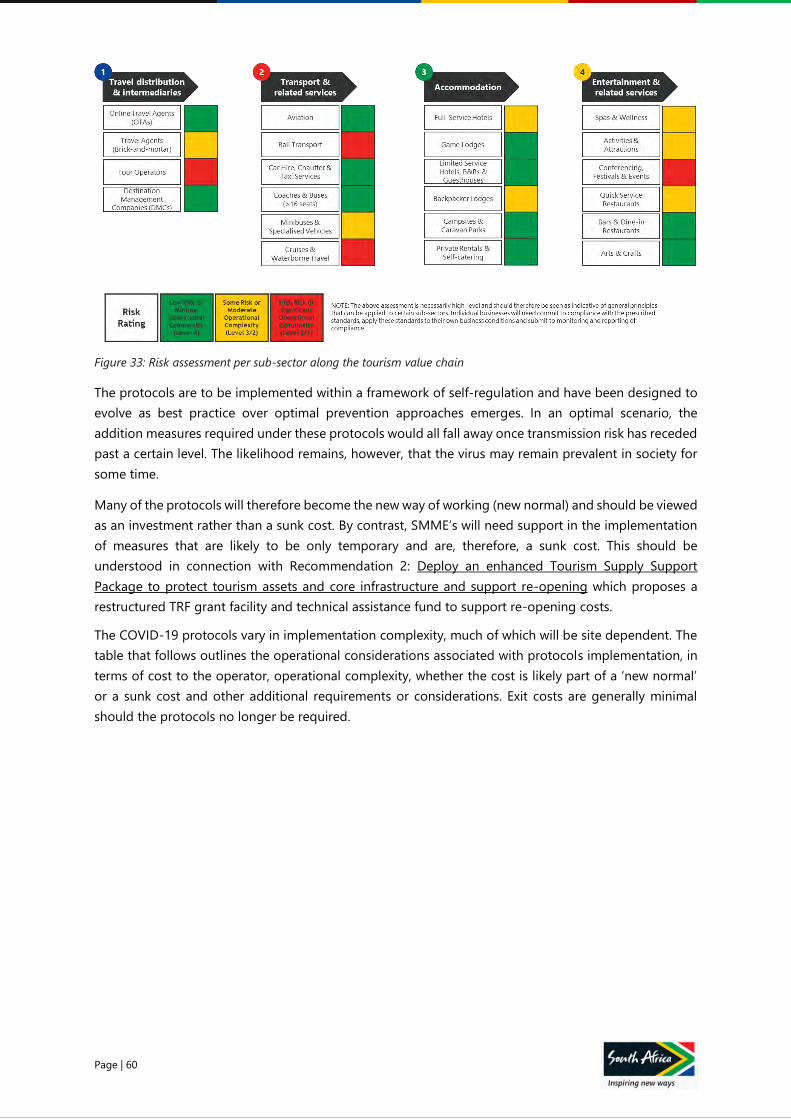
Page | 60
Figure 33: Risk assessment per sub-sector along the tourism value chain
The protocols are to be implemented within a framework of self-regulation and have been designed to
evolve as best practice over optimal prevention approaches emerges. In an optimal scenario, the
addition measures required under these protocols would all fall away once transmission risk has receded
past a certain level. The likelihood remains, however, that the virus may remain prevalent in society for
some time.
Many of the protocols will therefore become the new way of working (new normal) and should be viewed
as an investment rather than a sunk cost. By contrast, SMME’s will need support in the implementation
of measures that are likely to be only temporary and are, therefore, a sunk cost. This should be
understood in connection with Recommendation 2: Deploy an enhanced Tourism Supply Support
Package to protect tourism assets and core infrastructure and support re-opening which proposes a
restructured TRF grant facility and technical assistance fund to support re-opening costs.
The COVID-19 protocols vary in implementation complexity, much of which will be site dependent. The
table that follows outlines the operational considerations associated with protocols implementation, in
terms of cost to the operator, operational complexity, whether the cost is likely part of a ‘new normal’
or a sunk cost and other additional requirements or considerations. Exit costs are generally minimal
should the protocols no longer be required.
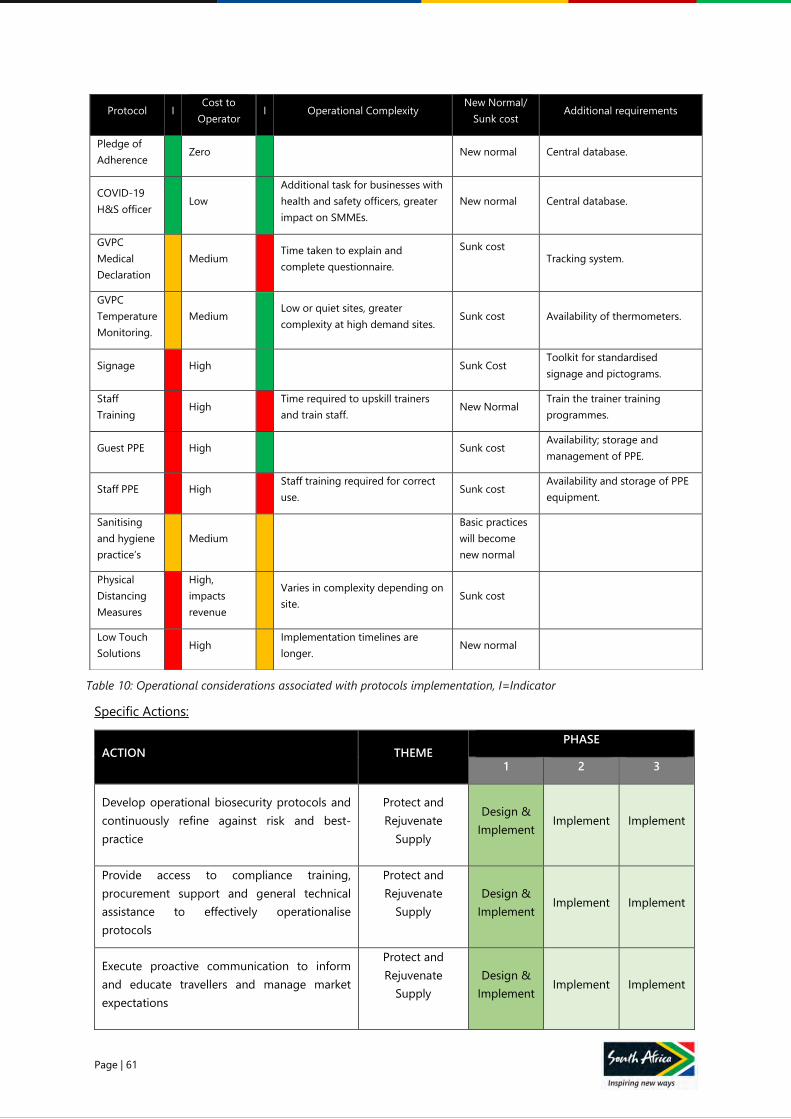
Page | 61
Specific Actions:
ACTION THEME PHASE
1 2 3
Develop operational biosecurity protocols and
continuously refine against risk and best-
practice
Protect and
Rejuvenate
Supply
Design &
Implement Implement Implement
Provide access to compliance training,
procurement support and general technical
assistance to effectively operationalise
protocols
Protect and
Rejuvenate
Supply
Design &
Implement Implement Implement
Execute proactive communication to inform
and educate travellers and manage market
expectations
Protect and
Rejuvenate
Supply
Design &
Implement Implement Implement
Table 10: Operational considerations associated with protocols implementation, I=Indicator
Protocol I Cost to
Operator I Operational Complexity
New Normal/
Sunk cost Additional requirements
Pledge of
Adherence Zero New normal Central database.
COVID-19
H&S officer Low
Additional task for businesses with
health and safety officers, greater
impact on SMMEs.
New normal Central database.
GVPC
Medical
Declaration
Medium Time taken to explain and
complete questionnaire.
Sunk cost
Tracking system.
GVPC
Temperature
Monitoring.
Medium Low or quiet sites, greater
complexity at high demand sites. Sunk cost Availability of thermometers.
Signage High Sunk Cost Toolkit for standardised
signage and pictograms.
Staff
Training High
Time required to upskill trainers
and train staff. New Normal
Train the trainer training
programmes.
Guest PPE High Sunk cost Availability; storage and
management of PPE.
Staff PPE High Staff training required for correct
use. Sunk cost
Availability and storage of PPE
equipment.
Sanitising
and hygiene
practice’s
Medium
Basic practices
will become
new normal
Physical
Distancing
Measures
High,
impacts
revenue
Varies in complexity depending on
site. Sunk cost
Low Touch
Solutions High
Implementation timelines are
longer. New normal
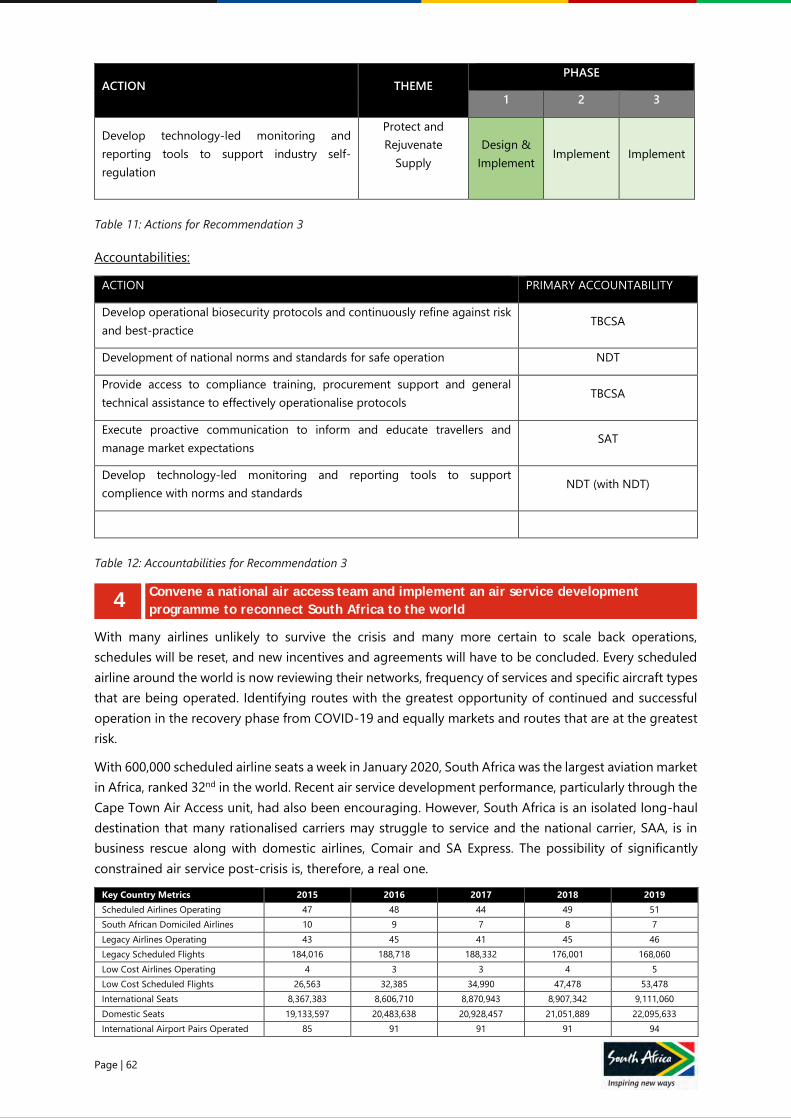
Page | 62
ACTION THEME PHASE
1 2 3
Develop technology-led monitoring and
reporting tools to support industry self-
regulation
Protect and
Rejuvenate
Supply
Design &
Implement Implement Implement
Table 11: Actions for Recommendation 3
Accountabilities:
ACTION PRIMARY ACCOUNTABILITY
Develop operational biosecurity protocols and continuously refine against risk
and best-practice TBCSA
Development of national norms and standards for safe operation NDT
Provide access to compliance training, procurement support and general
technical assistance to effectively operationalise protocols TBCSA
Execute proactive communication to inform and educate travellers and
manage market expectations SAT
Develop technology-led monitoring and reporting tools to support
complience with norms and standards NDT (with NDT)
Table 12: Accountabilities for Recommendation 3
4 Convene a national air access team and implement an air service development
programme to reconnect South Africa to the world
With many airlines unlikely to survive the crisis and many more certain to scale back operations,
schedules will be reset, and new incentives and agreements will have to be concluded. Every scheduled
airline around the world is now reviewing their networks, frequency of services and specific aircraft types
that are being operated. Identifying routes with the greatest opportunity of continued and successful
operation in the recovery phase from COVID-19 and equally markets and routes that are at the greatest
risk.
With 600,000 scheduled airline seats a week in January 2020, South Africa was the largest aviation market
in Africa, ranked 32nd in the world. Recent air service development performance, particularly through the
Cape Town Air Access unit, had also been encouraging. However, South Africa is an isolated long-haul
destination that many rationalised carriers may struggle to service and the national carrier, SAA, is in
business rescue along with domestic airlines, Comair and SA Express. The possibility of significantly
constrained air service post-crisis is, therefore, a real one.
Key Country Metrics 2015 2016 2017 2018 2019
Scheduled Airlines Operating 47 48 44 49 51
South African Domiciled Airlines 10 9 7 8 7
Legacy Airlines Operating 43 45 41 45 46
Legacy Scheduled Flights 184,016 188,718 188,332 176,001 168,060
Low Cost Airlines Operating 4 3 3 4 5
Low Cost Scheduled Flights 26,563 32,385 34,990 47,478 53,478
International Seats 8,367,383 8,606,710 8,870,943 8,907,342 9,111,060
Domestic Seats 19,133,597 20,483,638 20,928,457 21,051,889 22,095,633
International Airport Pairs Operated 85 91 91 91 94
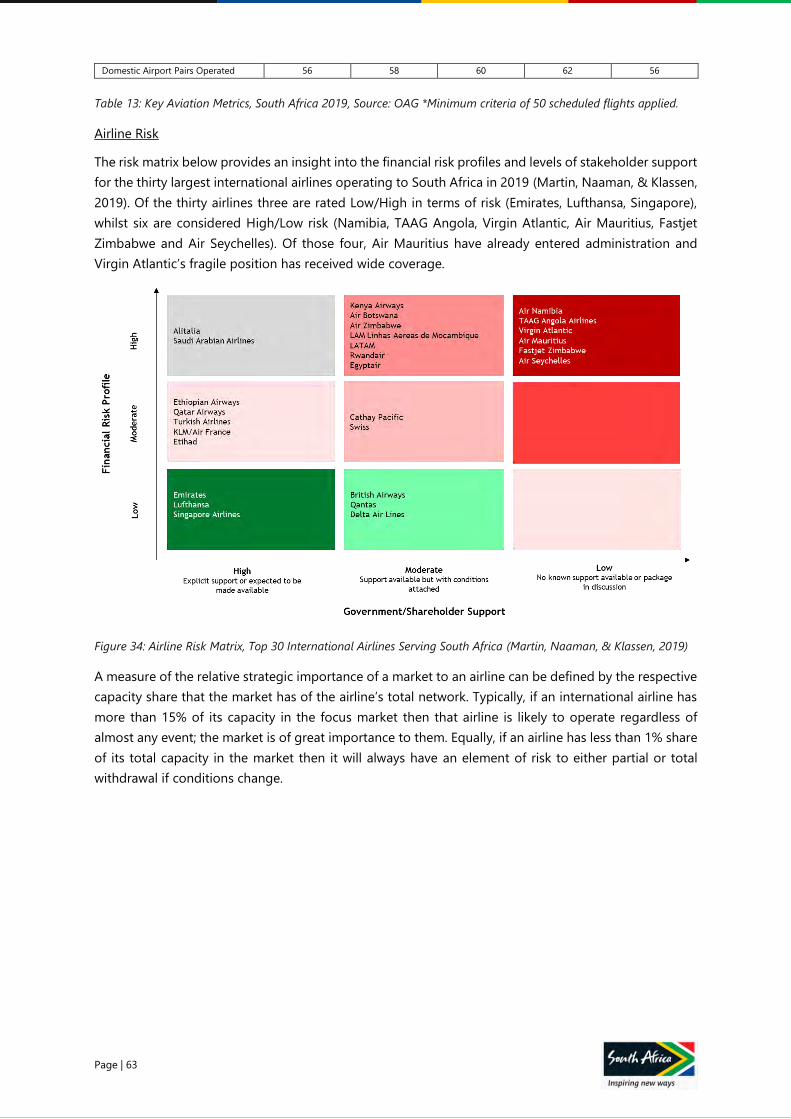
Page | 63
Domestic Airport Pairs Operated 56 58 60 62 56
Table 13: Key Aviation Metrics, South Africa 2019, Source: OAG *Minimum criteria of 50 scheduled flights applied.
Airline Risk
The risk matrix below provides an insight into the financial risk profiles and levels of stakeholder support
for the thirty largest international airlines operating to South Africa in 2019 (Martin, Naaman, & Klassen,
2019). Of the thirty airlines three are rated Low/High in terms of risk (Emirates, Lufthansa, Singapore),
whilst six are considered High/Low risk (Namibia, TAAG Angola, Virgin Atlantic, Air Mauritius, Fastjet
Zimbabwe and Air Seychelles). Of those four, Air Mauritius have already entered administration and
Virgin Atlantic’s fragile position has received wide coverage.
Figure 34: Airline Risk Matrix, Top 30 International Airlines Serving South Africa (Martin, Naaman, & Klassen, 2019)
A measure of the relative strategic importance of a market to an airline can be defined by the respective
capacity share that the market has of the airline’s total network. Typically, if an international airline has
more than 15% of its capacity in the focus market then that airline is likely to operate regardless of
almost any event; the market is of great importance to them. Equally, if an airline has less than 1% share
of its total capacity in the market then it will always have an element of risk to either partial or total
withdrawal if conditions change.
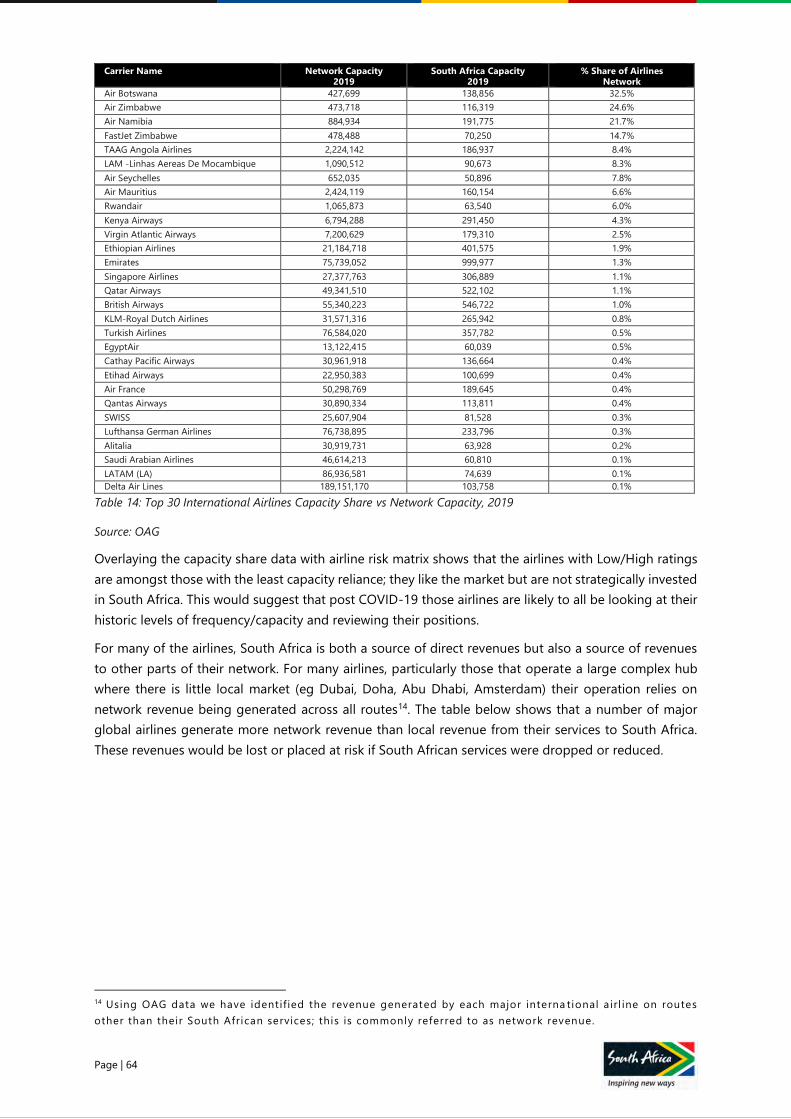
Page | 64
Carrier Name Network Capacity 2019
South Africa Capacity 2019
% Share of Airlines Network
Air Botswana 427,699 138,856 32.5%
Air Zimbabwe 473,718 116,319 24.6%
Air Namibia 884,934 191,775 21.7%
FastJet Zimbabwe 478,488 70,250 14.7%
TAAG Angola Airlines 2,224,142 186,937 8.4%
LAM -Linhas Aereas De Mocambique 1,090,512 90,673 8.3%
Air Seychelles 652,035 50,896 7.8%
Air Mauritius 2,424,119 160,154 6.6%
Rwandair 1,065,873 63,540 6.0%
Kenya Airways 6,794,288 291,450 4.3%
Virgin Atlantic Airways 7,200,629 179,310 2.5%
Ethiopian Airlines 21,184,718 401,575 1.9%
Emirates 75,739,052 999,977 1.3%
Singapore Airlines 27,377,763 306,889 1.1%
Qatar Airways 49,341,510 522,102 1.1%
British Airways 55,340,223 546,722 1.0%
KLM-Royal Dutch Airlines 31,571,316 265,942 0.8%
Turkish Airlines 76,584,020 357,782 0.5%
EgyptAir 13,122,415 60,039 0.5%
Cathay Pacific Airways 30,961,918 136,664 0.4%
Etihad Airways 22,950,383 100,699 0.4%
Air France 50,298,769 189,645 0.4%
Qantas Airways 30,890,334 113,811 0.4%
SWISS 25,607,904 81,528 0.3%
Lufthansa German Airlines 76,738,895 233,796 0.3%
Alitalia 30,919,731 63,928 0.2%
Saudi Arabian Airlines 46,614,213 60,810 0.1%
LATAM (LA) 86,936,581 74,639 0.1%
Delta Air Lines 189,151,170 103,758 0.1%
Table 14: Top 30 International Airlines Capacity Share vs Network Capacity, 2019
Source: OAG
Overlaying the capacity share data with airline risk matrix shows that the airlines with Low/High ratings
are amongst those with the least capacity reliance; they like the market but are not strategically invested
in South Africa. This would suggest that post COVID-19 those airlines are likely to all be looking at their
historic levels of frequency/capacity and reviewing their positions.
For many of the airlines, South Africa is both a source of direct revenues but also a source of revenues
to other parts of their network. For many airlines, particularly those that operate a large complex hub
where there is little local market (eg Dubai, Doha, Abu Dhabi, Amsterdam) their operation relies on
network revenue being generated across all routes14. The table below shows that a number of major
global airlines generate more network revenue than local revenue from their services to South Africa.
These revenues would be lost or placed at risk if South African services were dropped or reduced.
14 Using OAG data we have identif ied the revenue generated by each major interna tional a irl ine on routes
other than their South African services; this is commonly referred to as network revenue.
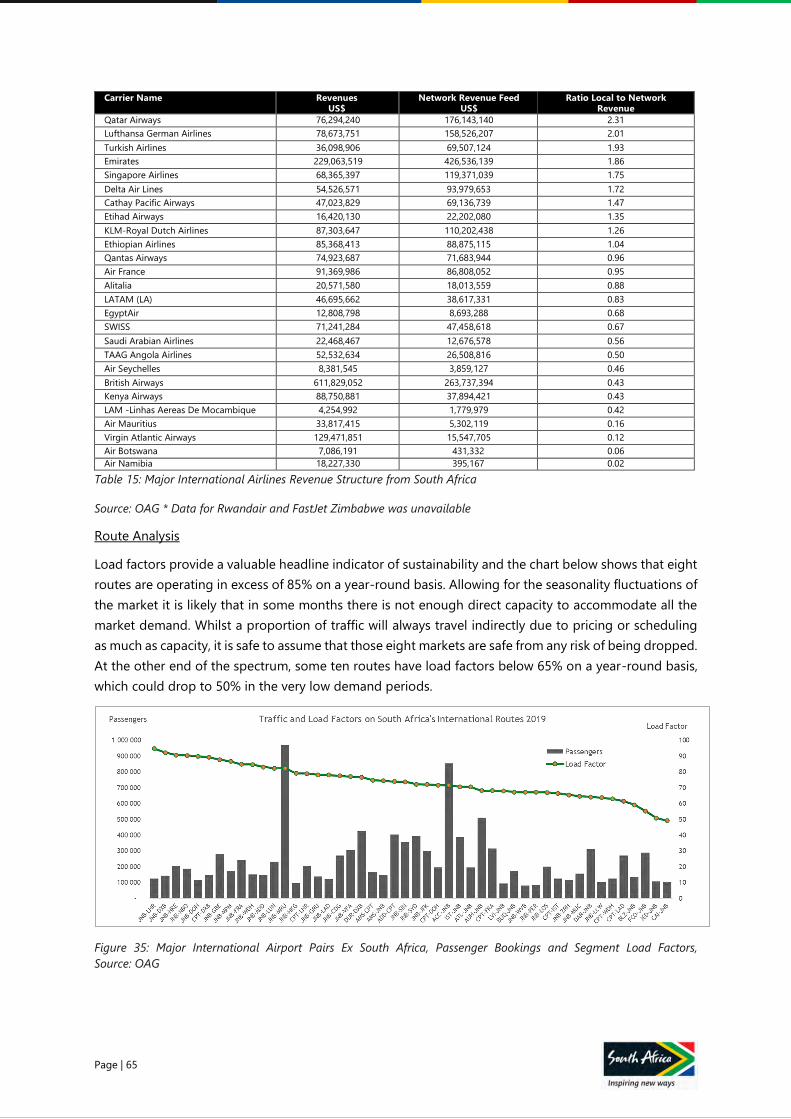
Page | 65
Carrier Name Revenues US$
Network Revenue Feed US$
Ratio Local to Network Revenue
Qatar Airways 76,294,240 176,143,140 2.31
Lufthansa German Airlines 78,673,751 158,526,207 2.01
Turkish Airlines 36,098,906 69,507,124 1.93
Emirates 229,063,519 426,536,139 1.86
Singapore Airlines 68,365,397 119,371,039 1.75
Delta Air Lines 54,526,571 93,979,653 1.72
Cathay Pacific Airways 47,023,829 69,136,739 1.47
Etihad Airways 16,420,130 22,202,080 1.35
KLM-Royal Dutch Airlines 87,303,647 110,202,438 1.26
Ethiopian Airlines 85,368,413 88,875,115 1.04
Qantas Airways 74,923,687 71,683,944 0.96
Air France 91,369,986 86,808,052 0.95
Alitalia 20,571,580 18,013,559 0.88
LATAM (LA) 46,695,662 38,617,331 0.83
EgyptAir 12,808,798 8,693,288 0.68
SWISS 71,241,284 47,458,618 0.67
Saudi Arabian Airlines 22,468,467 12,676,578 0.56
TAAG Angola Airlines 52,532,634 26,508,816 0.50
Air Seychelles 8,381,545 3,859,127 0.46
British Airways 611,829,052 263,737,394 0.43
Kenya Airways 88,750,881 37,894,421 0.43
LAM -Linhas Aereas De Mocambique 4,254,992 1,779,979 0.42
Air Mauritius 33,817,415 5,302,119 0.16
Virgin Atlantic Airways 129,471,851 15,547,705 0.12
Air Botswana 7,086,191 431,332 0.06
Air Namibia 18,227,330 395,167 0.02
Table 15: Major International Airlines Revenue Structure from South Africa
Source: OAG * Data for Rwandair and FastJet Zimbabwe was unavailable
Route Analysis
Load factors provide a valuable headline indicator of sustainability and the chart below shows that eight
routes are operating in excess of 85% on a year-round basis. Allowing for the seasonality fluctuations of
the market it is likely that in some months there is not enough direct capacity to accommodate all the
market demand. Whilst a proportion of traffic will always travel indirectly due to pricing or scheduling
as much as capacity, it is safe to assume that those eight markets are safe from any risk of being dropped.
At the other end of the spectrum, some ten routes have load factors below 65% on a year-round basis,
which could drop to 50% in the very low demand periods.
Figure 35: Major International Airport Pairs Ex South Africa, Passenger Bookings and Segment Load Factors,
Source: OAG
Page | 66
Outlook
The expectation is that demand recovery will lag capacity recovery, which will lead to aggressive airline
pricing, short notice cancellations of poorly supported services and potentially a series of airline failures
in the next year. Major domestic markets around the world will recover faster than international markets
and it is expected that ~65% of global capacity will have returned to January 2020 levels by year end,
with softer load factors translating to a 55% recovery in total global demand.
The net assessment of airline and route risk suggests that for strategic and commercial reasons the
current roster of international airlines operating to South Africa looks reasonably secure. However, with
nearly every airline seeking to cut capacity, the precise levels of both frequency and capacity (through
aircraft type changes) could see changes in the short-term and indeed through the next two-year period
as carriers seek to rebuild cash reserves and adopt risk averse network strategies. A number of airlines
and routes are at risk based on 2019 data. These include:
• Johannesburg - Cairo, EgyptAir
• Johannesburg - Rome, Alitalia
• Johannesburg - Munich, Lufthansa
• Johannesburg – Sao Paulo, LATAM
• Johannesburg – Jeddah, Saudia
• Cape Town – Istanbul, Turkish Airlines (Winter service at risk)
• Cape Town – New York, United (Seasonal Service)
• Cape Town – Vienna, Austrian (seasonal is at risk)
More significantly, SAA supplied 2,6 million seats, or 28% of international capacity, in 2019 and the airline
and its affiliates operated over half of the scheduled domestic services in 2019. With the carrier in
business rescue, there is likely to be substantial gap in capacity in the short-term. While this is of concern
for the tourism sector, 41% of scheduled international services were offered in competition with other
airlines and the largest of the routes operated by SAA without competition was Johannesburg – Manzini.
Similarly, in the domestic market a combination of local and connecting demand provides a consistent
flow of traffic but excess capacity has resulted in extremely low and often sub-commercial fares.
A rationalised SAA, however, could create a better balance in expected capacity to future demand for
international services and would provide some reassurance to those international airlines operating to
South Africa around the strength of the market. The size and sound fundamentals of the domestic
market mean that capacity will be created by the most efficient airlines and that capacity is likely to settle
in a relatively short period of time.
Air Service Development
An Air Service Development (ASD) programme must support connectivity to major source markets and
seek to develop access to new emergent markets. Creating competition amongst airline operators to
achieve both sufficient capacity and competitive air fares all year round is also central to the mandate.
In addition to the large international passenger carriers, opportunities also exist to target air cargo
services to shore up revenue during the ban on passenger travel. Air charter services also may serve as
a stop-gap measure way to support passenger demand with air service capacity immediately after
restrictions are lifted.
Specific Actions:
ACTION THEME PHASE
1 2 3
Page | 67
Form a national air access unit responsible for
country-wide route support and development
Protect and
Rejuvenate
Supply
Design &
Implement Implement Implement
Evaluate airline and route risk to continuously
identify attractive partnerships to be pursued
and unattractive ones to be avoided
Protect and
Rejuvenate
Supply
Design &
Implement Implement Implement
Develop and implement a comprehensive air
service development programme
Protect and
Rejuvenate
Supply
Design &
Implement Implement Implement
Table 16: Actions for Recommendation 4
Accountabilities:
ACTION PRIMARY ACCOUNTABILITY
Form a national air access unit responsible for country-wide route support and
development
Deparpartment of Transport,
NDT, SAT and TBCSA
Evaluate airline and route risk to continuously identify attractive partnerships
to be pursued and unattractive ones to be avoided SAT
Develop and implement a comprehensive air service development programme Department of Transport, NDT
and SAT
Table 17: Accountabilities for Recommendation 4
MODELLING AND SIMULATION OF INTERVENTIONS
Phase 1 interventions are focused on protecting supply and initiating the implementation of the recovery
plan. The Enhanced Tourism Supply Support Package is designed to reduce supply degradation by
intervening to support a finely targeted businesses that risk closing in the next three months. The
interventions are based on survey results that indicated organisations would need at least 53% of
expected monthly turnover to cover essential costs and survive on a month-to-month basis. It is
proposed to target support at this level. Globally recognised biosecurity protocols can enable earlier
opening for domestic and inbound tourism; thus, demand can potentially start sooner. Lastly, the airlift
incentive programme will ensure airlines are operational by boosting aviation supply in phases over 18-
24 months.
If these four interventions are executed, the sector could experience a R9.7 billion boost in output in
2020 against the post-COVID-19 base case. This would lead to a further R128,5 billion into 2021 and
2022 and would contribute to preserving more than 91,000 jobs. Estimated sub-sector impacts are
summarised below:
• Travel Distribution & Intermediaries: Under this scenario, travel distribution and intermediaries
will avoid output losses of R6,7 billion between 2020 and 2022, and over 3,900 jobs in the sub-
sector will be preserved over the three years.
• Transport & Related Services: Transport and related services will see a R50,6 billion avoidance
in output reduction between 2020 and 2022, and over 33,000 jobs in the sub-sector will be
preserved.
• Accommodation: Accommodation will avoid output losses of R21,9 billion and approximately
15,900 jobs in the sub-sector will be preserved over the three years.
Page | 68
• Entertainment & Related Services: Entertainment and related services will avoid a R58,9 billion
reduction in output, and 38,000 jobs in the sub-sector will be preserved from 2020 to 2022.
For detailed outputs refer the tables in the Appendix.
Page | 69
PHASE 2: MATCHING SUPPLY
AND DEMAND (3-9 Months)
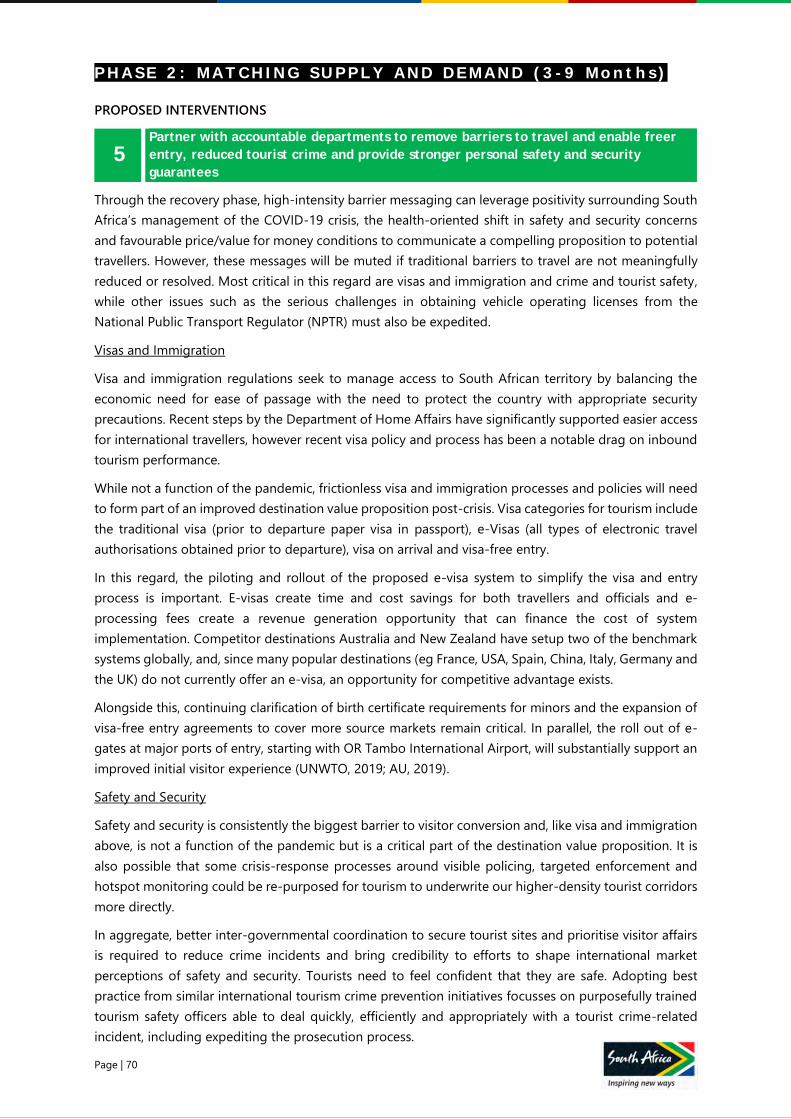
Page | 70
P H A S E 2 : M A T C H I N G S U P P L Y A N D D E M A N D ( 3 - 9 M o n t h s )
PROPOSED INTERVENTIONS
5
Partner with accountable departments to remove barriers to travel and enable freer
entry, reduced tourist crime and provide stronger personal safety and security
guarantees
Through the recovery phase, high-intensity barrier messaging can leverage positivity surrounding South
Africa’s management of the COVID-19 crisis, the health-oriented shift in safety and security concerns
and favourable price/value for money conditions to communicate a compelling proposition to potential
travellers. However, these messages will be muted if traditional barriers to travel are not meaningfully
reduced or resolved. Most critical in this regard are visas and immigration and crime and tourist safety,
while other issues such as the serious challenges in obtaining vehicle operating licenses from the
National Public Transport Regulator (NPTR) must also be expedited.
Visas and Immigration
Visa and immigration regulations seek to manage access to South African territory by balancing the
economic need for ease of passage with the need to protect the country with appropriate security
precautions. Recent steps by the Department of Home Affairs have significantly supported easier access
for international travellers, however recent visa policy and process has been a notable drag on inbound
tourism performance.
While not a function of the pandemic, frictionless visa and immigration processes and policies will need
to form part of an improved destination value proposition post-crisis. Visa categories for tourism include
the traditional visa (prior to departure paper visa in passport), e-Visas (all types of electronic travel
authorisations obtained prior to departure), visa on arrival and visa-free entry.
In this regard, the piloting and rollout of the proposed e-visa system to simplify the visa and entry
process is important. E-visas create time and cost savings for both travellers and officials and e-
processing fees create a revenue generation opportunity that can finance the cost of system
implementation. Competitor destinations Australia and New Zealand have setup two of the benchmark
systems globally, and, since many popular destinations (eg France, USA, Spain, China, Italy, Germany and
the UK) do not currently offer an e-visa, an opportunity for competitive advantage exists.
Alongside this, continuing clarification of birth certificate requirements for minors and the expansion of
visa-free entry agreements to cover more source markets remain critical. In parallel, the roll out of e-
gates at major ports of entry, starting with OR Tambo International Airport, will substantially support an
improved initial visitor experience (UNWTO, 2019; AU, 2019).
Safety and Security
Safety and security is consistently the biggest barrier to visitor conversion and, like visa and immigration
above, is not a function of the pandemic but is a critical part of the destination value proposition. It is
also possible that some crisis-response processes around visible policing, targeted enforcement and
hotspot monitoring could be re-purposed for tourism to underwrite our higher-density tourist corridors
more directly.
In aggregate, better inter-governmental coordination to secure tourist sites and prioritise visitor affairs
is required to reduce crime incidents and bring credibility to efforts to shape international market
perceptions of safety and security. Tourists need to feel confident that they are safe. Adopting best
practice from similar international tourism crime prevention initiatives focusses on purposefully trained
tourism safety officers able to deal quickly, efficiently and appropriately with a tourist crime-related
incident, including expediting the prosecution process.
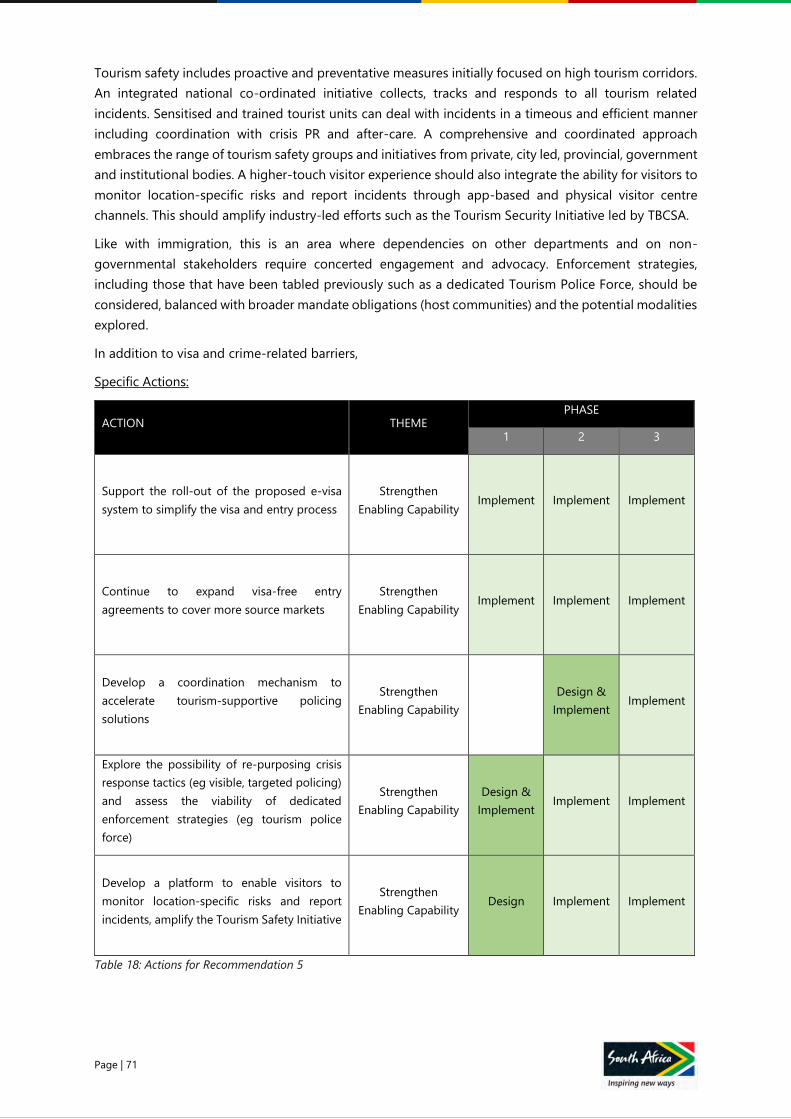
Page | 71
Tourism safety includes proactive and preventative measures initially focused on high tourism corridors.
An integrated national co-ordinated initiative collects, tracks and responds to all tourism related
incidents. Sensitised and trained tourist units can deal with incidents in a timeous and efficient manner
including coordination with crisis PR and after-care. A comprehensive and coordinated approach
embraces the range of tourism safety groups and initiatives from private, city led, provincial, government
and institutional bodies. A higher-touch visitor experience should also integrate the ability for visitors to
monitor location-specific risks and report incidents through app-based and physical visitor centre
channels. This should amplify industry-led efforts such as the Tourism Security Initiative led by TBCSA.
Like with immigration, this is an area where dependencies on other departments and on non-
governmental stakeholders require concerted engagement and advocacy. Enforcement strategies,
including those that have been tabled previously such as a dedicated Tourism Police Force, should be
considered, balanced with broader mandate obligations (host communities) and the potential modalities
explored.
In addition to visa and crime-related barriers,
Specific Actions:
ACTION THEME PHASE
1 2 3
Support the roll-out of the proposed e-visa
system to simplify the visa and entry process
Strengthen
Enabling Capability Implement Implement Implement
Continue to expand visa-free entry
agreements to cover more source markets
Strengthen
Enabling Capability Implement Implement Implement
Develop a coordination mechanism to
accelerate tourism-supportive policing
solutions
Strengthen
Enabling Capability
Design &
Implement Implement
Explore the possibility of re-purposing crisis
response tactics (eg visible, targeted policing)
and assess the viability of dedicated
enforcement strategies (eg tourism police
force)
Strengthen
Enabling Capability
Design &
Implement Implement Implement
Develop a platform to enable visitors to
monitor location-specific risks and report
incidents, amplify the Tourism Safety Initiative
Strengthen
Enabling Capability Design Implement Implement
Table 18: Actions for Recommendation 5
Page | 72
Accountabilities:
ACTION PRIMARY ACCOUNTABILITY
Support the roll-out of the proposed e-visa system to simplify the visa and
entry process
Department of Home Affairs
(DHA) and NDT
Continue to expand visa-free entry agreements to cover more source markets DHA and NDT
Develop a coordination mechanism to accelerate tourism-supportive policing
solutions NDT (with SAPS)
Explore the possibility of re-purposing crisis response tactics (eg visible,
targeted policing) and assess the viability of dedicated enforcement strategies
(eg tourism police force)
SAPS and NDT
Develop a platform to enable visitors to monitor location-specific risks and
report incidents, amplify the Tourism Safety Initiative SAT / TBCSA
Table 19: Accountabilities for Recommendation 5
6 Catalyse domestic demand through the phases of economic re-opening with
informative and inspirational messaging that encourages safe tourism
Leisure travel appetite post-crisis will be weighted towards the VFR and FIT segments, where authentic,
lower-density itineraries will be popular. The trend towards independent, digital distribution and
booking will accelerate, though traditional trade channels will be favoured by some for assurance
reasons. Corporate domestic travel can be expected to revive relatively early, however conventions and
exhibitions, which rely on trust and certainty will be amongst the longest to recover.
How domestic consumers open themselves up to local travel will depend on how COVID-19 has affected
them. The market will initially be keen to explore hyperlocal experiences as soon as lockdown levels
allow, expanding further afield to day trips, overnight trips and regional trips as lockdown restrictions
ease further. Perceived safety will depend on the social contract in place in public spaces and an
understanding that accepted health and safety social practices, such as physical distancing measures,
hygiene standards and low touch transaction are in place and visible. Health and safety practices need
to ‘support the fun, not spoil the fun’ and be augmented by a country-wide communication strategy
that highlights expected behaviour in public and standardises safety measures in place at leisure sites.
Ultimately personal financial circumstances will dictate travel decisions and take-up. It will thus be key
to understand the financial impact that the pandemic and lockdown has on each consumer segment.
Systemic and supply chain constraints exist. Domestic consumers will have a shortage of leave days due
(as many had to take leave during lockdown), have a reduced school holiday window and have reduced
discretionary spend. Domestic air travel is likely to increase in price and be highly constrained. Whilst
there has been an increasing demand for experiential purchases over services and goods, there is a lack
of data as to how South African consumers are embracing this world-wide trend. Summer school
holidays are traditionally the busiest time of the year for domestic travel. Staggering the summer inland
and coastal school holidays (without compromising the number of school days) will spread the busiest
holiday period of the year across a broader time span and has successfully been adopted internationally
to stimulate domestic travel demand by extending the peak season, providing greater choice and
affordability for local families.
Page | 73
Re-ignition of the domestic market will occur in phases as lockdown restrictions are eased. The initial
three-month period will be characterised by ‘Cabin Fever Breakout’ as there is pent up demand for a
change of scenery and visiting friends and relatives. Until international outward travel normalises there
will be an opportunity to capitalise on ‘Substitution Tourism’ as consumers seek local replacements for
their international holidays. ‘Staycation Tourism’ has a longer time horizon as this market segment with
reduced discretionary spend explores local leisure experiences, many for the first time. The medium to
long term growth opportunity is in identifying the ‘New Experiential Consumer’ as they follow the global
trend moving from material consumption to experiential consumption, as well as targeting the Intrepid
Traveller.
SAT will need to gain a clear understanding of each of these consumer groups and tailor the marketing,
communication and travel offerings accordingly.
Cabin Fever Breakout
After months of lockdown at home there is pent up demand for a change of scenery. There will be
demand for safe spaces to visit with close and extended family and friends with whom one feels safe
(one’s “COVID Tribe” or ‘bubble’). Expect to see initial surge with some tailing off after three months
(Namibia saw fully booked national parks in the first weekend after lockdown ended). Lead times will be
short. Cabin fever breakout will be characterised by well-living weekend trips and day excursions.
Well-living weekend trips will focus on spaces that speak to holistic wellness: physical, mental, emotional,
spiritual, social and environmental. Consumers will look for spaces and places that allow for safe re-
connections with family and friends and the celebration of missed birthdays, graduations and personal
events. The focus will be on self-drive destinations within a maximum of a half day’s drive from major
metros. This audience is a low touch travel group as they have their own transport and are likely to
research, book, pay and check-in online (i.e., Fully Independent Travellers – FITs).
Consumers will seek day excursions and longer day trips to entertain themselves with a change of
scenery. Attractions and experiences can expect to see family units and slightly larger close friends and
family groups. It is not the norm in the domestic market to book in advance, but equally few sites have
a capacity issue. What will need to be managed is the potential for congested arrival and departure
times. Attractions and experiences should be encouraged to communicate in advance of changed
operational plans and provide extra value rather than reduced entry fee to market to this segment.
Substitution Tourism (i.e., Domestic Traveller Audience)
There is a window of opportunity to respond to Substitution Tourism before outbound international
travel normalises. Unable to indulge in (often pre-budgeted) overseas holidays, this segment, Domestic
“Discover South Africa” Travellers, will seek to substitute with domestic travel indulgences. This segment
has available discretionary spend that can be used to support higher-end local tourism offerings. Many
kept working during lockdown and may be experiencing lockdown burnout. The lockdown may have
had limited financial impact, or they expect financial recovery once economic activity resumes to ‘normal’
again. Whilst staying local may be less expensive, they will seek out good local deals to indulge in. Take-
up will be dependent on flexible cancellation policies and value add deals such as 3 nights for the price
of 2 and experiential travel packages. This tech savvy e-traveller will search online for ideas and deals.
There is an opportunity to pre-sell in a “buy now–travel later” campaign. This segment speaks to SAT’s
‘Seasoned Leisure Seekers’ and ‘Well–to-do Mzansi Families’.
Staycation Tourism: “Try Something New”
Lockdown will increase the demand for staycation tourism products. Due to reduced discretionary spend,
this market will choose to stay at home but participate in leisure activities within driving distance. Initially
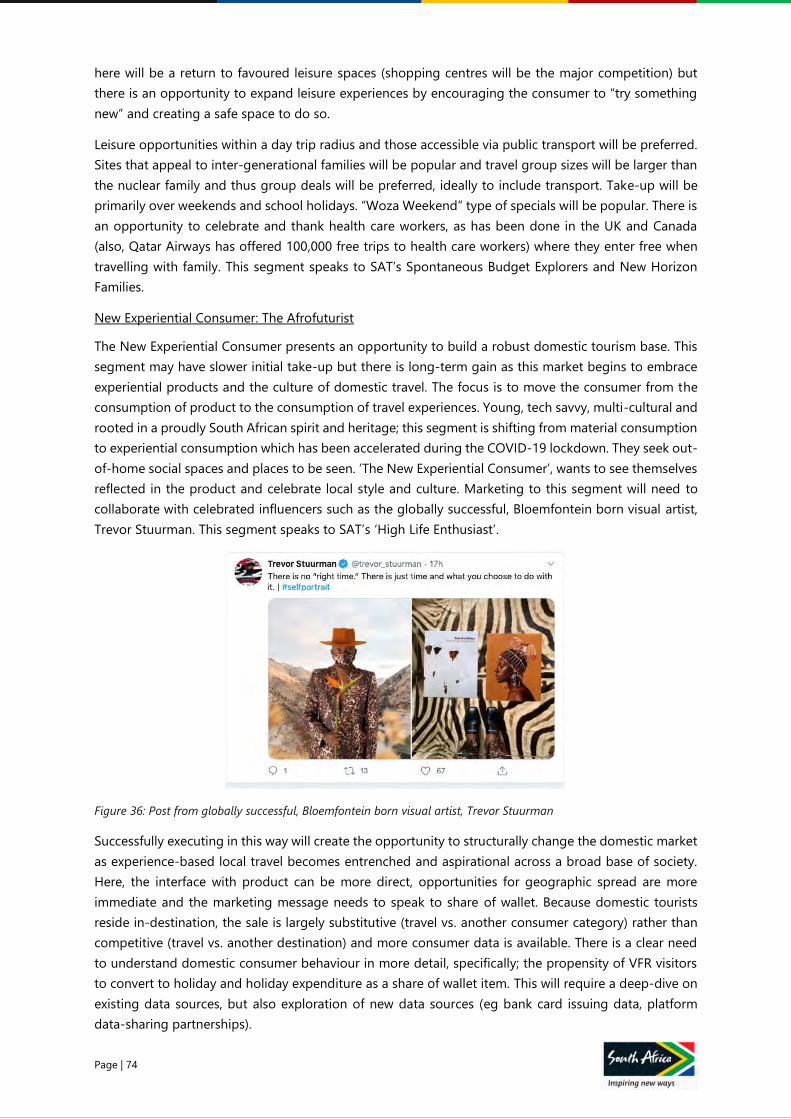
Page | 74
here will be a return to favoured leisure spaces (shopping centres will be the major competition) but
there is an opportunity to expand leisure experiences by encouraging the consumer to “try something
new” and creating a safe space to do so.
Leisure opportunities within a day trip radius and those accessible via public transport will be preferred.
Sites that appeal to inter-generational families will be popular and travel group sizes will be larger than
the nuclear family and thus group deals will be preferred, ideally to include transport. Take-up will be
primarily over weekends and school holidays. “Woza Weekend” type of specials will be popular. There is
an opportunity to celebrate and thank health care workers, as has been done in the UK and Canada
(also, Qatar Airways has offered 100,000 free trips to health care workers) where they enter free when
travelling with family. This segment speaks to SAT’s Spontaneous Budget Explorers and New Horizon
Families.
New Experiential Consumer: The Afrofuturist
The New Experiential Consumer presents an opportunity to build a robust domestic tourism base. This
segment may have slower initial take-up but there is long-term gain as this market begins to embrace
experiential products and the culture of domestic travel. The focus is to move the consumer from the
consumption of product to the consumption of travel experiences. Young, tech savvy, multi-cultural and
rooted in a proudly South African spirit and heritage; this segment is shifting from material consumption
to experiential consumption which has been accelerated during the COVID-19 lockdown. They seek out-
of-home social spaces and places to be seen. ‘The New Experiential Consumer’, wants to see themselves
reflected in the product and celebrate local style and culture. Marketing to this segment will need to
collaborate with celebrated influencers such as the globally successful, Bloemfontein born visual artist,
Trevor Stuurman. This segment speaks to SAT’s ‘High Life Enthusiast’.
Figure 36: Post from globally successful, Bloemfontein born visual artist, Trevor Stuurman
Successfully executing in this way will create the opportunity to structurally change the domestic market
as experience-based local travel becomes entrenched and aspirational across a broad base of society.
Here, the interface with product can be more direct, opportunities for geographic spread are more
immediate and the marketing message needs to speak to share of wallet. Because domestic tourists
reside in-destination, the sale is largely substitutive (travel vs. another consumer category) rather than
competitive (travel vs. another destination) and more consumer data is available. There is a clear need
to understand domestic consumer behaviour in more detail, specifically; the propensity of VFR visitors
to convert to holiday and holiday expenditure as a share of wallet item. This will require a deep-dive on
existing data sources, but also exploration of new data sources (eg bank card issuing data, platform
data-sharing partnerships).
Page | 75
Similarly, marketing and product/experience development responses will need to be fundamentally
transformed and it is evident that domestic travel remains something of a blind spot both for SAT and
the organised tourism industry. Deeper more focused collaboration based on cooperative marketing
and data sharing through an industry technology hub will be essential.
Specific Actions:
ACTION THEME PHASE
1 2 3
Identify, analyse and respond to changes in
domestic consumer preferences
Reignite
Demand
Design &
Implement Implement
Execute a refreshed, educational marketing
programme to target the phases of re-opening
Reignite
Demand
Design &
Implement Implement Implement
Engage the domestic trade to package itineraries
and experiences that are both safe and inspirational
Reignite
Demand
Design &
Implement Implement Implement
Prioritise domestic in the industry data partnership
and partner with non-traditional data sources
Reignite
Demand Design Implement Implement
Table 20: Actions for Recommendation 6
Accountabilities:
ACTION PRIMARY
ACCOUNTABILITY
Identify, analyse and respond to changes in domestic consumer preferences SAT
Execute a refreshed, educational marketing programme to target the phases of re-
opening SAT
Engage the domestic trade to package itineraries and experiences that are both safe
and inspirational SAT
Prioritise domestic in the industry data partnership and partner with non-traditional
data sources SAT
Table 21: Accountabilities for Recommendation 6
7 Execute a high-impact global marketing, communications and travel trade programme,
targeted at highest-potential source markets and intrepid travel consumer segments,
to reignite international demand
The return of tourism will see varying rates of recovery in source markets and marketing investment
must be carefully conserved to achieve maximum impact through the recovery cycle. Similarly, the stages
of South Africa’s own re-opening and readiness to receive visitors will determine the pace at which
international travel is able to restart.
The crisis is expected to lead to changes to consumer preference across product, channel and experience.
Marrying crisis-related consumer perception shifts, the ability to travel and traditional booking cycles
will determine the best combinations of timing and regional readiness. Marketing investment must be
timed and targeted based on attractiveness and availability and will need to evolve to incorporate multi-
year investment cycles in order to optimise resources.

Page | 76
Traveller Segmentation
In a market of scarce resources and uncertain timing, identifying the highest-potential inbound target
segments is foundational to the recovery strategy. Key segments will be those with the least number of
roadblocks to travel as well as those that are the most resilient travellers, for whom adventure, culture
and nature are the driving forces for authentic travel.
South Africa has predominantly used a demographic approach to target two segments first defined at
in the early 2000s and used to continue targeting through 2019. These are:
1. A younger segment, or “Wanderluster”: Wanderlusters traditionally are considered to be avid
travellers between the ages of 25 and 40 looking for deals to see and do as much as they can.
Destination is a key factor in their trip, and they want to get the full experience, immersing
themselves in the country’s culture and having fun. Their small travel budget is not a problem:
they simply hunt for the best deals and travel off-peak. They are digitally-savvy, looking for and
booking holidays online. They tend to be Free Independent Travellers (FIT) without the pressure
of children and will spend no more than ZAR 9,500 on average; and,
2. An older segment, or “Next Stop South Africa” (NSSA): The NSSA segment on the other hand,
are wealthier, experienced international travellers, usually between the ages of 40 and 60 whose
children (if any) have left home. They typically look for natural beauty and authentic cultural
experiences. They prefer independent or small group travel and look for luxury and comfort as
part of their experience. Safety is a key consideration when choosing a new destination. Safari
is a big draw when travelling to South Africa.
However, the pandemic is forcing a rethink of segmentation altogether. Tourism will return, but a new
consumer psyche across source markets will require that channels, products, experiences and
infrastructure adapt while also accommodating new biosecurity standards. More than ever, traveller
psychology will be driven by universal factors. This presents an opportunity for South Africa to shift to a
psychographic-based hybrid segmentation to drive differentiation since many competitors will revert to
pre-crisis segmentation.
These target segments include the domestic and regional traveller (see previous recommendation) and
the Global Intrepid Traveller. Intrepid Travellers are among the highest spending global travellers for
whom travel is a significant part of their lives. They are also the travellers most resilient to perceived
issues around security. Recovery marketing should position the tourism brand around the travel values
of these segments and align these values with the country’s exceptional cultural, adventure and natural
experiences.
Intrepid Travellers highly value travel experiences that offer bragging rights and historic or cultural and
nature-based experiences. While there are many variations of Intrepid Traveller, the two that hold the
most promise are the ‘Free Spirits’ and the ‘Cultural Explorers’. ‘Free Spirits’ are highly social and open-
minded. Their enthusiasm for life extends to their outlook on travel. Experimental and adventurous, they
bask in high-end hedonistic experiences that are shared with others. ‘Cultural Explorers’ are defined by
their love of constant travel and continuous opportunities to embrace, discover and immerse themselves
in the culture, people and settings of the places they visit.
These groups of prospective travellers are the most risk-averse travellers, are most likely to hold a
passport, engage in more hands-on travel experiences, and of all groups, are the least concerned over
perceived security risks. This includes potential risks of travelling caused by the COVID-19 pandemic.
These travellers comprise approximately 34% of the total potential travel market in Europe, North
America and Oceania. The ‘Free Spirit’ and the ‘Cultural Explorer’ segments are described in the table
below. It is important to note that these initial descriptions have been adapted from
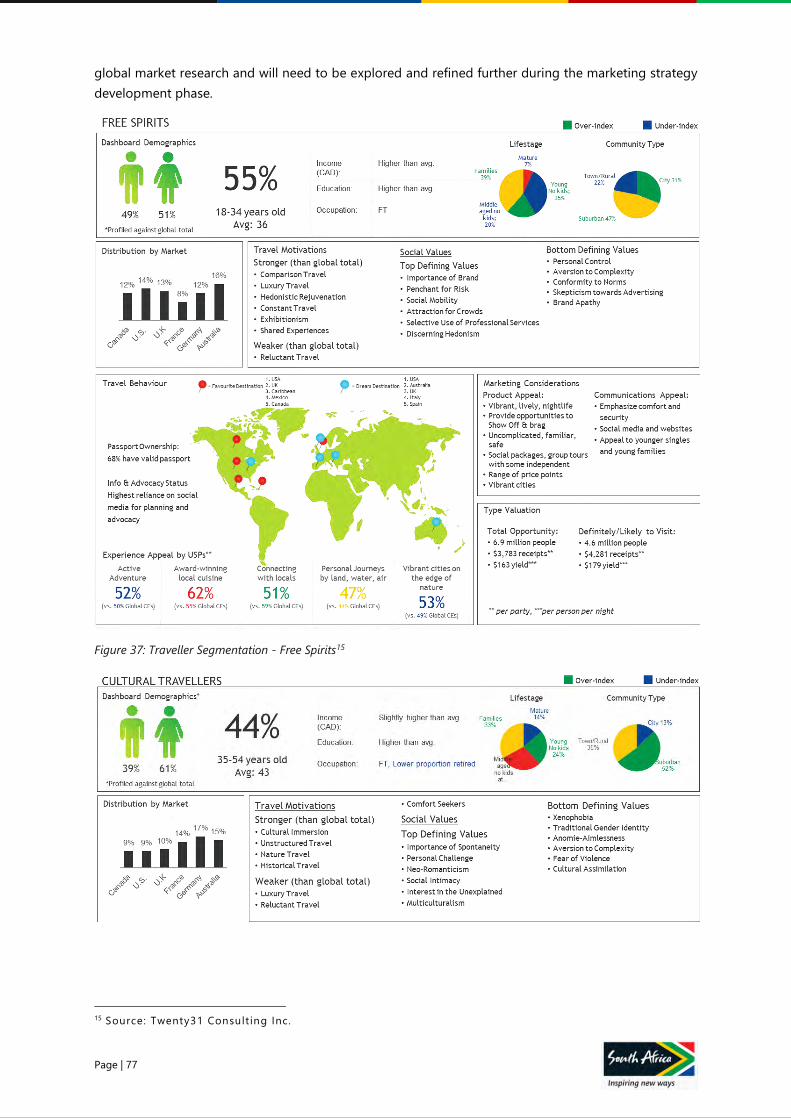
Page | 77
global market research and will need to be explored and refined further during the marketing strategy
development phase.
Figure 37: Traveller Segmentation - Free Spirits15
15 Source: Twenty31 Consult ing Inc.
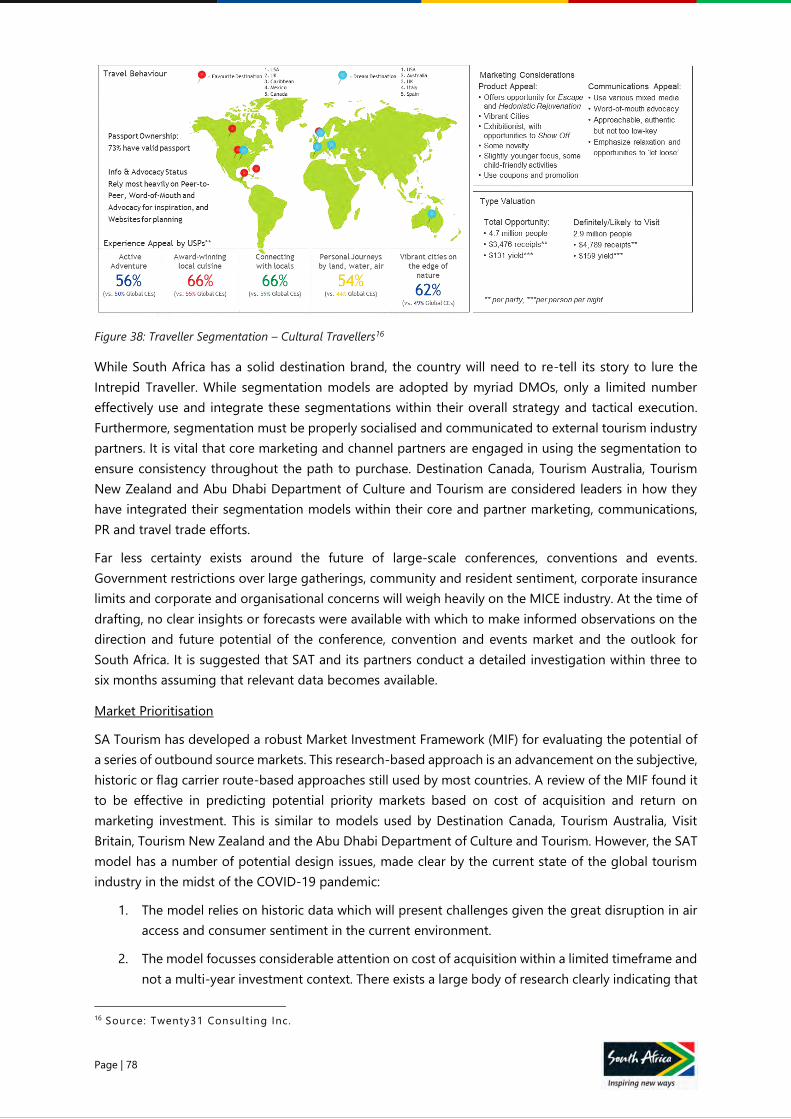
Page | 78
Figure 38: Traveller Segmentation – Cultural Travellers16
While South Africa has a solid destination brand, the country will need to re-tell its story to lure the
Intrepid Traveller. While segmentation models are adopted by myriad DMOs, only a limited number
effectively use and integrate these segmentations within their overall strategy and tactical execution.
Furthermore, segmentation must be properly socialised and communicated to external tourism industry
partners. It is vital that core marketing and channel partners are engaged in using the segmentation to
ensure consistency throughout the path to purchase. Destination Canada, Tourism Australia, Tourism
New Zealand and Abu Dhabi Department of Culture and Tourism are considered leaders in how they
have integrated their segmentation models within their core and partner marketing, communications,
PR and travel trade efforts.
Far less certainty exists around the future of large-scale conferences, conventions and events.
Government restrictions over large gatherings, community and resident sentiment, corporate insurance
limits and corporate and organisational concerns will weigh heavily on the MICE industry. At the time of
drafting, no clear insights or forecasts were available with which to make informed observations on the
direction and future potential of the conference, convention and events market and the outlook for
South Africa. It is suggested that SAT and its partners conduct a detailed investigation within three to
six months assuming that relevant data becomes available.
Market Prioritisation
SA Tourism has developed a robust Market Investment Framework (MIF) for evaluating the potential of
a series of outbound source markets. This research-based approach is an advancement on the subjective,
historic or flag carrier route-based approaches still used by most countries. A review of the MIF found it
to be effective in predicting potential priority markets based on cost of acquisition and return on
marketing investment. This is similar to models used by Destination Canada, Tourism Australia, Visit
Britain, Tourism New Zealand and the Abu Dhabi Department of Culture and Tourism. However, the SAT
model has a number of potential design issues, made clear by the current state of the global tourism
industry in the midst of the COVID-19 pandemic:
1. The model relies on historic data which will present challenges given the great disruption in air
access and consumer sentiment in the current environment.
2. The model focusses considerable attention on cost of acquisition within a limited timeframe and
not a multi-year investment context. There exists a large body of research clearly indicating that
16 Source: Twenty31 Consult ing Inc.
Page | 79
DMO efforts to build awareness, develop channels and drive consumer interest down the path
to purchase requires a minimum three-year outlook. (i.e. tourism marketing is cumulative).
3. The model does not appear to differentiate between total and discretionary travel. A number of
DMOs have determined that their direct and in-direct marketing, communications, PR and travel
trade efforts influence 20% to 30% of all travel to the destination.
4. The model does not appear to integrate existing priority consumer segments and rather takes
a holistic view of each market’s total consumer base.
5. The model appears to discount VFR travel, which counters recent global research and best-
practice that recognises this segment’s increasing value to total tourism contribution.
Lastly, the current MIF prioritises 42 source markets, with 29 identified as Core (Tier 1) and 13 identified
as Strategic (Tier 2 and 3). This is too many to focus on without severely diluting marketing,
communications, PR and travel trade budgets and resources. Leading DMOs invest in between 12
(Canada) and 24 (Dubai) priority markets, with Abu Dhabi (14), Australia (15) and Britain (21) ranging
between. In addition, the data that has informed the prioritisation of these source markets now may
have been significantly altered by the massive disruption caused by the pandemic.
To optimise effort and budget allocation, SAT should rationalise its market focus to the list of Core (Tier
1) and Secondary (Tier 2) markets for at least the next three years. This recommendation is based on an
analysis of the MIF against global DMO best practice (specifically Destination Canada, Tourism Australia,
Visit Britain and Dubai Tourism and Commerce Marketing), external data sources that highlight the
potential of outbound travel from major tourism markets (including Forward Keys; Skift; Sojern and
Adara) and the airline analysis presented in Recommendation 4: Convene a national air access team and
implement an air service development programme to reconnect South Africa to the world.
PROPOSED CORE AIR MARKETS (TIER 1, n=14)
Domestic and Regional
• South African domestic tourism and substitution tourism
• Tanzania, Kenya, Nigeria, DRC
Overseas
• Germany, UK, France, China, India, Netherlands, Australia, USA, Canada
SECONDARY MARKETS (TIER 2, n=9)
Regional
• Uganda, Ghana, Angola, Ethiopia, Botswana, Namibia
Overseas
• Sweden, Italy, Brazil
While this represents a significant shift in resource allocation, the approach takes a longer-term view of
recovery and future growth and focuses resources to gain increased market presence. It also reflects a
general trend towards greater precision and multi-year market development strategies by leading DMOs
that pre-dates the pandemic. Given the investment made in developing the MIF, the existing model
should be adapted to consider observations 1-5 outlined above, with data re-run in 2021 once market
conditions stabilise and data points become available. Some primary and secondary research should
support a new or modified set of variables to help determine which source markets are most viable from
the selection identified.
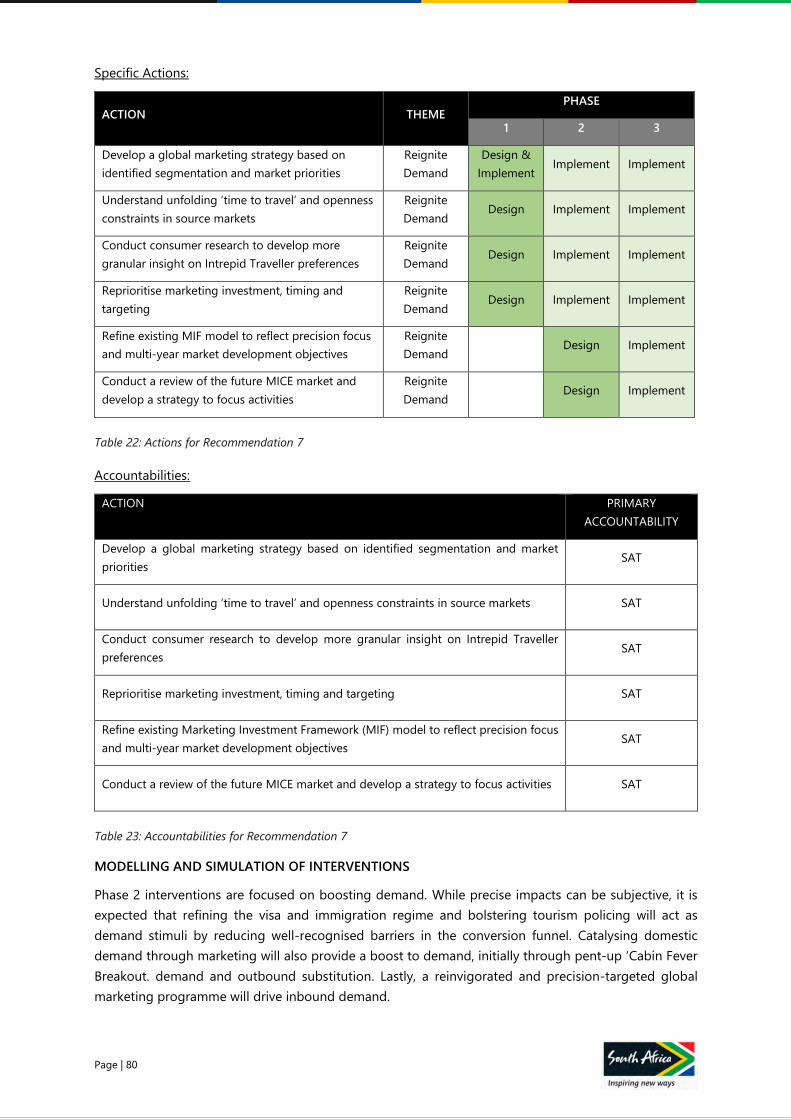
Page | 80
Specific Actions:
ACTION THEME PHASE
1 2 3
Develop a global marketing strategy based on
identified segmentation and market priorities
Reignite
Demand
Design &
Implement Implement Implement
Understand unfolding ‘time to travel’ and openness
constraints in source markets
Reignite
Demand Design Implement Implement
Conduct consumer research to develop more
granular insight on Intrepid Traveller preferences
Reignite
Demand Design Implement Implement
Reprioritise marketing investment, timing and
targeting
Reignite
Demand Design Implement Implement
Refine existing MIF model to reflect precision focus
and multi-year market development objectives
Reignite
Demand Design Implement
Conduct a review of the future MICE market and
develop a strategy to focus activities
Reignite
Demand Design Implement
Table 22: Actions for Recommendation 7
Accountabilities:
ACTION PRIMARY
ACCOUNTABILITY
Develop a global marketing strategy based on identified segmentation and market
priorities SAT
Understand unfolding ‘time to travel’ and openness constraints in source markets SAT
Conduct consumer research to develop more granular insight on Intrepid Traveller
preferences SAT
Reprioritise marketing investment, timing and targeting SAT
Refine existing Marketing Investment Framework (MIF) model to reflect precision focus
and multi-year market development objectives SAT
Conduct a review of the future MICE market and develop a strategy to focus activities SAT
Table 23: Accountabilities for Recommendation 7
MODELLING AND SIMULATION OF INTERVENTIONS
Phase 2 interventions are focused on boosting demand. While precise impacts can be subjective, it is
expected that refining the visa and immigration regime and bolstering tourism policing will act as
demand stimuli by reducing well-recognised barriers in the conversion funnel. Catalysing domestic
demand through marketing will also provide a boost to demand, initially through pent-up ‘Cabin Fever
Breakout. demand and outbound substitution. Lastly, a reinvigorated and precision-targeted global
marketing programme will drive inbound demand.
Page | 81
If these four interventions are executed, the sector could experience a R19 billion boost in output in
2020 against the post-COVID-19 base case and would also contribute to preserving more than 16,900
jobs. Estimated sub-sector impacts are summarised below:
• Travel Distribution & Intermediaries: Travel distribution and intermediaries will preserve R1
billion in output and 750 sub-sector jobs between 2020-2022.
• Transport & Related Services: Transport and related services will conserve R8,4 billion in output,
and some 6,900 jobs over the three-year period.
• Accommodation: Accommodation will avoid output losses of R2,9 billion boost and 2,800
associated jobs in the sub-sector will be saved between 2020 and 2022.
• Entertainment & Related Services: Entertainment and related services will have a R6,9 billion
boost in output, and 6,300 jobs in the sub-sector will be preserved from 2020-2022.
Page | 82
PHASE 3: GROWTH
INTERVENTIONS
(9-24 Months)
Page | 83
P H A S E 3 : G R O W T H I N T E R V E N T I O N S ( 9 - 2 4 M o n t h s )
PROPOSED INTERVENTIONS
8 Launch an investment and market-entry facilitation programme to stimulate capital
investment, sector transformation and product diversification
A key risk of the COVID-19 health crisis is that it can quickly become an infrastructure crisis if tourism
activity is constrained for too long. Global recovery benchmarks (see international interventions section)
indicate that tourism is typically resilient in the face of pandemics and is able to rebound strongly.
However, recovery from infrastructure crises, where tourism supply is significantly impaired, takes far
longer.
Recommendation 2: Deploy an enhanced Tourism Supply Support Package to protect tourism assets
and core infrastructure and support re-opening described the need for critical short-term intervention
to crowd-in financial resources that would preserve as much tourism supply as possible. While the
enhanced Tourism Support Package discussed in Recommendation 2 is the frontline response to
preventing an infrastructure shock, it is inevitable that businesses across the value chain will either not
re-open or will be forced to close during re-opening. This could create capacity constraints and impair
the diverse value proposition on which South Africa’s destination appeal is based.
Ultimately, the sector must work to attract investment through the recovery cycle in order to create
sufficient supply capacity, but also to support the product diversification and unserved market needs
that are likely to accompany renewed growth. This creates two related imperatives; the need to attract
capital investment into the sector, and the need to further transformation and inclusion objectives in
doing so. A supply shock of this nature can result in market concentration, where competition is reduced
in certain niches, market degradation, where existing supply cannot fully recover, and market failure,
where business closures result in the non-supply of products and services. Changing traveller preference
and behaviours will also create new opportunities that may not previously have existed.
A concerted focus on investment-led economic rejuvenation is therefore required and this should be
formalised under a collaborative investment promotion and market-entry facilitation programme.
Strategies should evaluate value chain weaknesses and seek to re-introduce competition, facilitate
revitalisation and encourage investment in unserved niches. Done right, this general approach can be
highly supportive of transformation, inclusion and diversification objectives if it is underpinned by a
focus on enhancing SMME visibility, mobilising multi-stakeholder collaboration, developing community
assets and transforming spatial and ownership patterns.
While the programme should avoid direct capital-raising, focus should specifically be placed on
attracting the significant pools of foreign private philanthropic funding that is directed at conservation
and SDG impact, as well as towards supporting low-barrier investment vehicles for domestic retail
investors. As with Recommendation 2, International DFIs may also have appetite to participate.
The feasibility of Tourism Development Zones (TDZ) and investment incentive packages for large tourism
investments must be investigated to support diversification of supply. These measures must address risk
factors in tourism development, which are generally viewed as high-risk by investors and become even
more so when new destination and new one-dimensional markets (eg leisure tourism) are involved.
Sun City and Cancun, Mexico are two examples of successful incentive-driven tourism investment. The
former was established on heavy tax write-offs and a casino license, while the government supported
the first nine hotels in the latter. Both now employ tens and hundreds of thousands of people
respectively and generate significant value for previously remote communities. By contrast, the absence
of such incentives is reflected in the lack of investment in coastal resort hotel projects north of Durban
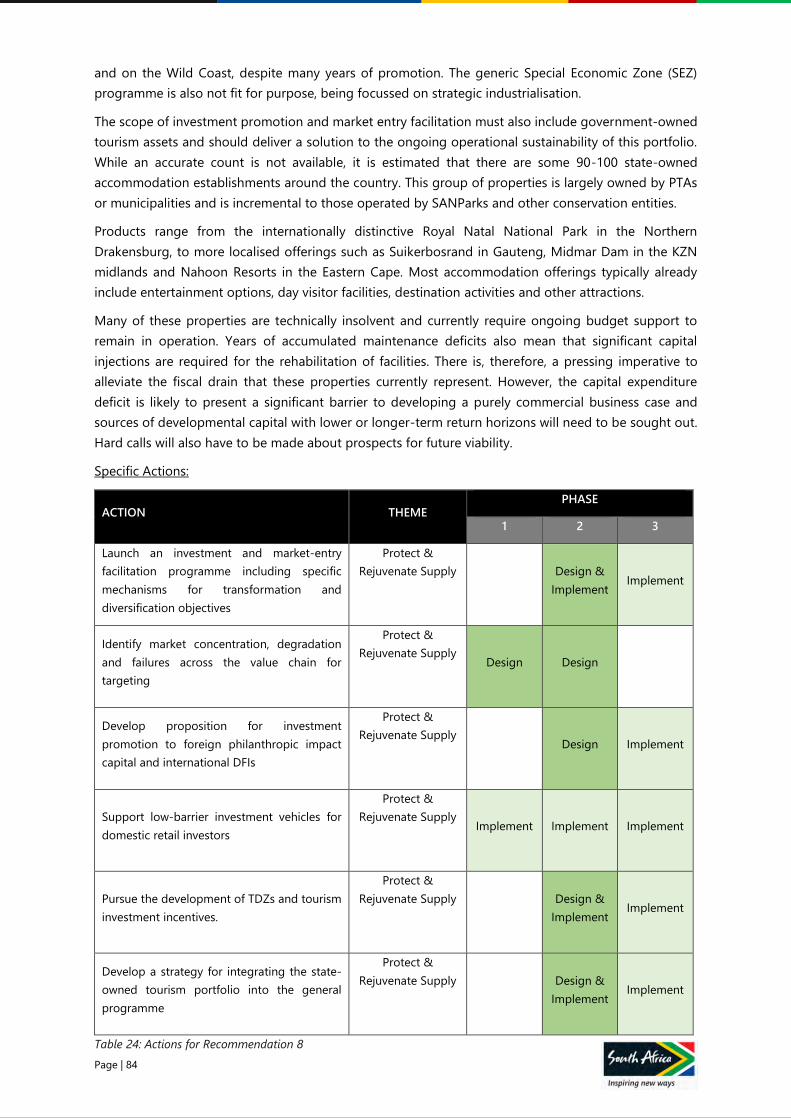
Page | 84
and on the Wild Coast, despite many years of promotion. The generic Special Economic Zone (SEZ)
programme is also not fit for purpose, being focussed on strategic industrialisation.
The scope of investment promotion and market entry facilitation must also include government-owned
tourism assets and should deliver a solution to the ongoing operational sustainability of this portfolio.
While an accurate count is not available, it is estimated that there are some 90-100 state-owned
accommodation establishments around the country. This group of properties is largely owned by PTAs
or municipalities and is incremental to those operated by SANParks and other conservation entities.
Products range from the internationally distinctive Royal Natal National Park in the Northern
Drakensburg, to more localised offerings such as Suikerbosrand in Gauteng, Midmar Dam in the KZN
midlands and Nahoon Resorts in the Eastern Cape. Most accommodation offerings typically already
include entertainment options, day visitor facilities, destination activities and other attractions.
Many of these properties are technically insolvent and currently require ongoing budget support to
remain in operation. Years of accumulated maintenance deficits also mean that significant capital
injections are required for the rehabilitation of facilities. There is, therefore, a pressing imperative to
alleviate the fiscal drain that these properties currently represent. However, the capital expenditure
deficit is likely to present a significant barrier to developing a purely commercial business case and
sources of developmental capital with lower or longer-term return horizons will need to be sought out.
Hard calls will also have to be made about prospects for future viability.
Specific Actions:
ACTION THEME PHASE
1 2 3
Launch an investment and market-entry
facilitation programme including specific
mechanisms for transformation and
diversification objectives
Protect &
Rejuvenate Supply
Design &
Implement Implement
Identify market concentration, degradation
and failures across the value chain for
targeting
Protect &
Rejuvenate Supply Design Design
Develop proposition for investment
promotion to foreign philanthropic impact
capital and international DFIs
Protect &
Rejuvenate Supply Design Implement
Support low-barrier investment vehicles for
domestic retail investors
Protect &
Rejuvenate Supply Implement Implement Implement
Pursue the development of TDZs and tourism
investment incentives.
Protect &
Rejuvenate Supply
Design &
Implement Implement
Develop a strategy for integrating the state-
owned tourism portfolio into the general
programme
Protect &
Rejuvenate Supply
Design &
Implement Implement
Table 24: Actions for Recommendation 8
Page | 85
Accountabilities:
ACTION PRIMARY ACCOUNTABILITY
Launch an investment and market-entry facilitation programme including
specific mechanisms for transformation and diversification objectives NDT and TBCSA
Identify market concentration, degradation and failures across the value chain
for targeting NDT and TBCSA
Develop proposition for investment promotion to foreign philanthropic impact
capital and international DFIs NDT / TBCSA
Support low-barrier investment vehicles for domestic retail investors NDT / TBCSA
Pursue the development tourism investment incentives to support
transformation as well as investment in Tourism Development Zones. NDT / TBCSA
Develop a strategy for effective commercial operation of state-owned tourism
portfolio
NDT and owning government
entities
Table 25: Accountabilities for Recommendation 8
9 Prioritise cooperation with neighbouring destinations towards a regional value
proposition and a seamless visitor experience
South Africa and its neighbours are seen as a highly desirable ‘bucket list’ destination in a number of
source markets. For many international travellers, the once in a lifetime trip to the region is enhanced by
the marquee experiences offered in Namibia, Botswana and Victoria Falls. This is particularly true for the
high-end leisure market which heavily leverages regional natural assets. A significant portion of overseas
arrivals in South Africa included onward visits to other countries. In 2018, this accounted for 22.8%
(608,422 pax) of overseas arrivals and was as high as 25,9% in 2015. In 2019, 52% of those visiting other
countries travelled to South Africa’s neighbouring states; Namibia, Botswana, Zimbabwe and
Mozambique.
In many cases, South Africa is also a critical transit hub on which these countries depend for arrivals.
Regional travel may also form an integral interim phase of recovery between domestic activity and full
international re-opening. Recognising this mutual interdependence and shared interest creates an
imperative to coordinate with neighbouring destinations on post-crisis recovery. A value-adding
regional value proposition and a seamless visitor experience is crucial, however, the extent of
coordination between destinations is currently limited.
The 2019 Travel and Tourism Competitiveness Index (TTCI) produced by the World Economic Forum
noted that, while Southern Africa as a region scores in the global top 20% for price-competitiveness and
natural resources, it generally scores below the global average, with the enabling environment and
infrastructure specifically deficient. Of additional concern is that the region falls in the bottom 20% for
health and hygiene and that this pillar has been on a downward trend in recent years. Urgent focus is
therefore needed to improve the situation.
Namibia and Botswana have effectively had no community transmissions and very few deaths due to
COVID-19. As of 28 May 2020, Namibia has had 22 confirmed cases and 0 deaths and is expected to
return to normal business on 30 June 2020. Botswana has had 35 confirmed cases and one death and
ended its 48-day lockdown on 20 May 2020, allowing all businesses and schools to reopen under strict
protocols. As of 28 May 2020, Zimbabwe has had 132 cases and 4 deaths but in the same week stated
Page | 86
that new infections were predominantly returning Zimbabweans. The country remains under lockdown.
While South Africa’s pandemic experience has been significantly more challenging, the World Health
Organisation has praised the country for its quick response to the pandemic. The region is thus well
placed to be viewed as a COVID-19-safe travel destination when travel restrictions are lifted. Globally
some regions are looking at creating safe travel zones (eg parts of Eastern Europe or the proposed Trans-
Tasman COVID-19-Safe Travel Zone between Australia and New Zealand), however, with community
transmission still high in South Africa but low in neighbouring countries, travel corridors and bubbles
remain unlikely until further into the recovery. Efficient restoration of travel links and cross-border
mobility will, however, be a key component of recovery.
Of initial importance is the need to standardise biosecurity protocols to enable traveller expectations to
be more easily managed and met across a number of destinations. Air access and generally enhanced
transport linkages will also be critical to support regional mobility. Thereafter, pre-existing constraints
on a frictionless regional visitor experience, such as consistent visa policy through univisas and
standardised biometric security protocols, should be prioritised for refinement. Lastly, collaborative value
proposition development and cooperative marketing partnerships can deliver significant efficiency and
effectiveness uplifts on the performance of collective financial resources (WEF, 2019; UNWTO, 2019).
Specific Actions:
ACTION THEME PHASE
1 2 3
Standardise biosecurity protocols to more
easily meet and manage traveller
expectations.
Strengthen
Enabling Capability
Design &
Implement Implement Implement
Pursue expanded air access and enhanced
transport linkages to support regional
mobility.
Strengthen
Enabling Capability Design Design Implement
Refine immigration policy to improve the
regional visitor experience.
Strengthen
Enabling Capability Design Implement
Collaborate on value proposition
development and cooperative marketing
partnerships.
Strengthen
Enabling Capability Design
Table 26: Actions for Recommendation 9
Accountabilities:
ACTION PRIMARY
ACCOUNTABILITY
Standardise biosecurity protocols to more easily meet and manage traveller
expectations
TBCSA, NDT and
Department of Health
Pursue expanded air access and enhanced transport linkages to support regional
mobility.
Department of
Transport, NDT and
SAT
Collaborate on value proposition development and cooperative inclusive marketing
partnerships SAT / TBCSA
Table 27: Accountabilities for Recommendation 9
Page | 87
10 Review and transform the tourism institutional architecture to deliver efficient,
effective and purpose-led support for sector growth and development
The recommendations of this tourism recovery plan imply the need for a broad and far reaching
transformation of the institutional structures that exist to support the sector. At a national level, NDT
remains the apex state authority for the sector with a renewed focus on cultivating and sustaining a deep
and comprehensive partnership with the private sector to achieve the objectives of the recovery plan.
Specific priorities will also include oversight of the enhanced Tourism Supply Support Package, the
continued pursuit of a conducive enabling environment (eg visa and immigration, safety and security),
sector investment and market-entry facilitation, regional destination cooperation and the review of
sector policy and legislation (eg Tourism Act No. 3 of 2014).
Government has also commenced with the process of repurposing and rationalising the country’s brand
entities. This will affect SAT and BrandSA. However, whatever the new formation, such will be position
to strengthen both the country’s overall brand and our ability to increase our share of global tourism
market and ensuring that the domestic tourism base is further strengthened. This will be part of the
institutional reform. Further, working modalities between national, provincial and local DMOs shall be
explored.
The rapid pace of innovation demands an ability to leverage an ever-changing pool of emerging
technologies. In this context, ongoing investments into data and technology will create a tourism data
hub that can adapt to evolving business requirements with technology-driven solutions. This enables a
continuous and reliable flow of business enhancing tools and solutions that will enable SA Tourism to
develop further points of differentiation. A range of opportunities exist in this regard, but upcoming
deployments in micro-influencer enablement, digital-led experiences, dynamic itinerary generation, real
time visitor surveys, affiliate marketing and online training all show significant promise. Key success
factor is strategic partnerships in the execution of the recovery plan.
Specific Actions:
ACTION THEME PHASE
1 2 3
Develop revised governance model and
institutional architecture for the sector (incl.
SAT and provincial/local tourism authorities.)
Strengthen
Enabling Capability Design Implement
Deploy data and technology industry utility
to enable greater collaboration and
intelligence sharing
Strengthen
Enabling Capability Implement Implement Implement
Redesign SAT in-market representation
model to drive efficiency and effectiveness
Strengthen
Enabling Capability Design Implement
Review and revise appropriate legislation to
reflect institutional reform objectives (eg
Tourism Act No. 3 of 2014).
Strengthen
Enabling Capability Design
Table 28: Actions for Recommendation 10
Accountabilities:
ACTION PRIMARY ACCOUNTABILITY
Page | 88
Develop revised governance model and institutional architecture for the sector
(incl. SAT and provincial/local tourism authorities.) NDT
Deploy data and technology industry utility to enable greater collaboration
and intelligence sharing SAT
Redesign SAT in-market representation model to drive efficiency and
effectiveness SAT
Table 29: Accountabilities for Recommendation 10
MODELLING AND SIMULATION OF INTERVENTIONS
Phase 3 interventions are focussed on ensuring sustainable long-term growth and development. This
achieved by; introduce an investment and market-entry programme to boost structural supply,
improving regional cooperation to boost structural demand and realising trailing benefits of the
domestic and inbound marketing programmes described in Phase 2. Refining the tourism institutional
architecture will not directly drive either supply or demand but will underwrite the successful execution
of this plan’s recommendations.
If these four interventions are executed, the sector could experience a R31,8 billion boost in output in
2020 against the post-COVID-19 base case and would also contribute to preserving more than 18,000
jobs. Estimated sub-sector impacts are summarised below:
• Travel Distribution & Intermediaries: Travel distribution and intermediaries will preserve R1,8
billion in output and 860 sub-sector jobs between 2020-2022.
• Transport & Related Services: Transport and related services will conserve R14,2 billion in output,
and some 7,800 jobs over the three-year period.
• Accommodation: Accommodation will avoid output losses of R5 billion boost and 3,100 jobs in
the sub-sector will be saved between 2020 and 2022.
• Entertainment & Related Services: Entertainment and related services will have a R10,7 billion
boost in output, and 6,200 jobs in the sub-sector will be preserved from 2020-2022.
For detailed output tables refer to the Appendix.
Page | 89
IMPACT AND INVESTMENT
Page | 90
I M P A C T A N D I N V E S T M E N T
IMPACT
As was discussed in the chapter on the impacts of COVID-19, the pre-pandemic expectation for industry
performance was for total internal tourism expenditure (inbound and domestic) in 2020 of R274 billion.
The outlook for tourism demand through to 2022 is highly uncertain since recent pre-crisis trajectories
are likely to be fundamentally reset. Forecasts based on historic performance are therefore of limited
value.
To produce a sound estimate of post-crisis demand that accounts for the effect of the pandemic shock,
a demand function was developed based on the work of Song et al., (2010) which describes approaches
to modelling tourism demand. The method uses economic variables, such as the economic growth of
visiting countries as well as relevant price and cross-price elasticities to ascertain the responsiveness of
demand variables to changes in consumer prices and income.
This approach yields estimates of base post-COVID-19 tourism demand in South Africa of R70,6 billion,
R133,5 billion and R222,5 billion in 2020, 2021 and 2022, respectively. The implication is an industry that
is just a quarter of its 2019 at the end of 2020, and one which will not have recovered to pre-crisis levels
by the end of 2022. The impact of softening demand and hard travel restrictions in terms of value already
lost between January and May is estimated at R54,2 billion. Before President Ramaphosa’s decision to
take the county down to Level 3 on 1 June, the forecasted revenue loss for the remainder of the year
was R149,7 billion, with as many as 438,000 jobs likely to be lost.
In combination, the interventions proposed in this recovery plan can preserve significant value and
employment in the tourism sector. These recommendations also provide the basis for stimulating
tourism supply and structurally increasing both domestic and inbound tourism demand.
The interventions proposed in Phase 1 (biosecurity protocols, enhanced Tourism Support Package, air
service development and industry/government recovery partnership) will bolster both short-term supply
and demand. Demand stimulus is achieved through the ability to re-open quicker and more
comprehensively than would otherwise be possible, while the ability of supply to meet demand is
protected through actions that preserve value chain capacity. It is estimated that the combined impact
of Phase 1 interventions is a R9,7 billion boost in output in 2020 which also has substantial positive
trailing effects into 2021 and 2022, adding a further R128,5 billion. This would help to preserve more
than 91,000 jobs through the three-year period.
Phase 2 proposes a series of demand-side interventions; igniting domestic demand, high-impact global
marketing and the reduction of barriers to travel. Demand stimulus is achieved primarily by capturing
domestic substitution tourism opportunities, deploying a high-precision global campaign focussed on
a rationalised set of markets and by making improvements to enduring barriers such as crime and visa
policy. It is estimated that the combined impact of Phase 2 interventions is an incremental R19 billion
increase in output across 2020 to 2022 which would help to preserve a further 16,900 jobs.
Phase 3 interventions are designed to support structural growth opportunities and include supply-side
measures to attract capital into the sector and accelerate transformation objectives, as well as demand-
side interventions to strengthen the regional tourism value proposition and visitor experience.
Refinements to the institutions supporting the sector are also proposed. It is estimated that the
combined impact of Phase 3 interventions is a further R31,8 billion increase in output and 18,000 jobs
saved through the period. These simulations are summarised in the tables below.
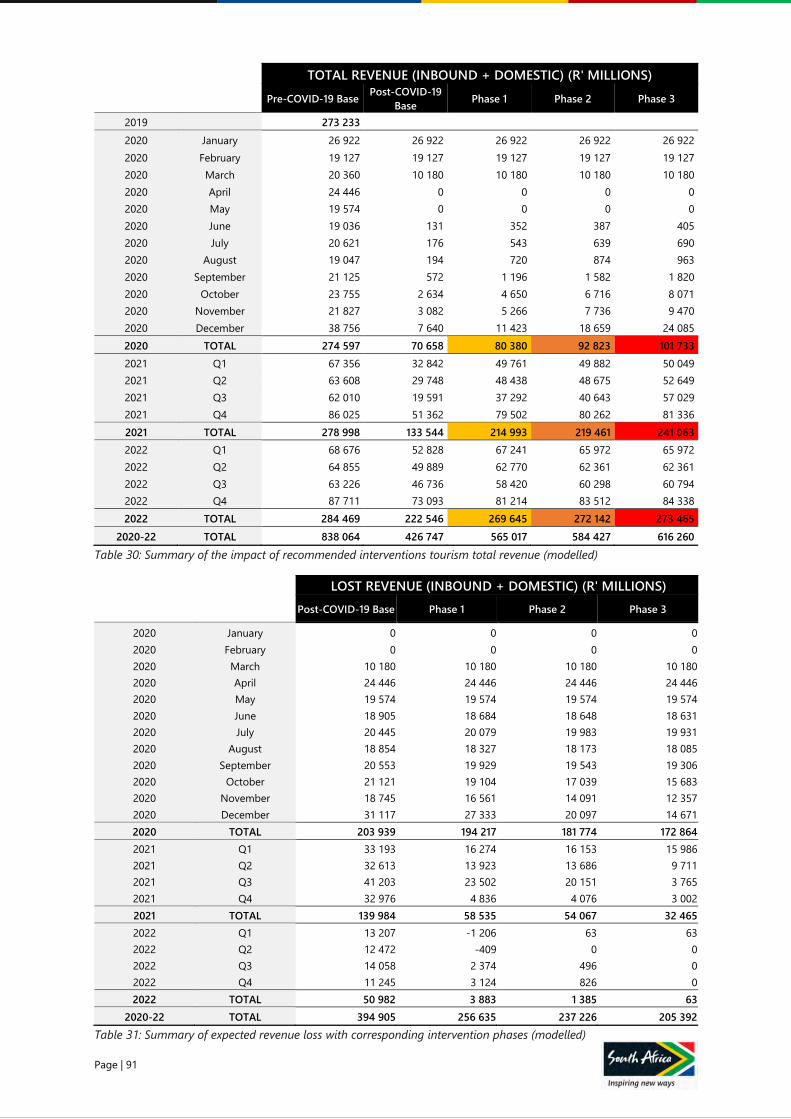
Page | 91
TOTAL REVENUE (INBOUND + DOMESTIC) (R' MILLIONS)
Pre-COVID-19 Base Post-COVID-19
Base Phase 1 Phase 2 Phase 3 2019 273 233 2020 January 26 922 26 922 26 922 26 922 26 922 2020 February 19 127 19 127 19 127 19 127 19 127 2020 March 20 360 10 180 10 180 10 180 10 180 2020 April 24 446 0 0 0 0 2020 May 19 574 0 0 0 0 2020 June 19 036 131 352 387 405 2020 July 20 621 176 543 639 690 2020 August 19 047 194 720 874 963 2020 September 21 125 572 1 196 1 582 1 820 2020 October 23 755 2 634 4 650 6 716 8 071 2020 November 21 827 3 082 5 266 7 736 9 470 2020 December 38 756 7 640 11 423 18 659 24 085 2020 TOTAL 274 597 70 658 80 380 92 823 101 733 2021 Q1 67 356 32 842 49 761 49 882 50 049 2021 Q2 63 608 29 748 48 438 48 675 52 649 2021 Q3 62 010 19 591 37 292 40 643 57 029 2021 Q4 86 025 51 362 79 502 80 262 81 336 2021 TOTAL 278 998 133 544 214 993 219 461 241 063 2022 Q1 68 676 52 828 67 241 65 972 65 972 2022 Q2 64 855 49 889 62 770 62 361 62 361 2022 Q3 63 226 46 736 58 420 60 298 60 794 2022 Q4 87 711 73 093 81 214 83 512 84 338 2022 TOTAL 284 469 222 546 269 645 272 142 273 465
2020-22 TOTAL 838 064 426 747 565 017 584 427 616 260 Table 30: Summary of the impact of recommended interventions tourism total revenue (modelled)
LOST REVENUE (INBOUND + DOMESTIC) (R' MILLIONS)
Post-COVID-19 Base Phase 1 Phase 2 Phase 3
2020 January 0 0 0 0 2020 February 0 0 0 0 2020 March 10 180 10 180 10 180 10 180 2020 April 24 446 24 446 24 446 24 446 2020 May 19 574 19 574 19 574 19 574 2020 June 18 905 18 684 18 648 18 631 2020 July 20 445 20 079 19 983 19 931 2020 August 18 854 18 327 18 173 18 085 2020 September 20 553 19 929 19 543 19 306 2020 October 21 121 19 104 17 039 15 683 2020 November 18 745 16 561 14 091 12 357 2020 December 31 117 27 333 20 097 14 671 2020 TOTAL 203 939 194 217 181 774 172 864 2021 Q1 33 193 16 274 16 153 15 986 2021 Q2 32 613 13 923 13 686 9 711 2021 Q3 41 203 23 502 20 151 3 765 2021 Q4 32 976 4 836 4 076 3 002 2021 TOTAL 139 984 58 535 54 067 32 465 2022 Q1 13 207 -1 206 63 63 2022 Q2 12 472 -409 0 0 2022 Q3 14 058 2 374 496 0 2022 Q4 11 245 3 124 826 0 2022 TOTAL 50 982 3 883 1 385 63
2020-22 TOTAL 394 905 256 635 237 226 205 392 Table 31: Summary of expected revenue loss with corresponding intervention phases (modelled)
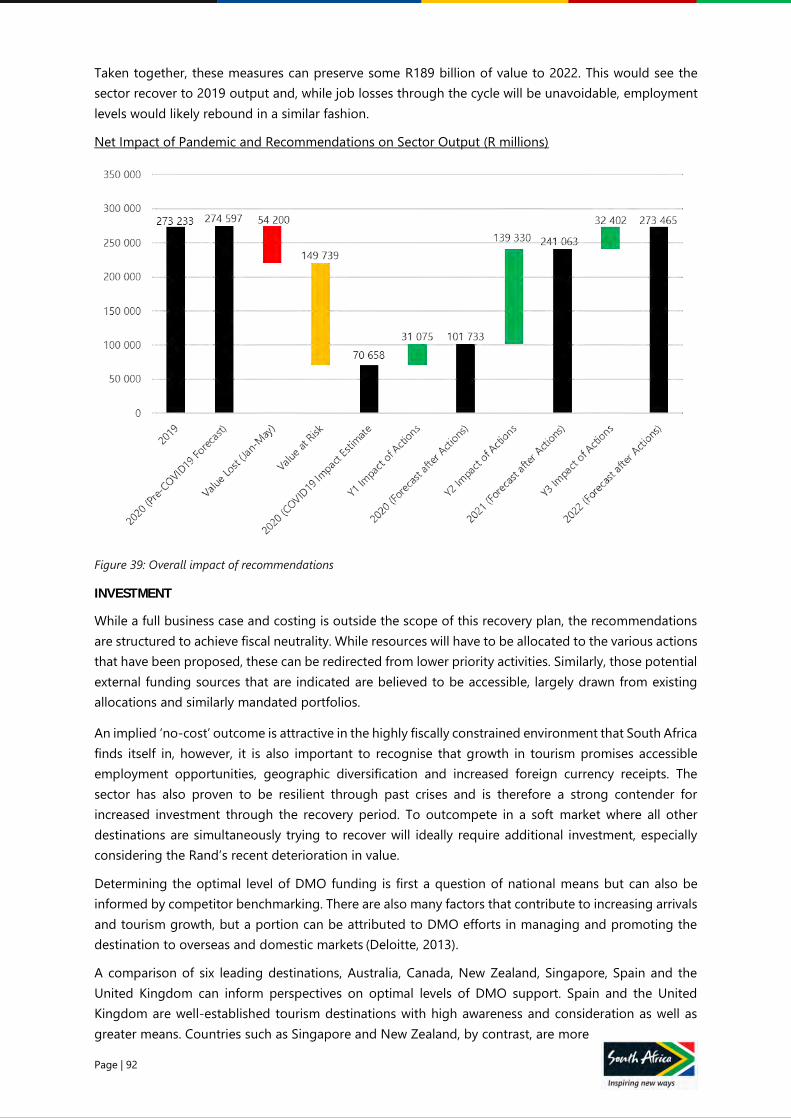
Page | 92
Taken together, these measures can preserve some R189 billion of value to 2022. This would see the
sector recover to 2019 output and, while job losses through the cycle will be unavoidable, employment
levels would likely rebound in a similar fashion.
Net Impact of Pandemic and Recommendations on Sector Output (R millions)
Figure 39: Overall impact of recommendations
INVESTMENT
While a full business case and costing is outside the scope of this recovery plan, the recommendations
are structured to achieve fiscal neutrality. While resources will have to be allocated to the various actions
that have been proposed, these can be redirected from lower priority activities. Similarly, those potential
external funding sources that are indicated are believed to be accessible, largely drawn from existing
allocations and similarly mandated portfolios.
An implied ‘no-cost’ outcome is attractive in the highly fiscally constrained environment that South Africa
finds itself in, however, it is also important to recognise that growth in tourism promises accessible
employment opportunities, geographic diversification and increased foreign currency receipts. The
sector has also proven to be resilient through past crises and is therefore a strong contender for
increased investment through the recovery period. To outcompete in a soft market where all other
destinations are simultaneously trying to recover will ideally require additional investment, especially
considering the Rand’s recent deterioration in value.
Determining the optimal level of DMO funding is first a question of national means but can also be
informed by competitor benchmarking. There are also many factors that contribute to increasing arrivals
and tourism growth, but a portion can be attributed to DMO efforts in managing and promoting the
destination to overseas and domestic markets (Deloitte, 2013).
A comparison of six leading destinations, Australia, Canada, New Zealand, Singapore, Spain and the
United Kingdom can inform perspectives on optimal levels of DMO support. Spain and the United
Kingdom are well-established tourism destinations with high awareness and consideration as well as
greater means. Countries such as Singapore and New Zealand, by contrast, are more
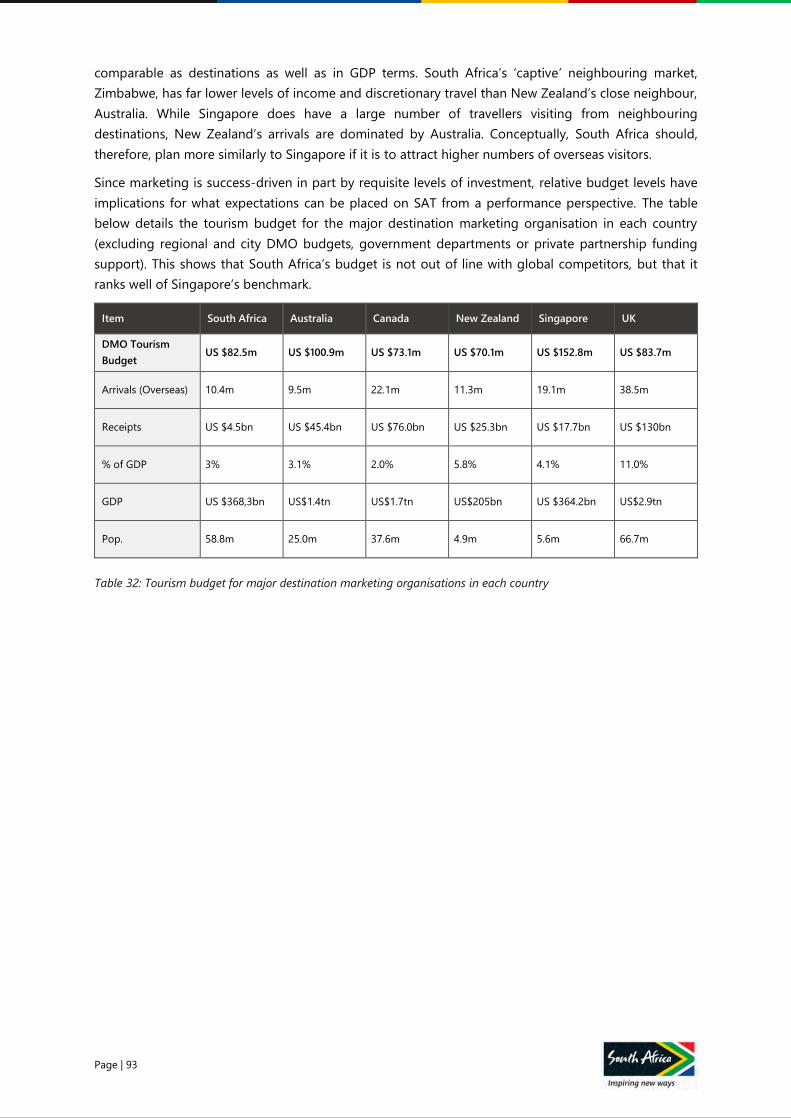
Page | 93
comparable as destinations as well as in GDP terms. South Africa’s ‘captive’ neighbouring market,
Zimbabwe, has far lower levels of income and discretionary travel than New Zealand’s close neighbour,
Australia. While Singapore does have a large number of travellers visiting from neighbouring
destinations, New Zealand’s arrivals are dominated by Australia. Conceptually, South Africa should,
therefore, plan more similarly to Singapore if it is to attract higher numbers of overseas visitors.
Since marketing is success-driven in part by requisite levels of investment, relative budget levels have
implications for what expectations can be placed on SAT from a performance perspective. The table
below details the tourism budget for the major destination marketing organisation in each country
(excluding regional and city DMO budgets, government departments or private partnership funding
support). This shows that South Africa’s budget is not out of line with global competitors, but that it
ranks well of Singapore’s benchmark.
Item South Africa Australia Canada New Zealand Singapore UK
DMO Tourism
Budget US $82.5m US $100.9m US $73.1m US $70.1m US $152.8m US $83.7m
Arrivals (Overseas) 10.4m 9.5m 22.1m 11.3m 19.1m 38.5m
Receipts US $4.5bn US $45.4bn US $76.0bn US $25.3bn US $17.7bn US $130bn
% of GDP 3% 3.1% 2.0% 5.8% 4.1% 11.0%
GDP US $368,3bn US$1.4tn US$1.7tn US$205bn US $364.2bn US$2.9tn
Pop. 58.8m 25.0m 37.6m 4.9m 5.6m 66.7m
Table 32: Tourism budget for major destination marketing organisations in each country

Page | 94
CONCLUSION
Page | 95
C O N C L U S I O N
The socio-economic costs of the pandemic will be a visible scar on the world and South Africa for years
to come. As a sector that facilitates mobility and human interaction, tourism has been amongst the
hardest hit. Tourism revival in South Africa is critical, not just because of the jobs and businesses that it
supports, but because, in its interconnectedness, its resilience and its ability to rebound quickly, tourism
can be a catalyst for a broader economic recovery.
However, the COVID-19 pandemic is global in nature and tourism in South Africa will need to recover
while many others are simultaneously attempting to do so. The industry is hyper-competitive and
international travellers have a wide range of choice. Outperforming the competitor set will require clear
strategic planning and coordinated execution. It is hoped that the recommendations contained in this
recovery plan provide the clarity and impetus for such action. By considering both supply and demand
side factors and the enabling environment that supports the sector, measures can be taken to protect
supply, reignite demand and build enabling capability.
Above all, success will require trust. This plan and the gains made in the Risk Adjusted Strategy thus far
are the result of a deep and intensive collaboration that has spanned government and the private sector.
For this plan, four consultative workstreams, at least ten webinars, five national surveys, hundreds of
external sources, thousands of respondents and further thousands of submissions are the raw artefacts
of a process that has galvanized the industry. This experience has reinforced the mutual interdependence
of a diverse range of stakeholders. It is now important to capitalise on this momentum.
South Africa is one of a small group of truly aspirational destinations on earth. To many travel consumers,
the country is a dream experience, combining powerful social justice history, breath-taking natural
beauty, and warm, welcoming people. South Africa can therefore aspire to a tourism economy that drives
growth and fosters development. To capture the opportunity requires an urgent response to the current
crisis, but also a recognition of the structural factors that have acted as a drag on tourism growth. The
tourism sector’s potential far exceeds previous levels and while the crisis has been catastrophic, long-
term growth potential is undiminished.
Page | 96
GLOSSARY OF TERMS
AND REFERENCES
Page | 97
G L O S S A R Y O F T E R M S
ACRONYM TERM
AASA Airlines Association of Southern Africa
BIS Bank for International Settlements
COVID-19 Coronavirus disease for 2019
DFI Development Finance Institution
DMC Destination Management Company
DMO Destination Management Organisation
DMO Destination Marketing Organisation
DOH Department of Health
FIT Fully Independent Tourist
G20 Group of 20: an international forum for the governments and central bank
governors from 19 countries and the European Union
GDP Gross Domestic Product
ILO International Labour Organisation
IMF International Monetary Fund
IMR In-Market Representation
LSI Lockdown Stringency Index
LTA Long-term Agreement
MERS Middle East Respiratory Syndrome
MIF Market Investment Framework
NDT National Department of Tourism
OTA Online Travel Agency
PATA Paediatric-Adolescent Treatment Africa
PR Public Relations
PTA Preferential Trade Agreement
ROI Return on Investment
SAA South African Airways
SAM South African COVID-19 Modelling Consortium
SARS Severe Acute Respiratory Syndrome
SARS-COV-2 Severe Acute Respiratory Syndrome Coronavirus 2
SAT South African Tourism
SDG Sustainable Development Goals
SMME Small, Medium and Micro Enterprise
SSA Statistics South Africa
TBCSA Tourism Business Council of South Africa
TDZ Tourism Development Zone
TOMSA Tourism Marketing South Africa
TRF Tourism Relief Fund
TSA Tourism Satellite Account
T&T Travel and Tourism
UIF TERS Unemployment Insurance Fund Temporary Employee/Employer Relief Scheme
UNWTO United Nations World Tourism Organisation
UNCTAD United Nations Conference on Trade and Development
USD US Dollar
VFR Visiting Friends & Relatives
WESGRO Cape Town & Western Cape Tourism, Trade & Investment
WTO World Trade Organisation
WTTC World Travel & Tourism Council
Page | 98
R E F E R E N C E S
African Wild Life Foundation. (2018). South Africa Facts. Retrieved from African Wild Life Foundation:
https://www.awf.org/country/south-africa
AU. (2019). Africa Visa Openness Report 2019. African Union. Retrieved from
https://www.visaopenness.org/fileadmin/uploads/afdb/Documents/visa-openness-2019.pdf
B-BBEE Commission. (2019). National Status and Trends on Broad Based Black Economic Empowerment
Report. B-BBEE Commission.
BIS. (2020). BIS Bulletin, Effects of COVID-19 on the Banking Sector: The Markets Assessment, No. 12. Bank
for International Settlements.
Blavatnik School of Government - University of Oxford. (2020, May 25). CORONAVIRUS GOVERNMENT
RESPONSE TRACKER. Retrieved from Blavatnik School of Government - University of Oxford:
https://www.bsg.ox.ac.uk/research/research-projects/coronavirus-government-response-
tracker
Deloitte. (2013). Increase in tourism to Canada boosts exports. Retrieved from Deloitte’:
https://www2.deloitte.com/ca/en/pages/international-business/articles/increase-in-tourism-
to-canada-boosts-exports.html
Deloitte. (2020). How to reduce the pandemic impact on employees: A guide for company leaders.
Retrieved from Deloitte: https://www2.deloitte.com/ua/en/pages/human-
capital/articles/impact-of-covid-19.html
Department of Tourism. (2020). Minister Mmamoloko Kubayi-Ngubane: Coronavirus COVID-19 alert level
3 tourism sector measures and directions. Department of Tourism.
Engagious. (2020). Back-To-Normal Barometer Briefing #2- April 28. Back-To-Normal Barometer Briefing
#2- April 28 (p. Webinar). Engagious.
Euromonitor. (2020). The Impact of Coronavirus on Travel and Tourism. Euromonitor International.
Fortune. (2020). Fortune. Retrieved from Will the airlines survive the coronavirus? Yes—and here’s how.
Forwardkeys. (2020). Booking Situation for Future Arrivals. Forwardkeys.
Google Trends. (2020, May). Google Trends. Retrieved from Booking Sites Comparison:
https://trends.google.com/trends/explore?date=today%203-
m&geo=ZA&q=%2Fm%2F09py1r,%2Fm%2F0svqyn7,%2Fm%2F0yxzc1z,%2Fm%2F025ypk,%2F
m%2F02kwzwt
IATA. (2019). Worldwide Slot Guidelines. Geneva: International Air Transport Association.
ILO. (2020). A policy framework for tackling the economic and social impact of the COVID-19 crisis.
International Labour Organisation.
International Energy Agency. (2020, April). IEA. Retrieved from Global Energy Review 2020: The impacts
of the Covid-19 crisis on global energy demand and CO2 emissions:
https://www.iea.org/reports/global-energy-review-2020/global-energy-and-co2-emissions-in-
2020
Martin, O., Naaman, J., & Klassen, G. (2020). Rebuilding South African Air Access Where Now For Airlift?
Twenty31.
Page | 99
McKinsey & Co. (2020). COVID-19: Implications for business. Retrieved from McKinsey & Company:
https://www.mckinsey.com/business-functions/risk/our-insights/covid-19-implications-for-
business
McKinsey & Co. (2020, May 12). McKinsey & Company. Retrieved from Consumer sentiment evolves as
the next “normal” approaches: https://www.mckinsey.com/business-functions/marketing-and-
sales/our-insights/a-global-view-of-how-consumer-behavior-is-changing-amid-covid-19
McKinsey & Company. (2020, April 1). Featured Insights. Retrieved from Tackling COVID-19 in Africa:
https://www.mckinsey.com/featured-insights/middle-east-and-africa/tackling-covid-19-in-
africa
National Treasury. (2020). Briefing by National Treasury on Financial Implications of COVID-19 on Both
the Economy and Budget. National Treasury.
NDT. (2020). COVID 19 IMPACT ON TOURISM, THE RISK ADJUSTED STRATEGY AND RECOVERY PLAN.
NDT.
OAG. (2019). OAG Traffic Analyser Report. OAG & Twenty31.
Our World In Data. (2020). Coronavirus Pandemic (COVID-19) – the data. Retrieved from Our World In
Data: https://ourworldindata.org/coronavirus-data
Song, H., Li, G., Witt, S., & Fei, B. (2010). Tourism demand modelling and forecasting: how should demand
be measured? Tourism Economics, 63-81.
South African Reserve Bank. (2020). Financial Stability Review. South African Reserve Bank.
South African Tourism. (2018). Annual Tourist Arrivals and Spend. Johannesburg: Strategy, Insights, and
Analytics - South African Tourism.
South African Tourism. (2019). ANNUAL REPORT 2018/2019. Johannesburg: South African Tourism.
South African Tourism. (2019). Global Market Report. Johannesburg: Strategy, Insights, and Analytics -
South African Tourism.
South African Tourism. (2020). Interview & Correspondence on Booking Patterns with SAT Insights
Expert. Johannesburg.
Statistics South Africa. (2019). Mid-year population estimates 2019. Statistics South Africa.
Statistics South Africa. (2019). Tourism Satellite Account for South Africa, final 2016 and provisional 2017
and 2018. Johannesburg: Statistics South Africa.
Statistics South Africa. (2020). Business impact survey of the COVID-19 pandemic in South Africa. Pretoria:
Statistics South Africa.
Statistics South Africa. (2020). The Quarterly Labour Force Survey. Statistics South Africa.
TBCSA & NDT. (2020, May). Tourism Recovery Survey. Tourism Recovery Survey. TBCSA & NDT.
TBCSA. (2020). Tourism Survival Survey. TBCSA.
The World Bank. (2020). The World Bank. Retrieved from World Bank Open Data:
https://data.worldbank.org/
Tourism Economics. (2020, March 1). Tourism Economics. Retrieved from Economist Perspectives:
https://www.tourismeconomics.com/about/economist-review/
Page | 100
Trip Advisor. (2020). Part I and Part II of Preparing for What's Next - Trip Advisor Webinars. Part I and
Part II of Preparing for What's Next - Trip Advisor Webinars. Trip Advisor.
UNTWO. (2020). UNWTO World Tourism Barometer May 2020 Special focus on the Impact of COVID-19.
UNTWO.
UNWTO. (2019). 2019 Visa Openness Report for Africa. UNWTO. Retrieved from https://www.e-
unwto.org/doi/pdf/10.18111/9789284421039
UNWTO. (2020). SUPPORTING JOBS AND ECONOMIES THROUGH TRAVEL & TOURISM. UNWTO.
UNWTO. (2020, May 11). WORLD TOURISM REMAINS AT A STANDSTILL AS 100% OF COUNTRIES IMPOSE
RESTRICTIONS ON TRAVEL. Retrieved from UNWTO: https://www.unwto.org/news/covid-19-
world-tourism-remains-at-a-standstill-as-100-of-countries-impose-restrictions-on-travel
WEF. (2019). Travel and Tourism Competitiveness Report 2019. World Economic Forum. Retrieved from
http://www3.weforum.org/docs/WEF_TTCR_2019.pdf
WHO. (2020, April). World Health Organisation. Retrieved from WHO Timeline - COVID-19:
https://www.who.int/news-room/detail/27-04-2020-who-timeline---covid-19
World Bank. (2020, April 20). World Bank Blogs. Retrieved from The impact of COVID-19 (Coronavirus)
on global poverty: Why Sub-Saharan Africa might be the region hardest hit:
https://blogs.worldbank.org/opendata/impact-covid-19-coronavirus-global-poverty-why-sub-
saharan-africa-might-be-region-hardest

Page | 101

Page | 102
APPENDIX: Tourism Demand
Modelling
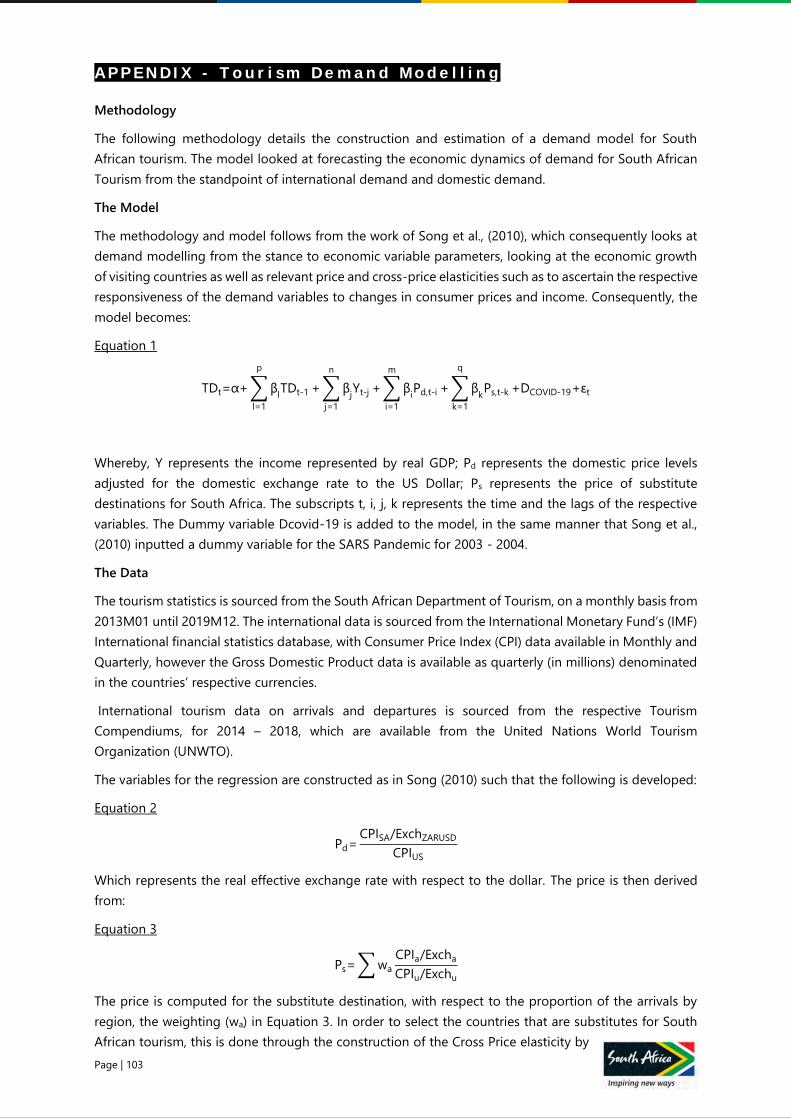
Page | 103
A P P E N D I X - T o u r i s m D e m a n d M o d e l l i n g
Methodology
The following methodology details the construction and estimation of a demand model for South
African tourism. The model looked at forecasting the economic dynamics of demand for South African
Tourism from the standpoint of international demand and domestic demand.
The Model
The methodology and model follows from the work of Song et al., (2010), which consequently looks at
demand modelling from the stance to economic variable parameters, looking at the economic growth
of visiting countries as well as relevant price and cross-price elasticities such as to ascertain the respective
responsiveness of the demand variables to changes in consumer prices and income. Consequently, the
model becomes:
Equation 1
TDt=α+∑ βlTDt-1
p
l=1
+∑ βjYt-j
n
j=1
+∑ βiPd,t-i
m
i=1
+∑ βkPs,t-k
q
k=1
+DCOVID-19+εt
Whereby, Y represents the income represented by real GDP; Pd represents the domestic price levels
adjusted for the domestic exchange rate to the US Dollar; Ps represents the price of substitute
destinations for South Africa. The subscripts t, i, j, k represents the time and the lags of the respective
variables. The Dummy variable Dcovid-19 is added to the model, in the same manner that Song et al.,
(2010) inputted a dummy variable for the SARS Pandemic for 2003 - 2004.
The Data
The tourism statistics is sourced from the South African Department of Tourism, on a monthly basis from
2013M01 until 2019M12. The international data is sourced from the International Monetary Fund’s (IMF)
International financial statistics database, with Consumer Price Index (CPI) data available in Monthly and
Quarterly, however the Gross Domestic Product data is available as quarterly (in millions) denominated
in the countries’ respective currencies.
International tourism data on arrivals and departures is sourced from the respective Tourism
Compendiums, for 2014 – 2018, which are available from the United Nations World Tourism
Organization (UNWTO).
The variables for the regression are constructed as in Song (2010) such that the following is developed:
Equation 2
Pd=CPISA/ExchZARUSD
CPIUS
Which represents the real effective exchange rate with respect to the dollar. The price is then derived
from:
Equation 3
Ps=∑wa
CPIa/Excha
CPIu/Exchu
The price is computed for the substitute destination, with respect to the proportion of the arrivals by
region, the weighting (wa) in Equation 3. In order to select the countries that are substitutes for South
African tourism, this is done through the construction of the Cross Price elasticity by
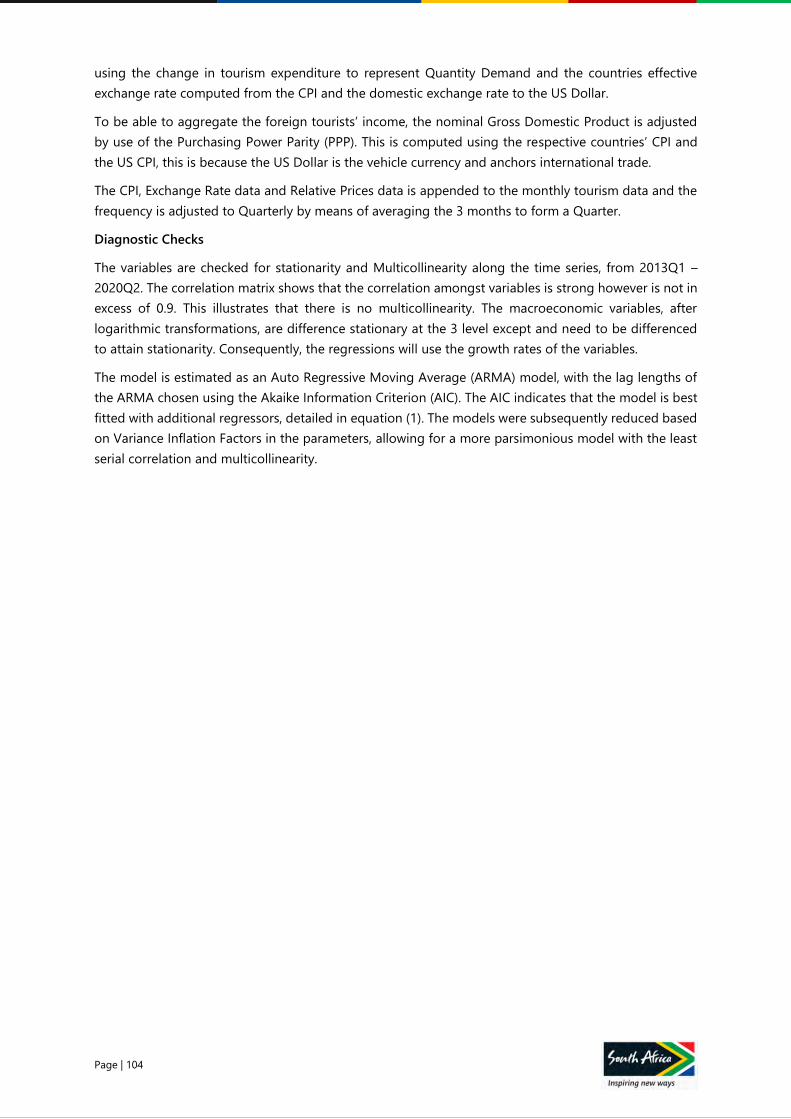
Page | 104
using the change in tourism expenditure to represent Quantity Demand and the countries effective
exchange rate computed from the CPI and the domestic exchange rate to the US Dollar.
To be able to aggregate the foreign tourists’ income, the nominal Gross Domestic Product is adjusted
by use of the Purchasing Power Parity (PPP). This is computed using the respective countries’ CPI and
the US CPI, this is because the US Dollar is the vehicle currency and anchors international trade.
The CPI, Exchange Rate data and Relative Prices data is appended to the monthly tourism data and the
frequency is adjusted to Quarterly by means of averaging the 3 months to form a Quarter.
Diagnostic Checks
The variables are checked for stationarity and Multicollinearity along the time series, from 2013Q1 –
2020Q2. The correlation matrix shows that the correlation amongst variables is strong however is not in
excess of 0.9. This illustrates that there is no multicollinearity. The macroeconomic variables, after
logarithmic transformations, are difference stationary at the 3 level except and need to be differenced
to attain stationarity. Consequently, the regressions will use the growth rates of the variables.
The model is estimated as an Auto Regressive Moving Average (ARMA) model, with the lag lengths of
the ARMA chosen using the Akaike Information Criterion (AIC). The AIC indicates that the model is best
fitted with additional regressors, detailed in equation (1). The models were subsequently reduced based
on Variance Inflation Factors in the parameters, allowing for a more parsimonious model with the least
serial correlation and multicollinearity.
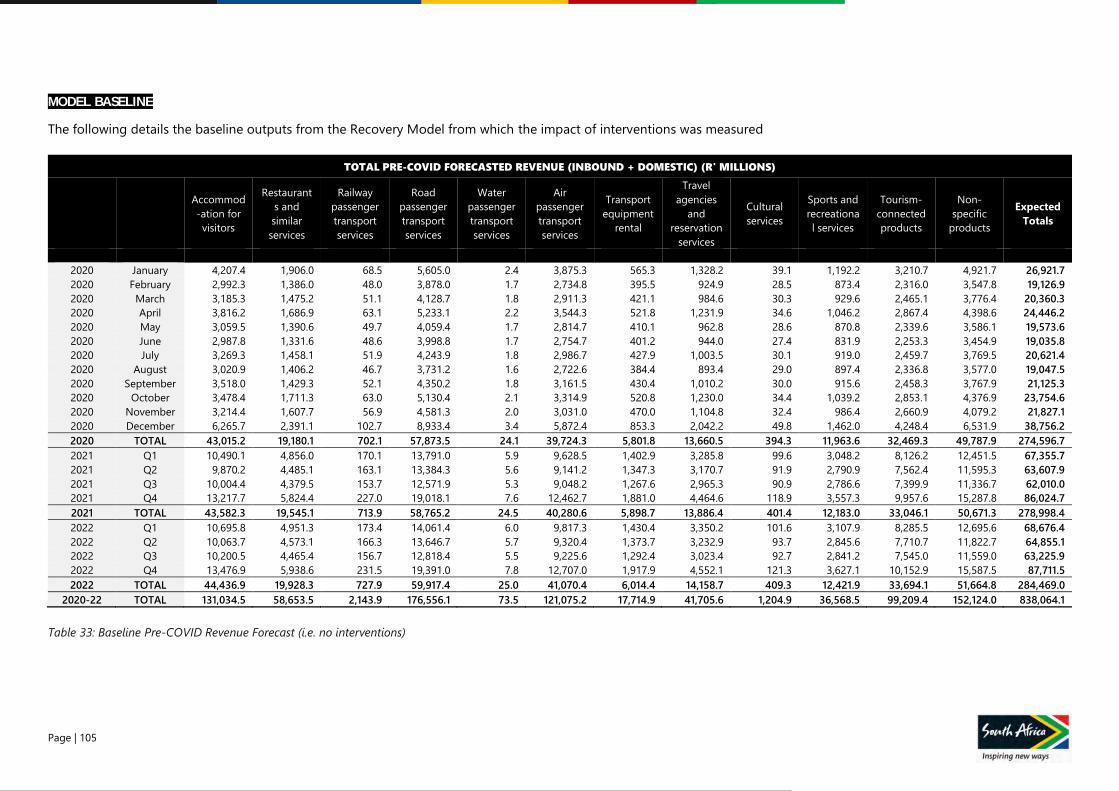
Page | 105
MODEL BASELINE
The following details the baseline outputs from the Recovery Model from which the impact of interventions was measured
TOTAL PRE-COVID FORECASTED REVENUE (INBOUND + DOMESTIC) (R' MILLIONS)
Accommod
-ation for
visitors
Restaurant
s and
similar
services
Railway
passenger
transport
services
Road
passenger
transport
services
Water
passenger
transport
services
Air
passenger
transport
services
Transport
equipment
rental
Travel
agencies
and
reservation
services
Cultural
services
Sports and
recreationa
l services
Tourism-
connected
products
Non-
specific
products
Expected
Totals
2020 January 4,207.4 1,906.0 68.5 5,605.0 2.4 3,875.3 565.3 1,328.2 39.1 1,192.2 3,210.7 4,921.7 26,921.7
2020 February 2,992.3 1,386.0 48.0 3,878.0 1.7 2,734.8 395.5 924.9 28.5 873.4 2,316.0 3,547.8 19,126.9
2020 March 3,185.3 1,475.2 51.1 4,128.7 1.8 2,911.3 421.1 984.6 30.3 929.6 2,465.1 3,776.4 20,360.3
2020 April 3,816.2 1,686.9 63.1 5,233.1 2.2 3,544.3 521.8 1,231.9 34.6 1,046.2 2,867.4 4,398.6 24,446.2
2020 May 3,059.5 1,390.6 49.7 4,059.4 1.7 2,814.7 410.1 962.8 28.6 870.8 2,339.6 3,586.1 19,573.6
2020 June 2,987.8 1,331.6 48.6 3,998.8 1.7 2,754.7 401.2 944.0 27.4 831.9 2,253.3 3,454.9 19,035.8
2020 July 3,269.3 1,458.1 51.9 4,243.9 1.8 2,986.7 427.9 1,003.5 30.1 919.0 2,459.7 3,769.5 20,621.4
2020 August 3,020.9 1,406.2 46.7 3,731.2 1.6 2,722.6 384.4 893.4 29.0 897.4 2,336.8 3,577.0 19,047.5
2020 September 3,518.0 1,429.3 52.1 4,350.2 1.8 3,161.5 430.4 1,010.2 30.0 915.6 2,458.3 3,767.9 21,125.3
2020 October 3,478.4 1,711.3 63.0 5,130.4 2.1 3,314.9 520.8 1,230.0 34.4 1,039.2 2,853.1 4,376.9 23,754.6
2020 November 3,214.4 1,607.7 56.9 4,581.3 2.0 3,031.0 470.0 1,104.8 32.4 986.4 2,660.9 4,079.2 21,827.1
2020 December 6,265.7 2,391.1 102.7 8,933.4 3.4 5,872.4 853.3 2,042.2 49.8 1,462.0 4,248.4 6,531.9 38,756.2
2020 TOTAL 43,015.2 19,180.1 702.1 57,873.5 24.1 39,724.3 5,801.8 13,660.5 394.3 11,963.6 32,469.3 49,787.9 274,596.7
2021 Q1 10,490.1 4,856.0 170.1 13,791.0 5.9 9,628.5 1,402.9 3,285.8 99.6 3,048.2 8,126.2 12,451.5 67,355.7
2021 Q2 9,870.2 4,485.1 163.1 13,384.3 5.6 9,141.2 1,347.3 3,170.7 91.9 2,790.9 7,562.4 11,595.3 63,607.9
2021 Q3 10,004.4 4,379.5 153.7 12,571.9 5.3 9,048.2 1,267.6 2,965.3 90.9 2,786.6 7,399.9 11,336.7 62,010.0
2021 Q4 13,217.7 5,824.4 227.0 19,018.1 7.6 12,462.7 1,881.0 4,464.6 118.9 3,557.3 9,957.6 15,287.8 86,024.7
2021 TOTAL 43,582.3 19,545.1 713.9 58,765.2 24.5 40,280.6 5,898.7 13,886.4 401.4 12,183.0 33,046.1 50,671.3 278,998.4
2022 Q1 10,695.8 4,951.3 173.4 14,061.4 6.0 9,817.3 1,430.4 3,350.2 101.6 3,107.9 8,285.5 12,695.6 68,676.4
2022 Q2 10,063.7 4,573.1 166.3 13,646.7 5.7 9,320.4 1,373.7 3,232.9 93.7 2,845.6 7,710.7 11,822.7 64,855.1
2022 Q3 10,200.5 4,465.4 156.7 12,818.4 5.5 9,225.6 1,292.4 3,023.4 92.7 2,841.2 7,545.0 11,559.0 63,225.9
2022 Q4 13,476.9 5,938.6 231.5 19,391.0 7.8 12,707.0 1,917.9 4,552.1 121.3 3,627.1 10,152.9 15,587.5 87,711.5
2022 TOTAL 44,436.9 19,928.3 727.9 59,917.4 25.0 41,070.4 6,014.4 14,158.7 409.3 12,421.9 33,694.1 51,664.8 284,469.0
2020-22 TOTAL 131,034.5 58,653.5 2,143.9 176,556.1 73.5 121,075.2 17,714.9 41,705.6 1,204.9 36,568.5 99,209.4 152,124.0 838,064.1
Table 33: Baseline Pre-COVID Revenue Forecast (i.e. no interventions)

Page | 106
TOTAL POST-COVID FORECASTED REVENUE (INBOUND + DOMESTIC) (R' MILLIONS)
Accommod
-ation for
visitors
Restaurant
s and
similar
services
Railway
passenger
transport
services
Road
passenger
transport
services
Water
passenger
transport
services
Air
passenger
transport
services
Transport
equipment
rental
Travel
agencies
and
reservation
services
Cultural
services
Sports and
recreationa
l services
Tourism-
connected
products
Non-
specific
products
Expected
Totals
2020 January 4,207.4 1,906.0 68.5 5,605.0 2.4 3,875.3 565.3 1,328.2 39.1 1,192.2 3,210.7 4,921.7 26,921.7
2020 February 2,992.3 1,386.0 48.0 3,878.0 1.7 2,734.8 395.5 924.9 28.5 873.4 2,316.0 3,547.8 19,126.9
2020 March 1,592.6 737.6 25.5 2,064.3 0.9 1,455.6 210.5 492.3 15.2 464.8 1,232.6 1,888.2 10,180.2
2020 April 0.0 0.0 0.0 0.0 0.0 0.0 0.0 0.0 0.0 0.0 0.0 0.0 0.0
2020 May 0.0 0.0 0.0 0.0 0.0 0.0 0.0 0.0 0.0 0.0 0.0 0.0 0.0
2020 June 0.0 0.0 0.0 103.6 0.0 0.0 9.3 0.0 0.0 0.0 7.1 10.9 131.0
2020 July 0.0 0.0 0.0 134.7 0.0 0.0 12.6 0.0 0.0 0.0 11.4 17.5 176.2
2020 August 0.0 0.0 0.0 141.8 0.0 0.0 13.9 0.0 0.0 0.0 14.9 22.9 193.5
2020 September 64.2 27.5 1.2 207.5 0.0 69.2 19.6 19.5 0.6 17.2 57.5 88.3 572.4
2020 October 277.1 153.2 7.0 858.5 0.2 345.8 82.6 114.3 3.0 86.5 277.5 427.7 2,633.5
2020 November 374.4 195.8 8.6 865.2 0.3 428.6 83.8 151.7 3.9 111.7 337.9 520.5 3,082.4
2020 December 1,237.3 444.2 20.7 1,844.1 0.7 1,175.1 172.9 417.0 9.3 266.4 807.9 1,244.2 7,639.7
2020 TOTAL 10,745.3 4,850.3 179.4 15,702.9 6.1 10,084.5 1,566.1 3,447.9 99.5 3,012.3 8,273.4 12,689.8 70,657.5
2021 Q1 5,073.6 2,035.9 90.0 7,820.2 2.9 4,883.3 748.9 1,800.5 41.6 1,209.6 3,598.4 5,537.4 32,842.2
2021 Q2 4,582.1 1,852.7 81.5 7,072.3 2.7 4,413.0 678.3 1,630.3 37.8 1,100.5 3,268.0 5,028.7 29,748.1
2021 Q3 3,155.4 1,440.6 47.5 3,798.8 1.7 2,821.7 390.8 906.8 29.9 925.9 2,399.7 3,672.6 19,591.5
2021 Q4 7,852.1 3,253.5 140.5 12,108.7 4.6 7,563.9 1,168.2 2,803.3 66.3 1,935.3 5,699.1 8,766.7 51,362.1
2021 TOTAL 20,663.2 8,582.7 359.5 30,800.0 11.9 19,682.0 2,986.3 7,140.9 175.6 5,171.4 14,965.2 23,005.4 133,543.9
2022 Q1 8,227.5 3,808.7 133.4 10,816.5 4.6 7,551.7 1,100.3 2,577.1 78.1 2,390.7 6,373.5 9,765.9 52,828.0
2022 Q2 7,741.3 3,517.8 127.9 10,497.5 4.4 7,169.6 1,056.7 2,486.8 72.1 2,188.9 5,931.3 9,094.4 49,888.6
2022 Q3 7,544.9 3,250.9 116.8 9,626.9 4.0 6,851.9 963.8 2,261.2 67.5 2,060.4 5,523.1 8,464.7 46,736.2
2022 Q4 11,216.2 4,866.8 194.7 16,435.2 6.5 10,634.2 1,614.8 3,843.9 99.3 2,953.5 8,370.5 12,857.3 73,092.8
2022 TOTAL 34,729.9 15,444.1 572.8 47,376.1 19.6 32,207.4 4,735.6 11,169.0 317.1 9,593.5 26,198.3 40,182.2 222,545.6
2020-22 TOTAL 66,138.4 28,877.1 1,111.7 93,878.9 37.6 61,973.9 9,288.0 21,757.8 592.3 17,777.1 49,437.0 75,877.4 426,747.0
Table 34: Baseline Post-COVID Revenue Forecast (i.e. no interventions)
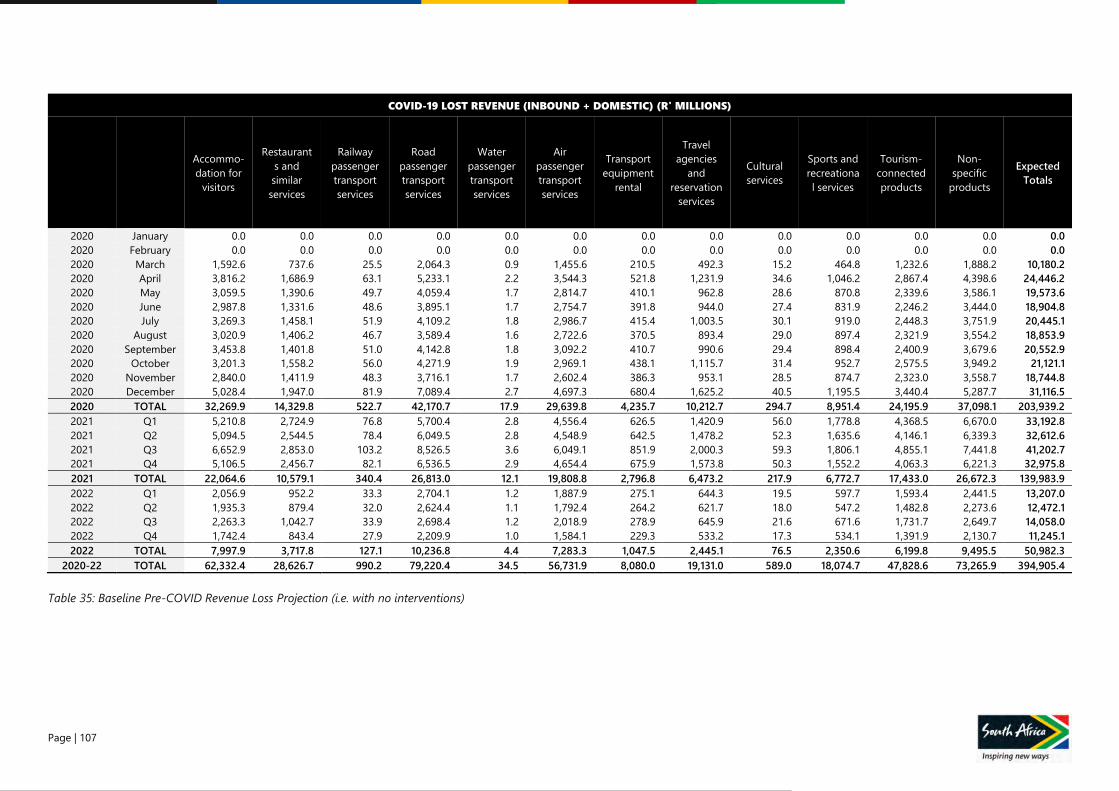
Page | 107
COVID-19 LOST REVENUE (INBOUND + DOMESTIC) (R' MILLIONS)
Accommo-
dation for
visitors
Restaurant
s and
similar
services
Railway
passenger
transport
services
Road
passenger
transport
services
Water
passenger
transport
services
Air
passenger
transport
services
Transport
equipment
rental
Travel
agencies
and
reservation
services
Cultural
services
Sports and
recreationa
l services
Tourism-
connected
products
Non-
specific
products
Expected
Totals
2020 January 0.0 0.0 0.0 0.0 0.0 0.0 0.0 0.0 0.0 0.0 0.0 0.0 0.0
2020 February 0.0 0.0 0.0 0.0 0.0 0.0 0.0 0.0 0.0 0.0 0.0 0.0 0.0
2020 March 1,592.6 737.6 25.5 2,064.3 0.9 1,455.6 210.5 492.3 15.2 464.8 1,232.6 1,888.2 10,180.2
2020 April 3,816.2 1,686.9 63.1 5,233.1 2.2 3,544.3 521.8 1,231.9 34.6 1,046.2 2,867.4 4,398.6 24,446.2
2020 May 3,059.5 1,390.6 49.7 4,059.4 1.7 2,814.7 410.1 962.8 28.6 870.8 2,339.6 3,586.1 19,573.6
2020 June 2,987.8 1,331.6 48.6 3,895.1 1.7 2,754.7 391.8 944.0 27.4 831.9 2,246.2 3,444.0 18,904.8
2020 July 3,269.3 1,458.1 51.9 4,109.2 1.8 2,986.7 415.4 1,003.5 30.1 919.0 2,448.3 3,751.9 20,445.1
2020 August 3,020.9 1,406.2 46.7 3,589.4 1.6 2,722.6 370.5 893.4 29.0 897.4 2,321.9 3,554.2 18,853.9
2020 September 3,453.8 1,401.8 51.0 4,142.8 1.8 3,092.2 410.7 990.6 29.4 898.4 2,400.9 3,679.6 20,552.9
2020 October 3,201.3 1,558.2 56.0 4,271.9 1.9 2,969.1 438.1 1,115.7 31.4 952.7 2,575.5 3,949.2 21,121.1
2020 November 2,840.0 1,411.9 48.3 3,716.1 1.7 2,602.4 386.3 953.1 28.5 874.7 2,323.0 3,558.7 18,744.8
2020 December 5,028.4 1,947.0 81.9 7,089.4 2.7 4,697.3 680.4 1,625.2 40.5 1,195.5 3,440.4 5,287.7 31,116.5
2020 TOTAL 32,269.9 14,329.8 522.7 42,170.7 17.9 29,639.8 4,235.7 10,212.7 294.7 8,951.4 24,195.9 37,098.1 203,939.2
2021 Q1 5,210.8 2,724.9 76.8 5,700.4 2.8 4,556.4 626.5 1,420.9 56.0 1,778.8 4,368.5 6,670.0 33,192.8
2021 Q2 5,094.5 2,544.5 78.4 6,049.5 2.8 4,548.9 642.5 1,478.2 52.3 1,635.6 4,146.1 6,339.3 32,612.6
2021 Q3 6,652.9 2,853.0 103.2 8,526.5 3.6 6,049.1 851.9 2,000.3 59.3 1,806.1 4,855.1 7,441.8 41,202.7
2021 Q4 5,106.5 2,456.7 82.1 6,536.5 2.9 4,654.4 675.9 1,573.8 50.3 1,552.2 4,063.3 6,221.3 32,975.8
2021 TOTAL 22,064.6 10,579.1 340.4 26,813.0 12.1 19,808.8 2,796.8 6,473.2 217.9 6,772.7 17,433.0 26,672.3 139,983.9
2022 Q1 2,056.9 952.2 33.3 2,704.1 1.2 1,887.9 275.1 644.3 19.5 597.7 1,593.4 2,441.5 13,207.0
2022 Q2 1,935.3 879.4 32.0 2,624.4 1.1 1,792.4 264.2 621.7 18.0 547.2 1,482.8 2,273.6 12,472.1
2022 Q3 2,263.3 1,042.7 33.9 2,698.4 1.2 2,018.9 278.9 645.9 21.6 671.6 1,731.7 2,649.7 14,058.0
2022 Q4 1,742.4 843.4 27.9 2,209.9 1.0 1,584.1 229.3 533.2 17.3 534.1 1,391.9 2,130.7 11,245.1
2022 TOTAL 7,997.9 3,717.8 127.1 10,236.8 4.4 7,283.3 1,047.5 2,445.1 76.5 2,350.6 6,199.8 9,495.5 50,982.3
2020-22 TOTAL 62,332.4 28,626.7 990.2 79,220.4 34.5 56,731.9 8,080.0 19,131.0 589.0 18,074.7 47,828.6 73,265.9 394,905.4
Table 35: Baseline Pre-COVID Revenue Loss Projection (i.e. with no interventions)

Page | 108
PHASE 1 INTERVENTION IMPACT
TOTAL POST-COVID FORECASTED REVENUE (INBOUND + DOMESTIC) (R' MILLIONS)
Accommo-
dation for
visitors
Restaurant
s and
similar
services
Railway
passenger
transport
services
Road
passenger
transport
services
Water
passenger
transport
services
Air
passenger
transport
services
Transport
equipment
rental
Travel
agencies
and
reservation
services
Cultural
services
Sports and
recreationa
l services
Tourism-
connected
products
Non-
specific
products
Expected
Totals
2020 January 4,207.4 1,906.0 68.5 5,605.0 2.4 3,875.3 565.3 1,328.2 39.1 1,192.2 3,210.7 4,921.7 26,921.7
2020 February 2,992.3 1,386.0 48.0 3,878.0 1.7 2,734.8 395.5 924.9 28.5 873.4 2,316.0 3,547.8 19,126.9
2020 March 1,592.6 737.6 25.5 2,064.3 0.9 1,455.6 210.5 492.3 15.2 464.8 1,232.6 1,888.2 10,180.2
2020 April 0.0 0.0 0.0 0.0 0.0 0.0 0.0 0.0 0.0 0.0 0.0 0.0 0.0
2020 May 0.0 0.0 0.0 0.0 0.0 0.0 0.0 0.0 0.0 0.0 0.0 0.0 0.0
2020 June 33.2 0.0 0.9 178.7 0.0 47.1 16.1 13.2 0.0 0.0 24.8 38.4 352.3
2020 July 65.2 0.0 1.4 238.2 0.0 78.5 22.3 23.1 0.0 0.0 44.8 69.1 542.6
2020 August 87.3 27.5 1.8 241.0 0.1 100.9 23.7 28.1 0.6 17.0 75.8 116.3 720.1
2020 September 189.7 67.8 2.9 310.3 0.1 172.6 29.4 57.8 1.4 42.4 126.9 195.0 1,196.3
2020 October 641.3 293.8 12.5 1,209.3 0.4 632.9 118.2 252.5 5.9 170.2 517.3 796.1 4,650.5
2020 November 757.1 367.1 13.8 1,211.1 0.5 719.4 121.9 273.8 7.4 221.0 620.6 952.7 5,266.4
2020 December 1,791.0 703.5 28.6 2,773.8 1.0 1,643.2 267.5 573.9 14.6 433.8 1,258.5 1,933.6 11,422.9
2020 TOTAL 12,357.1 5,489.4 203.9 17,709.7 7.0 11,460.3 1,770.4 3,967.7 112.6 3,414.8 9,428.0 14,458.8 80,379.7
2021 Q1 7,889.1 3,001.1 133.7 11,538.6 4.5 7,358.3 1,126.4 2,685.5 61.5 1,821.4 5,575.1 8,565.8 49,760.9
2021 Q2 7,525.8 3,259.2 126.0 10,806.3 4.2 6,955.8 1,064.3 2,528.4 66.7 1,991.4 5,564.8 8,544.9 48,437.8
2021 Q3 6,008.0 2,976.8 85.3 6,577.9 3.1 5,162.2 708.8 1,614.6 61.6 1,948.3 4,805.3 7,339.9 37,291.9
2021 Q4 12,227.7 5,264.3 210.7 18,079.8 7.0 11,480.0 1,770.6 4,220.8 107.4 3,184.2 9,048.0 13,901.5 79,502.0
2021 TOTAL 33,650.6 14,501.4 555.7 47,002.5 18.8 30,956.2 4,670.0 11,049.3 297.2 8,945.3 24,993.3 38,352.1 214,992.6
2022 Q1 10,486.2 4,883.9 168.6 13,676.6 5.9 9,564.6 1,395.7 3,264.5 100.2 3,072.1 8,144.8 12,477.7 67,240.8
2022 Q2 9,741.6 4,436.8 160.7 13,172.1 5.5 9,014.7 1,327.4 3,122.4 90.9 2,763.1 7,474.6 11,459.9 62,769.9
2022 Q3 9,431.2 4,063.6 146.0 12,033.7 5.0 8,564.9 1,204.8 2,826.5 84.4 2,575.5 6,903.8 10,580.9 58,420.2
2022 Q4 12,462.4 5,407.5 216.3 18,261.4 7.2 11,815.8 1,794.2 4,270.9 110.4 3,281.6 9,300.6 14,285.9 81,214.3
2022 TOTAL 42,121.4 18,791.9 691.6 57,143.8 23.7 38,959.9 5,722.0 13,484.5 385.9 11,692.4 31,823.8 48,804.4 269,645.1
2020-22 TOTAL 88,129.0 38,782.7 1,451.2 121,856.0 49.5 81,376.4 12,162.5 28,501.5 795.7 24,052.5 66,245.0 101,615.3 565,017.4
Table 36: COVID Revenue Forecast Results with Phase 1 Interventions
Page | 109
COVID-19 LOST REVENUE (INBOUND + DOMESTIC) (R' MILLIONS)
Accommo-
dation for
visitors
Restaurant
s and
similar
services
Railway
passenger
transport
services
Road
passenger
transport
services
Water
passenger
transport
services
Air
passenger
transport
services
Transport
equipment
rental
Travel
agencies
and
reservation
services
Cultural
services
Sports and
recreationa
l services
Tourism-
connected
products
Non-
specific
products
Expected
Totals
2020 January 0.0 0.0 0.0 0.0 0.0 0.0 0.0 0.0 0.0 0.0 0.0 0.0 0.0
2020 February 0.0 0.0 0.0 0.0 0.0 0.0 0.0 0.0 0.0 0.0 0.0 0.0 0.0
2020 March 1,592.6 737.6 25.5 2,064.3 0.9 1,455.6 210.5 492.3 15.2 464.8 1,232.6 1,888.2 10,180.2
2020 April 3,816.2 1,686.9 63.1 5,233.1 2.2 3,544.3 521.8 1,231.9 34.6 1,046.2 2,867.4 4,398.6 24,446.2
2020 May 3,059.5 1,390.6 49.7 4,059.4 1.7 2,814.7 410.1 962.8 28.6 870.8 2,339.6 3,586.1 19,573.6
2020 June 2,954.6 1,331.6 47.7 3,820.1 1.6 2,707.7 385.1 930.8 27.4 831.9 2,228.5 3,416.6 18,683.5
2020 July 3,204.2 1,458.1 50.4 4,005.8 1.7 2,908.2 405.7 980.4 30.1 919.0 2,414.8 3,700.4 20,078.8
2020 August 2,933.6 1,378.7 44.9 3,490.2 1.6 2,621.7 360.7 865.4 28.5 880.4 2,261.0 3,460.7 18,327.4
2020 September 3,328.3 1,361.5 49.3 4,040.0 1.7 2,988.9 401.0 952.4 28.6 873.2 2,331.4 3,572.9 19,929.1
2020 October 2,837.1 1,417.5 50.4 3,921.1 1.7 2,682.0 402.6 977.5 28.6 869.0 2,335.8 3,580.9 19,104.1
2020 November 2,457.4 1,240.6 43.1 3,370.2 1.5 2,311.6 348.1 830.9 25.0 765.5 2,040.3 3,126.5 16,560.8
2020 December 4,474.7 1,687.6 74.1 6,159.6 2.4 4,229.3 585.8 1,468.3 35.1 1,028.2 2,989.8 4,598.3 27,333.3
2020 TOTAL 30,658.1 13,690.7 498.3 40,163.9 17.1 28,264.0 4,031.4 9,692.8 281.6 8,548.8 23,041.3 35,329.1 194,217.0
2021 Q1 2,395.3 1,759.7 33.0 1,982.0 1.3 2,081.4 248.9 535.9 36.2 1,167.0 2,391.8 3,641.6 16,274.1
2021 Q2 2,150.9 1,138.0 33.9 2,315.6 1.3 2,006.2 256.6 580.1 23.4 744.7 1,849.3 2,823.0 13,922.9
2021 Q3 3,800.2 1,316.8 65.4 5,747.5 2.1 3,708.6 534.0 1,292.5 27.5 783.7 2,449.5 3,774.5 23,502.3
2021 Q4 730.8 445.9 11.9 565.4 0.5 738.3 73.5 156.3 9.2 303.4 714.3 1,086.5 4,836.0
2021 TOTAL 9,077.2 4,660.4 144.2 10,610.4 5.2 8,534.5 1,113.0 2,564.8 96.3 2,998.8 7,404.8 11,325.6 58,535.3
2022 Q1 -201.8 -123.1 -1.9 -156.1 -0.1 -124.9 -20.3 -43.1 -2.5 -83.7 -177.9 -270.4 -1,205.7
2022 Q2 -65.0 -39.7 -0.8 -50.3 0.0 -52.7 -6.5 -13.9 -0.8 -27.0 -60.5 -92.0 -409.2
2022 Q3 377.0 230.0 4.7 291.7 0.2 305.9 37.9 80.6 4.7 156.5 351.0 533.6 2,374.0
2022 Q4 496.1 302.7 6.2 383.8 0.3 402.5 49.9 106.1 6.2 205.9 461.8 702.1 3,123.7
2022 TOTAL 606.4 370.0 8.3 469.1 0.3 530.8 61.0 129.7 7.6 251.7 574.4 873.3 3,882.7
2020-22 TOTAL 40,341.8 18,721.0 650.7 51,243.4 22.6 37,329.3 5,205.4 12,387.2 385.6 11,799.4 31,020.5 47,528.0 256,635.0
Table 37: COVID Revenue Loss Projection with Phase 1 Interventions implemented
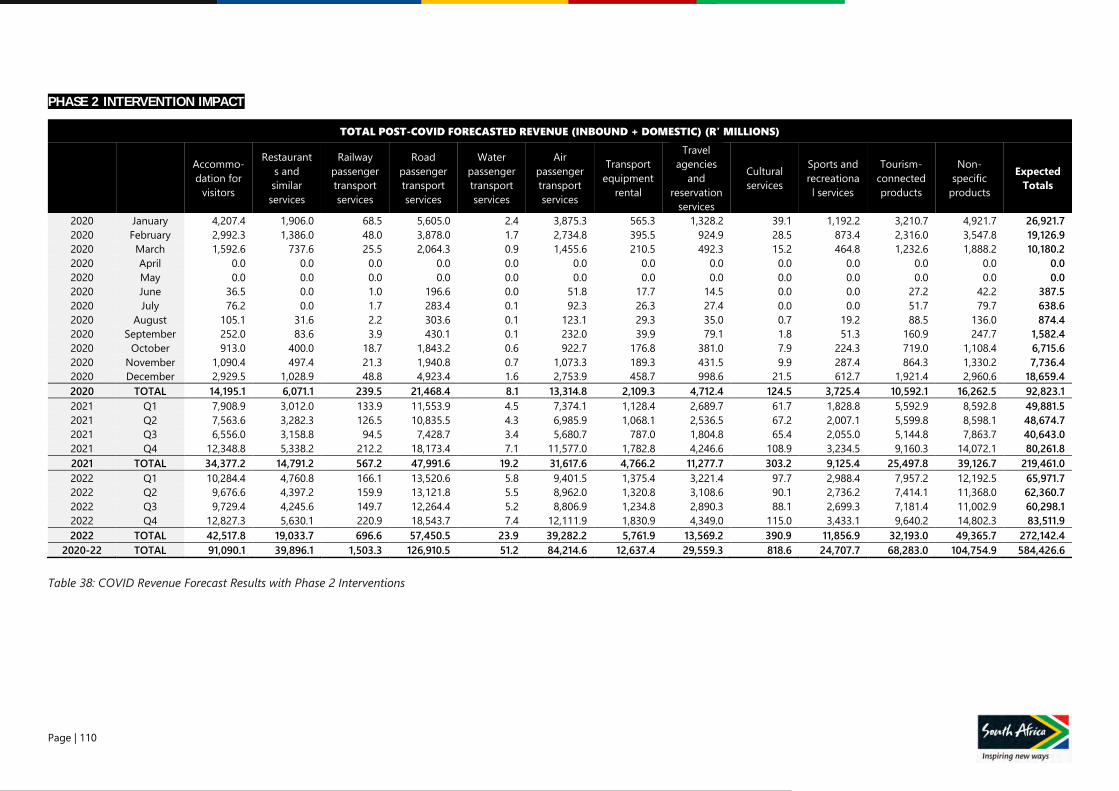
Page | 110
PHASE 2 INTERVENTION IMPACT
TOTAL POST-COVID FORECASTED REVENUE (INBOUND + DOMESTIC) (R' MILLIONS)
Accommo-
dation for
visitors
Restaurant
s and
similar
services
Railway
passenger
transport
services
Road
passenger
transport
services
Water
passenger
transport
services
Air
passenger
transport
services
Transport
equipment
rental
Travel
agencies
and
reservation
services
Cultural
services
Sports and
recreationa
l services
Tourism-
connected
products
Non-
specific
products
Expected
Totals
2020 January 4,207.4 1,906.0 68.5 5,605.0 2.4 3,875.3 565.3 1,328.2 39.1 1,192.2 3,210.7 4,921.7 26,921.7
2020 February 2,992.3 1,386.0 48.0 3,878.0 1.7 2,734.8 395.5 924.9 28.5 873.4 2,316.0 3,547.8 19,126.9
2020 March 1,592.6 737.6 25.5 2,064.3 0.9 1,455.6 210.5 492.3 15.2 464.8 1,232.6 1,888.2 10,180.2
2020 April 0.0 0.0 0.0 0.0 0.0 0.0 0.0 0.0 0.0 0.0 0.0 0.0 0.0
2020 May 0.0 0.0 0.0 0.0 0.0 0.0 0.0 0.0 0.0 0.0 0.0 0.0 0.0
2020 June 36.5 0.0 1.0 196.6 0.0 51.8 17.7 14.5 0.0 0.0 27.2 42.2 387.5
2020 July 76.2 0.0 1.7 283.4 0.1 92.3 26.3 27.4 0.0 0.0 51.7 79.7 638.6
2020 August 105.1 31.6 2.2 303.6 0.1 123.1 29.3 35.0 0.7 19.2 88.5 136.0 874.4
2020 September 252.0 83.6 3.9 430.1 0.1 232.0 39.9 79.1 1.8 51.3 160.9 247.7 1,582.4
2020 October 913.0 400.0 18.7 1,843.2 0.6 922.7 176.8 381.0 7.9 224.3 719.0 1,108.4 6,715.6
2020 November 1,090.4 497.4 21.3 1,940.8 0.7 1,073.3 189.3 431.5 9.9 287.4 864.3 1,330.2 7,736.4
2020 December 2,929.5 1,028.9 48.8 4,923.4 1.6 2,753.9 458.7 998.6 21.5 612.7 1,921.4 2,960.6 18,659.4
2020 TOTAL 14,195.1 6,071.1 239.5 21,468.4 8.1 13,314.8 2,109.3 4,712.4 124.5 3,725.4 10,592.1 16,262.5 92,823.1
2021 Q1 7,908.9 3,012.0 133.9 11,553.9 4.5 7,374.1 1,128.4 2,689.7 61.7 1,828.8 5,592.9 8,592.8 49,881.5
2021 Q2 7,563.6 3,282.3 126.5 10,835.5 4.3 6,985.9 1,068.1 2,536.5 67.2 2,007.1 5,599.8 8,598.1 48,674.7
2021 Q3 6,556.0 3,158.8 94.5 7,428.7 3.4 5,680.7 787.0 1,804.8 65.4 2,055.0 5,144.8 7,863.7 40,643.0
2021 Q4 12,348.8 5,338.2 212.2 18,173.4 7.1 11,577.0 1,782.8 4,246.6 108.9 3,234.5 9,160.3 14,072.1 80,261.8
2021 TOTAL 34,377.2 14,791.2 567.2 47,991.6 19.2 31,617.6 4,766.2 11,277.7 303.2 9,125.4 25,497.8 39,126.7 219,461.0
2022 Q1 10,284.4 4,760.8 166.1 13,520.6 5.8 9,401.5 1,375.4 3,221.4 97.7 2,988.4 7,957.2 12,192.5 65,971.7
2022 Q2 9,676.6 4,397.2 159.9 13,121.8 5.5 8,962.0 1,320.8 3,108.6 90.1 2,736.2 7,414.1 11,368.0 62,360.7
2022 Q3 9,729.4 4,245.6 149.7 12,264.4 5.2 8,806.9 1,234.8 2,890.3 88.1 2,699.3 7,181.4 11,002.9 60,298.1
2022 Q4 12,827.3 5,630.1 220.9 18,543.7 7.4 12,111.9 1,830.9 4,349.0 115.0 3,433.1 9,640.2 14,802.3 83,511.9
2022 TOTAL 42,517.8 19,033.7 696.6 57,450.5 23.9 39,282.2 5,761.9 13,569.2 390.9 11,856.9 32,193.0 49,365.7 272,142.4
2020-22 TOTAL 91,090.1 39,896.1 1,503.3 126,910.5 51.2 84,214.6 12,637.4 29,559.3 818.6 24,707.7 68,283.0 104,754.9 584,426.6
Table 38: COVID Revenue Forecast Results with Phase 2 Interventions
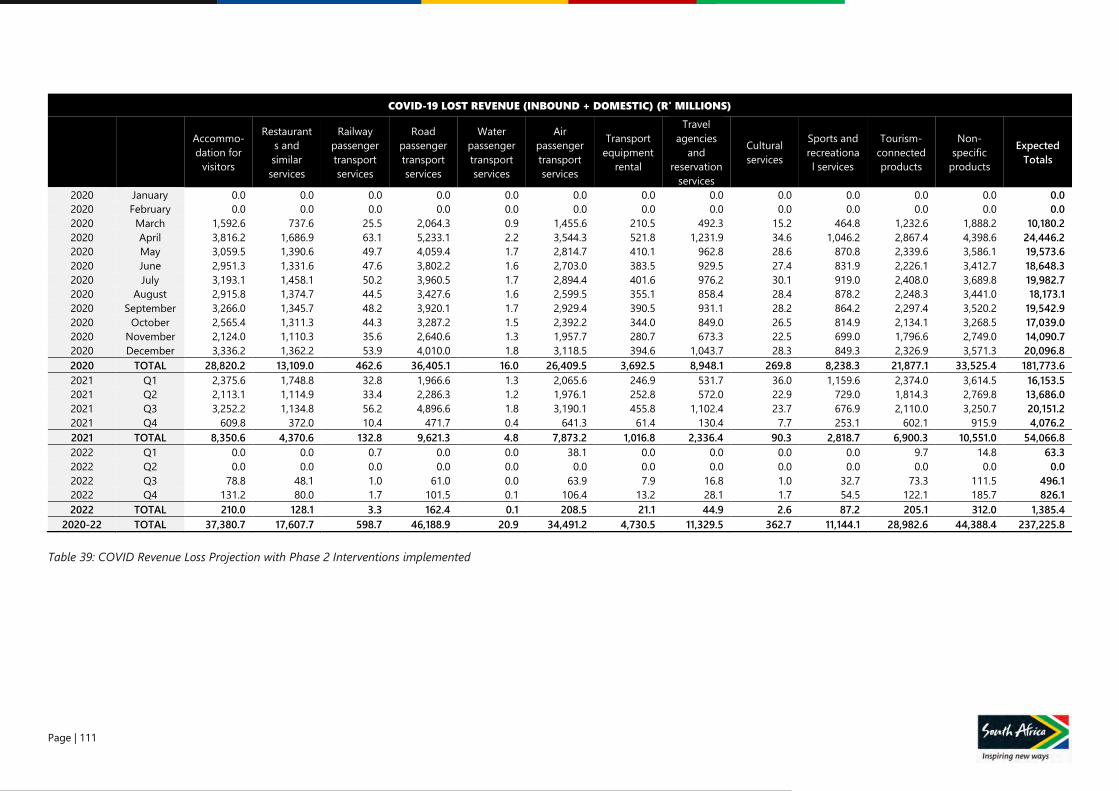
Page | 111
COVID-19 LOST REVENUE (INBOUND + DOMESTIC) (R' MILLIONS)
Accommo-
dation for
visitors
Restaurant
s and
similar
services
Railway
passenger
transport
services
Road
passenger
transport
services
Water
passenger
transport
services
Air
passenger
transport
services
Transport
equipment
rental
Travel
agencies
and
reservation
services
Cultural
services
Sports and
recreationa
l services
Tourism-
connected
products
Non-
specific
products
Expected
Totals
2020 January 0.0 0.0 0.0 0.0 0.0 0.0 0.0 0.0 0.0 0.0 0.0 0.0 0.0
2020 February 0.0 0.0 0.0 0.0 0.0 0.0 0.0 0.0 0.0 0.0 0.0 0.0 0.0
2020 March 1,592.6 737.6 25.5 2,064.3 0.9 1,455.6 210.5 492.3 15.2 464.8 1,232.6 1,888.2 10,180.2
2020 April 3,816.2 1,686.9 63.1 5,233.1 2.2 3,544.3 521.8 1,231.9 34.6 1,046.2 2,867.4 4,398.6 24,446.2
2020 May 3,059.5 1,390.6 49.7 4,059.4 1.7 2,814.7 410.1 962.8 28.6 870.8 2,339.6 3,586.1 19,573.6
2020 June 2,951.3 1,331.6 47.6 3,802.2 1.6 2,703.0 383.5 929.5 27.4 831.9 2,226.1 3,412.7 18,648.3
2020 July 3,193.1 1,458.1 50.2 3,960.5 1.7 2,894.4 401.6 976.2 30.1 919.0 2,408.0 3,689.8 19,982.7
2020 August 2,915.8 1,374.7 44.5 3,427.6 1.6 2,599.5 355.1 858.4 28.4 878.2 2,248.3 3,441.0 18,173.1
2020 September 3,266.0 1,345.7 48.2 3,920.1 1.7 2,929.4 390.5 931.1 28.2 864.2 2,297.4 3,520.2 19,542.9
2020 October 2,565.4 1,311.3 44.3 3,287.2 1.5 2,392.2 344.0 849.0 26.5 814.9 2,134.1 3,268.5 17,039.0
2020 November 2,124.0 1,110.3 35.6 2,640.6 1.3 1,957.7 280.7 673.3 22.5 699.0 1,796.6 2,749.0 14,090.7
2020 December 3,336.2 1,362.2 53.9 4,010.0 1.8 3,118.5 394.6 1,043.7 28.3 849.3 2,326.9 3,571.3 20,096.8
2020 TOTAL 28,820.2 13,109.0 462.6 36,405.1 16.0 26,409.5 3,692.5 8,948.1 269.8 8,238.3 21,877.1 33,525.4 181,773.6
2021 Q1 2,375.6 1,748.8 32.8 1,966.6 1.3 2,065.6 246.9 531.7 36.0 1,159.6 2,374.0 3,614.5 16,153.5
2021 Q2 2,113.1 1,114.9 33.4 2,286.3 1.2 1,976.1 252.8 572.0 22.9 729.0 1,814.3 2,769.8 13,686.0
2021 Q3 3,252.2 1,134.8 56.2 4,896.6 1.8 3,190.1 455.8 1,102.4 23.7 676.9 2,110.0 3,250.7 20,151.2
2021 Q4 609.8 372.0 10.4 471.7 0.4 641.3 61.4 130.4 7.7 253.1 602.1 915.9 4,076.2
2021 TOTAL 8,350.6 4,370.6 132.8 9,621.3 4.8 7,873.2 1,016.8 2,336.4 90.3 2,818.7 6,900.3 10,551.0 54,066.8
2022 Q1 0.0 0.0 0.7 0.0 0.0 38.1 0.0 0.0 0.0 0.0 9.7 14.8 63.3
2022 Q2 0.0 0.0 0.0 0.0 0.0 0.0 0.0 0.0 0.0 0.0 0.0 0.0 0.0
2022 Q3 78.8 48.1 1.0 61.0 0.0 63.9 7.9 16.8 1.0 32.7 73.3 111.5 496.1
2022 Q4 131.2 80.0 1.7 101.5 0.1 106.4 13.2 28.1 1.7 54.5 122.1 185.7 826.1
2022 TOTAL 210.0 128.1 3.3 162.4 0.1 208.5 21.1 44.9 2.6 87.2 205.1 312.0 1,385.4
2020-22 TOTAL 37,380.7 17,607.7 598.7 46,188.9 20.9 34,491.2 4,730.5 11,329.5 362.7 11,144.1 28,982.6 44,388.4 237,225.8
Table 39: COVID Revenue Loss Projection with Phase 2 Interventions implemented
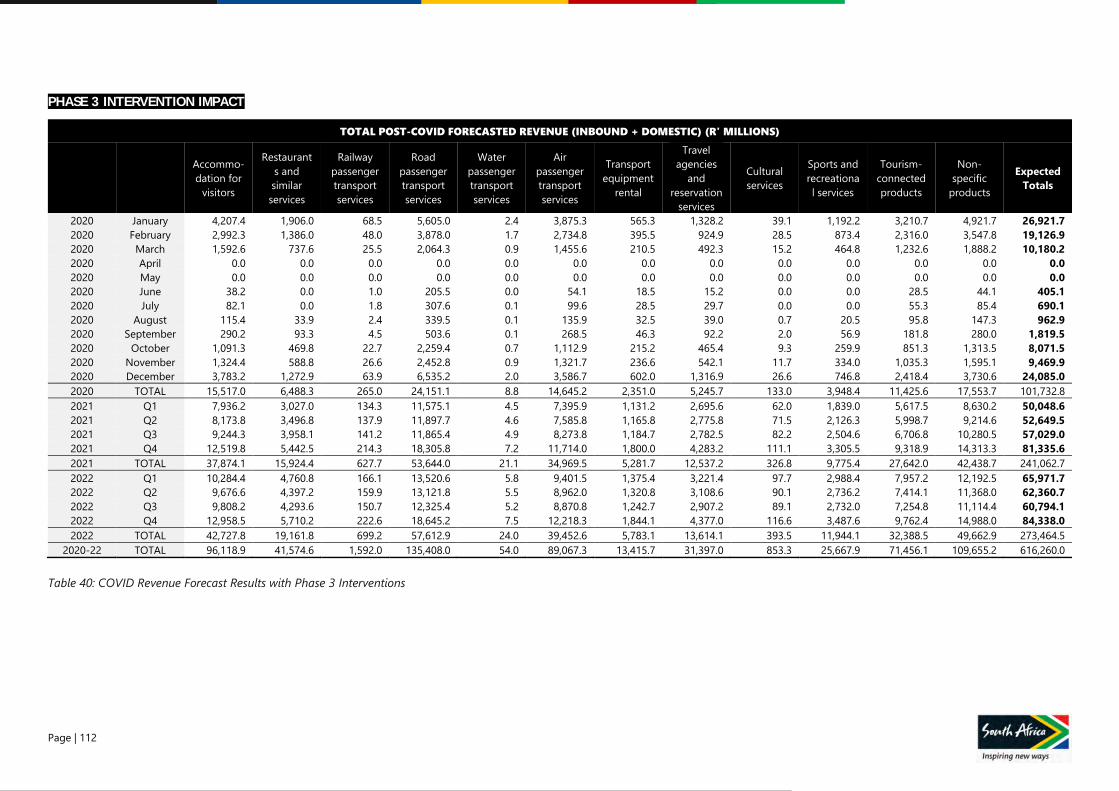
Page | 112
PHASE 3 INTERVENTION IMPACT
TOTAL POST-COVID FORECASTED REVENUE (INBOUND + DOMESTIC) (R' MILLIONS)
Accommo-
dation for
visitors
Restaurant
s and
similar
services
Railway
passenger
transport
services
Road
passenger
transport
services
Water
passenger
transport
services
Air
passenger
transport
services
Transport
equipment
rental
Travel
agencies
and
reservation
services
Cultural
services
Sports and
recreationa
l services
Tourism-
connected
products
Non-
specific
products
Expected
Totals
2020 January 4,207.4 1,906.0 68.5 5,605.0 2.4 3,875.3 565.3 1,328.2 39.1 1,192.2 3,210.7 4,921.7 26,921.7
2020 February 2,992.3 1,386.0 48.0 3,878.0 1.7 2,734.8 395.5 924.9 28.5 873.4 2,316.0 3,547.8 19,126.9
2020 March 1,592.6 737.6 25.5 2,064.3 0.9 1,455.6 210.5 492.3 15.2 464.8 1,232.6 1,888.2 10,180.2
2020 April 0.0 0.0 0.0 0.0 0.0 0.0 0.0 0.0 0.0 0.0 0.0 0.0 0.0
2020 May 0.0 0.0 0.0 0.0 0.0 0.0 0.0 0.0 0.0 0.0 0.0 0.0 0.0
2020 June 38.2 0.0 1.0 205.5 0.0 54.1 18.5 15.2 0.0 0.0 28.5 44.1 405.1
2020 July 82.1 0.0 1.8 307.6 0.1 99.6 28.5 29.7 0.0 0.0 55.3 85.4 690.1
2020 August 115.4 33.9 2.4 339.5 0.1 135.9 32.5 39.0 0.7 20.5 95.8 147.3 962.9
2020 September 290.2 93.3 4.5 503.6 0.1 268.5 46.3 92.2 2.0 56.9 181.8 280.0 1,819.5
2020 October 1,091.3 469.8 22.7 2,259.4 0.7 1,112.9 215.2 465.4 9.3 259.9 851.3 1,313.5 8,071.5
2020 November 1,324.4 588.8 26.6 2,452.8 0.9 1,321.7 236.6 542.1 11.7 334.0 1,035.3 1,595.1 9,469.9
2020 December 3,783.2 1,272.9 63.9 6,535.2 2.0 3,586.7 602.0 1,316.9 26.6 746.8 2,418.4 3,730.6 24,085.0
2020 TOTAL 15,517.0 6,488.3 265.0 24,151.1 8.8 14,645.2 2,351.0 5,245.7 133.0 3,948.4 11,425.6 17,553.7 101,732.8
2021 Q1 7,936.2 3,027.0 134.3 11,575.1 4.5 7,395.9 1,131.2 2,695.6 62.0 1,839.0 5,617.5 8,630.2 50,048.6
2021 Q2 8,173.8 3,496.8 137.9 11,897.7 4.6 7,585.8 1,165.8 2,775.8 71.5 2,126.3 5,998.7 9,214.6 52,649.5
2021 Q3 9,244.3 3,958.1 141.2 11,865.4 4.9 8,273.8 1,184.7 2,782.5 82.2 2,504.6 6,706.8 10,280.5 57,029.0
2021 Q4 12,519.8 5,442.5 214.3 18,305.8 7.2 11,714.0 1,800.0 4,283.2 111.1 3,305.5 9,318.9 14,313.3 81,335.6
2021 TOTAL 37,874.1 15,924.4 627.7 53,644.0 21.1 34,969.5 5,281.7 12,537.2 326.8 9,775.4 27,642.0 42,438.7 241,062.7
2022 Q1 10,284.4 4,760.8 166.1 13,520.6 5.8 9,401.5 1,375.4 3,221.4 97.7 2,988.4 7,957.2 12,192.5 65,971.7
2022 Q2 9,676.6 4,397.2 159.9 13,121.8 5.5 8,962.0 1,320.8 3,108.6 90.1 2,736.2 7,414.1 11,368.0 62,360.7
2022 Q3 9,808.2 4,293.6 150.7 12,325.4 5.2 8,870.8 1,242.7 2,907.2 89.1 2,732.0 7,254.8 11,114.4 60,794.1
2022 Q4 12,958.5 5,710.2 222.6 18,645.2 7.5 12,218.3 1,844.1 4,377.0 116.6 3,487.6 9,762.4 14,988.0 84,338.0
2022 TOTAL 42,727.8 19,161.8 699.2 57,612.9 24.0 39,452.6 5,783.1 13,614.1 393.5 11,944.1 32,388.5 49,662.9 273,464.5
2020-22 TOTAL 96,118.9 41,574.6 1,592.0 135,408.0 54.0 89,067.3 13,415.7 31,397.0 853.3 25,667.9 71,456.1 109,655.2 616,260.0
Table 40: COVID Revenue Forecast Results with Phase 3 Interventions
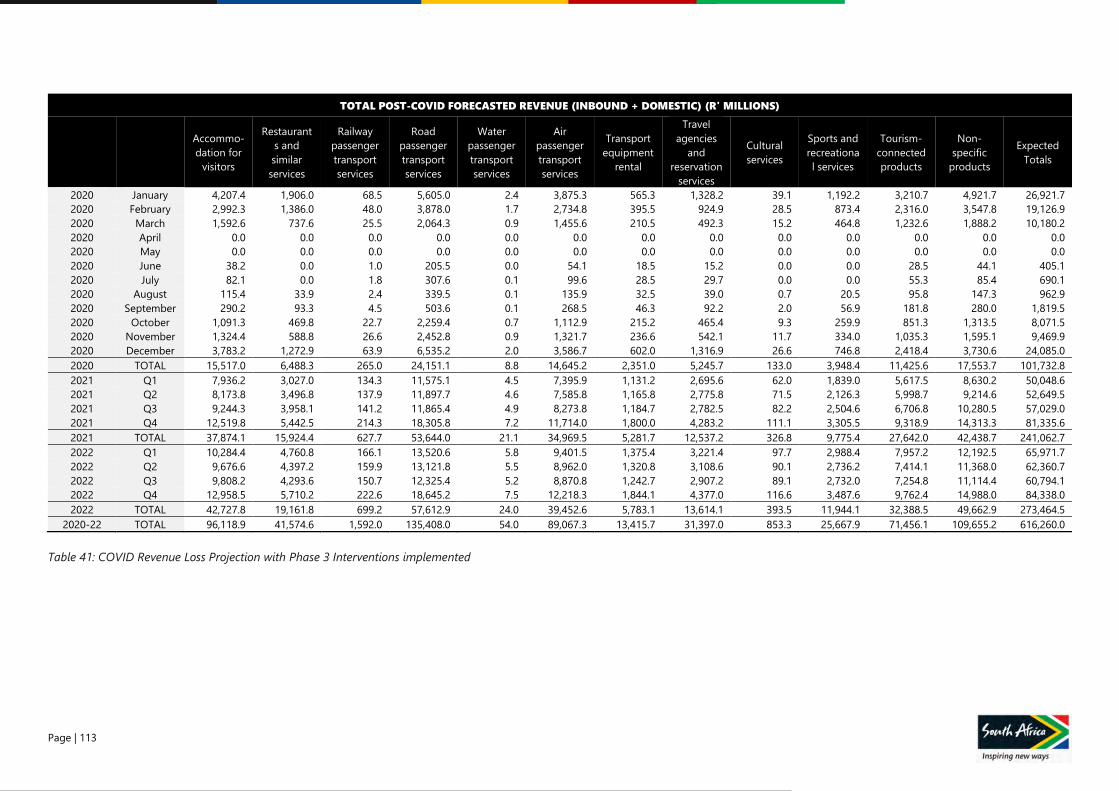
Page | 113
TOTAL POST-COVID FORECASTED REVENUE (INBOUND + DOMESTIC) (R' MILLIONS)
Accommo-
dation for
visitors
Restaurant
s and
similar
services
Railway
passenger
transport
services
Road
passenger
transport
services
Water
passenger
transport
services
Air
passenger
transport
services
Transport
equipment
rental
Travel
agencies
and
reservation
services
Cultural
services
Sports and
recreationa
l services
Tourism-
connected
products
Non-
specific
products
Expected
Totals
2020 January 4,207.4 1,906.0 68.5 5,605.0 2.4 3,875.3 565.3 1,328.2 39.1 1,192.2 3,210.7 4,921.7 26,921.7
2020 February 2,992.3 1,386.0 48.0 3,878.0 1.7 2,734.8 395.5 924.9 28.5 873.4 2,316.0 3,547.8 19,126.9
2020 March 1,592.6 737.6 25.5 2,064.3 0.9 1,455.6 210.5 492.3 15.2 464.8 1,232.6 1,888.2 10,180.2
2020 April 0.0 0.0 0.0 0.0 0.0 0.0 0.0 0.0 0.0 0.0 0.0 0.0 0.0
2020 May 0.0 0.0 0.0 0.0 0.0 0.0 0.0 0.0 0.0 0.0 0.0 0.0 0.0
2020 June 38.2 0.0 1.0 205.5 0.0 54.1 18.5 15.2 0.0 0.0 28.5 44.1 405.1
2020 July 82.1 0.0 1.8 307.6 0.1 99.6 28.5 29.7 0.0 0.0 55.3 85.4 690.1
2020 August 115.4 33.9 2.4 339.5 0.1 135.9 32.5 39.0 0.7 20.5 95.8 147.3 962.9
2020 September 290.2 93.3 4.5 503.6 0.1 268.5 46.3 92.2 2.0 56.9 181.8 280.0 1,819.5
2020 October 1,091.3 469.8 22.7 2,259.4 0.7 1,112.9 215.2 465.4 9.3 259.9 851.3 1,313.5 8,071.5
2020 November 1,324.4 588.8 26.6 2,452.8 0.9 1,321.7 236.6 542.1 11.7 334.0 1,035.3 1,595.1 9,469.9
2020 December 3,783.2 1,272.9 63.9 6,535.2 2.0 3,586.7 602.0 1,316.9 26.6 746.8 2,418.4 3,730.6 24,085.0
2020 TOTAL 15,517.0 6,488.3 265.0 24,151.1 8.8 14,645.2 2,351.0 5,245.7 133.0 3,948.4 11,425.6 17,553.7 101,732.8
2021 Q1 7,936.2 3,027.0 134.3 11,575.1 4.5 7,395.9 1,131.2 2,695.6 62.0 1,839.0 5,617.5 8,630.2 50,048.6
2021 Q2 8,173.8 3,496.8 137.9 11,897.7 4.6 7,585.8 1,165.8 2,775.8 71.5 2,126.3 5,998.7 9,214.6 52,649.5
2021 Q3 9,244.3 3,958.1 141.2 11,865.4 4.9 8,273.8 1,184.7 2,782.5 82.2 2,504.6 6,706.8 10,280.5 57,029.0
2021 Q4 12,519.8 5,442.5 214.3 18,305.8 7.2 11,714.0 1,800.0 4,283.2 111.1 3,305.5 9,318.9 14,313.3 81,335.6
2021 TOTAL 37,874.1 15,924.4 627.7 53,644.0 21.1 34,969.5 5,281.7 12,537.2 326.8 9,775.4 27,642.0 42,438.7 241,062.7
2022 Q1 10,284.4 4,760.8 166.1 13,520.6 5.8 9,401.5 1,375.4 3,221.4 97.7 2,988.4 7,957.2 12,192.5 65,971.7
2022 Q2 9,676.6 4,397.2 159.9 13,121.8 5.5 8,962.0 1,320.8 3,108.6 90.1 2,736.2 7,414.1 11,368.0 62,360.7
2022 Q3 9,808.2 4,293.6 150.7 12,325.4 5.2 8,870.8 1,242.7 2,907.2 89.1 2,732.0 7,254.8 11,114.4 60,794.1
2022 Q4 12,958.5 5,710.2 222.6 18,645.2 7.5 12,218.3 1,844.1 4,377.0 116.6 3,487.6 9,762.4 14,988.0 84,338.0
2022 TOTAL 42,727.8 19,161.8 699.2 57,612.9 24.0 39,452.6 5,783.1 13,614.1 393.5 11,944.1 32,388.5 49,662.9 273,464.5
2020-22 TOTAL 96,118.9 41,574.6 1,592.0 135,408.0 54.0 89,067.3 13,415.7 31,397.0 853.3 25,667.9 71,456.1 109,655.2 616,260.0
Table 41: COVID Revenue Loss Projection with Phase 3 Interventions implemented
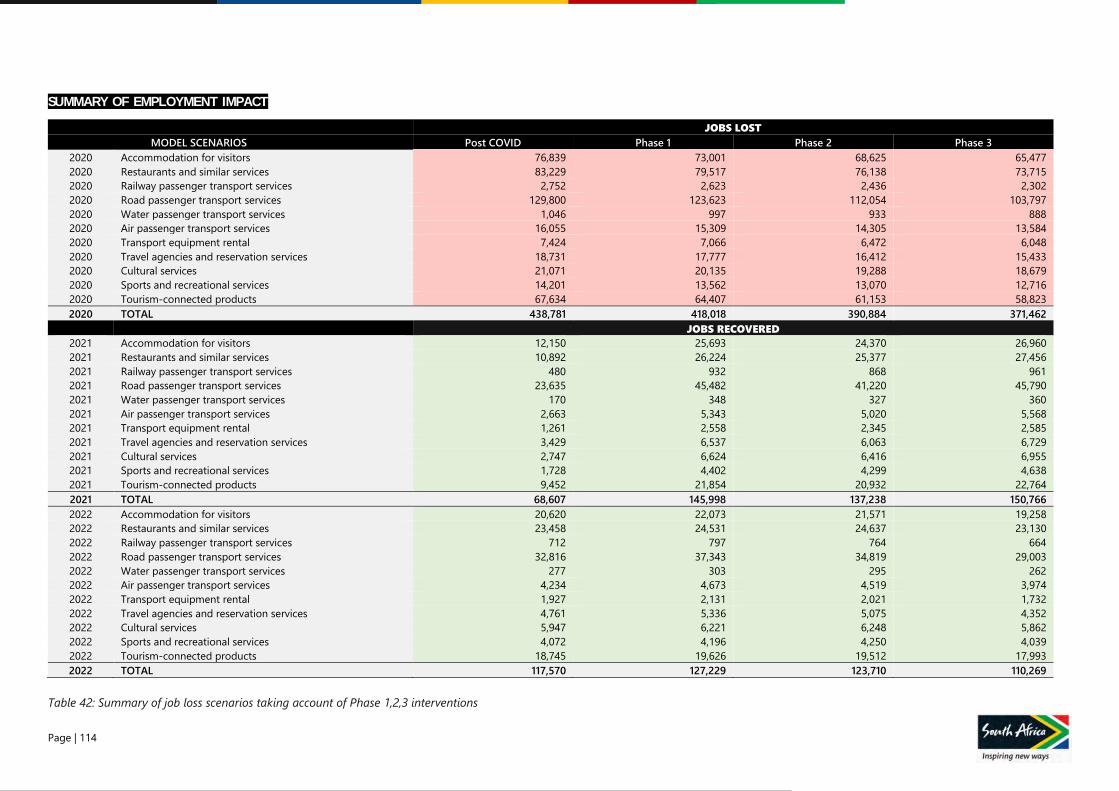
Page | 114
SUMMARY OF EMPLOYMENT IMPACT
JOBS LOST
MODEL SCENARIOS Post COVID Phase 1 Phase 2 Phase 3
2020 Accommodation for visitors 76,839 73,001 68,625 65,477
2020 Restaurants and similar services 83,229 79,517 76,138 73,715
2020 Railway passenger transport services 2,752 2,623 2,436 2,302
2020 Road passenger transport services 129,800 123,623 112,054 103,797
2020 Water passenger transport services 1,046 997 933 888
2020 Air passenger transport services 16,055 15,309 14,305 13,584
2020 Transport equipment rental 7,424 7,066 6,472 6,048
2020 Travel agencies and reservation services 18,731 17,777 16,412 15,433
2020 Cultural services 21,071 20,135 19,288 18,679
2020 Sports and recreational services 14,201 13,562 13,070 12,716
2020 Tourism-connected products 67,634 64,407 61,153 58,823
2020 TOTAL 438,781 418,018 390,884 371,462
JOBS RECOVERED
2021 Accommodation for visitors 12,150 25,693 24,370 26,960
2021 Restaurants and similar services 10,892 26,224 25,377 27,456
2021 Railway passenger transport services 480 932 868 961
2021 Road passenger transport services 23,635 45,482 41,220 45,790
2021 Water passenger transport services 170 348 327 360
2021 Air passenger transport services 2,663 5,343 5,020 5,568
2021 Transport equipment rental 1,261 2,558 2,345 2,585
2021 Travel agencies and reservation services 3,429 6,537 6,063 6,729
2021 Cultural services 2,747 6,624 6,416 6,955
2021 Sports and recreational services 1,728 4,402 4,299 4,638
2021 Tourism-connected products 9,452 21,854 20,932 22,764
2021 TOTAL 68,607 145,998 137,238 150,766
2022 Accommodation for visitors 20,620 22,073 21,571 19,258
2022 Restaurants and similar services 23,458 24,531 24,637 23,130
2022 Railway passenger transport services 712 797 764 664
2022 Road passenger transport services 32,816 37,343 34,819 29,003
2022 Water passenger transport services 277 303 295 262
2022 Air passenger transport services 4,234 4,673 4,519 3,974
2022 Transport equipment rental 1,927 2,131 2,021 1,732
2022 Travel agencies and reservation services 4,761 5,336 5,075 4,352
2022 Cultural services 5,947 6,221 6,248 5,862
2022 Sports and recreational services 4,072 4,196 4,250 4,039
2022 Tourism-connected products 18,745 19,626 19,512 17,993
2022 TOTAL 117,570 127,229 123,710 110,269
Table 42: Summary of job loss scenarios taking account of Phase 1,2,3 interventions