The Total Economic Impact Of Dimension Data's Uptime Services
27
A Forrester Total Economic Impact™ Study Prepared For Dimension Data The Total Economic Impact Of Dimension Data’s Uptime Services For Organizations With Offices That Cross Borders Project Director: Sebastian Selhorst December 2012
-
Upload
truongdien -
Category
Documents
-
view
219 -
download
0
Transcript of The Total Economic Impact Of Dimension Data's Uptime Services
A Forrester Total Economic Impact™ Study Prepared For Dimension Data
The Total Economic Impact Of Dimension Data’sUptime ServicesFor Organizations With Offices That Cross Borders
Project Director: Sebastian Selhorst
December 2012
Forrester Consulting
The Total Economic Impact Of Dimension Data’s Uptime Services
Page 1
Table Of ContentsExecutive Summary.............................................................................................................................................................................2
Uptime Services Help Organizations Ensure The Availability And Reliability Of Their Global NetworkInfrastructure ..................................................................................................................................................................................2
Factors Affecting Benefits And Costs.........................................................................................................................................4
Disclosures.......................................................................................................................................................................................5
TEI Framework And Methodology..................................................................................................................................................6
Analysis..................................................................................................................................................................................................7
Interview Highlights ......................................................................................................................................................................7
Costs..................................................................................................................................................................................................10
Benefits .............................................................................................................................................................................................12
Flexibility..........................................................................................................................................................................................19
Risk....................................................................................................................................................................................................19
Financial Summary..............................................................................................................................................................................22
Dimension Data Uptime Services: Overview .................................................................................................................................23
Appendix A: Composite Organization Description .....................................................................................................................24
Appendix B: Total Economic Impact™ Overview..........................................................................................................................24
Appendix C: Glossary .........................................................................................................................................................................25
Appendix D: Supplemental Material ...............................................................................................................................................26
Appendix E: Endnotes ........................................................................................................................................................................26
© 2012, Forrester Research, Inc. All rights reserved. Unauthorized reproduction is strictly prohibited.Information is based on best available resources. Opinions reflect judgment at the time and are subject tochange. Forrester®, Technographics®, Forrester Wave, RoleView, TechRadar, and Total Economic Impact aretrademarks of Forrester Research, Inc. All other trademarks are the property of their respective companies. Foradditional information, go to www.forrester.com.
About Forrester ConsultingForrester Consulting provides independent and objective research-based consulting to help leaders succeed in their organizations. Rangingin scope from a short strategy session to custom projects, Forrester’s Consulting services connect you directly with research analysts whoapply expert insight to your specific business challenges. For more information, visit www.forrester.com/consulting.
Forrester Consulting
The Total Economic Impact Of Dimension Data’s Uptime Services
Page 2
Executive Summary
More and more, organizations are expected to deliver continuous services in a seamless fashion. Ensuring thereliability of the underlying IT and network infrastructure is therefore one of the top priorities for today’s ITdepartments. IT does its best to reduce the amount of downtime — planned or unplanned — as it can result inimmediate revenue losses for the company, loss of productivity, potential compliance or reporting penalties, loss ofemployees’ confidence in IT’s capabilities, difficulties with partners and suppliers, and even reputational damagethat can put the company’s stock price at risk. But maintaining a heterogeneous IT and network infrastructurebased on assets from multiple vendors and spread over multiple sites, regions, or even continents can quicklybecome a very complex and expensive task.
Apart from the high costs of maintaining a global IT and network infrastructure in house, many large organizationsare also experiencing difficulties with providing the right technical and language skills, collaborating effectivelyacross different regions, leveraging global buying power, managing multiple vendors, and adhering to localcustoms requirements and procurement laws and regulations. While outsourcing the maintenance and support ofthe IT and network infrastructure to a partner with global presence and capabilities, such as Dimension Data,might make sense for many organizations, they often struggle to build the business case for what they may see as anexpensive insurance policy.
In March 2012, Dimension Data commissioned Forrester Consulting to examine the total economic impact andpotential return on investment (ROI) global enterprises may realize by using Dimension Data’s Uptime Services.The purpose of this study is to provide readers with a framework to evaluate the potential financial impact ofUptime Services on their organizations.
Dimension Data is a leading partner to major IT manufacturers for services across networking, security, unifiedcommunications, data centers, and contact centers. The firm maintains a life-cycle IT services approach: thoroughplanning and integration to support and manage IT environments. Dimension Data provides Uptime Maintenanceand Uptime Support services for IT and network assets from multiple vendors to medium-size and largeorganizations around the world, restores failed devices to working order within agreed response times, andprovides expertise to help clients proactively support their IT environment. For a more detailed overview ofDimension Data’s Uptime Services, please refer to page 23.
Uptime Services Help Organizations Ensure The Availability And Reliability Of TheirGlobal Network InfrastructureOur interviews with three existing multinational customers and subsequent financial analysis found that acomposite organization based on the companies we interviewed experienced the risk-adjusted ROI, costs, andbenefits shown in Table 1. See Appendix A for a description of the composite organization.
Table 1Composite Organization Three-Year Risk-Adjusted ROI1
ROI Payback period Total benefits (PV) Total costs (PV) Net present value
20% Within 12 months $20,536,736 ($17,144,736) $3,392,000
Source: Forrester Research, Inc.
Forrester Consulting
The Total Economic Impact Of Dimension Data’s Uptime Services
Page 3
“Dimension Data’s responsiveness and abilityto properly manage our environment are key tomaintaining uptime and service levels with our
business units.”(VP of network engineering and provisioning,
multinational insurance group)
Benefits. The organization used in this analysis is a compositebased on multiple interviews that Forrester conducted to delvemore deeply into the operational impact of Dimension Data’sUptime Services. The composite organization represents aninternational insurance and asset management firm based inthe US; it has annual revenue of $12 billion and employs40,000 people in 200 locations across the US, Europe, and Asia. To better ensure the availability of its globalnetwork, the firm decided to outsource the break-fix maintenance and support of 10,000 network chassis toDimension Data. The composite organization realized the following benefits, which are representative ofthose experienced by the interviewed companies (see Figure 1):
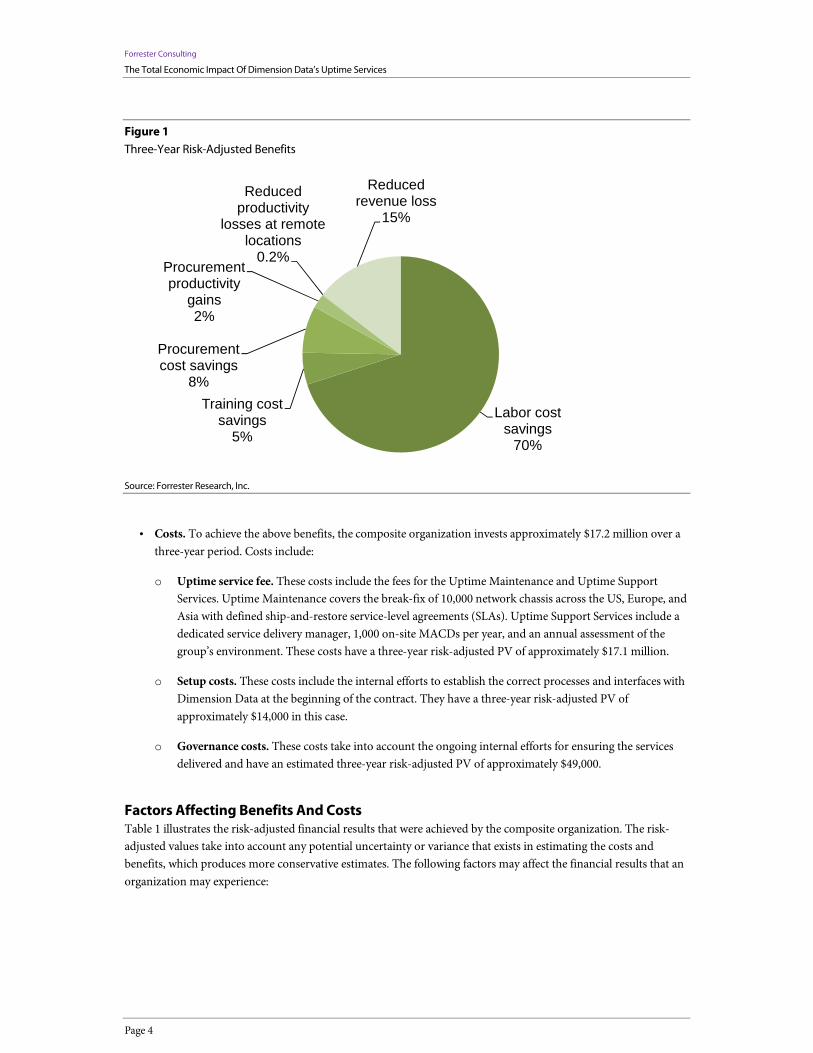
o Labor cost savings. By outsourcing the maintenance and support of its network infrastructure toDimension Data, the composite organization avoids hiring 41 specialized network engineers across thedifferent locations and regions. This benefit has an estimated three-year risk-adjusted PV ofapproximately $14.4 million for the composite organization.
o Training cost savings. The composite organization can rely on Dimension Data’s highly skilled networkengineers and thus saves on training costs. This benefit has an estimated three-year risk-adjusted PV ofapproximately $1.1 million for the composite organization.
o Procurement cost savings. For renewing its global network infrastructure by replacing end-of-lifeassets, the composite organization leverages the global purchasing power of Dimension Data. It realizescost savings due to the better discount structure that Dimension Data has negotiated with variousvendors. In this case, these cost savings have an estimated three-year risk-adjusted PV of approximately$1.6 million.
o Procurement productivity gains. The global Uptime Services contract has made the procurement ofnetwork assets easier. Instead of having to establish local relationships with multiple vendors, negotiateprices, deal with purchase orders and invoices in different countries, and ensure that it adheres tovarious customs and procurement laws, the composite organization only has to deal with DimensionData. These productivity gains have an estimated three-year risk-adjusted PV of approximately $472,000for the composite organization.
o Increased network uptime. While the impact of network downtime is highly variable, in this analysiswe conservatively estimate the impact of increased uptime on the composite organization’s revenue andon employees’ productivity at remote locations. An increase of 0.1% in uptime for the compositeorganization results in a reduction of lost revenue of about $3 million (risk-adjusted PV) over the threeyears of the analysis. To estimate the gain in productivity, we conservatively assume that employees are20% less productive during a network outage. Based on an assumed number of outages at remotelocations and the number of impacted employees these productivity gains have an estimated three-yearrisk-adjusted PV of approximately $43,000 in our case.
Figure 1 shows the breakdown of the benefit categories for the composite organization.
Forrester Consulting
The Total Economic Impact Of Dimension Data’s Uptime Services
Page 4
Figure 1Three-Year Risk-Adjusted Benefits
Source: Forrester Research, Inc.
Costs. To achieve the above benefits, the composite organization invests approximately $17.2 million over athree-year period. Costs include:
o Uptime service fee. These costs include the fees for the Uptime Maintenance and Uptime SupportServices. Uptime Maintenance covers the break-fix of 10,000 network chassis across the US, Europe, andAsia with defined ship-and-restore service-level agreements (SLAs). Uptime Support Services include adedicated service delivery manager, 1,000 on-site MACDs per year, and an annual assessment of thegroup’s environment. These costs have a three-year risk-adjusted PV of approximately $17.1 million.
o Setup costs. These costs include the internal efforts to establish the correct processes and interfaces withDimension Data at the beginning of the contract. They have a three-year risk-adjusted PV ofapproximately $14,000 in this case.
o Governance costs. These costs take into account the ongoing internal efforts for ensuring the servicesdelivered and have an estimated three-year risk-adjusted PV of approximately $49,000.
Factors Affecting Benefits And CostsTable 1 illustrates the risk-adjusted financial results that were achieved by the composite organization. The risk-adjusted values take into account any potential uncertainty or variance that exists in estimating the costs andbenefits, which produces more conservative estimates. The following factors may affect the financial results that anorganization may experience:
Labor costsavings
70%
Training costsavings
5%
Procurementcost savings
8%
Procurementproductivity
gains2%
Reducedproductivity
losses at remotelocations
0.2%
Reducedrevenue loss
15%
Forrester Consulting
The Total Economic Impact Of Dimension Data’s Uptime Services
Page 5
Industrial sector and business model. One hour of downtime poses different risks to and has differentimpacts on any two organizations, depending on factors such as the industrial sector the company works inor the business model under which it operates. Companies whose business model and processes rely stronglyon the availability of network infrastructure, such as financial institutions, are likely to benefit more fromUptime Services than organizations that do not need to be constantly connected.
Geographical footprint. Maintaining and supporting a global network infrastructure spread across differentcountries and regions of the world is a challenging task and requires a global presence. Think, for example, ofa mining company with its headquarters in Europe and hundreds of remote locations across the globe.Companies with a larger geographical footprint may benefit more from the global presence of their serviceprovider, such as Dimension Data, than companies with a limited geographical scope.
Heterogeneity of the technical environment. A company’s global network infrastructure is often based onmultiple technologies and multiple vendors, but keeping all internal resources up to speed with the latestevolutions might be very expensive. A company may therefore prefer to leverage the skilled and trainedresources of a service provider such as Dimension Data. Organizations with a heterogeneous infrastructuremight therefore benefit more from Uptime Services than organizations with a homogeneous network.
DisclosuresThe reader should be aware of the following:
The study is commissioned by Dimension Data and delivered by the Forrester Consulting group.
Forrester makes no assumptions as to the potential return on investment that other organizations willreceive. Forrester strongly advises that readers use their own estimates within the framework provided in thereport to determine the appropriateness of an investment in Dimension Data’s Uptime Services.
Dimension Data reviewed and provided feedback to Forrester, but Forrester maintains editorial control overthe study and its findings and does not accept changes to the study that contradict Forrester’s findings orobscure the meaning of the study.
The customer names for the interviews were provided by Dimension Data.
Forrester Consulting
The Total Economic Impact Of Dimension Data’s Uptime Services
Page 6
TEI Framework And Methodology
IntroductionFrom the information provided in the interviews, Forrester has constructed a Total Economic Impact™ frameworkfor those organizations considering using Dimension Data’s Uptime Services. The objective of the framework is toidentify the cost, benefit, flexibility, and risk factors that affect the investment decision.
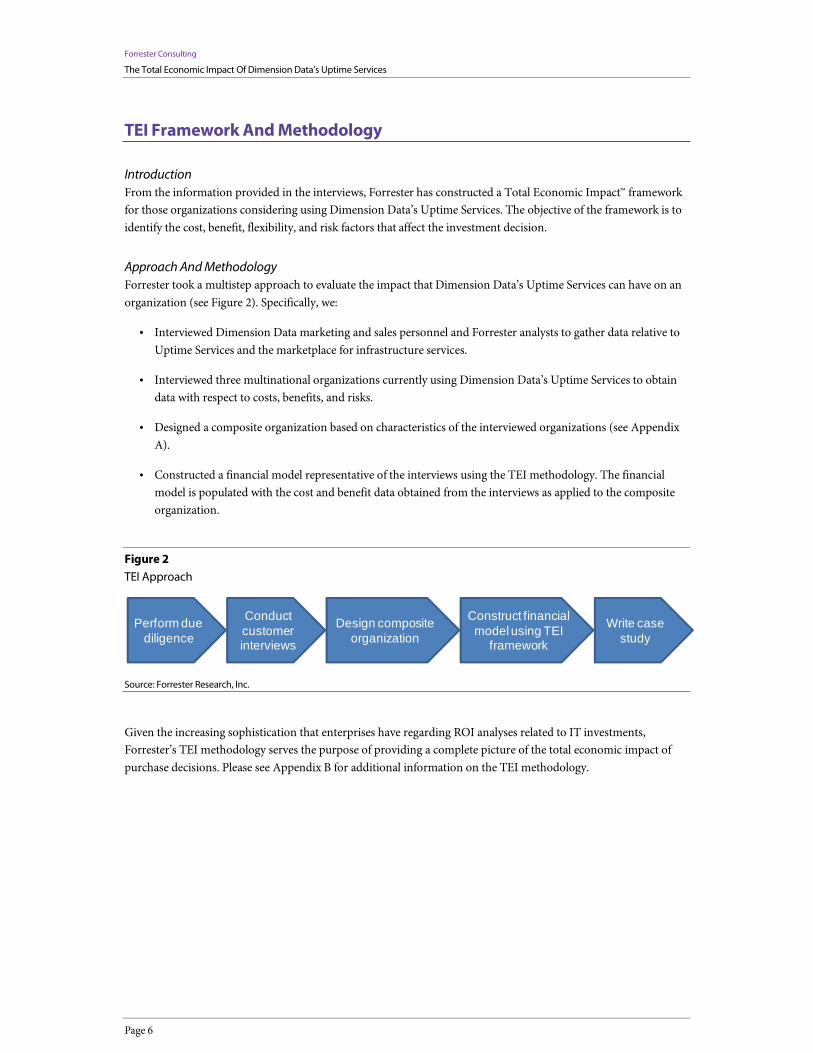
Approach And MethodologyForrester took a multistep approach to evaluate the impact that Dimension Data’s Uptime Services can have on anorganization (see Figure 2). Specifically, we:
Interviewed Dimension Data marketing and sales personnel and Forrester analysts to gather data relative toUptime Services and the marketplace for infrastructure services.
Interviewed three multinational organizations currently using Dimension Data’s Uptime Services to obtaindata with respect to costs, benefits, and risks.
Designed a composite organization based on characteristics of the interviewed organizations (see AppendixA).
Constructed a financial model representative of the interviews using the TEI methodology. The financialmodel is populated with the cost and benefit data obtained from the interviews as applied to the compositeorganization.
Figure 2TEI Approach
Source: Forrester Research, Inc.
Given the increasing sophistication that enterprises have regarding ROI analyses related to IT investments,Forrester’s TEI methodology serves the purpose of providing a complete picture of the total economic impact ofpurchase decisions. Please see Appendix B for additional information on the TEI methodology.
Design compositeorganization
Construct financialmodel using TEI
framework
Write casestudy
Perform duediligence
Conductcustomerinterviews
Forrester Consulting
The Total Economic Impact Of Dimension Data’s Uptime Services
Page 7
Analysis
Interview HighlightsA total of three interviews were conducted for this study involving representatives from the following DimensionData customers:
1. A multinational insurance corporation with more than 3,000 network devices covered by an UptimeServices contract.
2. A global telecommunications and Internet service provider with more than 5,000 network devicescovered by an Uptime Services contract.
3. A global communications and IT service provider with more than 10,000 network devices covered byan Uptime Services contract.
These interviews uncovered a number of facts and insights that apply to the composite organization (see AppendixA) and may also apply to other companies that consider using Dimension Data’s Uptime Services, including thefollowing:
Companies are looking for a reliable partner with global presence. All of the interviewed organizationshave operations in many parts of the world. They were looking for a reliable partner with a global presence tomaintain and support their network infrastructure.
“Dimension Data’s global presence is obviously one of the key elements for our engagement with them. Theability to really deliver globally is a big differentiator for Dimension Data when compared to many otherservice providers.” (Director of managed services, global telecommunications and Internet serviceprovider)
Companies have common challenges with regard to staffing and skill sets. The main challenges that theseorganizations faced involved staffing and providing the right level of skills in various regions of the world.
“The economics just do not allow us to staff in countries where we just do a few installations per quarter. Sothe ability to rely on Dimension Data as a global partner is very important to us. Also, our field force doesnot have the same level of expertise that the Dimension Data engineers have. It is a huge benefit for ourorganization to rely on a company like Dimension Data to provide the expertise, the resources, and the spareparts in any metropolitan area where we operate.” (Director of managed services, globaltelecommunications and Internet service provider)
Companies appreciate Dimension Data’s flexibility. All of the interviewed organizations have been usingDimension Data’s Uptime Services for several years and highlighted that Dimension Data is very flexible andeasy to work with.
“We have had a good working relationship with Dimension Data for the past four years. Dimension Data isone of our strategic partners when it comes to the network space. They are very flexible. They are alwayswilling to work with us to make our life easier and help us to provide the best service we can to our internalcustomers.” (VP of network engineering and provisioning, multinational insurance group)
“We have definitely seen a lot of benefits from our engagement with Dimension Data. It is not just usprocuring a service and them executing. They have really collaborated with us and demonstrated that they
Forrester Consulting
The Total Economic Impact Of Dimension Data’s Uptime Services
Page 8
are willing to work with us as a team.” (Partner management, global communications and IT serviceprovider)
Companies value Dimension Data’s expertise and consistent performance. Interviewees also reported thatDimension Data’s engineers have a high level of expertise and delivered consistent performance.
“Dimension Data’s engineers are well trained. They know the products very well. When a vendor comes outwith a new product that we have not been trained on yet, we use Dimension Data to help us with this kind ofimplementation as well. It has been very beneficial for us.” (VP of network engineering and provisioning,multinational insurance group)
“Dimension Data’s performance has been more than good. In the past 12 months, Dimension Data met ourSLA for the mean time to repair in 99.26% of the cases. It met the SLA for the mean time to respond 100% ofthe time. And this takes into account both scheduled and unscheduled requests.” (Partner management at aglobal communications and IT service provider)
Companies benefit from Dimension Data’s global purchasing power. The interviewed organizations alsoappreciate Dimension Data’s help in procuring network assets in different regions of the world whilebenefitting from Dimension Data’s discount structure with major vendors.
“We can buy in any region and we do not have to worry about shipping from one country to another,dealing with customs and all that. It just makes the whole procurement process a lot easier for our financialand procurement teams. It saves everybody a lot of time and headaches.” (VP of network engineering andprovisioning, multinational insurance group)
“The purchasing power that Dimension Data has with major partners is also something that we rely on andleverage. Of course, our organization also has some purchasing power, but it does not compare to thepurchasing power that Dimension Data has with these vendors.” (Director of managed services, globaltelecommunications and Internet service provider)
Companies see improved network reliability. As a result of their engagement with Dimension Data’s break-fix and more proactive support services, the interviewed organizations reported increased stability of theirnetwork infrastructure.
“Dimension Data is very proactive when looking at our environment, not only on the hardware but also onthe software side. They notify us when something is approaching end-of-support or end-of-life or when avendor recommends upgrading to a newer software version. We have seen the number of severity-onenetwork problems decline over the years because we are replacing older hardware and software. And some ofthat is certainly attributed to Dimension Data and their proactiveness.” (VP of network engineering andprovisioning, multinational insurance group)
Composite OrganizationBased on the interviews with these three existing customers provided by Dimension Data, Forrester constructed aTEI framework, a composite company, and an associated ROI analysis that illustrates the areas financially affected.The composite organization that Forrester synthesized from these results represents an international insurance andasset management organization based in the US with annual revenue of $12 billion. The company employs 40,000people in 200 locations (20 large, 80 medium, and 100 small sites) who serve customers in more than 100 countries.
Forrester Consulting
The Total Economic Impact Of Dimension Data’s Uptime Services
Page 9
The IT department works as a shared services organization and provides IT services to all of the group’s businessunits. One of the tasks of the operations team is to ensure that the network, which is seen as one of the most criticalIT assets, is up and running on a global level.
To cope with the challenges of a large geographical and technical scope, the group decided to outsource the break-fix maintenance and support of 10,000 network chassis across the US, Europe, and Asia to Dimension Data. Fourdifferent service levels were defined that depend on the criticality of the installed hardware. All new networkequipment is now purchased through Dimension Data. Achieved service levels are examined regularly in servicemanagement reports and during weekly, quarterly, and annual service management reviews. The company alsoprepurchases about 1,000 onsite MACDs per year that are used for various configuration changes; Dimension Dataconducts an annual assessment to help the company control its network infrastructure health and life cycle. SeeAppendix A for more details on the composite organization.
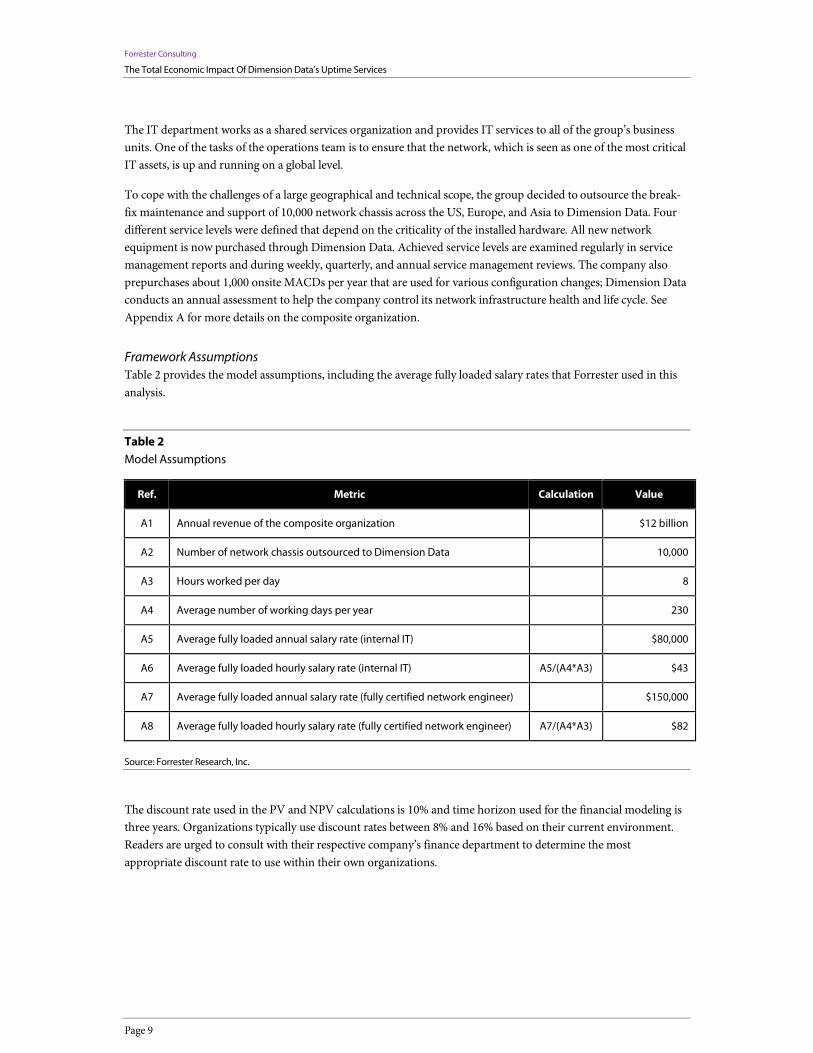
Framework AssumptionsTable 2 provides the model assumptions, including the average fully loaded salary rates that Forrester used in thisanalysis.
Table 2Model Assumptions
Ref. Metric Calculation Value
A1 Annual revenue of the composite organization $12 billion
A2 Number of network chassis outsourced to Dimension Data 10,000
A3 Hours worked per day 8
A4 Average number of working days per year 230
A5 Average fully loaded annual salary rate (internal IT) $80,000
A6 Average fully loaded hourly salary rate (internal IT) A5/(A4*A3) $43
A7 Average fully loaded annual salary rate (fully certified network engineer) $150,000
A8 Average fully loaded hourly salary rate (fully certified network engineer) A7/(A4*A3) $82
Source: Forrester Research, Inc.
The discount rate used in the PV and NPV calculations is 10% and time horizon used for the financial modeling isthree years. Organizations typically use discount rates between 8% and 16% based on their current environment.Readers are urged to consult with their respective company’s finance department to determine the mostappropriate discount rate to use within their own organizations.
Forrester Consulting
The Total Economic Impact Of Dimension Data’s Uptime Services
Page 10
CostsThis section describes and lists the incremental costs incurred by the composite organization for using DimensionData’s Uptime Services over a three-year period.
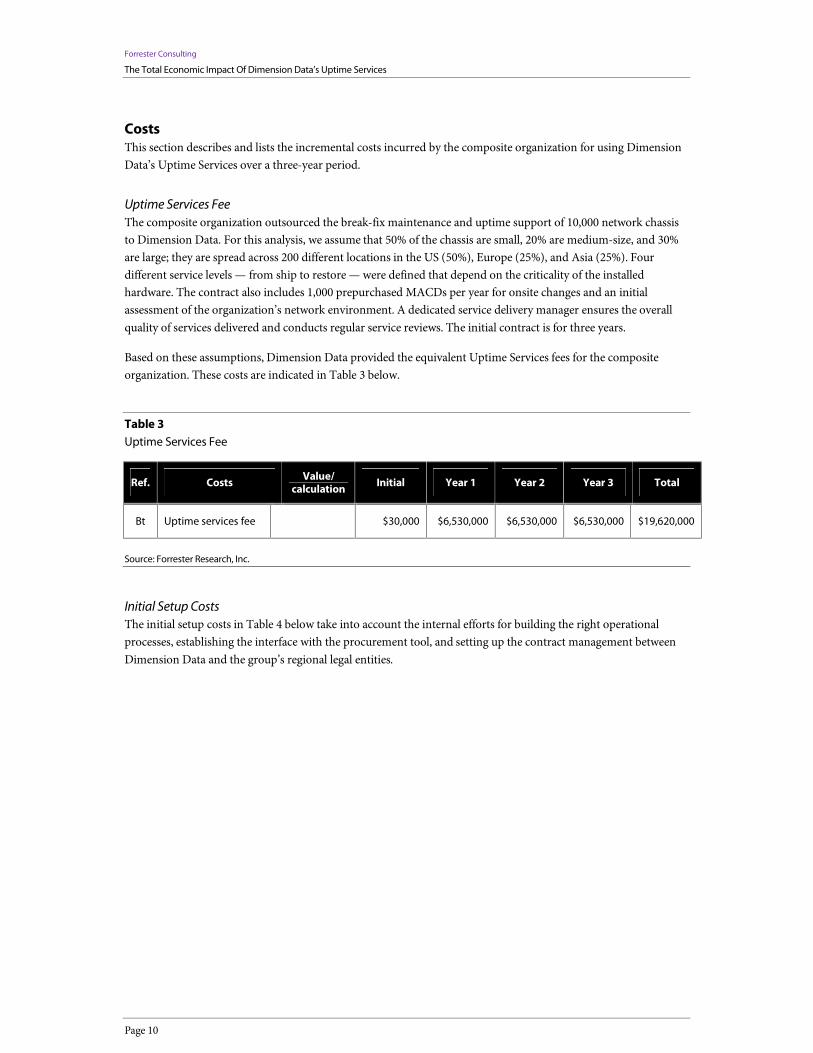
Uptime Services FeeThe composite organization outsourced the break-fix maintenance and uptime support of 10,000 network chassisto Dimension Data. For this analysis, we assume that 50% of the chassis are small, 20% are medium-size, and 30%are large; they are spread across 200 different locations in the US (50%), Europe (25%), and Asia (25%). Fourdifferent service levels — from ship to restore — were defined that depend on the criticality of the installedhardware. The contract also includes 1,000 prepurchased MACDs per year for onsite changes and an initialassessment of the organization’s network environment. A dedicated service delivery manager ensures the overallquality of services delivered and conducts regular service reviews. The initial contract is for three years.
Based on these assumptions, Dimension Data provided the equivalent Uptime Services fees for the compositeorganization. These costs are indicated in Table 3 below.
Table 3Uptime Services Fee
Ref. Costs Value/calculation Initial Year 1 Year 2 Year 3 Total
Bt Uptime services fee $30,000 $6,530,000 $6,530,000 $6,530,000 $19,620,000
Source: Forrester Research, Inc.
Initial Setup CostsThe initial setup costs in Table 4 below take into account the internal efforts for building the right operationalprocesses, establishing the interface with the procurement tool, and setting up the contract management betweenDimension Data and the group’s regional legal entities.
Forrester Consulting
The Total Economic Impact Of Dimension Data’s Uptime Services
Page 11
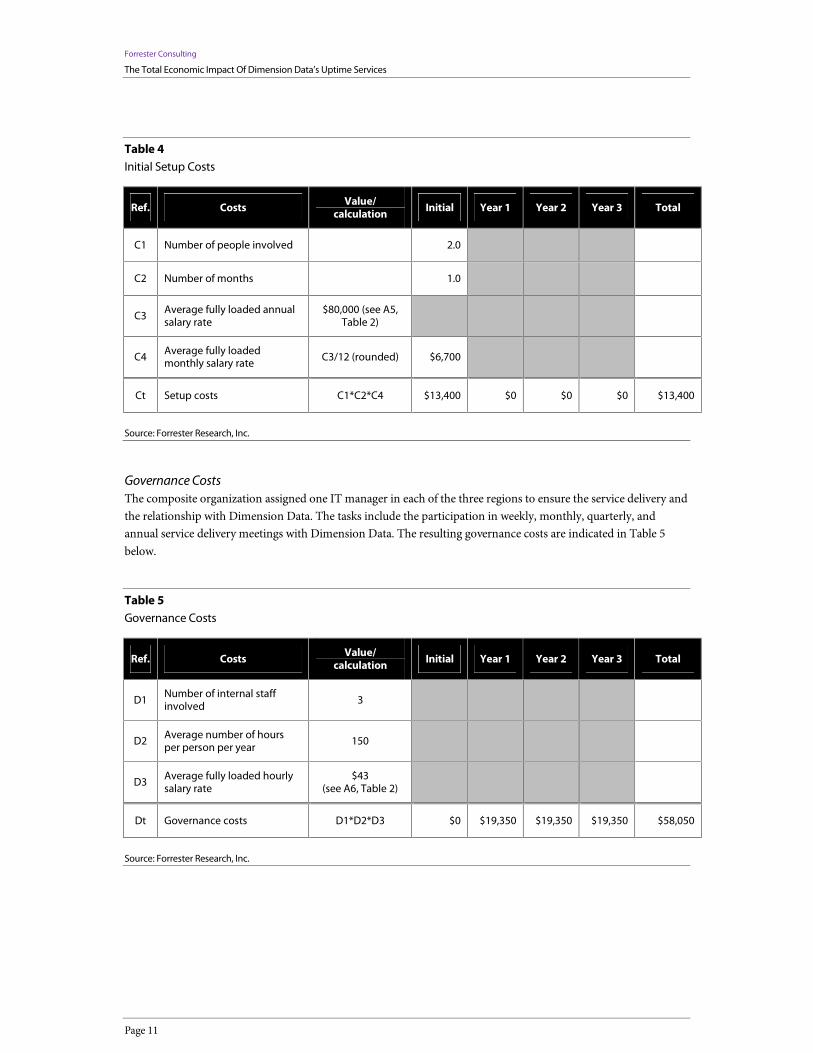
Table 4Initial Setup Costs
Ref. Costs Value/calculation Initial Year 1 Year 2 Year 3 Total
C1 Number of people involved 2.0
C2 Number of months 1.0
C3 Average fully loaded annualsalary rate
$80,000 (see A5,Table 2)
C4 Average fully loadedmonthly salary rate C3/12 (rounded) $6,700
Ct Setup costs C1*C2*C4 $13,400 $0 $0 $0 $13,400
Source: Forrester Research, Inc.
Governance CostsThe composite organization assigned one IT manager in each of the three regions to ensure the service delivery andthe relationship with Dimension Data. The tasks include the participation in weekly, monthly, quarterly, andannual service delivery meetings with Dimension Data. The resulting governance costs are indicated in Table 5below.
Table 5Governance Costs
Ref. Costs Value/calculation Initial Year 1 Year 2 Year 3 Total
D1Number of internal staffinvolved 3
D2 Average number of hoursper person per year
150
D3 Average fully loaded hourlysalary rate
$43(see A6, Table 2)
Dt Governance costs D1*D2*D3 $0 $19,350 $19,350 $19,350 $58,050
Source: Forrester Research, Inc.
Forrester Consulting
The Total Economic Impact Of Dimension Data’s Uptime Services
Page 12
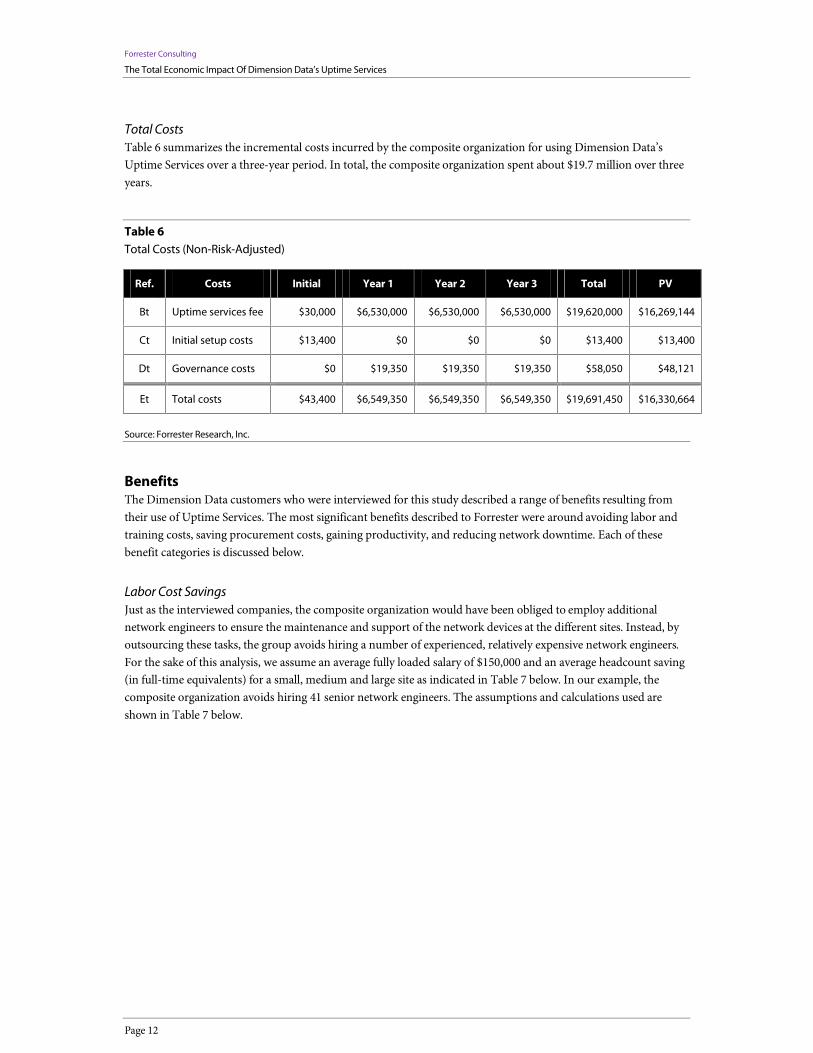
Total CostsTable 6 summarizes the incremental costs incurred by the composite organization for using Dimension Data’sUptime Services over a three-year period. In total, the composite organization spent about $19.7 million over threeyears.
Table 6Total Costs (Non-Risk-Adjusted)
Ref. Costs Initial Year 1 Year 2 Year 3 Total PV
Bt Uptime services fee $30,000 $6,530,000 $6,530,000 $6,530,000 $19,620,000 $16,269,144
Ct Initial setup costs $13,400 $0 $0 $0 $13,400 $13,400
Dt Governance costs $0 $19,350 $19,350 $19,350 $58,050 $48,121
Et Total costs $43,400 $6,549,350 $6,549,350 $6,549,350 $19,691,450 $16,330,664
Source: Forrester Research, Inc.
BenefitsThe Dimension Data customers who were interviewed for this study described a range of benefits resulting fromtheir use of Uptime Services. The most significant benefits described to Forrester were around avoiding labor andtraining costs, saving procurement costs, gaining productivity, and reducing network downtime. Each of thesebenefit categories is discussed below.
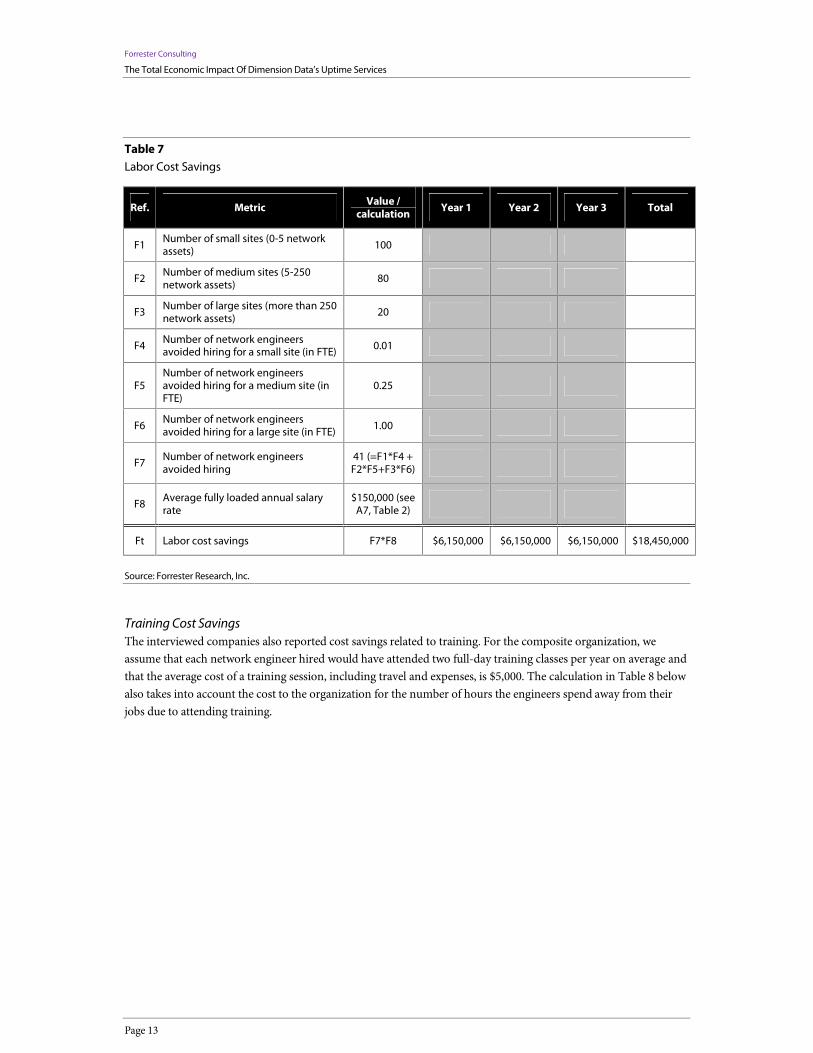
Labor Cost SavingsJust as the interviewed companies, the composite organization would have been obliged to employ additionalnetwork engineers to ensure the maintenance and support of the network devices at the different sites. Instead, byoutsourcing these tasks, the group avoids hiring a number of experienced, relatively expensive network engineers.For the sake of this analysis, we assume an average fully loaded salary of $150,000 and an average headcount saving(in full-time equivalents) for a small, medium and large site as indicated in Table 7 below. In our example, thecomposite organization avoids hiring 41 senior network engineers. The assumptions and calculations used areshown in Table 7 below.
Forrester Consulting
The Total Economic Impact Of Dimension Data’s Uptime Services
Page 13
Table 7Labor Cost Savings
Ref. Metric Value /calculation Year 1 Year 2 Year 3 Total
F1Number of small sites (0-5 networkassets) 100
F2 Number of medium sites (5-250network assets)
80
F3 Number of large sites (more than 250network assets)
20
F4 Number of network engineersavoided hiring for a small site (in FTE) 0.01
F5Number of network engineersavoided hiring for a medium site (inFTE)
0.25
F6Number of network engineersavoided hiring for a large site (in FTE) 1.00
F7 Number of network engineersavoided hiring
41 (=F1*F4 +F2*F5+F3*F6)
F8 Average fully loaded annual salaryrate
$150,000 (seeA7, Table 2)
Ft Labor cost savings F7*F8 $6,150,000 $6,150,000 $6,150,000 $18,450,000
Source: Forrester Research, Inc.
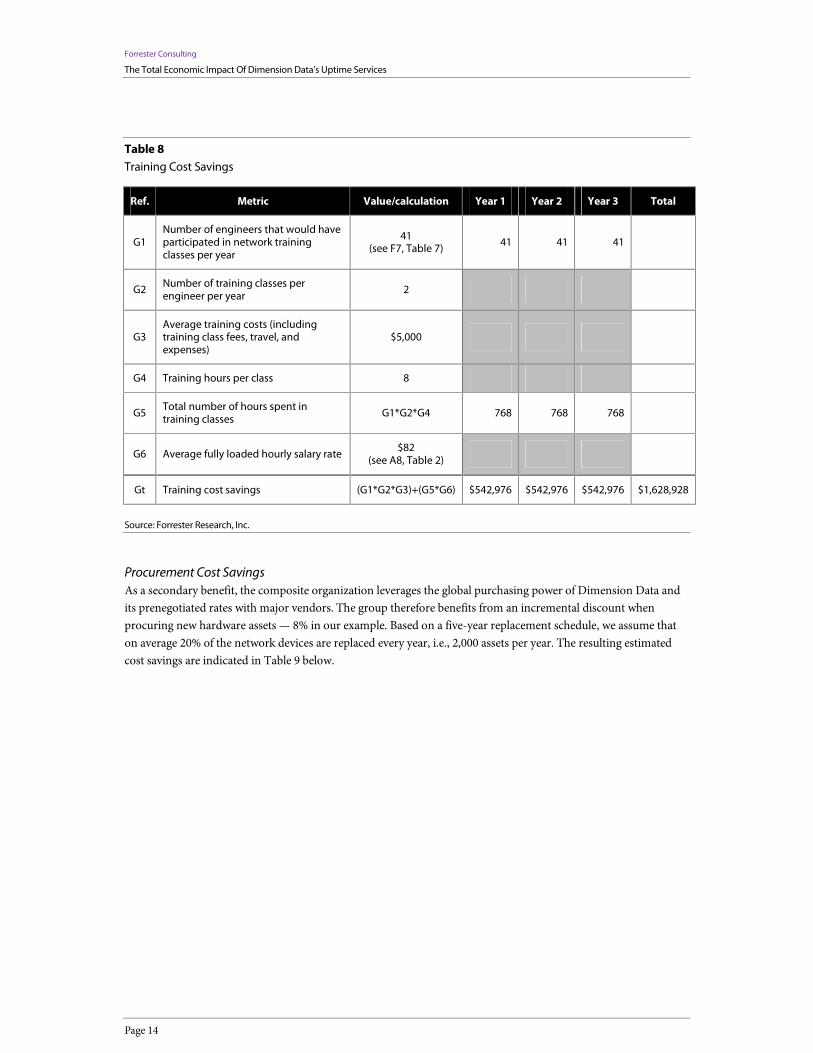
Training Cost SavingsThe interviewed companies also reported cost savings related to training. For the composite organization, weassume that each network engineer hired would have attended two full-day training classes per year on average andthat the average cost of a training session, including travel and expenses, is $5,000. The calculation in Table 8 belowalso takes into account the cost to the organization for the number of hours the engineers spend away from theirjobs due to attending training.
Forrester Consulting
The Total Economic Impact Of Dimension Data’s Uptime Services
Page 14
Table 8Training Cost Savings
Ref. Metric Value/calculation Year 1 Year 2 Year 3 Total
G1Number of engineers that would haveparticipated in network trainingclasses per year
41(see F7, Table 7) 41 41 41
G2 Number of training classes perengineer per year
2
G3Average training costs (includingtraining class fees, travel, andexpenses)
$5,000
G4 Training hours per class 8
G5Total number of hours spent intraining classes G1*G2*G4 768 768 768
G6 Average fully loaded hourly salary rate$82
(see A8, Table 2)
Gt Training cost savings (G1*G2*G3)+(G5*G6) $542,976 $542,976 $542,976 $1,628,928
Source: Forrester Research, Inc.
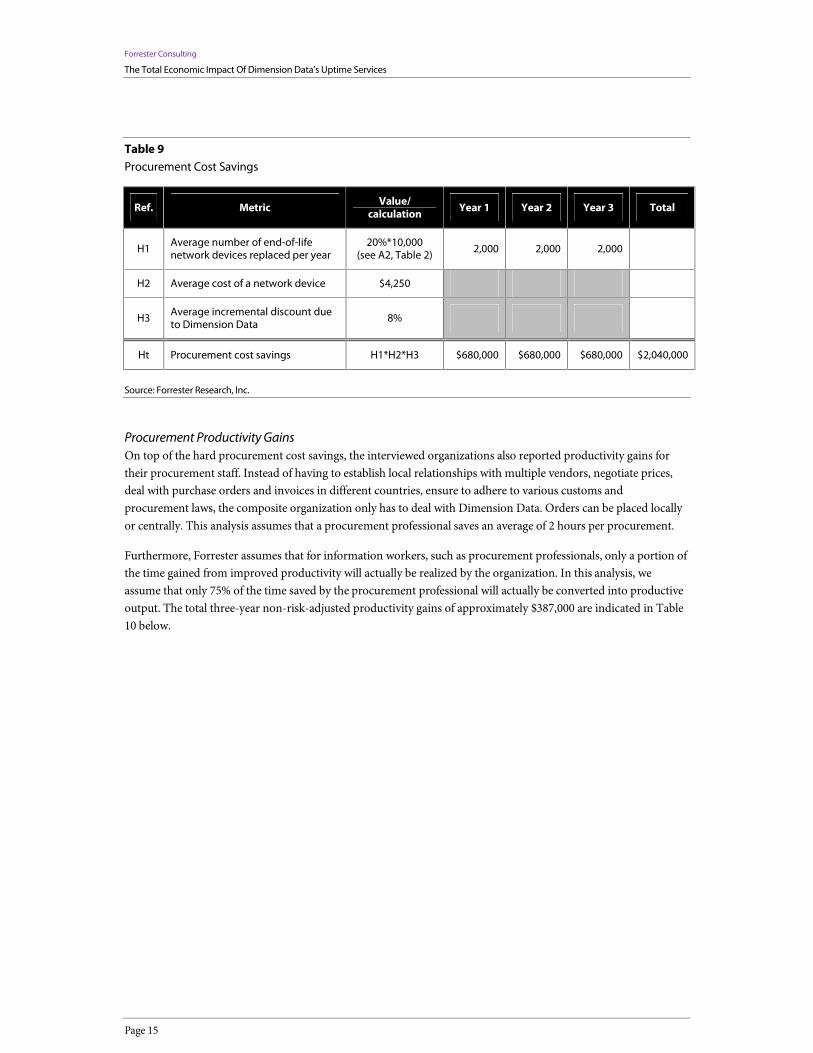
Procurement Cost SavingsAs a secondary benefit, the composite organization leverages the global purchasing power of Dimension Data andits prenegotiated rates with major vendors. The group therefore benefits from an incremental discount whenprocuring new hardware assets — 8% in our example. Based on a five-year replacement schedule, we assume thaton average 20% of the network devices are replaced every year, i.e., 2,000 assets per year. The resulting estimatedcost savings are indicated in Table 9 below.
Forrester Consulting
The Total Economic Impact Of Dimension Data’s Uptime Services
Page 15
Table 9Procurement Cost Savings
Ref. Metric Value/calculation Year 1 Year 2 Year 3 Total
H1Average number of end-of-lifenetwork devices replaced per year
20%*10,000(see A2, Table 2) 2,000 2,000 2,000
H2 Average cost of a network device $4,250
H3 Average incremental discount dueto Dimension Data
8%
Ht Procurement cost savings H1*H2*H3 $680,000 $680,000 $680,000 $2,040,000
Source: Forrester Research, Inc.
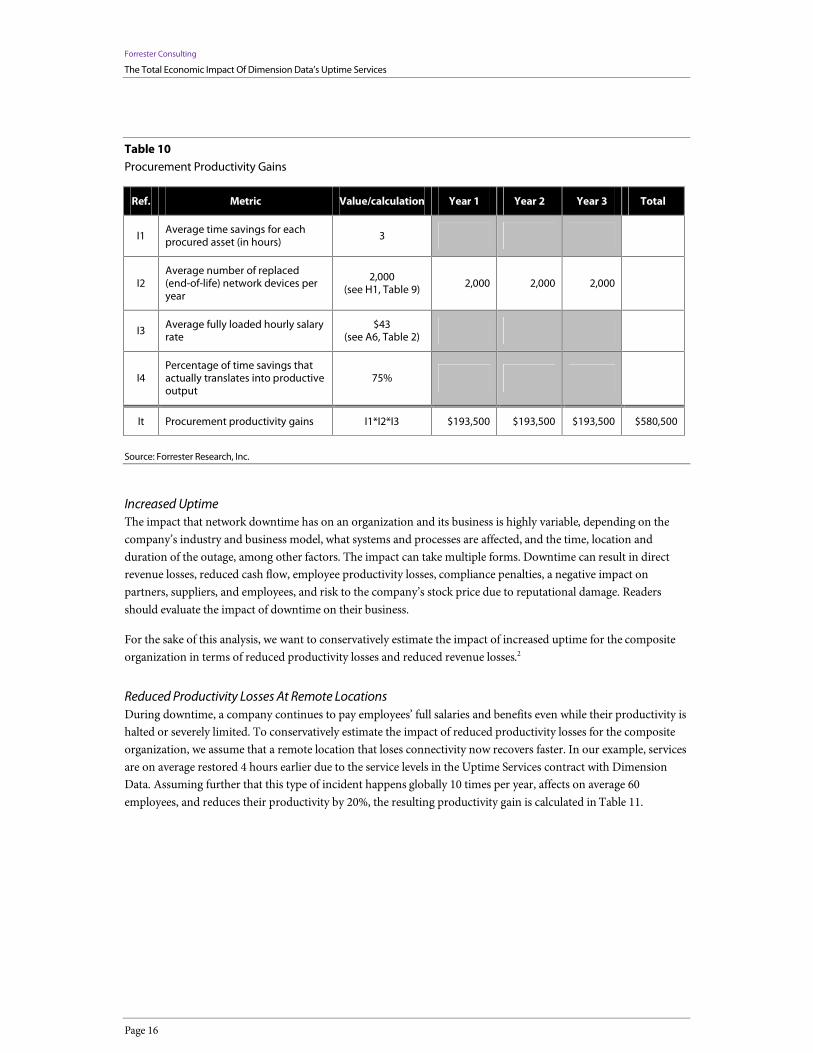
Procurement Productivity GainsOn top of the hard procurement cost savings, the interviewed organizations also reported productivity gains fortheir procurement staff. Instead of having to establish local relationships with multiple vendors, negotiate prices,deal with purchase orders and invoices in different countries, ensure to adhere to various customs andprocurement laws, the composite organization only has to deal with Dimension Data. Orders can be placed locallyor centrally. This analysis assumes that a procurement professional saves an average of 2 hours per procurement.
Furthermore, Forrester assumes that for information workers, such as procurement professionals, only a portion ofthe time gained from improved productivity will actually be realized by the organization. In this analysis, weassume that only 75% of the time saved by the procurement professional will actually be converted into productiveoutput. The total three-year non-risk-adjusted productivity gains of approximately $387,000 are indicated in Table10 below.
Forrester Consulting
The Total Economic Impact Of Dimension Data’s Uptime Services
Page 16
Table 10Procurement Productivity Gains
Ref. Metric Value/calculation Year 1 Year 2 Year 3 Total
I1Average time savings for eachprocured asset (in hours) 3
I2Average number of replaced(end-of-life) network devices peryear
2,000(see H1, Table 9) 2,000 2,000 2,000
I3 Average fully loaded hourly salaryrate
$43(see A6, Table 2)
I4Percentage of time savings thatactually translates into productiveoutput
75%
It Procurement productivity gains I1*I2*I3 $193,500 $193,500 $193,500 $580,500
Source: Forrester Research, Inc.
Increased UptimeThe impact that network downtime has on an organization and its business is highly variable, depending on thecompany’s industry and business model, what systems and processes are affected, and the time, location andduration of the outage, among other factors. The impact can take multiple forms. Downtime can result in directrevenue losses, reduced cash flow, employee productivity losses, compliance penalties, a negative impact onpartners, suppliers, and employees, and risk to the company’s stock price due to reputational damage. Readersshould evaluate the impact of downtime on their business.
For the sake of this analysis, we want to conservatively estimate the impact of increased uptime for the compositeorganization in terms of reduced productivity losses and reduced revenue losses.2
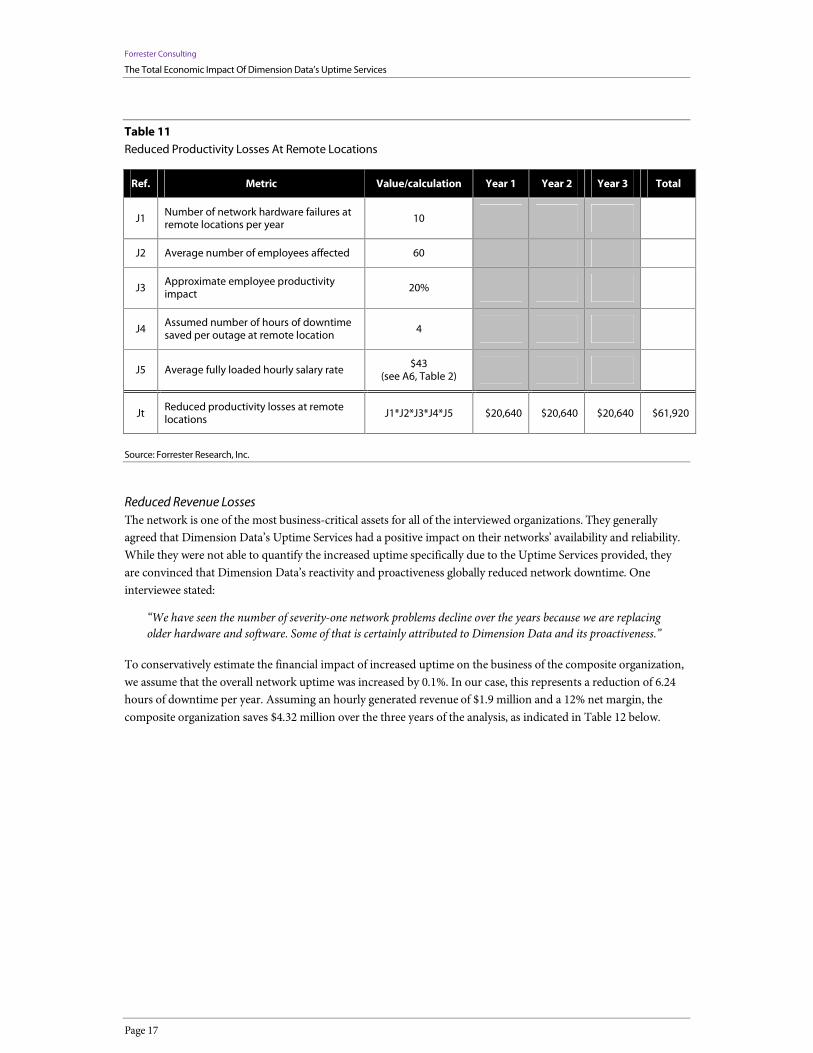
Reduced Productivity Losses At Remote LocationsDuring downtime, a company continues to pay employees’ full salaries and benefits even while their productivity ishalted or severely limited. To conservatively estimate the impact of reduced productivity losses for the compositeorganization, we assume that a remote location that loses connectivity now recovers faster. In our example, servicesare on average restored 4 hours earlier due to the service levels in the Uptime Services contract with DimensionData. Assuming further that this type of incident happens globally 10 times per year, affects on average 60employees, and reduces their productivity by 20%, the resulting productivity gain is calculated in Table 11.
Forrester Consulting
The Total Economic Impact Of Dimension Data’s Uptime Services
Page 17
Table 11Reduced Productivity Losses At Remote Locations
Ref. Metric Value/calculation Year 1 Year 2 Year 3 Total
J1 Number of network hardware failures atremote locations per year 10
J2 Average number of employees affected 60
J3Approximate employee productivityimpact 20%
J4Assumed number of hours of downtimesaved per outage at remote location 4
J5 Average fully loaded hourly salary rate $43(see A6, Table 2)
JtReduced productivity losses at remotelocations J1*J2*J3*J4*J5 $20,640 $20,640 $20,640 $61,920
Source: Forrester Research, Inc.
Reduced Revenue LossesThe network is one of the most business-critical assets for all of the interviewed organizations. They generallyagreed that Dimension Data’s Uptime Services had a positive impact on their networks’ availability and reliability.While they were not able to quantify the increased uptime specifically due to the Uptime Services provided, theyare convinced that Dimension Data’s reactivity and proactiveness globally reduced network downtime. Oneinterviewee stated:
“We have seen the number of severity-one network problems decline over the years because we are replacingolder hardware and software. Some of that is certainly attributed to Dimension Data and its proactiveness.”
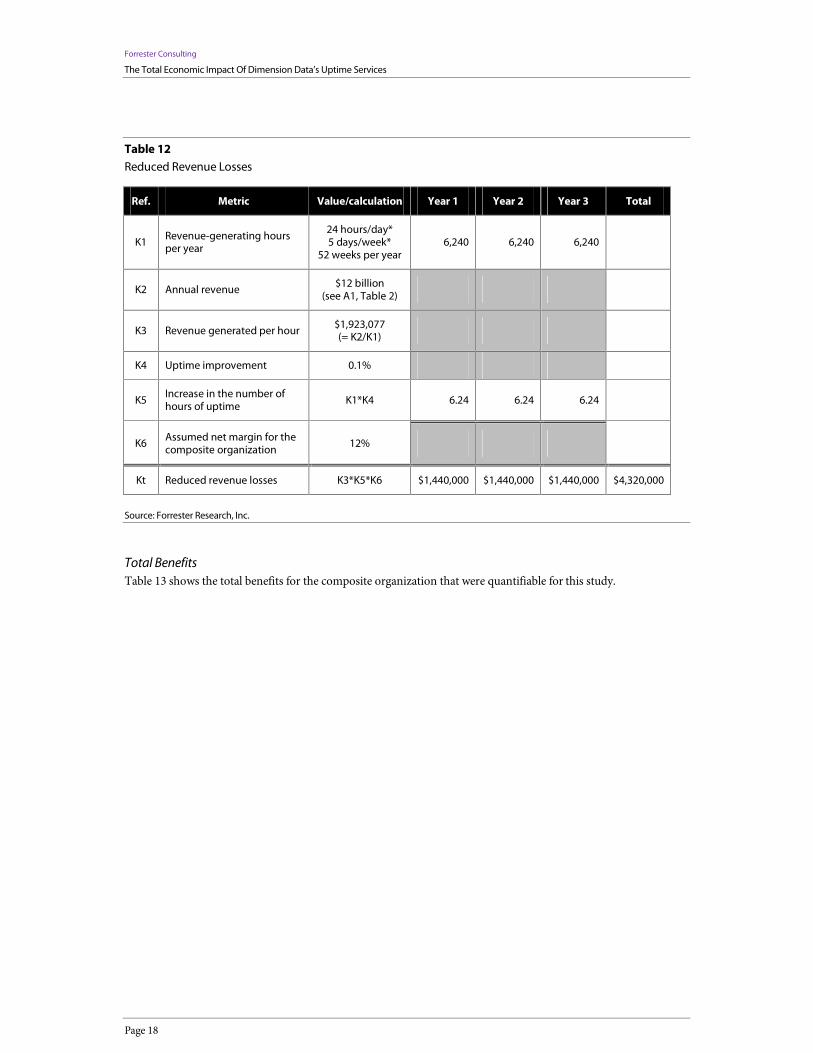
To conservatively estimate the financial impact of increased uptime on the business of the composite organization,we assume that the overall network uptime was increased by 0.1%. In our case, this represents a reduction of 6.24hours of downtime per year. Assuming an hourly generated revenue of $1.9 million and a 12% net margin, thecomposite organization saves $4.32 million over the three years of the analysis, as indicated in Table 12 below.
Forrester Consulting
The Total Economic Impact Of Dimension Data’s Uptime Services
Page 18
Table 12Reduced Revenue Losses
Ref. Metric Value/calculation Year 1 Year 2 Year 3 Total
K1 Revenue-generating hoursper year
24 hours/day*5 days/week*
52 weeks per year6,240 6,240 6,240
K2 Annual revenue $12 billion(see A1, Table 2)
K3 Revenue generated per hour $1,923,077(= K2/K1)
K4 Uptime improvement 0.1%
K5Increase in the number ofhours of uptime K1*K4 6.24 6.24 6.24
K6 Assumed net margin for thecomposite organization
12%
Kt Reduced revenue losses K3*K5*K6 $1,440,000 $1,440,000 $1,440,000 $4,320,000
Source: Forrester Research, Inc.
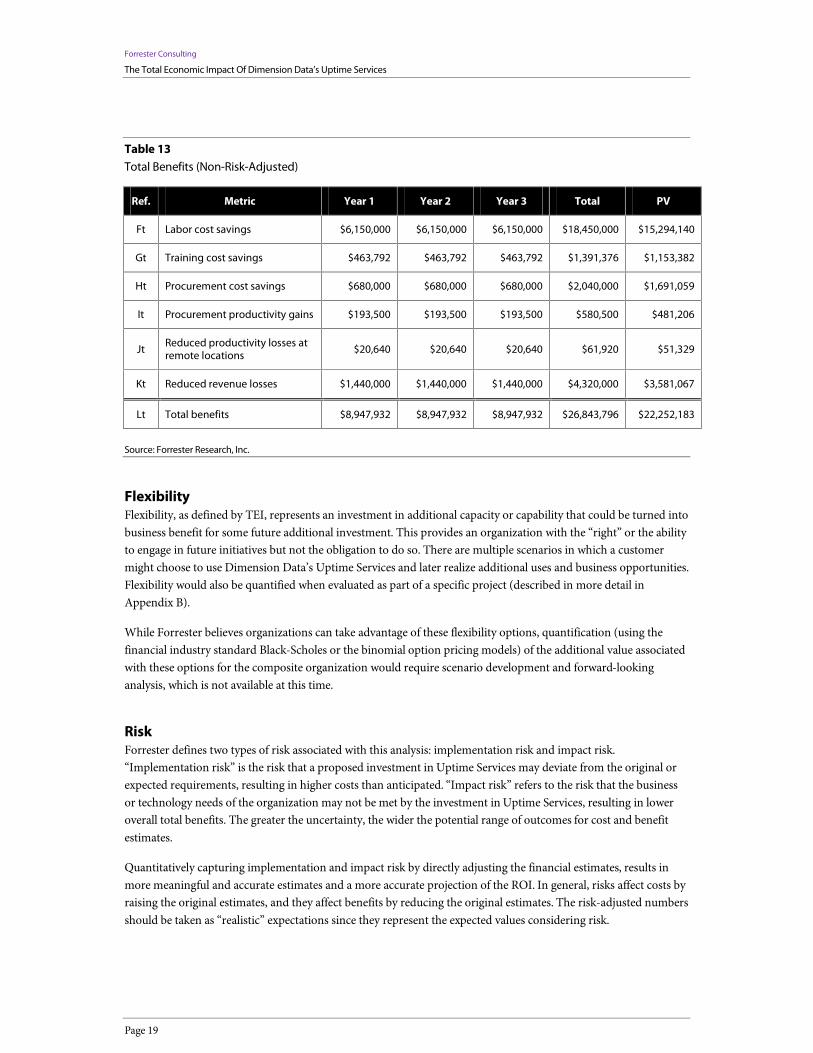
Total BenefitsTable 13 shows the total benefits for the composite organization that were quantifiable for this study.
Forrester Consulting
The Total Economic Impact Of Dimension Data’s Uptime Services
Page 19
Table 13Total Benefits (Non-Risk-Adjusted)
Ref. Metric Year 1 Year 2 Year 3 Total PV
Ft Labor cost savings $6,150,000 $6,150,000 $6,150,000 $18,450,000 $15,294,140
Gt Training cost savings $463,792 $463,792 $463,792 $1,391,376 $1,153,382
Ht Procurement cost savings $680,000 $680,000 $680,000 $2,040,000 $1,691,059
It Procurement productivity gains $193,500 $193,500 $193,500 $580,500 $481,206
JtReduced productivity losses atremote locations $20,640 $20,640 $20,640 $61,920 $51,329
Kt Reduced revenue losses $1,440,000 $1,440,000 $1,440,000 $4,320,000 $3,581,067
Lt Total benefits $8,947,932 $8,947,932 $8,947,932 $26,843,796 $22,252,183
Source: Forrester Research, Inc.
FlexibilityFlexibility, as defined by TEI, represents an investment in additional capacity or capability that could be turned intobusiness benefit for some future additional investment. This provides an organization with the “right” or the abilityto engage in future initiatives but not the obligation to do so. There are multiple scenarios in which a customermight choose to use Dimension Data’s Uptime Services and later realize additional uses and business opportunities.Flexibility would also be quantified when evaluated as part of a specific project (described in more detail inAppendix B).
While Forrester believes organizations can take advantage of these flexibility options, quantification (using thefinancial industry standard Black-Scholes or the binomial option pricing models) of the additional value associatedwith these options for the composite organization would require scenario development and forward-lookinganalysis, which is not available at this time.
RiskForrester defines two types of risk associated with this analysis: implementation risk and impact risk.“Implementation risk” is the risk that a proposed investment in Uptime Services may deviate from the original orexpected requirements, resulting in higher costs than anticipated. “Impact risk” refers to the risk that the businessor technology needs of the organization may not be met by the investment in Uptime Services, resulting in loweroverall total benefits. The greater the uncertainty, the wider the potential range of outcomes for cost and benefitestimates.
Quantitatively capturing implementation and impact risk by directly adjusting the financial estimates, results inmore meaningful and accurate estimates and a more accurate projection of the ROI. In general, risks affect costs byraising the original estimates, and they affect benefits by reducing the original estimates. The risk-adjusted numbersshould be taken as “realistic” expectations since they represent the expected values considering risk.
Forrester Consulting
The Total Economic Impact Of Dimension Data’s Uptime Services
Page 20
The following implementation risks that affect costs have been identified as part of this analysis:
The annual Uptime Service fee is based on high-level assumptions about the geographical and technicalscope covered and might be higher than originally estimated.
The amount of internal effort required to establish the initial inventory and define the various processes withDimension Data depends on the company’s previous experience with working with service providers andmight be higher than originally estimated.
The assumed number of hours spent in regular governance meetings and the assumed number of peopleinvolved might be higher than originally estimated.
The following impact risks that affect benefits have been identified as part of the analysis:
The number of network engineers that did not need to be hired is based on high-level assumptions about thegeographical and technical scope and might be smaller than originally estimated.
The training costs that can be saved over the three years of the analysis depend, among other things, on thenetwork engineer turnover rate and might be lower than anticipated.
The estimated procurement cost savings depend on the level of discount that the organization had prior tothe engagement with Dimension Data and might be lower the originally estimated.
Procurement productivity gains depend on the ability of the concerned staff to reallocate their timeproductively.
The reduced productivity loss at remote locations and the reduced revenue loss are based on high-levelassumptions; the impact of Uptime Services might be smaller than originally estimated.
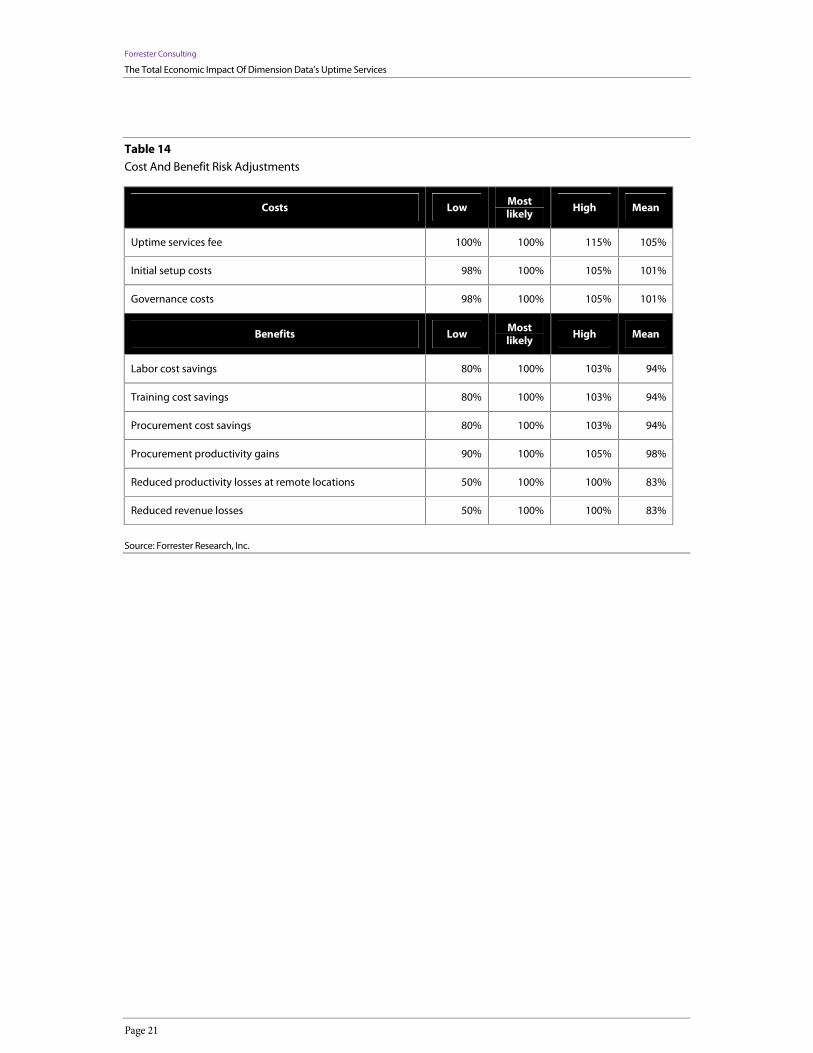
Table 14 shows the values used to adjust for risk and uncertainty in the cost and benefit estimates. The TEI modeluses a triangular distribution method to calculate risk-adjusted values. To construct the distribution, it is necessaryto first estimate the low, most likely, and high values that could occur within the current environment. The risk-adjusted value is the mean of the distribution of those points. Readers are urged to apply their own risk rangesbased on their own degree of confidence in the cost and benefit estimates.
Forrester Consulting
The Total Economic Impact Of Dimension Data’s Uptime Services
Page 21
Table 14Cost And Benefit Risk Adjustments
Costs Low Mostlikely High Mean
Uptime services fee 100% 100% 115% 105%
Initial setup costs 98% 100% 105% 101%
Governance costs 98% 100% 105% 101%
Benefits Low Mostlikely High Mean
Labor cost savings 80% 100% 103% 94%
Training cost savings 80% 100% 103% 94%
Procurement cost savings 80% 100% 103% 94%
Procurement productivity gains 90% 100% 105% 98%
Reduced productivity losses at remote locations 50% 100% 100% 83%
Reduced revenue losses 50% 100% 100% 83%
Source: Forrester Research, Inc.
Forrester Consulting
The Total Economic Impact Of Dimension Data’s Uptime Services
Page 22
Financial Summary
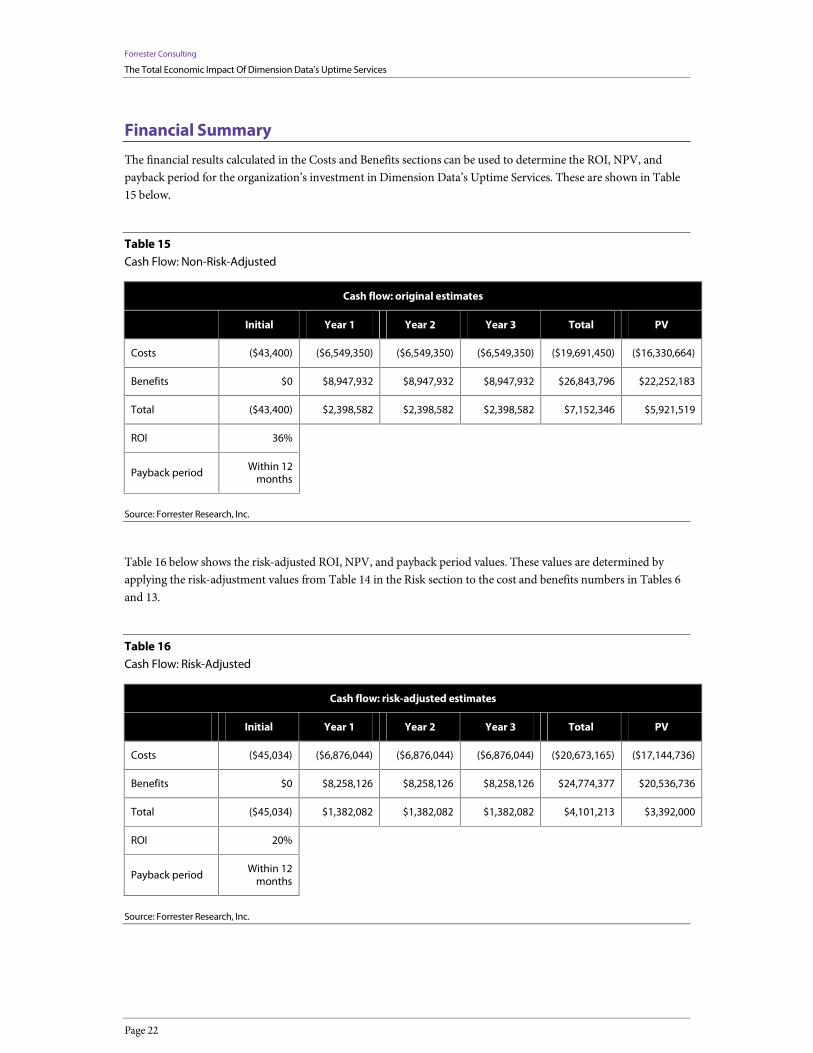
The financial results calculated in the Costs and Benefits sections can be used to determine the ROI, NPV, andpayback period for the organization’s investment in Dimension Data’s Uptime Services. These are shown in Table15 below.
Table 15Cash Flow: Non-Risk-Adjusted
Cash flow: original estimates
Initial Year 1 Year 2 Year 3 Total PV
Costs ($43,400) ($6,549,350) ($6,549,350) ($6,549,350) ($19,691,450) ($16,330,664)
Benefits $0 $8,947,932 $8,947,932 $8,947,932 $26,843,796 $22,252,183
Total ($43,400) $2,398,582 $2,398,582 $2,398,582 $7,152,346 $5,921,519
ROI 36%
Payback period Within 12months
Source: Forrester Research, Inc.
Table 16 below shows the risk-adjusted ROI, NPV, and payback period values. These values are determined byapplying the risk-adjustment values from Table 14 in the Risk section to the cost and benefits numbers in Tables 6and 13.
Table 16Cash Flow: Risk-Adjusted
Cash flow: risk-adjusted estimates
Initial Year 1 Year 2 Year 3 Total PV
Costs ($45,034) ($6,876,044) ($6,876,044) ($6,876,044) ($20,673,165) ($17,144,736)
Benefits $0 $8,258,126 $8,258,126 $8,258,126 $24,774,377 $20,536,736
Total ($45,034) $1,382,082 $1,382,082 $1,382,082 $4,101,213 $3,392,000
ROI 20%
Payback period Within 12months
Source: Forrester Research, Inc.
Forrester Consulting
The Total Economic Impact Of Dimension Data’s Uptime Services
Page 23
Dimension Data Uptime Services: Overview
According to Dimension Data, Uptime Services provide a cost-effective way of handling resource constraints byaccessing the right IT resource for the environment at the right time. Through Uptime Maintenance, DimensionData teams not only handle faults and restore IT products across multiple vendors and their technologies, but theyalso make the fix within a set response or result time that is agreed with the client. However, their view is thatadding value to the IT environment means moving away from break-fix maintenance and becoming proactive inthe approach to IT support. With Uptime Support from Dimension Data, clients can make this leap without thecapital expense of employing additional experts in-house.
Dimension Data has capabilities in aggregating, maintaining and supporting IT vendors and their technologiesacross the globe:
Uptime Maintenance. Dimension Data monitors device availability, tracks IT assets, and restores faileddevices to working order within agreed response times. The service focuses on ensuring that the client’s ITinfrastructure is available for business and that the client has control over the assets in the environment at alltimes. The client relies on Dimension Data to return to service any IT asset under contract that is notoperating properly in some way. A repair can be anything from a simple device replacement to a fullreconfiguration of the asset. A client with a maintenance contract can expect Dimension Data to 1) managethe client call (from call logging to call closure); 2) ensure full management of the response to the client’sservice request (including all actions needed to fulfill the service request, whether performed directly byDimension Data or a third party on its behalf); and 3) ensure that the client’s service request is closed uponrestoration (restoration meaning that the agreed commitment between Dimension Data and the client ismet). Multivendor service aggregation forms part of this service where Dimension Data provides a singlepoint of contact from a service delivery and commercial perspective, managing calls with vendors as well asvendor contracts on behalf of the client. This helps the client minimize the number of interfaces its ITresources have to deal with for service requests, reducing the complexity and challenges of managingmultiple service delivery partners.
Uptime Support. Dimension Data provides access to skills that offer expert technical advice and performproactive activities within the client’s IT environment. Support services include Dimension Data providing(scheduled or on-request) technical advice, expert technical assistance, management of MACDs, and thefulfillment of periodic assessments and trend analysis. Providing transparent service to the client is achievedthrough regular meetings with Dimension Data service delivery managers and ensures that the client doesnot only get visibility into the state of the environment, but also receives recommendations to help it plan forand improve the IT environment on an ongoing basis.
Forrester Consulting
The Total Economic Impact Of Dimension Data’s Uptime Services
Page 24
Appendix A: Composite Organization Description
For this TEI study, Forrester has created a composite organization to illustrate the quantifiable costs and benefits ofusing Dimension Data’s Uptime Services. The composite company is intended to represent an internationalinsurance and asset management organization and is based on characteristics of the interviewed customers. Thiscomposite organization is based in the US and has annual revenue of $12 billion. The group employs 40,000 peoplein 200 locations (20 large, 80 medium, and 100 small sites) who serve customers in more than 100 countries.
The group’s IT department works as a shared services organization, providing IT services to all of the group’sbusiness units. Most of the IT staff is located at the head office, the largest regional offices, and near the group’s datacenters. One of the tasks of the operations team is to ensure that the network, which is seen as one of the mostcritical IT assets, is up and running on a global level. The entire insurance process — from product development todistribution, service, claims, and settlement — depends on it.
To cope with the challenges of a large geographical and technical scope, the group decided to sign an UptimeServices contract with Dimension Data for its most critical network assets. While there is network equipment fromvarious vendors, the majority of devices are from Cisco Systems. The responsibility for the break-fix maintenanceand support of 10,000 network chassis (50% small, 20% medium-size, 30% large) across 200 locations in the US(50%), Europe (25%), and Asia (25%) was given to Dimension Data. Four different service levels were defineddepending on the criticality of the installed hardware. The company has one central point of contact for all requestsin the US, but can also place orders and request locally in the various regions. The achieved service levels areexamined regularly in service management reports and during weekly, quarterly, and annual service managementreviews. The company also prepurchases about 1,000 on-site MACDs per year that are used for variousconfiguration changes; Dimension Data conducts an annual assessment to help the company control its networkinfrastructure health and life cycle.
Appendix B: Total Economic Impact™ Overview
Total Economic Impact is a methodology developed by Forrester Research that enhances a company’s technologydecision-making processes and assists vendors in communicating the value proposition of their products andservices to clients. The TEI methodology helps companies demonstrate, justify, and realize the tangible value of ITinitiatives to both senior management and other key business stakeholders.
The TEI methodology consists of four components to evaluate investment value: benefits, costs, risks, andflexibility.
BenefitsBenefits represent the value delivered to the user organization — IT and/or business units — by the proposedproduct or project. Often product or project justification exercises focus just on IT cost and cost reduction, leavinglittle room to analyze the effect of the technology on the entire organization. The TEI methodology and theresulting financial model place equal weight on the measure of benefits and the measure of costs, allowing for a fullexamination of the effect of the technology on the entire organization. Calculation of benefit estimates involves aclear dialogue with the user organization to understand the specific value that is created. In addition, Forrester alsorequires that there be a clear line of accountability established between the measurement and justification of benefit
Forrester Consulting
The Total Economic Impact Of Dimension Data’s Uptime Services
Page 25
estimates after the project has been completed. This ensures that benefit estimates tie back directly to the bottomline.
CostsCosts represent the investment necessary to capture the value, or benefits, of the proposed project. IT or thebusiness units may incur costs in the form of fully burdened labor, subcontractors, or materials. Costs consider allthe investments and expenses necessary to deliver the proposed value. In addition, the cost category within TEIcaptures any incremental costs over the existing environment for ongoing costs associated with the solution. Allcosts must be tied to the benefits that are created.
RiskRisk measures the uncertainty of benefit and cost estimates contained within the investment. Uncertainty ismeasured in two ways: 1) the likelihood that the cost and benefit estimates will meet the original projections, and 2)the likelihood that the estimates will be measured and tracked over time. TEI applies a probability density functionknown as “triangular distribution” to the values entered. At minimum, three values are calculated to estimate theunderlying range around each cost and benefit.
FlexibilityWithin the TEI methodology, direct benefits represent one part of the investment value. While direct benefits cantypically be the primary way to justify a project, Forrester believes that organizations should be able to measure thestrategic value of an investment. Flexibility represents the value that can be obtained for some future additionalinvestment building on top of the initial investment already made. For instance, an investment in an enterprisewideupgrade of an office productivity suite can potentially increase standardization (to increase efficiency) and reducelicensing costs. However, an embedded collaboration feature may translate to greater worker productivity ifactivated. The collaboration can only be used with additional investment in training at some future point in time.However, having the ability to capture that benefit has a present value that can be estimated. The flexibilitycomponent of TEI captures that value.
Appendix C: Glossary
Discount rate: The interest rate used in cash flow analysis to take into account the time value of money. Althoughthe Federal Reserve Bank sets a discount rate, companies often set a discount rate based on their business andinvestment environment. Forrester assumes a yearly discount rate of 10% for this analysis. Organizations typicallyuse discount rates between 8% and 16% based on their current environment. Readers are urged to consult theirrespective organization to determine the most appropriate discount rate to use in their own environment.
Net present value (NPV): The present or current value of (discounted) future net cash flows given an interest rate(the discount rate). A positive project NPV normally indicates that the investment should be made, unless otherprojects have higher NPVs.
Present value (PV): The present or current value of (discounted) cost and benefit estimates given at an interest rate(the discount rate). The PV of costs and benefits feed into the total net present value of cash flows.
Payback period: The breakeven point for an investment is the point in time at which net benefits (benefits minuscosts) equal initial investment or cost.
Forrester Consulting
The Total Economic Impact Of Dimension Data’s Uptime Services
Page 26
Return on investment (ROI): A measure of a project’s expected return in percentage terms. ROI is calculated bydividing net benefits (benefits minus costs) by costs.
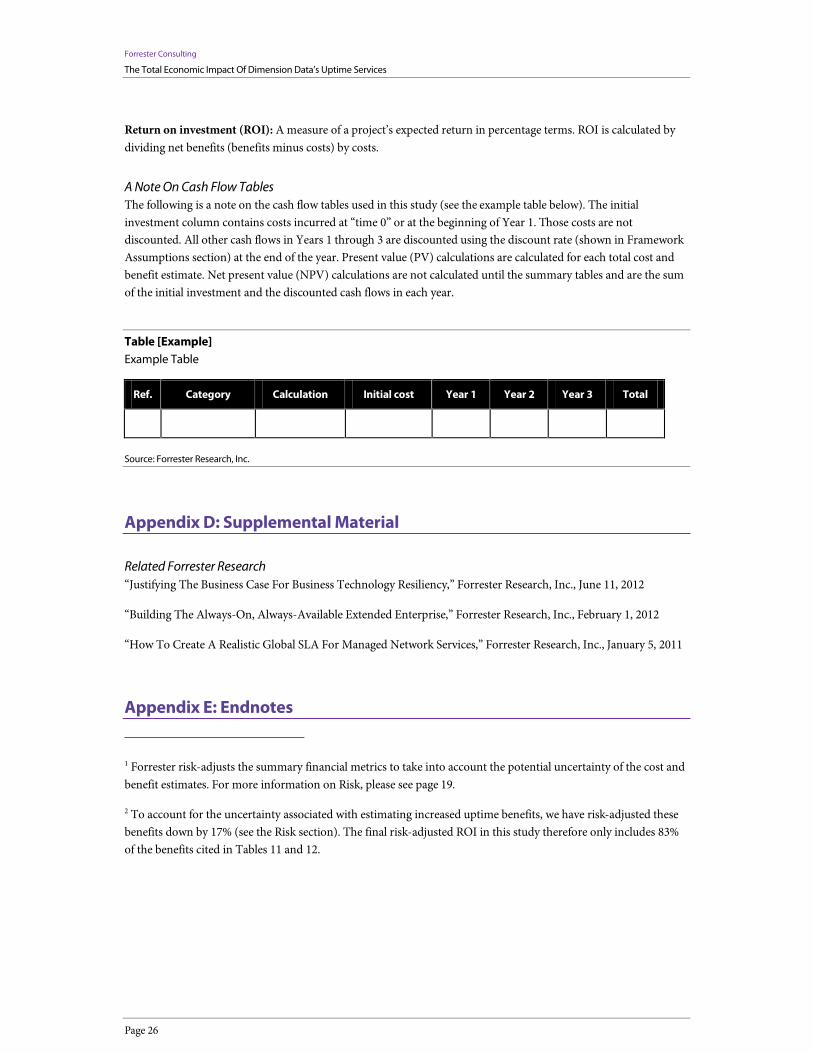
A Note On Cash Flow TablesThe following is a note on the cash flow tables used in this study (see the example table below). The initialinvestment column contains costs incurred at “time 0” or at the beginning of Year 1. Those costs are notdiscounted. All other cash flows in Years 1 through 3 are discounted using the discount rate (shown in FrameworkAssumptions section) at the end of the year. Present value (PV) calculations are calculated for each total cost andbenefit estimate. Net present value (NPV) calculations are not calculated until the summary tables and are the sumof the initial investment and the discounted cash flows in each year.
Table [Example]Example Table
Ref. Category Calculation Initial cost Year 1 Year 2 Year 3 Total
Source: Forrester Research, Inc.
Appendix D: Supplemental Material
Related Forrester Research“Justifying The Business Case For Business Technology Resiliency,” Forrester Research, Inc., June 11, 2012
“Building The Always-On, Always-Available Extended Enterprise,” Forrester Research, Inc., February 1, 2012
“How To Create A Realistic Global SLA For Managed Network Services,” Forrester Research, Inc., January 5, 2011
Appendix E: Endnotes
1 Forrester risk-adjusts the summary financial metrics to take into account the potential uncertainty of the cost andbenefit estimates. For more information on Risk, please see page 19.
2 To account for the uncertainty associated with estimating increased uptime benefits, we have risk-adjusted thesebenefits down by 17% (see the Risk section). The final risk-adjusted ROI in this study therefore only includes 83%of the benefits cited in Tables 11 and 12.