“The Prophet”, Gibran Khalil...
47
Annual Report 2001 And to love life through labour, is to be intimate with life’s inmost secret. “The Prophet”, Gibran Khalil Gibran.
Transcript of “The Prophet”, Gibran Khalil...

Annual Report 2001
And to love life through labour, is to beintimate with life’s inmost secret.
“The Prophet”, Gibran Khalil Gibran.

Board of Directors
Ali K. Al-Husry
Fayiz M. Soheimat
Shaker Bin ZeidGeneral Manager / New Work Company
Bassem K. SalemGeneral Manager / Packaging Inductries Company
Mohammed M. El-SeifChairman / El-Seif Development Company
Said S. DarwazahChairman / Hikma Investment
Investment & Integrated Industries Company represented byChairman / Elia C. Nuqul
Social Security Corporation reperesented byMem. of the Board of Directors / Yehya Abu Ersheid
Arab Potash Company represented byJordan Investment Corporation representative / Nabih Salameh
Jordan Phosphate Mines Company represented byDeputy Managing Director for Finance / Marwan Rishaydat
Jordan Loan Guarantee Corporation represented byGeneral Manager / Mohammed Said Hamami
Bayader Trade & Investment Company Ltd. represented byChairman / Amer M. Fariz
Jaloul Trade & Investment Company represented byGeneral Manager / Mohamed Saleh Hourani
Chairman
Vice Chairman
Members
EXPORT & FINANCE BANK (EFB) aims to be:
- The first class provider of comprehensive commercial and investment banking services.
- The Bank with the innovative edge in Jordan.
- The preferred choice for exporters, corporate clients and talented employees.
- A major contributor to the growth and development of Jordan's capital market.
EFB's core values are dedication to clients, maximization ofemployees' potential and provision of superior services.
EFB’s Mission Statement
Chairman & Chief Executive’s Statement
On behalf of the Board of Directors, I am pleased to present the Sixth Annual Report of the Export &
Finance Bank covering the financial year ending December 31, 2001. The year 2001 will go down as
a landmark year for the Export & Finance Bank. We have produced another remarkable set of
results in an increasingly competitive marketplace. Net profits were up by 75% to JD 5.1 million.
Lending increased to JD 133 million, a 30% increase in the year, while deposits and margin
accounts grew by 20% to a total of JD 171 million. Total Assets now stand at JD 237 million. Our
net interest income grew by 32 % to JD 6.5 million. Non-interest income in 2001 grew by 85% to
reach JD 6.4 million.
Jordan's economic performance in 2001 continued to perform strongly and was characterized by a
pick-up in economic growth in most sectors, continued low inflation, a further increase in official
foreign currency reserves, and a substantial reduction in the net public debt. Real GDP growth
continued to accelerate and is expected exceed 4.0 percent for 2001, despite the adverse effects of
the renewed conflict in the West Bank and Gaza, and the September 11th attacks in the United
States. However, bearing in mind the fragility of the world economy and its impact on Jordan,
vigilance and prudent management of the economy continues to be essential. In particular, sensible
government budgetary policy will be critical in ensuring that we remain competitive and that the
outlook remains positive.
In today's world, unparalleled opportunity and unprecedented uncertainty come side by side. The
challenge for the Export & Finance Bank will be to demonstrate extraordinary levels of perception
and insight into the realities of the moment and ultimately provide customers with efficient, secure,
transparent and competitive services in the forms most suitable for them. Our creativity and
uncommon ways of satisfying our clients is a reflection of the quality of our staff and the resilience of
our customer base. All these developments confirm depositors' strong confidence in the power of
our name. It also signifies customers' conviction in our service excellence, reliability, innovation and
quality across all our services.
Ali K. Al-Husry
Chairman & CEO
During the year we carried out a major review of all of our operations. We critically examined our
strengths and weaknesses in relation to the environment in which we operate and, in particular, we
assessed the opportunities and indeed the threats that we judged would affect us going forward. In
the past year, the bank consistently maintained an impressive risk assets quality; a trend which
confirms sound credit management expertise. The bank recorded a non-performing loan ratio of
8.24 percent for 2001 compared to the industry average of about 11.61 percent. Although we
aggressively monitored and provided for doubtful debt throughout the year, we continued to pursue
an expansionary credit policy and explore opportunities beyond the traditional business realm.
The Export & Finance Bank is client driven, structuring its products and services to meet the growing
demands of its select clients and, in the process, contributing to the development of the capital
markets in Jordan. Over the years, we have gained a distinct and sustainable competitive advantage
due to the provision of a comprehensive range of banking and financial services including, but not
limited to, trade finance, corporate and project finance, asset management and various other
investment banking related services. Diversified banking services are what have allowed gives us to
grow shareholder value over the past six years and we believe that such a business model will carry
us forcefully into the new millennium.
I would like to take this opportunity to thank our clients for their trust and continuous support and to
the bank's management and employees for their hard work, dedication and contribution in achieving
our goal. I would also like to thank my fellow board members who continued to provide their
valuable insight and counsel. Finally, I wish to extend my sincere appreciation to the Central Bank of
Jordan for their continuous support, guidance, and leadership.

Board of Directors’ Report
The Board of Directors has the pleasure in welcoming the general assembly in its sixth ordinary
annual meeting and to present to you the financial statements of the Export and Finance Bank for
the year ended on December 31, 2001.
The financials reflect another year of impressive growth in the Bank's business. Total assets grew by
21.5% to reach JD 237.3 million and net income after provisions and taxes grew by 76% to reach JD
5.1 million, which represents a return of 17.13% on average equity as compared to 11.17% in the
year 2000. Accordingly, earnings per share (EPS) have increased to JD 0.200 in the year 2001 up
from JD 0.114 in the previous year.
Whilst the growth in revenues has occurred in almost every area of operation, special credit should
go to the substantially improved performance of the Amman Stock Exchange (ASE) posting a 30%
increase for the year, as a result of which, our own portfolio capital gains and brokerage revenues
increased by 342% having risen from JD 458,000 in 2000 to JD 2.05 million in 2001.
Customers' deposits also edged upwards by 5.4% to reach JD 90.9 million. However, this relatively
modest rate of growth, which is in line with the local banking industry average, is to a large extent
attributable to the drop of interest rates in the country during the year rendering other forms of
investment more attractive than bank deposits. Nonetheless, this has been vastly compensated by the
dramatic increase in customers' margin deposits against both direct and indirect facilities
accompanying the expansion in our non-lending banking services, i.e. letters of credit, guarantees,
and margin trading in stocks and foreign currency. The growth of these resources came to 116.7%
having risen from JD 17 million in 2000 to JD 38 million in 2001 and contributed considerably to the
Bank's profitability, representing a relatively cheap source of funds. To supplement our sources of
funds, we have also continued to make active use of re-finance lines available to us by the Central
Bank of Jordan and other financial institutions, which increased by 26.2% over the year.
Overall, the Bank's total operating revenues increased by 54% amounting to JD 12.9 million, of which
50% represented fee-based income, having risen from 40% in the year 2000. This is in line with the
Bank's standard policy for diversification of its sources of revenue by promoting non-lending
activities. On the other hand, total operating expenses increased by 36% only and the revenue/
operating expense ratio has improved from 1.9:1 as at 31/12/2000 to 2.15:1 as at 31/12/2001, which
is an indication of improved management efficiency.

The Bank's capital adequacy and liquidity ratios, which at the end of the year stood at 21.57% and
35% respectively, have continued to be well above international and local regulatory criteria.
Nevertheless, we believe we should continue to give priority for further consolidation of our capital
base in anticipation of future statutory capital increase requirements, and in order to enhance both
local and international confidence in our policies and future strategies. We therefore take this
opportunity to recommend distributing a stock dividend of 18.58%, thus increasing the Bank's
paid-up capital by a further amount of JD 4.7 million to reach JD 30 million, and maintaining total
shareholder equity at about JD 32 million. We strongly uphold the view that this ongoing policy of
capital consolidation in order to be stronger as we go forward, is in the best long-term interest of
the Bank's shareholders and will remain a primary long-term objective.
The beneficial outcome of this ongoing capital consolidation objective has started to bear fruit over
the past year in a very emphatic way, as the Bank's market capitalization has increased by about
135%, having appreciated from JD 20 million at the end of the year 2000 to JD 47 million at the end
of 2001, making the bank's share one of the year's best market performers. This dramatic increase
is not to be considered as an abnormal unsustainable development, but rather a fair reflection of
true share value and consolidation of public confidence in the Bank's healthy financial position and
strong performance.
CREDIT FACILITIES AND OPERATIONS
Total direct facilities grew by 30.7% over the past year to reach JD 133.7 million. The Bank's net
direct facilities at the end of 2001 stood at around JD 124.7 million representing approximately 53%
of total assets. Indirect credit facilities extended throughout 2001 reached JD 421 million,
representing a growth of 89% from the previous year and accounting for the sharp increase of about
95% in commission income. The main factors contributing to this sharp increase have been the
substantial upsurge in our re-export business for the Iraqi market under the UN oil-for-food program
and the expansion of our client base among QIZ companies engaged in duty-free and unrestricted
exports to the USA market, which after suffering a setback by the September 11 events, has
rebounded to an expansionary course. To reinforce our leading position in this area, we have during
the past year, opened representative offices in two of the QIZ areas in Sahab and Dleil, and will soon
be inaugurating a third office in Al Hassan Industrial Area in Irbid. Apart from placing ourselves in a
better position to service our customers commercial requirements and expanding our client base in
a fast growing export sector in Jordan, our aim in establishing these offices is also to enable us to
offer personal banking services to the quite extensive labour force employed in the various industrial
estates. With this latter criterion in mind, we will be shortly installing ATMs in all our offices
throughout the country and introducing a fast remittance service for which purpose we have recently
concluded an agreement with the international Money Gram Corporation. In 2002 we will also be
establishing a new branch in the Aqaba Special Economic Zone (ASEZ), which we believe has the
potential to develop into an attractive business centre for foreign investors.
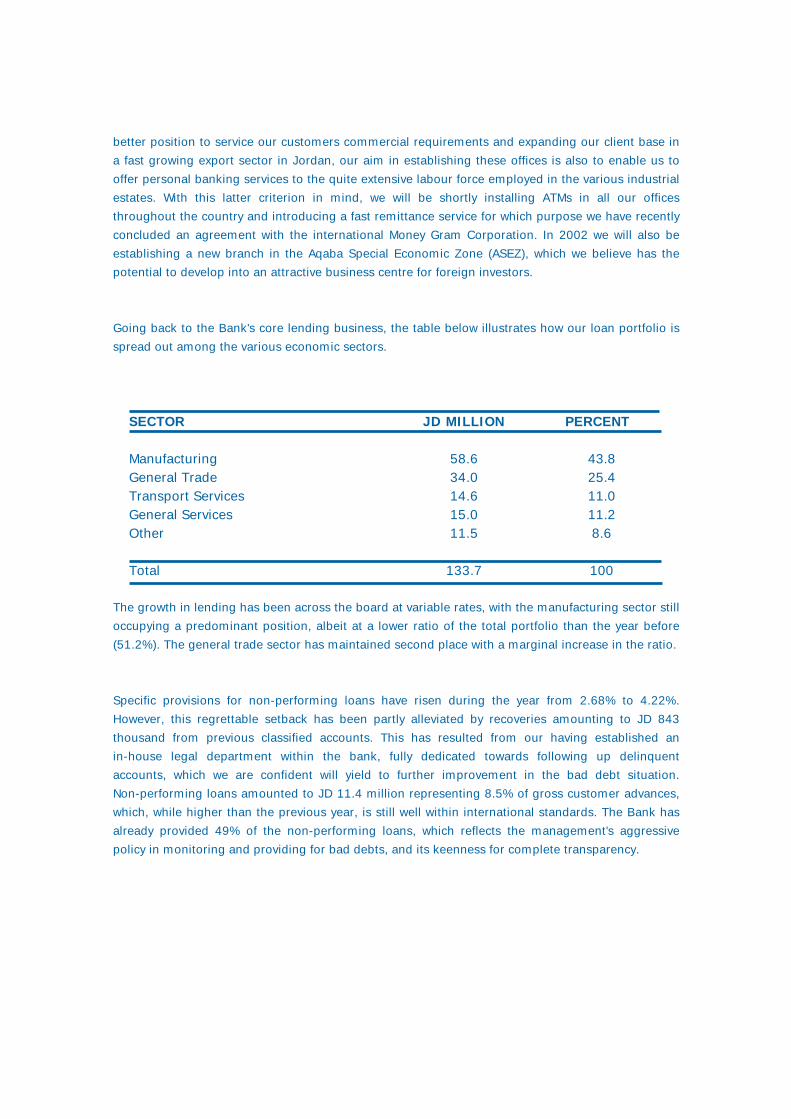
Going back to the Bank's core lending business, the table below illustrates how our loan portfolio is
spread out among the various economic sectors.
The growth in lending has been across the board at variable rates, with the manufacturing sector still
occupying a predominant position, albeit at a lower ratio of the total portfolio than the year before
(51.2%). The general trade sector has maintained second place with a marginal increase in the ratio.
Specific provisions for non-performing loans have risen during the year from 2.68% to 4.22%.
However, this regrettable setback has been partly alleviated by recoveries amounting to JD 843
thousand from previous classified accounts. This has resulted from our having established an
in-house legal department within the bank, fully dedicated towards following up delinquent
accounts, which we are confident will yield to further improvement in the bad debt situation.
Non-performing loans amounted to JD 11.4 million representing 8.5% of gross customer advances,
which, while higher than the previous year, is still well within international standards. The Bank has
already provided 49% of the non-performing loans, which reflects the management's aggressive
policy in monitoring and providing for bad debts, and its keenness for complete transparency.
SECTOR
ManufacturingGeneral TradeTransport ServicesGeneral ServicesOther
Total
JD MILLION
58.634.014.615.011.5
133.7
PERCENT
43.825.411.011.28.6
100

Despite the bad debt situation, our diversified lending business and ancillary operations have
continued to be very profitable and the Bank will stay the course in pursuing an expansionary credit
policy by actively exploring business opportunities based on sound and effective risk evaluation
principles, along with expanding and diversifying our fee-based services in our investment and
treasury departments, which have both shown strong performances during the past year.
TREASURY AND MONEY MARKET OPERATIONS
Treasury once again proved to be effective and efficient in managing the Bank's dealing in foreign
exchange and money market activities. Additionally, treasury provided our clients with financial
instruments to hedge against interest rate and currency risk related to their normal trading
transactions. Revenues from our foreign currency dealings increased by 63% for the year and our net
interest earnings on our surplus funds have been maximized by making optimum use of the
available money market instruments.
With the aim of expanding the scope our treasury services and products, we have recently managed
a capital guaranteed portfolio incorporating a mix of both domestic and international securities,
targeted towards the institutional investors seeking incremental revenues on their liquid assets. The
need for such a product has become more pronounced because of the sharp drops in worldwide
interest rates. To cater to the needs of the private investor, we are developing a fixed income mutual
fund. We also intend to start active trading in international bond markets both for our own portfolio
and for customer requirements, and establishing ourselves as market makers in the local bond
market.
INVESTMENT BANKING & CAPITAL MARKETS
The Bank's Investment Banking & Capital Markets Department is a financial services division of the
Export & Finance Bank whose primary business activity is investment management and investment
banking services. The objective is to become a fully integrated investment house offering a wide
range of standardized and innovative products and services specifically tailored toward the market.
The Bank occupies a prominent position in Jordan and has become a sophisticated financial services
group by positioning itself as a leading innovator in the sector specializing in investment banking,
structured finance, asset management, securities brokerage, and research.
Our investment banking services cover a wide range of corporate finance activities including the
arrangement of corporate bond issues, privately placed equity, initial public offerings and providing
financial advisory services related to privatizations, valuation, and mergers & acquisitions. There are a
wide variety of financing options for any company, including equity, debt, and preferred shares, that
they would be able to raise, either in private or public financial markets. Our team in corporate
finance evaluates the capital needs of the client, while assessing the readiness of various capital
markets for new securities. We then structure an appropriate financing package for clients that could
involve one or many types of securities that they then issue in either private or public markets. Our
team in corporate finance evaluates the capital needs of the client, while

OUTLOOK
Diversified banking services are what have allowed us to grow shareholder value over the past six
years and we believe that such a business model will carry us forcefully into the new millennium. We
are continuously seeking to be a first class provider of comprehensive commercial and investment
banking services and the preferred choice for exporters, corporate clients and talented employees. In
2002 we will continue to open representative offices in key industrial locations. Our immediate focus
will be to inaugurate offices in QIZs and in the Aqaba Special Economic Zone (ASEZ), which we
believe has the potential to develop into an attractive business centre for foreign investors. Aside
from the provision of corporate banking services, we are working toward providing a wider range of
services to our clients in the coming year.
Continuing to improve the Bank's performance in its various activities will remain our core objective
in 2002. We have put in place an aggressive plan to invest in technology and are dedicating
substantial resources toward employee development and training. All this should translate into a
growth in net profits and a considerable increase in overall shareholder value.
assessing the readiness of various capital markets for new securities. We then structure an
appropriate financing package for clients that could involve one or many types of securities that they
then issue in either private or public markets. In addition, our M&A services provided both public
shareholding companies and privately held companies with financial advice on transactions involving
matters of strategic acquisitions, corporate control, divestment, and other forms of consolidation. We
worked with our clients to identify and assess promising business combinations and guide them
through the often complex mechanics of these transactions.
The growth of the activities and services rendered by our Brokerage Office, in its third full year of
operations, has been maintained with nearly own portfolio capital gains and brokerage revenues
increasing by 342% having risen from JD 458,000 in 2000 to JD 2.05 million in 2001. Other
brokerage revenues including commissions reached JD 577 thousand for the year 2001
representing a 66% growth over the previous year. These revenues attributed to the Brokerage
Office consist of brokerage commissions, dividends, capital gains and custodian services that reflect
the diversity of the operations undertaken by the unit. During the past year we have expanded the
scope of our brokerage services to include international securities and have recently introduced
asset management services to our customers. Thus far, our asset management services have
performed remarkably well, despite the recent downturn in the international markets.
Our research team focused on producing publications and studies on individual public shareholding
companies, macroeconomic conditions, financial markets, and various sector analyses. We
continued to publish a broad range of corporate reports on a weekly basis as well as monthly
macroeconomic briefs and portfolio strategy papers. Our strong and credible research has been an
integral part of our advisory functions to several local, regional and international funds on Jordanian
equity.

Auditor’s Report&
The Financial Statements
TO THE SHAREHOLDERS OF
EXPORT & FINANCE BANK
AMMAN - JORDAN
We have audited the accompanying balance sheets of EXPORT AND FINANCE BANK (a
public shareholding company ) as of December 31, 2001 and 2000 and the related
statements of income, changes in shareholders’ equity and cash flows for the years then
ended. These financial statements are the responsibility of the Bank’s management.
Our responsibility is to express an opinion on these financial statements based on our
audits.
We conducted our audits in accordance with International Auditing Standards. Those
standards require that we plan and perform our audit to obtain reasonable assurance
about whether the financial statements are free of material misstatement. An audit
includes examining, on a test basis, evidence supporting the amounts and disclosures
in the financial statements. An audit also includes assessing the accounting principles
used and significant estimates made by management, as well as evaluating the overall
financial statements presentation. We believe that our audits provide a reasonable basis
for our opinion.
The Bank maintains proper books of accounts and the accompanying financial
statements and the financial information in the Board of Directors’ report are in
agreement therewith.
In our opinion, the financial statements referred to above present fairly, in all material
respects, the financial position of EXPORT AND FINANCE BANK as of December 31,
2001 and 2000 and the results of its operations and its cash flows for the years then
ended in accordance with International Financial Reporting Standards, as published by
the International Accounting Standards Board.
AMMAN - JORDANJanuary 14, 2002

17,201,183
46,898,793
500,000
15,333,938
124,652,121
17,750,805
11,842,738
704,268
2,424,938
237,308,784
41,835,047
90,858,759
38,376,502
24,933,424
7,663,388
1,535,000
205,202,120
25,300,000
1,822,353
1,706,000
131,013
3,147,298
32,106,664
237,308,784
27,393,838
28,059,935
-
12,709,481
97,204,703
10,364,926
16,643,497
530,994
2,434,554
195,341,928
39,231,193
86,190,539
17,248,349
19,748,716
5,227,089
930,000
168,575,886
22,000,000
1,134,916
1,833,611
-
1,797,515
26,766,042
195,341,928
AS OF DECEMBER 31, 2001 AND 2000BALANCE SHEETS
ASSETS
Cash on hand and balances at the Central Bank of Jordan
Balances at banks and financial institutions
Deposits at banks and financial institutions
Trading investments
Credit Facilities, net
Available for sale investments
Held to maturity investments, net
Fixed assets, net
Other Assets
Total Assets
LIABILITIES AND SHAREHOLDERS' EQUITY
Liabilities
Banks and financial institutions' deposits
Customers' deposits
Margin accounts
Loans and advances
Other liabilities
Income tax provision
Total Liabilities
Shareholders' Equity
Paid in capital
Statutory reserve
Voluntary reserve
Fair value reserve
Retained earnings
Total Shareholders' Equity
Total liabilities and Shareholders' Equity
(In Jordanian Dinars)
20002001
3
4
5
6
7
8
9
10
11
12
13
14
15
16
17
18
19
20
21
Notes
The Accompanying notes are an integral part of these financial statements
22
12,901,143
7,979,127
4,922,016
1,656,811
6,578,827
457,559
1,332,754
1,790,313
8,369,140
891,722
826,897
208,773
2,482,988
4,410,380
3,958,760
930,000
39,587
39,587
65,000
2,884,586
0.114
16,309,503
9,824,419
6,485,084
2,782,609
9,267,693
2,024,984
1,580,565
3,605,549
12,873,242
1,466,948
1,003,170
197,042
3,331,706
5,998,866
6,874,376
1,615,000
68,743
68,743
65,000
5,056,890
0.200
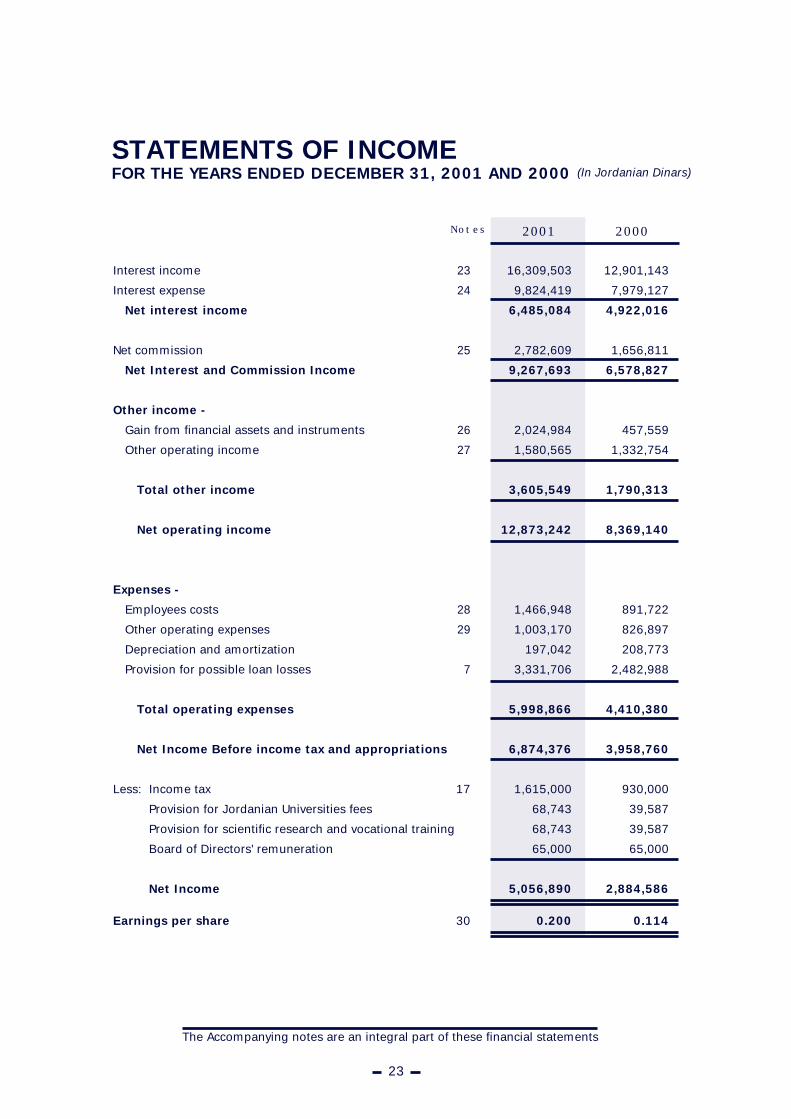
Interest income
Interest expense
Net interest income
Net commission
Net Interest and Commission Income
Other income -
Gain from financial assets and instruments
Other operating income
Total other income
Net operating income
Expenses -
Employees costs
Other operating expenses
Depreciation and amortization
Provision for possible loan losses
Total operating expenses
Net Income Before income tax and appropriations
Less: Income tax
Provision for Jordanian Universities fees
Provision for scientific research and vocational training
Board of Directors' remuneration
Net Income
Earnings per share
STATEMENTS OF INCOMEFOR THE YEARS ENDED DECEMBER 31, 2001 AND 2000 (In Jordanian Dinars)
The Accompanying notes are an integral part of these financial statements
23
24
25
26
27
28
29
7
17
30
Notes
23
20002001

2001
Balance as ofJanuary, 2001
Increase in capital
Effect of adopting IAS 39
Net income
Transfers
Fair value reserve
Balance as ofDecember 31, 2001
2000
Balance as ofJanuary 31, 2000
Net income
Transfers
Dividends paid
Balance as ofDecember 31, 2000
STATEMENTS OF CHANGES IN SHAREHOLDERS’ EQUITYFOR THE YEARS ENDED DECEMBER 31, 2001 AND 2000 (In Jordanian Dinars)
22,000,000
3,300,000
-
-
-
-
25,300,000
22,000,000
-
-
-
22,000,000
The Accompanying notes are an integral part of these financial statements
Paid InCapital Statutory Voluntary
RetainedEarnings Total
24
Dividends
1,833,611
(1,502,485)
-
-
1,374,874
-
1,706,000
1,041,859
-
791,752
-
1,833,611
1,134,916
-
-
-
687,437
-
1,822,353
739,040
-
395,876
-
1,134,916
1,797,515
(1,797,515)
152,719
5,056,890
(2,062,311)
-
3,147,298
100,557
2,884,586
(1,187,628)
-
1,797,515
26,766,042
-
152,719
5,056,890
-
131,013
32,106,664
24,871,456
2,884,586
-
( 990,000)
26,766,042
Reserves
-
-
-
-
-
131,013
131,013
-
-
-
-
-
Fair ValueReserve
-
-
-
-
-
-
-
990,000
-
-
(990,000)
-

20002001
STATEMENTS OF CASH FLOWSFOR THE YEARS ENDED DECEMBER 31, 2001 AND 2000 (In Jordanian Dinars)
CASH FLOWS FROM OPERATING ACTIVITIES
Net income before income tax
Adjustments for -DepreciationProvision for possible loan lossesLosses on sale of fixed assetsDifferences in exchange rates
Changes in assets and liabilities -
Increase in deposits at banks and financial institutionsIncrease in credit facilitiesIncrease in trading investmentsDecrease (increase) in other assetsIncrease in banks and financial institutions deposits
that mature within three monthsIncrease in customers' depositsIncrease in margin accountsIncrease in other liabilities
Net cash from operating activities before income tax
Income tax paid
Net cash from operating activities
CASH FLOWS FROM INVESTING ACTIVITIES
Purchase of available for sale investmentsSale (purchase) of held to maturity investmentsPurchase of fixed assets
Net cash used in investing activities
CASH FLOWS FROM FINANCING ACTIVITIES
Increase in loans Dividends paid
Net cash from financing activities
Difference in exchange rates
Net increase in cash and cash equivalents
Cash and cash equivalents, beginning of the year
Cash and cash equivalents, end of the year
The Accompanying notes are an integral part of these financial statements
25
6,671,890
197,042
3,331,7061,003
(535,339)
9,666,302
( 500,000)(30,779,124)
(2,624,457)9,616
3,560,0004,668,220
21,128,1532,436,299
7,565,009
(1,010,000)
6,555,009
( 7,102,147)4,800,759(371,319)
( 2,672,707)
5,184,708 -
5,184,708
535,339
9,602,349
31,412,580
41,014,929
3,814,586
208,773
2,482,988-
(287,341)
6,219,006
-(28,357,376)
(6,572,339)(267,283)
11,290,00027,467,877
5,930,7162,380,765
18,091,366
(1,134,000)
16,957,366
( 1,796,425)(16,643,497)
( 156,552)
(18,596,474)
4,131,658( 990,000)
3,141,658
287,341
1,789,891
29,622,689
31,412,58031
Notes

NOTES TO THE FINANCIAL STATEMENTSDECEMBER 31, 2001 AND 2000 (In Jordanian Dinars)
(1) GENERAL
The Export and Finance Bank was established as a public shareholding company on August 30,
1995 with an authorized and subscribed capital of JD 20,000,000, divided into 20,000,000 share of
JD 1 each. This was subsequently increased to JD 25,300,000.
The Bank provides its banking operations through its main branch located in Amman, and two
offices.
The Bank's principal activities include the provision of direct and indirect credit facilities primarily to
the export and manufacturing sectors, trade in marketable securities for the Bank and its customers,
and as a broker at Amman Stock Exchange.
The General Assembly, in its extra-ordinary meeting held on June 30, 1999, resolved to increase the
Bank's capital from 20,000,000 to 22,000,000 shares of JD 1 per share by distributing bonus shares
through capitalizing the general reserve, retained earnings and part of the voluntary reserve.
The General Assembly, in its extra-ordinary meeting held on May 6, 2001, resolved to increase the
Bank's capital from 22,000,000 to 25,300,000 shares of JD 1 per share by distributing bonus shares
through capitalizing the general reserve, retained earnings and part of the voluntary reserve.
The Bank's total number of employees as of December 31, 2001 and 2000 was 94 and 73
respectively.
The financial statements were authorized for issue by the Bank's Board of Directors in their meeting
held on January 17, 2002.
(2) SUMMARY OF SIGNIFICANT ACCOUNTING POLICIES
The presentation of the accompanying financial statements conform with the guidelines provided by
the Central Bank of Jordan. The following are the significant accounting policies followed by the
bank:
26
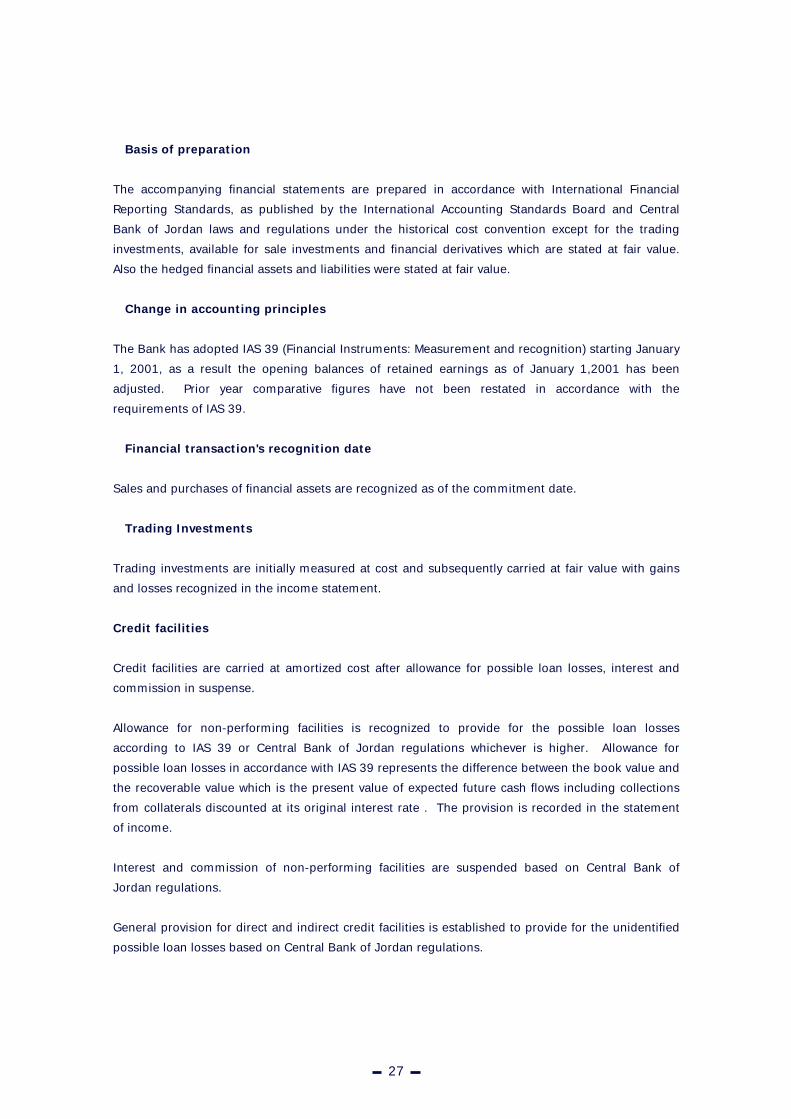
Basis of preparation
The accompanying financial statements are prepared in accordance with International Financial
Reporting Standards, as published by the International Accounting Standards Board and Central
Bank of Jordan laws and regulations under the historical cost convention except for the trading
investments, available for sale investments and financial derivatives which are stated at fair value.
Also the hedged financial assets and liabilities were stated at fair value.
Change in accounting principles
The Bank has adopted IAS 39 (Financial Instruments: Measurement and recognition) starting January
1, 2001, as a result the opening balances of retained earnings as of January 1,2001 has been
adjusted. Prior year comparative figures have not been restated in accordance with the
requirements of IAS 39.
Financial transaction's recognition date
Sales and purchases of financial assets are recognized as of the commitment date.
Trading Investments
Trading investments are initially measured at cost and subsequently carried at fair value with gains
and losses recognized in the income statement.
Credit facilities
Credit facilities are carried at amortized cost after allowance for possible loan losses, interest and
commission in suspense.
Allowance for non-performing facilities is recognized to provide for the possible loan losses
according to IAS 39 or Central Bank of Jordan regulations whichever is higher. Allowance for
possible loan losses in accordance with IAS 39 represents the difference between the book value and
the recoverable value which is the present value of expected future cash flows including collections
from collaterals discounted at its original interest rate . The provision is recorded in the statement
of income.
Interest and commission of non-performing facilities are suspended based on Central Bank of
Jordan regulations.
General provision for direct and indirect credit facilities is established to provide for the unidentified
possible loan losses based on Central Bank of Jordan regulations.
27

Loans provided for are written off from the allowance of possible loan losses when the collection
procedures become ineffective. The excess in the allowance of possible loan losses - if any - is
transferred to the statement of income, and cash recoveries of loans that were previously written off
are credited to the income statement.
Available for sale investments
Available for sale investments are initially measured at cost and subsequently carried at fair value.
Gains or losses on measurement to fair value of available-for-sale investments are recognised
directly in the fair value reserve in shareholders equity, until the investment is sold or otherwise
disposed of, or until it is determined to be impaired, at which time the cumulative gain or loss
previously recognised in equity is included in net profit or loss for the period.
Held to maturity investments, net
Held to maturity investments are carried at amortized cost and the discount or premium is
amortized using the effective interest rate method.
Fair value
The fair value of traded financial assets is based on quoted market prices, where no quoted market
prices are available, a reasonable estimate of fair value is used based on one of the following
methods:
- Comparison with the current market value of a similar financial instrument.
- Forecasted discounted cash flow.
- Options pricing models.
In case the fair value of an investment can not be reliably measured, it is stated at cost or amortized
cost with any impairment in value recorded in the statement of income.
Revenue and expense recognition
Income and expenses are recognized on the accrual basis except for interest and commission
income of non-performing facilities which are recorded as interest and commission in suspense in
accordance with the central Bank of Jordan regulations.
Income from shares (dividends income) are recorded as an income only when earned.Commission
income is recognized when it is earned.
Commission income is recognized when it is earned.
28
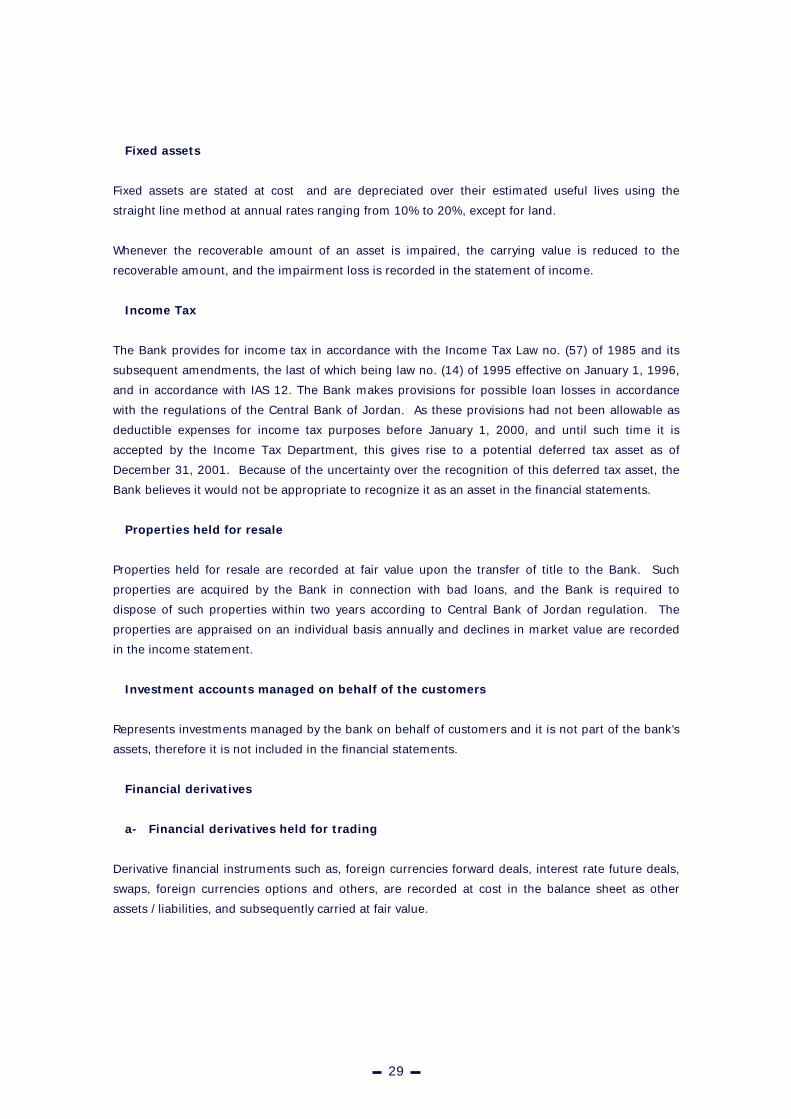
Fixed assets
Fixed assets are stated at cost and are depreciated over their estimated useful lives using the
straight line method at annual rates ranging from 10% to 20%, except for land.
Whenever the recoverable amount of an asset is impaired, the carrying value is reduced to the
recoverable amount, and the impairment loss is recorded in the statement of income.
Income Tax
The Bank provides for income tax in accordance with the Income Tax Law no. (57) of 1985 and its
subsequent amendments, the last of which being law no. (14) of 1995 effective on January 1, 1996,
and in accordance with IAS 12. The Bank makes provisions for possible loan losses in accordance
with the regulations of the Central Bank of Jordan. As these provisions had not been allowable as
deductible expenses for income tax purposes before January 1, 2000, and until such time it is
accepted by the Income Tax Department, this gives rise to a potential deferred tax asset as of
December 31, 2001. Because of the uncertainty over the recognition of this deferred tax asset, the
Bank believes it would not be appropriate to recognize it as an asset in the financial statements.
Properties held for resale
Properties held for resale are recorded at fair value upon the transfer of title to the Bank. Such
properties are acquired by the Bank in connection with bad loans, and the Bank is required to
dispose of such properties within two years according to Central Bank of Jordan regulation. The
properties are appraised on an individual basis annually and declines in market value are recorded
in the income statement.
Investment accounts managed on behalf of the customers
Represents investments managed by the bank on behalf of customers and it is not part of the bank's
assets, therefore it is not included in the financial statements.
Financial derivatives
a- Financial derivatives held for trading
Derivative financial instruments such as, foreign currencies forward deals, interest rate future deals,
swaps, foreign currencies options and others, are recorded at cost in the balance sheet as other
assets / liabilities, and subsequently carried at fair value.
29
The fair value is determined according to the market price, if such prices are not available
discounted cash flow models, standard forms, or internal pricing forms are used whichever is more
suitable as of the financial statement date. Changes in the fair value are recognised in the statement
of income.
b- Financial derivatives for hedging purposes
1- Fair value hedge:
Derivatives that qualify as fair value hedges are carried at fair value with the corresponding change in
fair value recognised in the income statement.
2- Cash flow hedge:
Changes in the fair value of a hedging instrument that qualifies as a highly effective cash-flow hedge
are recognised directly in the hedging reserve in shareholders' equity. The ineffective portion is
immediately recognized in net profit or loss.
3- Hedge of net investments in a foreign entity:
Changes in the fair value of a hedging instrument that qualifies as a highly effective hedge of net
investments in a foreign enmity are recognized directly in the hedging reserve in share holders'
equity. The ineffective portion is immediately recognized in net profit or loss.
Foreign currencies
Assets and liabilities denominated in foreign currencies are translated to Jordanian Dinars using the
Central Bank of Jordan's middle exchange rates at year end. Foreign currency transactions during
the year are recorded using exchange rates that were in effect at the dates of transactions. Gains or
losses arising from foreign currency translations are reflected in the statement of income.
Foreign currencies' forward deals are re-evaluated using the Central Bank of Jordan's middle
exchange rates at year end, gains and losses from the re-evaluation are reflected in the statement of
income.
Cash and cash equivalents
Represents cash on hand and cash balance that mature within 3 months, it includes cash on hand,
balances at banks and financial institutions, less banks' and financial institutions deposits' that
mature within three months.
30
Repurchase and resell agreements
Assets sold with a simultaneous repurchase agreement at a future date will continue to be
recognized in the bank's financial statements due to the Bank's continuing control over these assets
using the same accounting policies with the proceeds of the sale recorded as a liability. The
difference between the selling price and the repurchase price is recognized as an interest expense
over the agreement term.
Purchased assets with a simultaneous resell agreement at a future date are not recognized in the
bank's financial statements as assets since the Bank is not able to control these assets. The related
payments are recognized as part of deposits at banks and financial institutions or customers' loans
as applicable, and the difference between purchase price and reselling price is recognized in the
statement of income.
Risk management
The Bank's management tries to mitigate the credit and market risks through setting investment
ceilings and applying set percentages that correspond with the Central Bank of Jordan and board of
directors regulations and through diversification of investments and a conservative credit granting
policy to mitigate credit risk. The Bank has a risk evaluation system to assess the financial standing
of its clients.
31
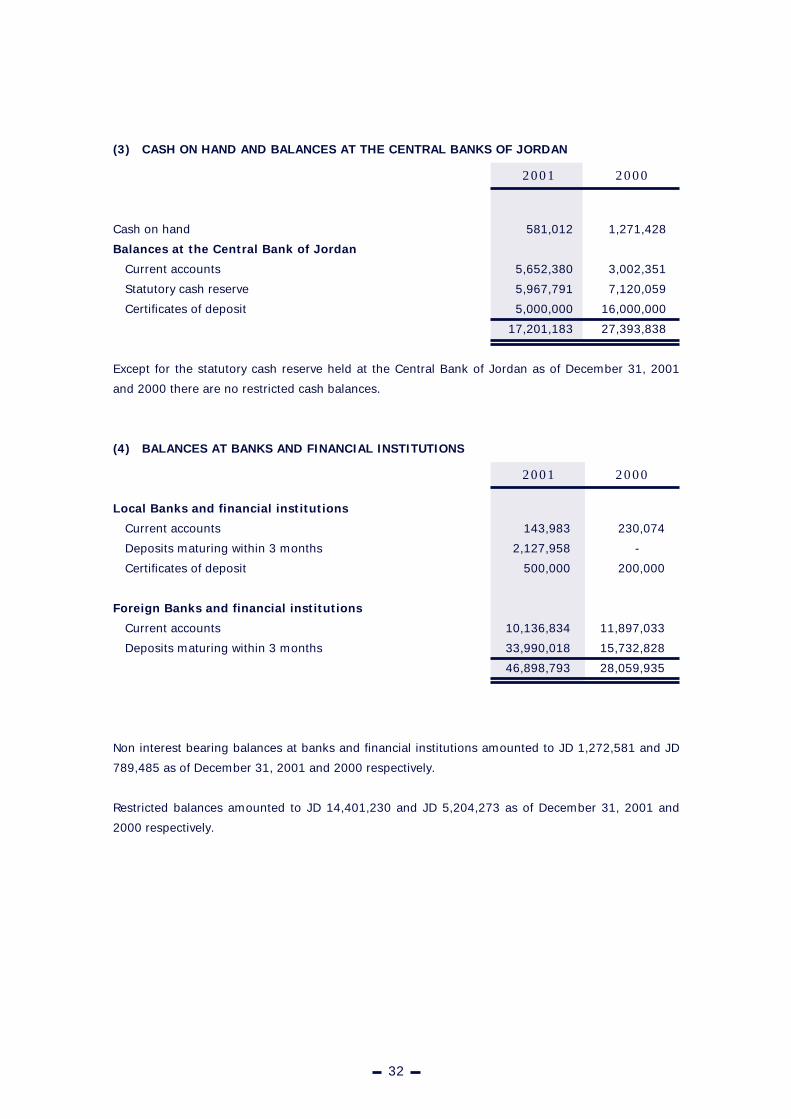
(3) CASH ON HAND AND BALANCES AT THE CENTRAL BANKS OF JORDAN
Cash on hand
Balances at the Central Bank of Jordan
Current accounts
Statutory cash reserve
Certificates of deposit
Except for the statutory cash reserve held at the Central Bank of Jordan as of December 31, 2001
and 2000 there are no restricted cash balances.
(4) BALANCES AT BANKS AND FINANCIAL INSTITUTIONS
Local Banks and financial institutions
Current accounts
Deposits maturing within 3 months
Certificates of deposit
Foreign Banks and financial institutions
Current accounts
Deposits maturing within 3 months
Non interest bearing balances at banks and financial institutions amounted to JD 1,272,581 and JD
789,485 as of December 31, 2001 and 2000 respectively.
Restricted balances amounted to JD 14,401,230 and JD 5,204,273 as of December 31, 2001 and
2000 respectively.
581,012
5,652,380
5,967,791
5,000,000
17,201,183
20002001
1,271,428
3,002,351
7,120,059
16,000,000
27,393,838
143,983
2,127,958
500,000
10,136,834
33,990,018
46,898,793
20002001
32
230,074
-
200,000
11,897,033
15,732,828
28,059,935

(5) DEPOSITS AT BANKS AND FINANCIAL INSTITUTIONS
Local Banks and financial institutions
Certificates of deposit
(6) TRADING INVESTMENTS
Shares not listed in financial markets
Shares listed in financial markets
Bonds listed in financial markets
(7) CREDIT FACILITIES, NET
Bills and notes discounted
Overdraft facilities
Loans and advances
Credit cards
Less: Interest in suspense
Allowance for possible loan losses
Credit facilities, net
20002001
144,200
4,719,416
7,845,865
12,709,481
2000
500,000
500,000
2001
-
-
33
144,200
8,498,317
6,691,421
15,333,938
34,448,159
14,842,787
52,901,863
68,115
102,260,924
617,329
4,438,892
5,056,221
97,204,703
20002001
50,300,264
13,601,059
69,694,278
63,878
133,659,479
1,236,760
7,770,598
9,007,358
124,652,121

Credit facilities granted by sector are set forth below:
Agriculture
Manufacturing and mining
Constructions
General trade
Transportation services
Tourism, hotels and restaurants
Services and public facilities
Financial services
Investment in shares
Vehicles
Real estate purchase
Consumable goods
Others
The non-performing credit facilities as defined by the Central Bank of Jordan's regulations amounted
to JD 11,462,479 representing 8.58% of total facilities and JD 5,518,702 representing 5.4% of total
facilities as of December 31, 2001 and 2000 respectively.
There are no credit facilities granted or guaranteed by the government as of December 31, 2001
and 2000 respectively.
The specific allowance for possible loan losses according to CBJ regulations and IAS 39 amounted
to JD 5,647,137 and JD 4,767,847 as of December 31, 2001.
The specific allowance for possible loan losses according to CBJ regulations and IAS 39 amounted
to JD 2,738,871 and JD 1,661,200 as of December 31, 2000.
The gross fair value of collaterals held against credit facilities amounted to JD 91,223,694 and JD
57,088,499 as of December 31, 2001 and 2000 respectively.
34
1,854,748
52,397,795
2,395,898
24,352,030
4,074,978
796,967
2,015,073
653,507
1,474,023
904,141
63,471
149,358
11,128,935
102,260,924
20002001
1,546,033
58,630,460
2,777,977
33,975,964
8,591,842
1,459,453
9,172,742
526,067
1,682,383
5,965,000
326,852
104,615
8,900,091
133,659,479
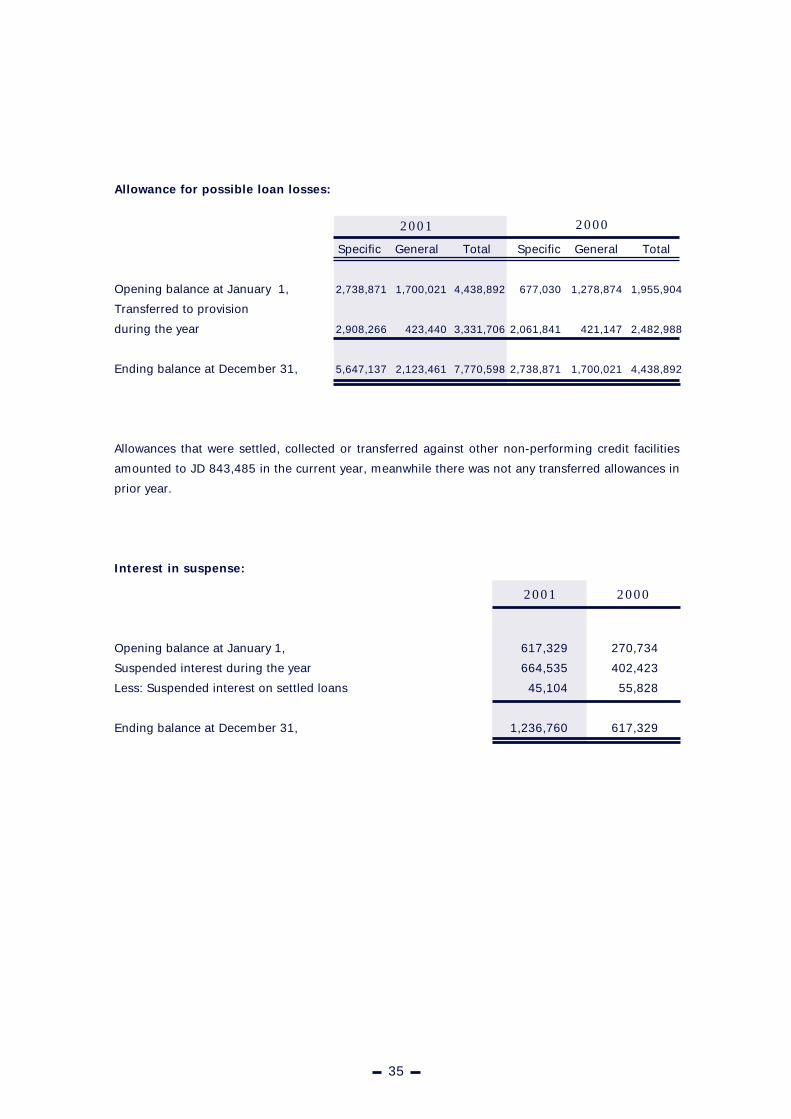
Allowance for possible loan losses:
Opening balance at January 1,
Transferred to provision
during the year
Ending balance at December 31,
Allowances that were settled, collected or transferred against other non-performing credit facilities
amounted to JD 843,485 in the current year, meanwhile there was not any transferred allowances in
prior year.
Interest in suspense:
Opening balance at January 1,
Suspended interest during the year
Less: Suspended interest on settled loans
Ending balance at December 31,
20002001
2000
270,734
402,423
55,828
617,329
2001
617,329
664,535
45,104
1,236,760
35
Specific General Total Specific General Total
2,738,871
2,908,266
5,647,137
1,700,021
423,440
2,123,461
4,438,892
3,331,706
7,770,598
677,030
2,061,841
2,738,871
1,955,904
2,482,988
4,438,892
1,278,874
421,147
1,700,021

(8) AVAILABLE FOR SALE INVESTMENTS
Shares *
Bonds
Investment in shares includes an amount equal to JD 100,000 which was stated at cost since the fair
value could not be measured reliably. The management believes that there is no impairment in the
value of these shares as of year end.
*This amount represents shares of Jordan Loan Guarantee Company which are listed but not traded
at Amman stock exchange.
(9) HELD TO MATURITY INVESTMENTS, NET
Treasury bills
20002001
20002001
11,842,738 16,643,497
36
Traded Total Traded Total
100,000
17,650,805
17,750,805
100,000
17,650,805
17,750,805
100,000
10,264,926
10,364,926
100,000
10,264,926
10,364,926
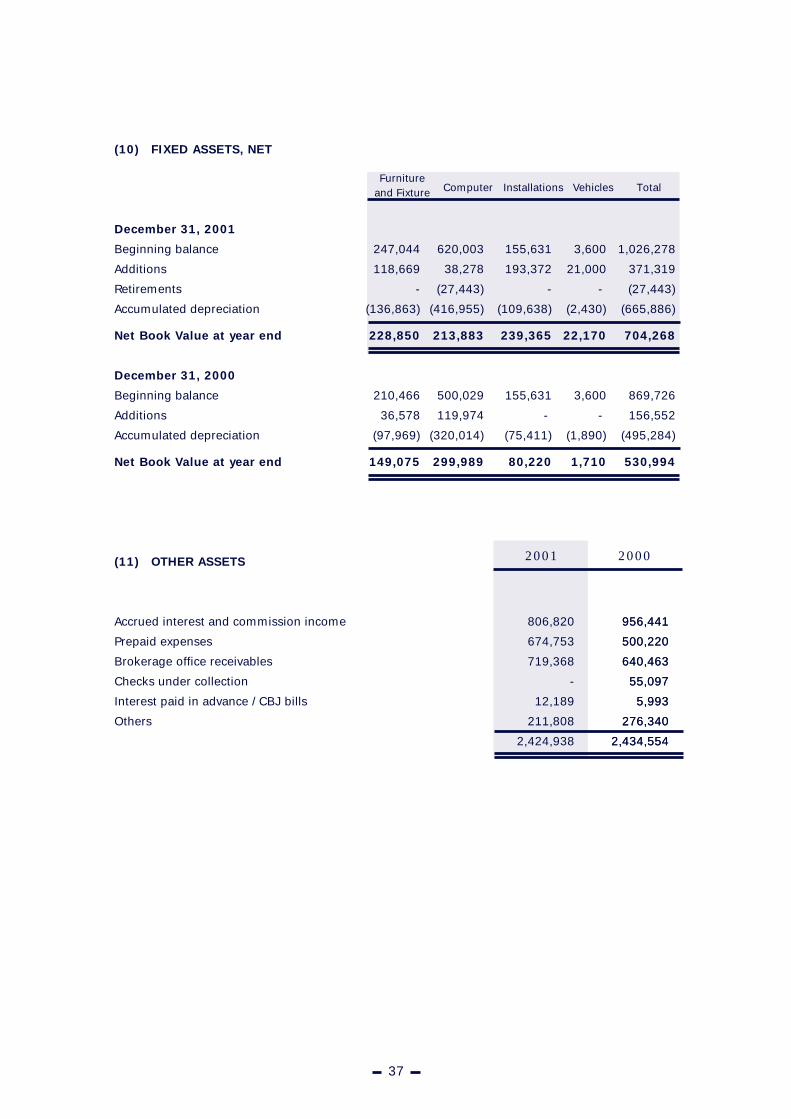
(10) FIXED ASSETS, NET
December 31, 2001
Beginning balance
Additions
Retirements
Accumulated depreciation
Net Book Value at year end
December 31, 2000
Beginning balance
Additions
Accumulated depreciation
Net Book Value at year end
(11) OTHER ASSETS
Accrued interest and commission income
Prepaid expenses
Brokerage office receivables
Checks under collection
Interest paid in advance / CBJ bills
Others
2000
37
247,044
118,669
-
(136,863)
228,850
210,466
36,578
(97,969)
149,075
Furnitureand Fixture Computer Installations Vehicles Total
620,003
38,278
(27,443)
(416,955)
213,883
500,029
119,974
(320,014)
299,989
155,631
193,372
-
(109,638)
239,365
155,631
-
(75,411)
80,220
3,600
21,000
-
(2,430)
22,170
3,600
-
(1,890)
1,710
1,026,278
371,319
(27,443)
(665,886)
704,268
869,726
156,552
(495,284)
530,994
806,820
674,753
719,368
-
12,189
211,808
2,424,938
956,441
500,220
640,463
55,097
5,993
276,340
2,434,554
20002001
956,441
500,220
640,463
55,097
5,993
276,340
2,434,554
806,820
674,753
719,368
-
12,189
211,808
2,424,938
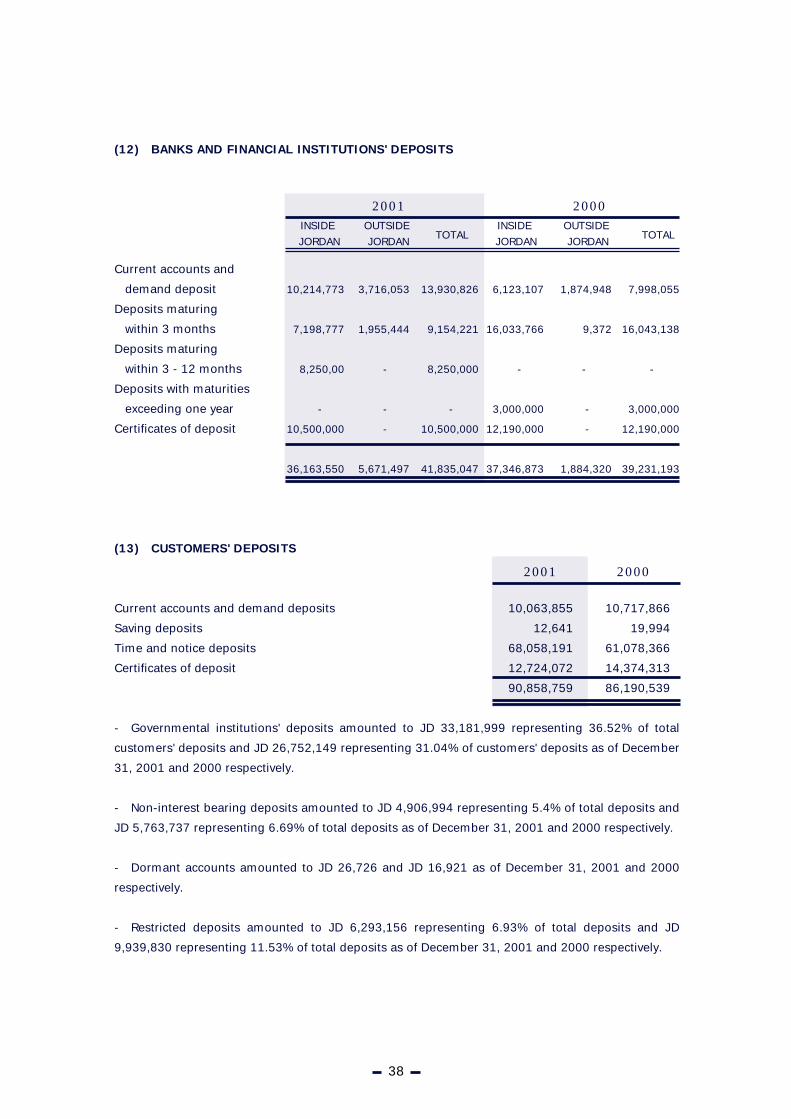
(12) BANKS AND FINANCIAL INSTITUTIONS' DEPOSITS
Current accounts and
demand deposit
Deposits maturing
within 3 months
Deposits maturing
within 3 - 12 months
Deposits with maturities
exceeding one year
Certificates of deposit
(13) CUSTOMERS' DEPOSITS
Current accounts and demand deposits
Saving deposits
Time and notice deposits
Certificates of deposit
- Governmental institutions' deposits amounted to JD 33,181,999 representing 36.52% of total
customers' deposits and JD 26,752,149 representing 31.04% of customers' deposits as of December
31, 2001 and 2000 respectively.
- Non-interest bearing deposits amounted to JD 4,906,994 representing 5.4% of total deposits and
JD 5,763,737 representing 6.69% of total deposits as of December 31, 2001 and 2000 respectively.
- Dormant accounts amounted to JD 26,726 and JD 16,921 as of December 31, 2001 and 2000
respectively.
- Restricted deposits amounted to JD 6,293,156 representing 6.93% of total deposits and JD
9,939,830 representing 11.53% of total deposits as of December 31, 2001 and 2000 respectively.
20002001INSIDE
JORDAN
38
OUTSIDE
JORDANTOTAL
INSIDE
JORDAN
OUTSIDE
JORDANTOTAL
10,214,773
7,198,777
8,250,00
-
10,500,000
36,163,550
3,716,053
1,955,444
-
-
-
5,671,497
7,998,055
16,043,138
-
3,000,000
12,190,000
39,231,193
13,930,826
9,154,221
8,250,000
-
10,500,000
41,835,047
6,123,107
16,033,766
-
3,000,000
12,190,000
37,346,873
1,874,948
9,372
-
-
-
1,884,320
10,063,855
12,641
68,058,191
12,724,072
90,858,759
10,717,866
19,994
61,078,366
14,374,313
86,190,539
20002001
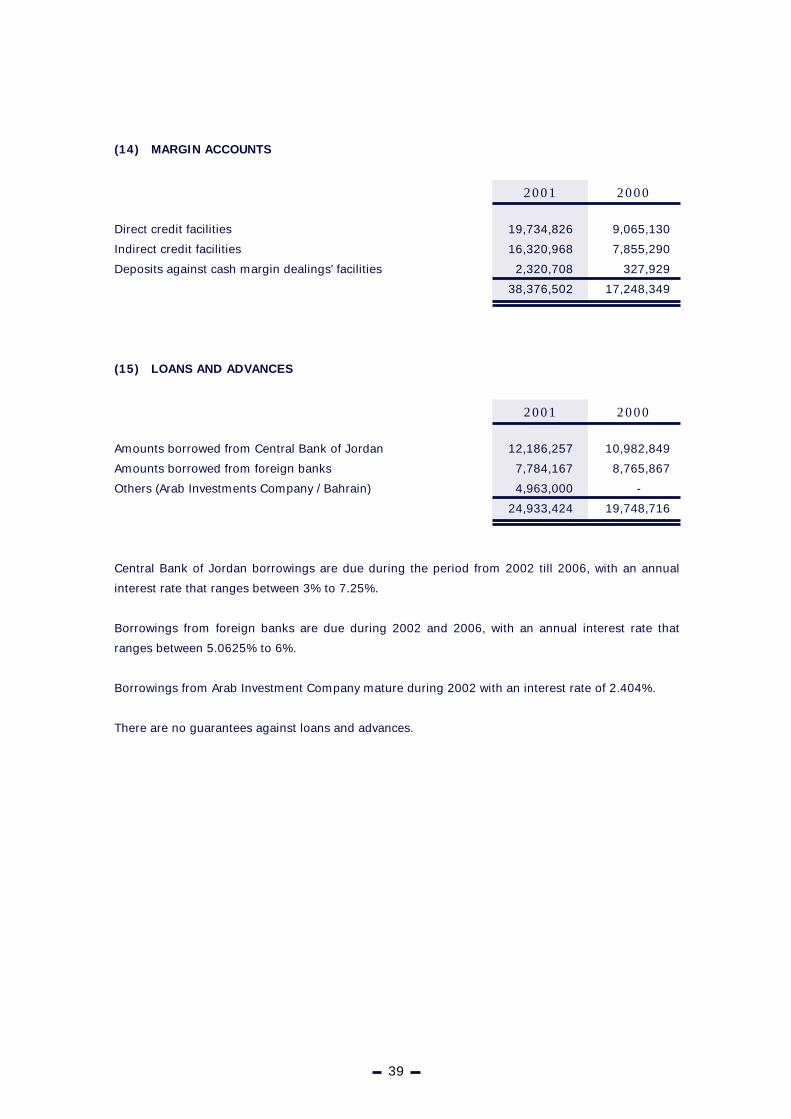
(14) MARGIN ACCOUNTS
Direct credit facilities
Indirect credit facilities
Deposits against cash margin dealings' facilities
(15) LOANS AND ADVANCES
Amounts borrowed from Central Bank of Jordan
Amounts borrowed from foreign banks
Others (Arab Investments Company / Bahrain)
Central Bank of Jordan borrowings are due during the period from 2002 till 2006, with an annual
interest rate that ranges between 3% to 7.25%.
Borrowings from foreign banks are due during 2002 and 2006, with an annual interest rate that
ranges between 5.0625% to 6%.
Borrowings from Arab Investment Company mature during 2002 with an interest rate of 2.404%.
There are no guarantees against loans and advances.
39
19,734,826
16,320,968
2,320,708
38,376,502
9,065,130
7,855,290
327,929
17,248,349
20002001
12,186,257
7,784,167
4,963,000
24,933,424
10,982,849
8,765,867
-
19,748,716
20002001

(16) OTHER LIABILITIES
Accrued interest expenses
Interest and commissions received in advance
Deferred income
Accrued expenses
Certified cheques
Cheques under collection
Brokerage office payables
Checks payable
University fees provision
Scientific research provision
Board of directors remuneration
Outgoing transfers
Incoming transfers
Other
(17) INCOME TAX PROVISION
The movement on the income tax provision was as follows:
Beginning balance
Income tax paid
Provision for income tax for the year
Ending balance
20002001
930,000
1,010,000
1,615,000
1,535,000
1,134,000
1,134,000
930,000
930,000
20002001
40
1,667,000
1,717,390
599,790
529,710
609,565
92,951
-
194,286
68,743
68,743
65,000
1,224,040
774,220
51,950
7,663,388
1,363,425
1,065,910
252,347
156,780
157,866
1,562,822
37,593
306,383
39,587
39,587
65,000
17,227
156,600
5,962
5,227,089
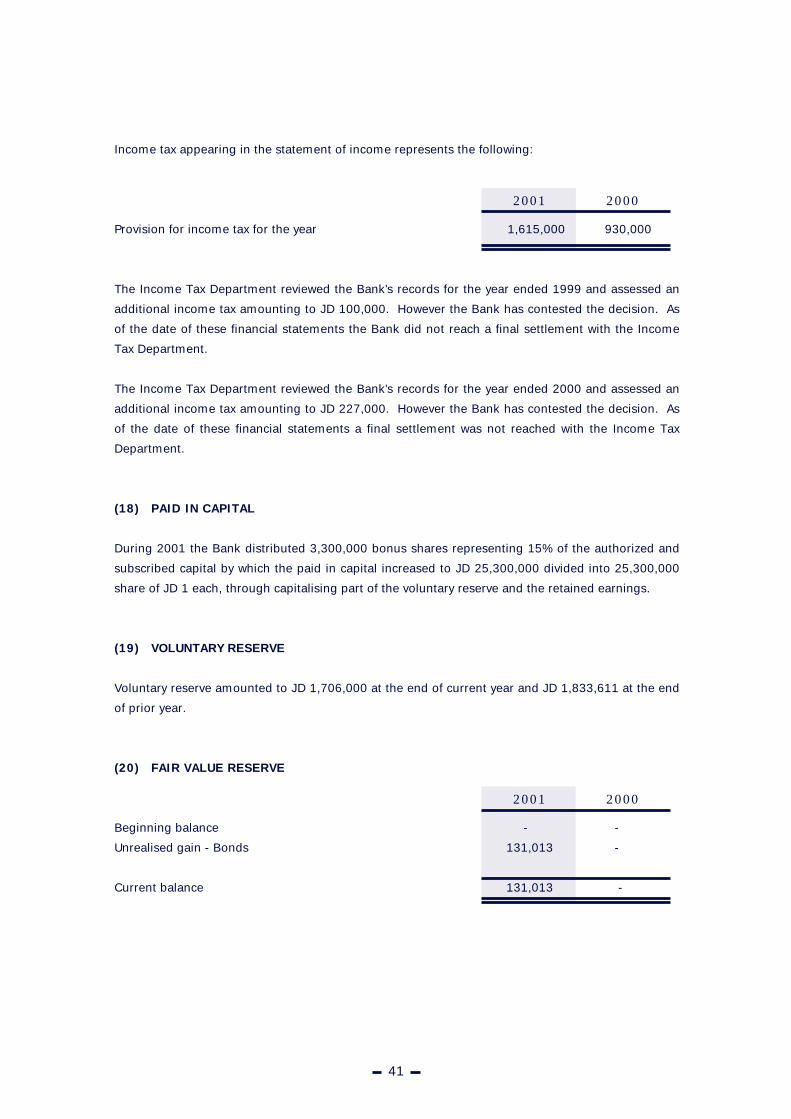
Income tax appearing in the statement of income represents the following:
Provision for income tax for the year
The Income Tax Department reviewed the Bank's records for the year ended 1999 and assessed an
additional income tax amounting to JD 100,000. However the Bank has contested the decision. As
of the date of these financial statements the Bank did not reach a final settlement with the Income
Tax Department.
The Income Tax Department reviewed the Bank's records for the year ended 2000 and assessed an
additional income tax amounting to JD 227,000. However the Bank has contested the decision. As
of the date of these financial statements a final settlement was not reached with the Income Tax
Department.
(18) PAID IN CAPITAL
During 2001 the Bank distributed 3,300,000 bonus shares representing 15% of the authorized and
subscribed capital by which the paid in capital increased to JD 25,300,000 divided into 25,300,000
share of JD 1 each, through capitalising part of the voluntary reserve and the retained earnings.
(19) VOLUNTARY RESERVE
Voluntary reserve amounted to JD 1,706,000 at the end of current year and JD 1,833,611 at the end
of prior year.
(20) FAIR VALUE RESERVE
Beginning balance
Unrealised gain - Bonds
Current balance
2000
1,615,000
2001
930,000
41
2000
-
131,013
131,013
2001
-
-
-
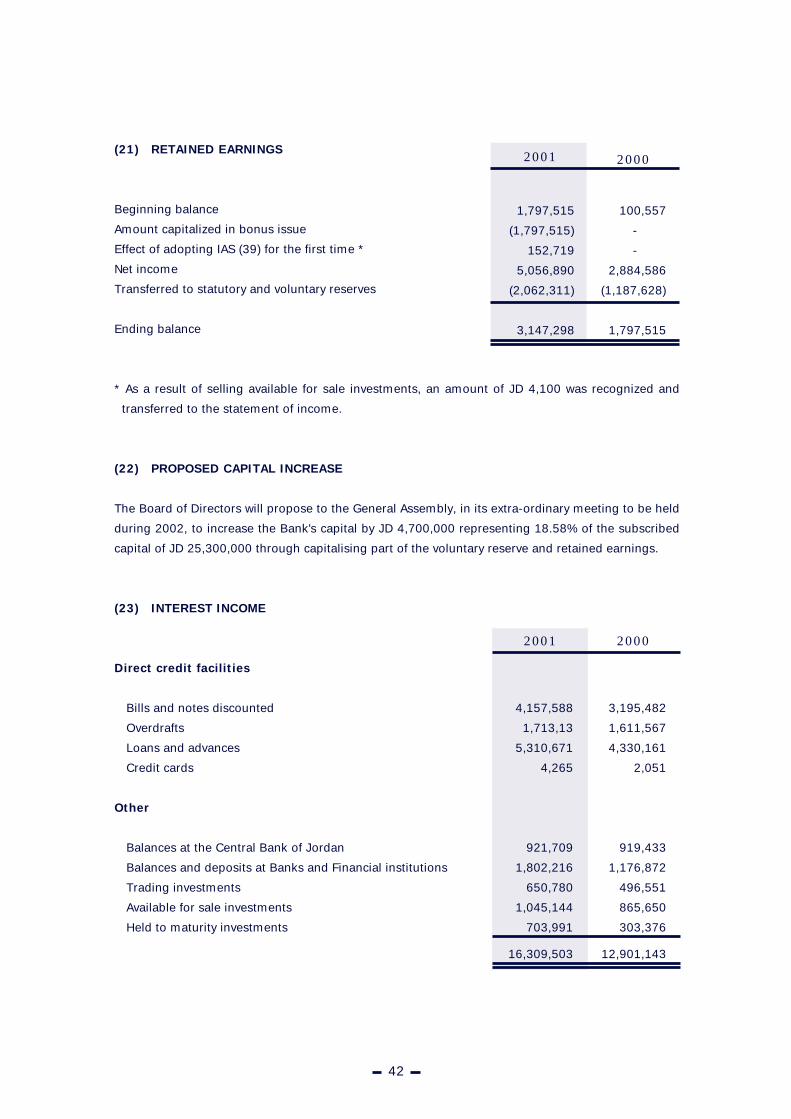
(21) RETAINED EARNINGS
Beginning balance
Amount capitalized in bonus issue
Effect of adopting IAS (39) for the first time *
Net income
Transferred to statutory and voluntary reserves
Ending balance
* As a result of selling available for sale investments, an amount of JD 4,100 was recognized and
transferred to the statement of income.
(22) PROPOSED CAPITAL INCREASE
The Board of Directors will propose to the General Assembly, in its extra-ordinary meeting to be held
during 2002, to increase the Bank's capital by JD 4,700,000 representing 18.58% of the subscribed
capital of JD 25,300,000 through capitalising part of the voluntary reserve and retained earnings.
(23) INTEREST INCOME
Direct credit facilities
Bills and notes discounted
Overdrafts
Loans and advances
Credit cards
Other
Balances at the Central Bank of Jordan
Balances and deposits at Banks and Financial institutions
Trading investments
Available for sale investments
Held to maturity investments
20002001
42
20002001
1,797,515
(1,797,515)
152,719
5,056,890
(2,062,311)
3,147,298
100,557
-
-
2,884,586
(1,187,628)
1,797,515
4,157,588
1,713,13
5,310,671
4,265
921,709
1,802,216
650,780
1,045,144
703,991
16,309,503
3,195,482
1,611,567
4,330,161
2,051
919,433
1,176,872
496,551
865,650
303,376
12,901,143
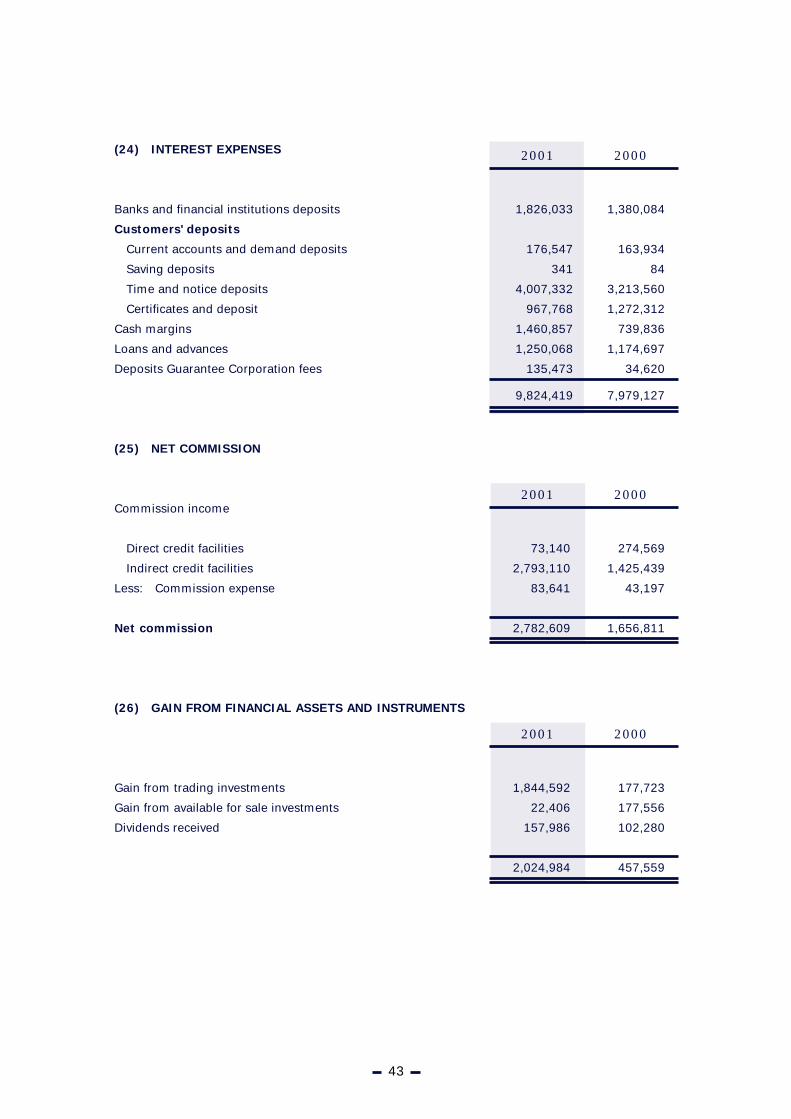
(24) INTEREST EXPENSES
Banks and financial institutions deposits
Customers' deposits
Current accounts and demand deposits
Saving deposits
Time and notice deposits
Certificates and deposit
Cash margins
Loans and advances
Deposits Guarantee Corporation fees
(25) NET COMMISSION
Commission income
Direct credit facilities
Indirect credit facilities
Less: Commission expense
Net commission
(26) GAIN FROM FINANCIAL ASSETS AND INSTRUMENTS
Gain from trading investments
Gain from available for sale investments
Dividends received
2000
73,140
2,793,110
83,641
2,782,609
2001
274,569
1,425,439
43,197
1,656,811
20002001
43
1,826,033
176,547
341
4,007,332
967,768
1,460,857
1,250,068
135,473
9,824,419
1,380,084
163,934
84
3,213,560
1,272,312
739,836
1,174,697
34,620
7,979,127
2000
1,844,592
22,406
157,986
2,024,984
2001
177,723
177,556
102,280
457,559
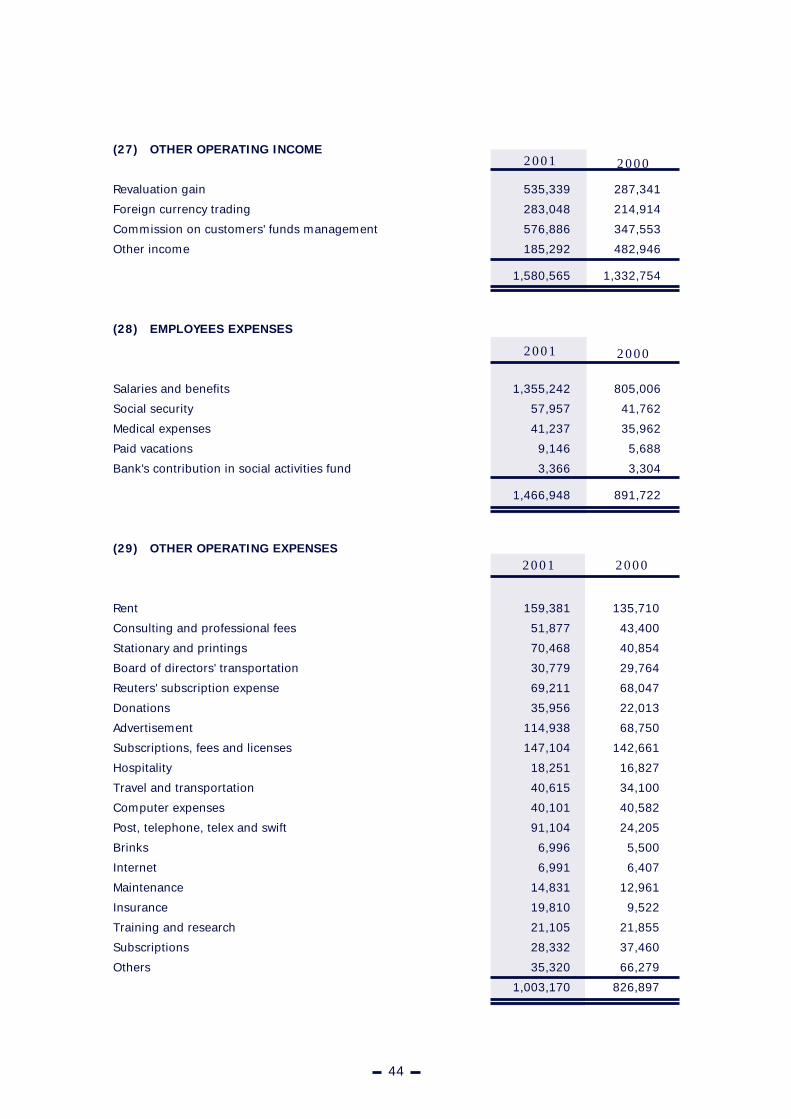
(27) OTHER OPERATING INCOME
Revaluation gain
Foreign currency trading
Commission on customers' funds management
Other income
(28) EMPLOYEES EXPENSES
Salaries and benefits
Social security
Medical expenses
Paid vacations
Bank's contribution in social activities fund
(29) OTHER OPERATING EXPENSES
Rent
Consulting and professional fees
Stationary and printings
Board of directors' transportation
Reuters' subscription expense
Donations
Advertisement
Subscriptions, fees and licenses
Hospitality
Travel and transportation
Computer expenses
Post, telephone, telex and swift
Brinks
Internet
Maintenance
Insurance
Training and research
Subscriptions
Others
44
20002001
535,339
283,048
576,886
185,292
1,580,565
287,341
214,914
347,553
482,946
1,332,754
20002001
1,355,242
57,957
41,237
9,146
3,366
1,466,948
805,006
41,762
35,962
5,688
3,304
891,722
20002001
159,381
51,877
70,468
30,779
69,211
35,956
114,938
147,104
18,251
40,615
40,101
91,104
6,996
6,991
14,831
19,810
21,105
28,332
35,320
1,003,170
135,710
43,400
40,854
29,764
68,047
22,013
68,750
142,661
16,827
34,100
40,582
24,205
5,500
6,407
12,961
9,522
21,855
37,460
66,279
826,897
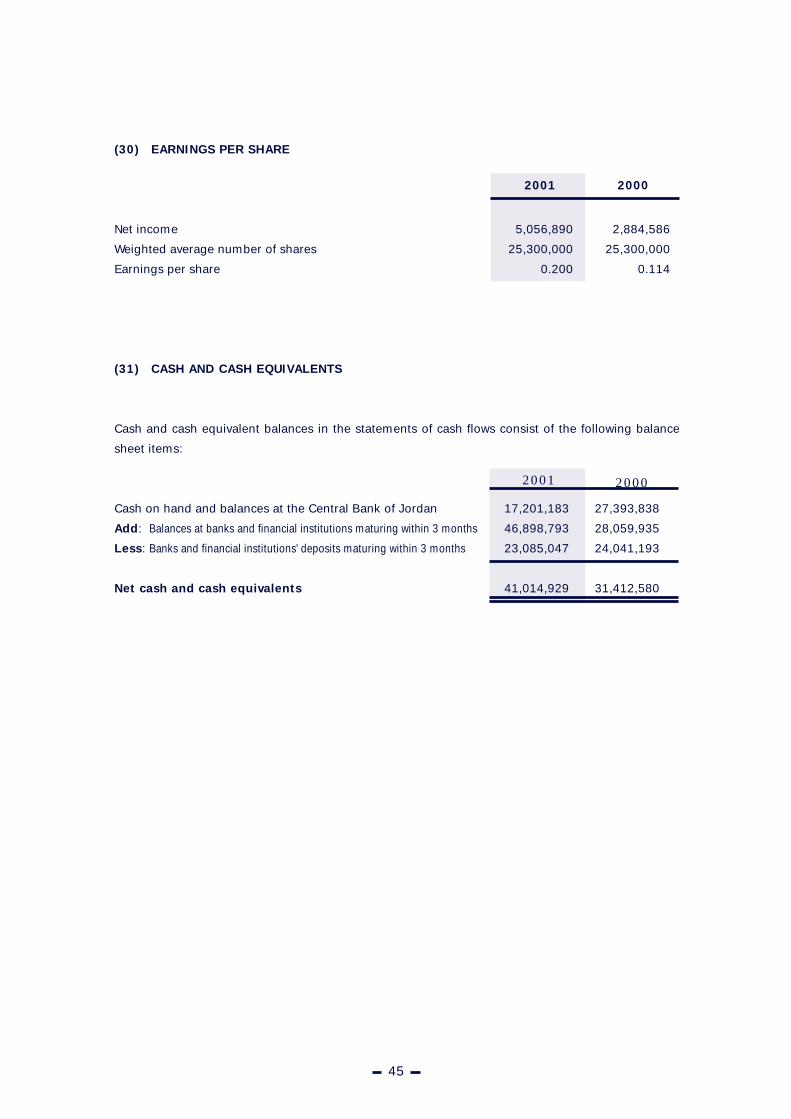
(30) EARNINGS PER SHARE
Net income
Weighted average number of shares
Earnings per share
(31) CASH AND CASH EQUIVALENTS
Cash and cash equivalent balances in the statements of cash flows consist of the following balance
sheet items:
Cash on hand and balances at the Central Bank of Jordan
Add: Balances at banks and financial institutions maturing within 3 months
Less: Banks and financial institutions' deposits maturing within 3 months
Net cash and cash equivalents
2000
2,884,586
25,300,000
0.114
5,056,890
25,300,000
0.200
2001
45
20002001
17,201,183
46,898,793
23,085,047
41,014,929
27,393,838
28,059,935
24,041,193
31,412,580

(32) DERIVATIVES
The following schedule shows the negative and positive fair values of the financial instruments'
derivatives at year end, along with the distribution of the fair value according to the maturity:
December 2001
Derivatives held for trading
Fair value hedging derivatives
Cash flow hedging derivatives
Hedges of net investments
in foreign entities derivatives
December 2000
Derivatives held for trading
Fair value hedging derivatives
Cash flow hedging derivatives
Hedges of net investments
in foreign entities derivatives
(33) FAIR VALUE OF FINANCIAL INSTRUMENTS
Following are financial assets and financial liabilities that were not stated at fair value:
Held to maturity investments
Direct facilities
Banks and financial
Institutions' deposits
Customers' deposit
Margin accounts
Loans and advances
Net difference between
Book value and fair-value
As for credit facilities and due to the fact that there is not a secondary market to trade these facilities, in addition to
the cost and time constraints, the fair value for these facilities can not be computed accurately. However the Bank's
management believes that the fair value of direct facilities is not less than the book value.
46
Positive Fair Value
-
-
82,865
-
82,865
-
-
6,428
-
6,428
-
-
-
-
-
-
-
-
-
-
-
-
14,981,744
-
14,981,744
-
-
9,779,804
-
9,779,804
Negative Fair Value
TotalPar Value
Within3 Months
3 - 12Months
1 -3 Years
Over3 Years
-
-
-
-
-
-
-
-
-
-
-
-
-
-
-
-
-
-
-
-
-
-
-
-
-
-
-
-
-
-
-
14,981,744
-
14,981,744
-
-
9,779,804
-
9,779,804
Par Value Maturity
Book Value DifferenceFair Value2001 2000
Book Value DifferenceFair Value
11,842,738
124,745,146
41,835,047
90,858,759
38,376,502
24,933,424
-
12,000,000
*
41,835,047
90,858,759
38,376,502
24,933,424
-
157,262
-
-
-
-
-
157,262
16,643,497
97,204,703
39,231,193
86,190,539
17,248,349
19,748,716
-
17,000,000
*
39,231,193
86,190,539
17,248,349
19,748,716
-
356,503
-
-
-
-
-
356,503

(34) INTEREST RATE RISKSensitivity of interest rates as of December 31, 2001
ASSETSCash on hand and balances at the
Central Bank of Jordan
Balances at Banks and financial institutions
Deposits at Banks and financial institutions
Trading investments
Credit facilities, net
Available for sale investments
Held to maturity investments, net
Fixed assets, net
Other assets
Total Assets
LIABILITIES AND SHAREHOLDERS' EQUITYLiabilities
Banks and financial institutions' deposits
Customers’ deposits
Margin accounts
Loans and advances
Other liabilities
Income tax provision
Total LiabilitiesShareholders' Equity
Total Liabilities and Shareholders' Equity
Interest rate sensitivity
Off balance sheet items sensitivity
Cumulative interest rate sensitivity gap
Sensitivity of interest rates as of December 31, 2000
ASSETSCash on hand and balances at the
Central Bank of Jordan
Balances at Banks and financial institutions
Trading investments
Credit facilities, net
Available for sale investments
Held to maturity investments, net
Fixed assets, net
Other assets
Total Assets
LIABILITIES AND SHAREHOLDERS' EQUITYLiabilitiesBanks and financial institutions' deposits
Customers' deposits
Margin accounts
Loans and advances
Other liabilities
Income tax provision
Total LiabilitiesShareholders' Equity
Total Liabilities and Shareholders' Equity
Interest rate sensitivity
Off balance sheet items sensitivity
Cumulative interest rate sensitivity gap
47
1 - 3Months
3 - 6Months
1 - 3Years
6 Monthsto 1 Year
Over 3Years
Zero-InterestElements Total
AverageInterest
Rate
2,000,000
44,367,199
-
6,691,421
63,300,419
46,840
1,992,099
-
-
118,397,978
23,085,047
65,259,210
22,055,534
9,414,091
-
-
119,813,882
-
119,813,882
(1,415,904)
-
-
%
3,000,000
500,000
-
-
23,272,136
21,338
9,850,639
-
-
36,644,113
18,750,000
11,166,500
-
1,343,890
-
-
31,260,390
-
31,260,390
5,383,723
-
3,967,819
-
-
-
-
9,789,407
-
-
-
-
9,789,407
-
9,526,055
-
2,080,238
-
-
11,606,293
-
11,606,293
(1,816,886)
-
2,150,933
-
-
500,000
-
20,267,827
12,390,856
-
-
-
33,158,683
-
-
-
5,894,896
-
-
5,894,896
-
5,894,896
27,263,787
-
29,414,720
-
-
-
-
8,022,332
5,191,771
-
-
-
13,214,103
-
-
-
6,200,309
-
-
6,200,309
-
6,200,309
7,013,794
-
36,428,514
12,201,183
2,031,594
-
8,642,517
-
100,000
-
704,268
2,424,938
26,104,500
-
4,906,994
16,320,968
-
7,663,388
1,535,000
30,426,350
32,106,664
62,533,014
(36,428,514)
104,463,802
-
17,201,183
46,898,793
500,000
15,333,938
124,652,121
17,750,805
11,842,738
704,268
2,424,938
237,308,784
41,835,047
90,858,759
38,376,502
24,933,424
7,663,388
1,535,000
205,202,120
32,106,664
237,308,784
-
104,463,802
-
3.33
4.07
6.25
5.98
9.83
8.52
5.94
-
-
5.98
5.47
3.66
6
-
-
1,000,000
-
-
10,193,112
-
9,790,292
-
-
20,983,404
10,048,046
14,831,714
-
1,403,066
-
-
26,282,826
-
26,282,826
(5,299,422)
-
18,087,120
-
-
-
5,706,712
3,974
-
-
-
5,710,686
-
7,081,996
-
1,890,409
-
-
8,972,405
-
8,972,405
(3,261,719)
-
14,825,401
-
-
-
12,158,656
4,878,811
-
-
-
17,037,376
3,000,000
-
-
10,167,455
-
-
13,167,455
-
13,167,455
3,869,921
-
18,695,322
-
-
-
6,530,845
5,382,141
-
-
-
11,912,986
-
-
-
3,389,152
-
-
3,389,152
-
3,389,152
8,523,834
-
27,219,156
11,393,838
-
4,863,616
-
100,000
-
530,994
2,434,554
19,323,002
-
5,763,737
7,855,290
-
5,227,089
930,000
19,776,116
26,766,042
46,542,158
(27,219,156)
68,092,352
-
27,393,838
28,059,935
12,709,481
97,204,703
10,364,926
16,643,497
530,994
2,434,554
195,341,928
39,231,193
86,190,539
17,248,349
19,748,716
5,227,089
930,000
168,575,886
26,766,042
195,341,928
-
68,092,352
-
6.23
5.54
7.12
11.78
5.49
6.72
-
-
6.9
8.11
7.49
6.69
-
-
15,000,000
28,059,935
7,845,865
62,615,469
-
6,853,205
-
-
120,374,474
26,183,147
58,513,092
9,393,059
2,898,634
-
-
96,987,932
-
96,987,932
23,386,542
-
-

(35) LIQUIDITY RISK
December 31, 2001
Cash on hand and balances at the
Central Bank of Jordan
Balances at Banks and financial institutions
Deposits at banks and financial institutions
Trading investments
Credit facilities, net
Available for sale investments
Held to maturity investments, net
Fixed assets, net
Other assets
Total Assets
LIABILITIES AND SHAREHOLDERS' EQUITYLiabilities Banks and financial institutions' deposits
Customers’ Deposits
Margin accounts
Borrowing fund
Other liabilities
Income tax provision
Total Liabilities
Shareholders' Equity
Total Liabilities and Shareholders' Equity
Liquidity risk
Cumulative liquidity risk sensitivity gap
December 31, 2000
Cash on hand and balances at the
Central Bank of Jordan
Balances at Banks and financial institutions
Trading investments
Credit facilities, net
Available for sale investments
Held to maturity investments, net
Fixed assets, net
Other assets
Total Assets
LIABILITIES AND SHAREHOLDERS' EQUITYLiabilitiesBanks and financial institutions' deposits
Customers' deposits
Margin accounts
Loans and advances
Other liabilities
Income tax provision
Total LiabilitiesShareholders' EquityTotal Liabilities and Shareholders' Equity
Liquidity risk
Cumulative liquidity risk sensitivity gap
7,967,791
36,117,976
-
15,333,938
40,969,121
-
1,992,099
-
-
102,380,925
6,356,478
51,167,174
16,320,968
909,964
-
1,535,000
76,289,584
-
76,289,584
26,091,341
-
16,393,838
27,859,9351
12,709,481
29,553,995
-
-
-
-
86,517,249
22,541,194
52,977,270
7,855,290
1,541,690
-
930,000
85,845,444
-
85,845,444
671,805
-
48
Within1 Month
1 - 3Months
6 Monthsto 1 Year
3 - 6Months
1 - 3Years
No SpecificMaturity TotalOver
3 Years
-
-
-
-
22,331,298
46,840
-
-
-
22,378,138
2,692,299
8,922,534
22,055,534
8,504,127
-
-
42,174,494
-
42,174,494
(19,796,356)
6,294,985
10,000,000
-
-
33,061,474
-
6,853,205
-
-
49,914,679
4,839,999
11,299,559
9,393,059
1,356,945
-
-
26,889,562
-
26,889,562
23,025,117
23,696,922
3,000,000
500,000
-
-
23,272,136
21,338
9,850,639
-
-
36,644,113
15,750,000
11,166,500
-
1,343,890
-
-
28,260,390
-
28,260,390
8,383,723
9,861,822
1,000,000
200,000
-
10,193,112
-
9,790,292
-
-
21,183,404
8,850,000
14,831,714
-
1,403,066
-
-
25,084,780
-
25,084,780
( 3,901,376)
19,795,546
17,201,183
46,898,793
500,000
15,333,938
124,652,121
17,750,805
11,842,738
704,268
2,424,938
237,308,784
41,835,047
90,858,759
38,376,502
24,933,424
7,663,388
1,535,000
205,202,120
32,106,664
237,308,784
-
-
27,393,838
28,059,935
12,709,481
97,204,703
10,364,926
16,643,497
530,994
2,434,554
195,341,928
39,231,193
86,190,539
17,248,349
19,748,716
5,227,089
930,000
168,575,886
26,766,042
195,341,928
-
-
-
-
-
-
9,789,407
-
-
-
-
9,789,407
3,000,000
9,526,055
-
2,080,238
-
-
14,606,293
-
14,606,293
( 4,816,886)
9,861,822
-
-
-
5,706,712
3,974
-
-
-
5,710,686
-
2,081,996
-
1,890,409
-
-
3,972,405
-
3,972,405
1,738,281
21,533,827
-
-
500,000
-
20,267,827
12,390,856
-
-
-
33,158,683
-
-
-
5,894,238
-
-
5,894,896
-
5,894,896
27,263,787
37,152,609
-
-
-
12,158,565
4,878,811
-
-
-
17,037,376
3,000,000
5,000,000
-
7,723,792
-
-
15,723,792
-
15,723,792
1,313,584
22,847,411
-
-
-
-
8,022,332
5,191,771
-
-
-
13,214,103
-
-
-
6,200,309
-
-
6,200,309
-
6,200,309
7,013,794
44,139,403
-
-
-
6,530,845
5,482,141
-
-
-
12,012,986
-
-
-
5,832,814
-
-
5,832,814
-
5,832,814
6,180,172
29,027,583
6,233,392
10,280,817
-
-
-
100,000
-
704,268
2,424,938
19,743,415
14,036,270
10,076,496
-
-
7,663,388
-
31,776,154
32,106,664
63,882,818
(44,139,403)
-
-
-
-
-
-
-
530,994
2,434,554
2,965,548
-
-
-
-
5,227,089
-
5,227,089
26,766,042
31,993,131
(29,027,583)
-
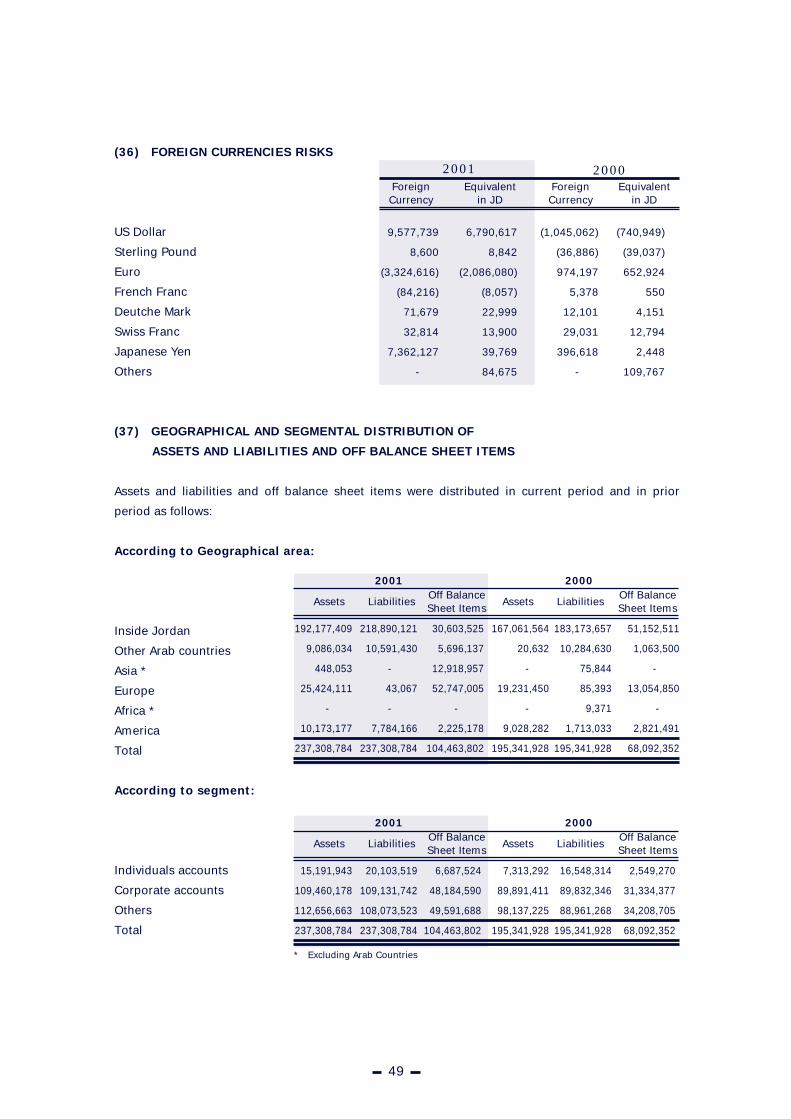
(36) FOREIGN CURRENCIES RISKS
US Dollar
Sterling Pound
Euro
French Franc
Deutche Mark
Swiss Franc
Japanese Yen
Others
(37) GEOGRAPHICAL AND SEGMENTAL DISTRIBUTION OF
ASSETS AND LIABILITIES AND OFF BALANCE SHEET ITEMS
Assets and liabilities and off balance sheet items were distributed in current period and in prior
period as follows:
According to Geographical area:
Inside Jordan
Other Arab countries
Asia *
Europe
Africa *
America
Total
According to segment:
Individuals accounts
Corporate accounts
Others
Total
20002001
9,577,739
8,600
(3,324,616)
(84,216)
71,679
32,814
7,362,127
-
(740,949)
(39,037)
652,924
550
4,151
12,794
2,448
109,767
6,790,617
8,842
(2,086,080)
(8,057)
22,999
13,900
39,769
84,675
ForeignCurrency
Equivalentin JD
ForeignCurrency
Equivalentin JD
(1,045,062)
(36,886)
974,197
5,378
12,101
29,031
396,618
-
AssetsOff BalanceSheet Items
Liabilities
2001 2000
192,177,409
9,086,034
448,053
25,424,111
-
10,173,177
237,308,784
218,890,121
10,591,430
-
43,067
-
7,784,166
237,308,784
AssetsOff BalanceSheet Items
Liabilities
30,603,525
5,696,137
12,918,957
52,747,005
-
2,225,178
104,463,802
167,061,564
20,632
-
19,231,450
-
9,028,282
195,341,928
183,173,657
10,284,630
75,844
85,393
9,371
1,713,033
195,341,928
51,152,511
1,063,500
-
13,054,850
-
2,821,491
68,092,352
Assets Liabilities
2001 2000
15,191,943
109,460,178
112,656,663
237,308,784
20,103,519
109,131,742
108,073,523
237,308,784
Assets Liabilities
6,687,524
48,184,590
49,591,688
104,463,802
7,313,292
89,891,411
98,137,225
195,341,928
16,548,314
89,832,346
88,961,268
195,341,928
2,549,270
31,334,377
34,208,705
68,092,352
Off BalanceSheet Items
Off BalanceSheet Items
* Excluding Arab Countries
49
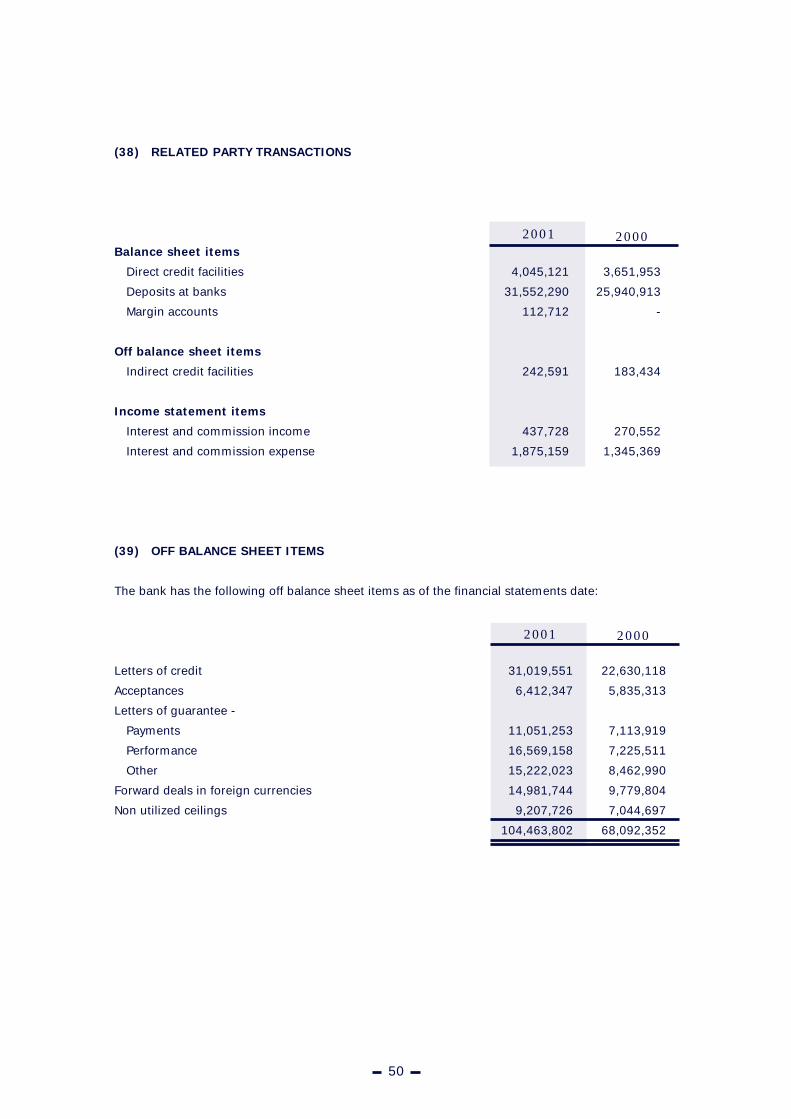
(38) RELATED PARTY TRANSACTIONS
Balance sheet items
Direct credit facilities
Deposits at banks
Margin accounts
Off balance sheet items
Indirect credit facilities
Income statement items
Interest and commission income
Interest and commission expense
(39) OFF BALANCE SHEET ITEMS
The bank has the following off balance sheet items as of the financial statements date:
Letters of credit
Acceptances
Letters of guarantee -
Payments
Performance
Other
Forward deals in foreign currencies
Non utilized ceilings
20002001
4,045,121
31,552,290
112,712
242,591
437,728
1,875,159
20002001
31,019,551
6,412,347
11,051,253
16,569,158
15,222,023
14,981,744
9,207,726
104,463,802
22,630,118
5,835,313
7,113,919
7,225,511
8,462,990
9,779,804
7,044,697
68,092,352
3,651,953
25,940,913
-
183,434
270,552
1,345,369
50

(40) LITIGATION
The Bank appears as a defendant in one lawsuit filed against it in the normal course of business for
JD 1,428,676 as of December 31, 2001.
According to lawyer's opinion the outcome of the lawsuit will be favourable and the Bank's
management believes that there is no need to provide for this lawsuit.
(41) RECLASSIFICATIONS
Some of 2000 balances were reclassified to correspond with 2001 classifications.
51

OtherDisclosures
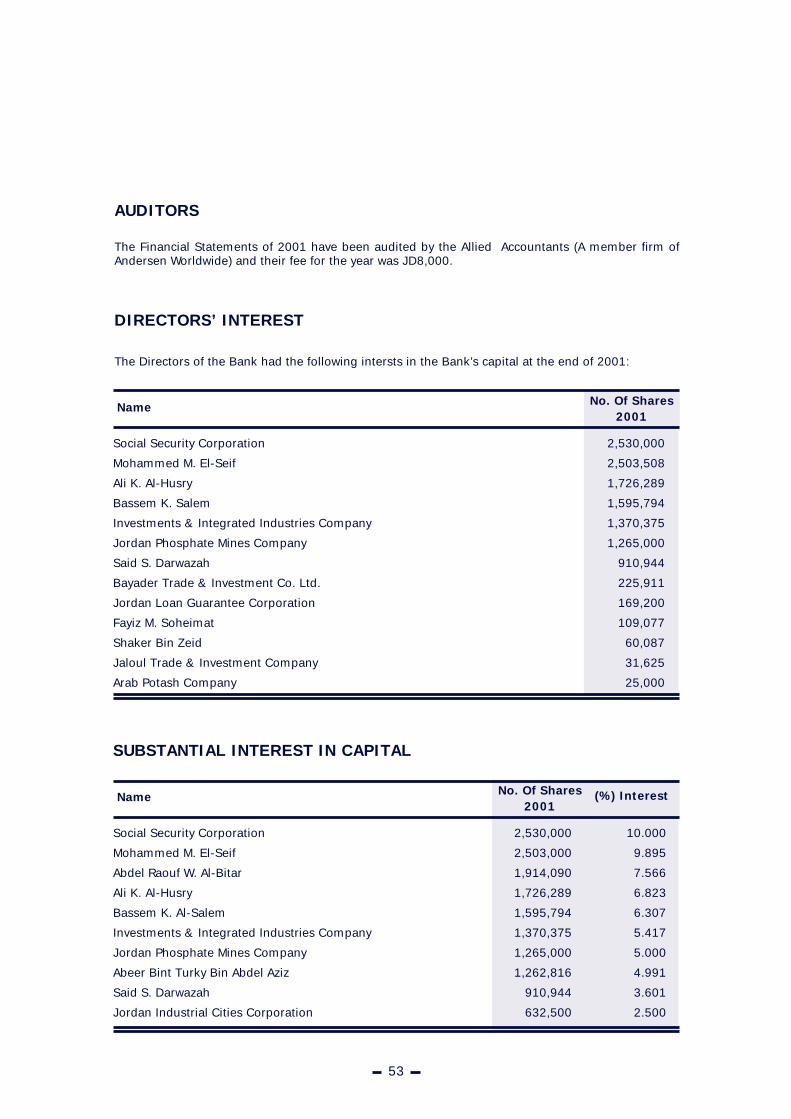
AUDITORS
The Financial Statements of 2001 have been audited by the Allied Accountants (A member firm ofAndersen Worldwide) and their fee for the year was JD8,000.
DIRECTORS’ INTEREST
The Directors of the Bank had the following intersts in the Bank’s capital at the end of 2001:
Social Security Corporation
Mohammed M. El-Seif
Ali K. Al-Husry
Bassem K. Salem
Investments & Integrated Industries Company
Jordan Phosphate Mines Company
Said S. Darwazah
Bayader Trade & Investment Co. Ltd.
Jordan Loan Guarantee Corporation
Fayiz M. Soheimat
Shaker Bin Zeid
Jaloul Trade & Investment Company
Arab Potash Company
2,530,000
2,503,508
1,726,289
1,595,794
1,370,375
1,265,000
910,944
225,911
169,200
109,077
60,087
31,625
25,000
Name No. Of Shares2001
SUBSTANTIAL INTEREST IN CAPITAL
Social Security Corporation
Mohammed M. El-Seif
Abdel Raouf W. Al-Bitar
Ali K. Al-Husry
Bassem K. Al-Salem
Investments & Integrated Industries Company
Jordan Phosphate Mines Company
Abeer Bint Turky Bin Abdel Aziz
Said S. Darwazah
Jordan Industrial Cities Corporation
10.000
9.895
7.566
6.823
6.307
5.417
5.000
4.991
3.601
2.500
Name (%) Interest
2,530,000
2,503,000
1,914,090
1,726,289
1,595,794
1,370,375
1,265,000
1,262,816
910,944
632,500
No. Of Shares2001
53
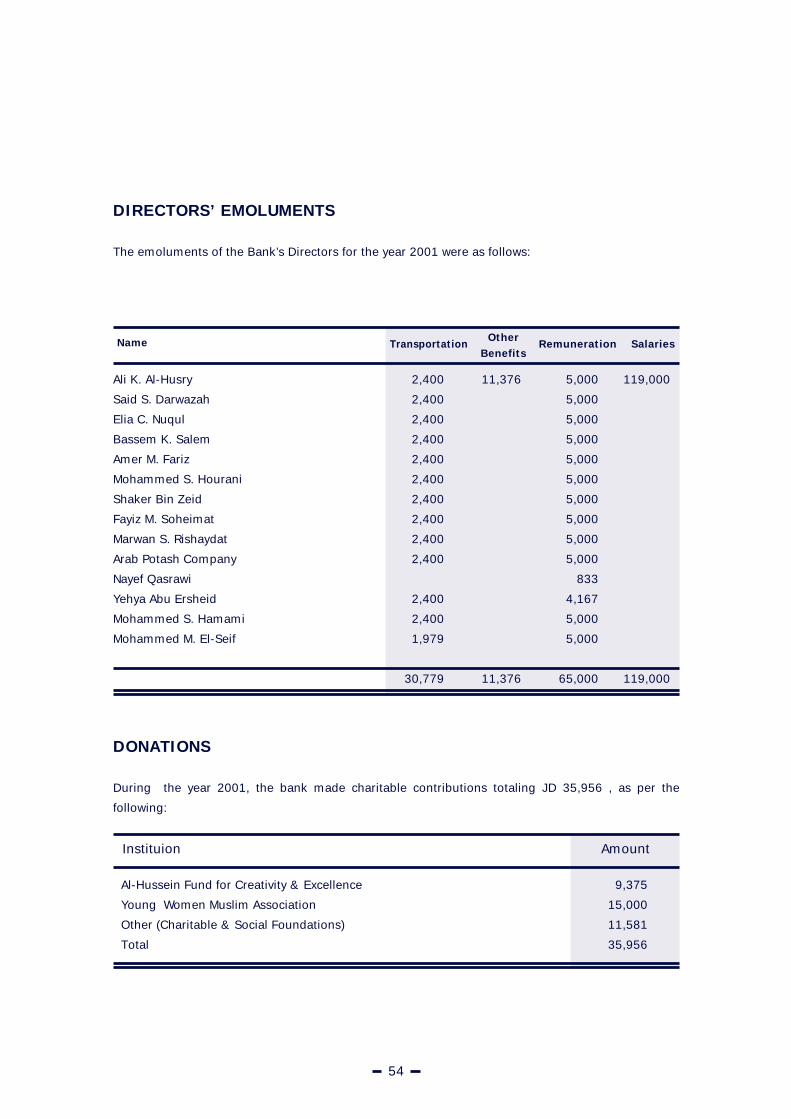
DIRECTORS’ EMOLUMENTS
The emoluments of the Bank’s Directors for the year 2001 were as follows:
Ali K. Al-Husry
Said S. Darwazah
Elia C. Nuqul
Bassem K. Salem
Amer M. Fariz
Mohammed S. Hourani
Shaker Bin Zeid
Fayiz M. Soheimat
Marwan S. Rishaydat
Arab Potash Company
Nayef Qasrawi
Yehya Abu Ersheid
Mohammed S. Hamami
Mohammed M. El-Seif
119,000
119,000
Name Salaries
5,000
5,000
5,000
5,000
5,000
5,000
5,000
5,000
5,000
5,000
833
4,167
5,000
5,000
65,000
Remuneration
11,376
11,376
2,400
2,400
2,400
2,400
2,400
2,400
2,400
2,400
2,400
2,400
2,400
2,400
1,979
30,779
OtherBenefits
Transportation
DONATIONS
During the year 2001, the bank made charitable contributions totaling JD 35,956 , as per the
following:
Instituion
Al-Hussein Fund for Creativity & Excellence
Young Women Muslim Association
Other (Charitable & Social Foundations)
Total
Amount
9,375
15,000
11,581
35,956
54
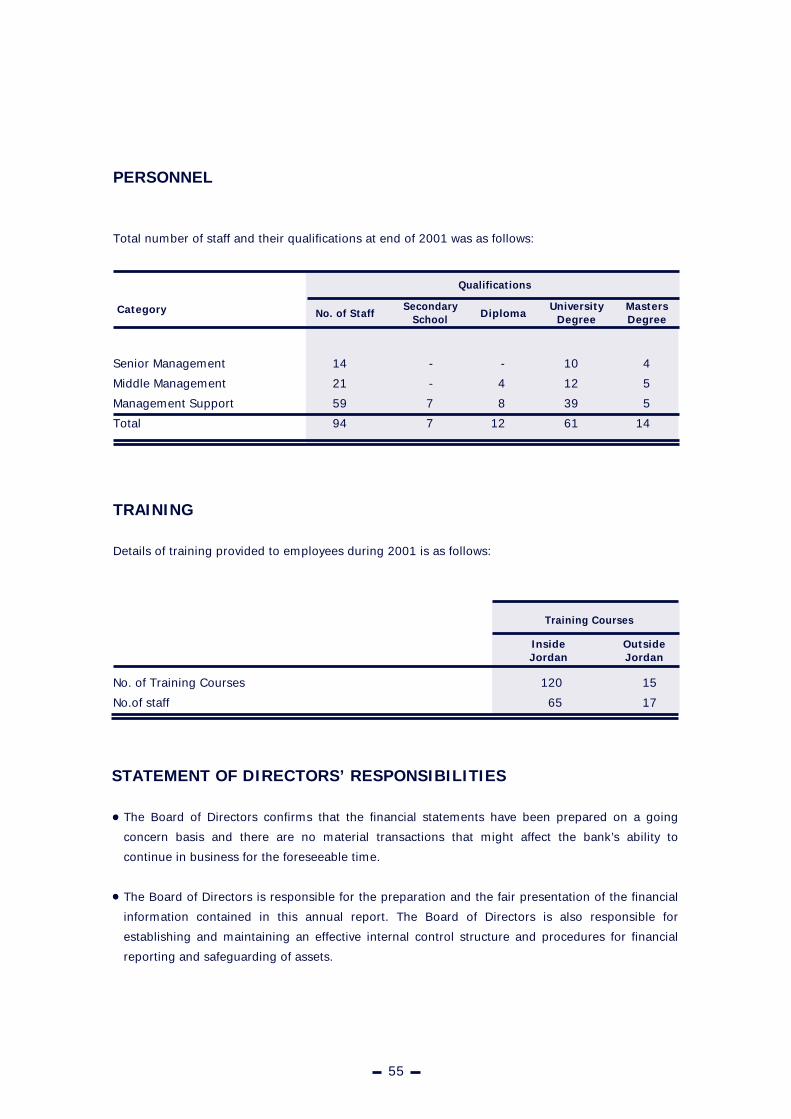
PERSONNEL
Total number of staff and their qualifications at end of 2001 was as follows:
Senior Management
Middle Management
Management Support
Total
4
5
5
14
Category
10
12
39
61
UniversityDegree
-
4
8
12
-
-
7
7
DiplomaSecondary
SchoolNo. of Staff
Qualifications
14
21
59
94
MastersDegree
TRAINING
Details of training provided to employees during 2001 is as follows:
No. of Training Courses
No.of staff
15
17
120
65
InsideJordan
Training Courses
OutsideJordan
55
STATEMENT OF DIRECTORS’ RESPONSIBILITIES
The Board of Directors confirms that the financial statements have been prepared on a going
concern basis and there are no material transactions that might affect the bank’s ability to
continue in business for the foreseeable time.
The Board of Directors is responsible for the preparation and the fair presentation of the financial
information contained in this annual report. The Board of Directors is also responsible for
establishing and maintaining an effective internal control structure and procedures for financial
reporting and safeguarding of assets.
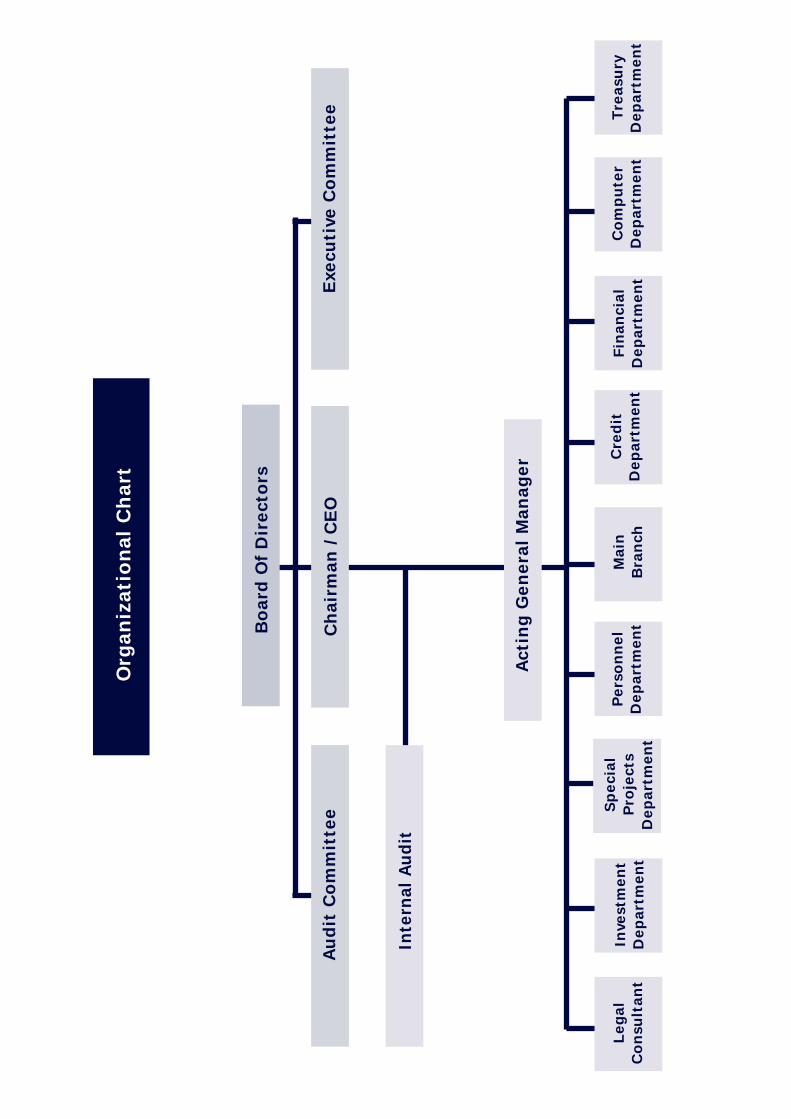
Boar
d O
f D
irect
ors
Ch
airm
an /
CE
OA
ud
it C
om
mit
tee
Exe
cuti
ve C
om
mit
tee
Act
ing G
en
era
l M
anag
er
Inte
rnal
Au
dit
Legal
Con
sult
ant
Inve
stm
en
tD
ep
artm
en
tP
ers
on
nel
Dep
artm
en
tM
ain
Bra
nch
Cre
dit
Dep
artm
en
tFin
anci
alD
ep
artm
en
tC
om
pu
ter
Dep
artm
en
tTre
asu
ryD
ep
artm
en
t
Org
aniz
atio
nal
Ch
art
Sp
eci
alP
roje
cts
Dep
artm
en
t