The productivity-bias hypothesis and the PPP theorem: new evidence from panel vector autoregressive...
18
The productivity-bias hypothesis and the PPP theorem: new evidence from panel vector autoregressive models Johan Ericsson a,1 , Manuchehr Irandoust b,* a Department of Economic Statistics, Stockholm School of Economics, Box 6501, SE-113 83, Stockholm, Sweden b Department of Economics, University of O ¨ rebro, SE-701 82, O ¨ rebro, Sweden Received 26 November 2001; received in revised form 7 January 2003; accepted 7 February 2003 Abstract In this paper, we use panel vector autoregressive models to test both the purchasing power parity (PPP) relation and the productivity-bias hypothesis for Sweden vis-a-vis nine of its major trading partners (Denmark, Finland, France, Germany, Italy, Japan, Norway, the UK, and the US) for the period 1973– 1999. The departure from earlier studies of the productivity-bias hypothesis and the PPP theorem is in the asymptotic theory of panel co-integration allowing for multiple co-integrating vectors. It has been demonstrated that the weak version of PPP receives strong support. Our findings also show that in the Euro-country cases, the deviation of PPP from the equilibrium exchange rate has a long-run relationship with the productivity ratios, implying that as Sweden becomes relatively more productive, the Swedish SEK appreciates in real terms. The results have policy implications for monetary integration in Europe, and in particular for Swedish participation in the European Monetary Union (EMU). # 2003 Elsevier Science B.V. All rights reserved. JEL classification: C12; C32; F31; E31 Keywords: Panel co-integration techniques; Panel-VAR models; Productivity-bias hypothesis; PPP 1. Introduction The theorem of purchasing power parity (PPP) is a monetary theory of the long-run nominal exchange rate and is one of the oldest hypotheses in economics. In its absolute Japan and the World Economy 16 (2004) 121–138 * Corresponding author. Tel.: þ46-19-30-33-98; fax: þ46-19-33-25-46. E-mail addresses: [email protected] (J. Ericsson), [email protected] (M. Irandoust). 1 Tel: þ46-8-736-92-47; fax: þ46-8-34-81-61. 0922-1425/$ – see front matter # 2003 Elsevier Science B.V. All rights reserved. doi:10.1016/S0922-1425(03)00015-X
-
Upload
johan-ericsson -
Category
Documents
-
view
212 -
download
0
Transcript of The productivity-bias hypothesis and the PPP theorem: new evidence from panel vector autoregressive...

The productivity-bias hypothesis and the PPPtheorem: new evidence from panel vector
autoregressive models
Johan Ericssona,1, Manuchehr Irandoustb,*
aDepartment of Economic Statistics, Stockholm School of Economics,
Box 6501, SE-113 83, Stockholm, SwedenbDepartment of Economics, University of Orebro, SE-701 82, Orebro, Sweden
Received 26 November 2001; received in revised form 7 January 2003; accepted 7 February 2003
Abstract
In this paper, we use panel vector autoregressive models to test both the purchasing power parity (PPP)
relation and the productivity-bias hypothesis for Sweden vis-a-vis nine of its major trading partners
(Denmark, Finland, France, Germany, Italy, Japan, Norway, the UK, and the US) for the period 1973–
1999. The departure from earlier studies of the productivity-bias hypothesis and the PPP theorem is in
the asymptotic theory of panel co-integration allowing for multiple co-integrating vectors. It has been
demonstrated that the weak version of PPP receives strong support. Our findings also show that in the
Euro-country cases, the deviation of PPP from the equilibrium exchange rate has a long-run relationship
with the productivity ratios, implying that as Sweden becomes relatively more productive, the Swedish
SEK appreciates in real terms. The results have policy implications for monetary integration in Europe,
and in particular for Swedish participation in the European Monetary Union (EMU).
# 2003 Elsevier Science B.V. All rights reserved.
JEL classification: C12; C32; F31; E31
Keywords: Panel co-integration techniques; Panel-VAR models; Productivity-bias hypothesis; PPP
1. Introduction
The theorem of purchasing power parity (PPP) is a monetary theory of the long-run
nominal exchange rate and is one of the oldest hypotheses in economics. In its absolute
Japan and the World Economy
16 (2004) 121–138
* Corresponding author. Tel.: þ46-19-30-33-98; fax: þ46-19-33-25-46.
E-mail addresses: [email protected] (J. Ericsson), [email protected] (M. Irandoust).1 Tel: þ46-8-736-92-47; fax: þ46-8-34-81-61.
0922-1425/$ – see front matter # 2003 Elsevier Science B.V. All rights reserved.
doi:10.1016/S0922-1425(03)00015-X

form, the PPP theorem is an equilibrium condition equating the nominal exchange rate
between two countries with the price ratio. Thus, the PPP theorem implies that, in the
long run, two countries’ price levels are equal when converted to a common currency.
According to the PPP theorem, the nominal exchange rate adjusts to offset changes in
relative prices, implying that the real exchange rate should remain at a constant value.
Therefore, fluctuations in the real exchange rate are synonymous with deviations from
long-run PPP.
In this paper, we examine the PPP principle and the productivity-bias hypothesis for
Sweden vis-a-vis nine of its major trading partners (Denmark, Finland, France, Germany,
Italy, Japan, Norway, the UK, and the US) for the period 1973–1999. The reason for the
choice of this period is availability of the data used in this study. The methodology used
here is a combination of the Johansen (1988, 1991, 1995) multivariate maximum likelihood
procedure and the asymptotic theory of panel co-integration developed by Larsson and
Lyhagen (1999) and Larsson et al. (2001). This study is probably the first attempt to test the
productivity-bias hypothesis and the PPP theorem using panel co-integration techniques
and panel-VAR models allowing for multiple co-integrating vectors.
There is widespread agreement that substantial deviations from PPP have occurred since
the abandonment of the Bretton–Woods system. That is, there is no equilibrium value to
which the real exchange rate tends to return. In the existing empirical literature, many
authors indeed cannot reject the hypothesis that real exchange rates follow a random walk
process. Thus, changes in the real exchange rate are considered permanent. Intertemporal
equilibrium exchange rate models indicate that changes in relative prices, due to traded/
non-traded productivity differentials, can induce changes in exchange rates and deviations
from PPP (e.g. Rogoff, 1992; Asea and Mendoza, 1994). Real exchange rate changes in
response to productivity growth differentials have been labeled in the literature as the
‘‘productivity-bias hypothesis’’ or ‘‘Balassa–Samuelson effect’’, and it reflects the view
that an increase in a country’s relative productivity creates an appreciation of its real
exchange rate (Balassa, 1964; Samuelson, 1964; Officer, 1976).
The Balassa–Samuelson model suggests that deviations between any exchange rate and
its PPP value stem from productivity gap between the traded and non-traded sectors of
economies. Such differentials in productivity performance will affect real exchange rates if
productivity growth is concentrated in the traded sectors of both economies. Consequently,
if productivity in the domestic traded goods sector grows more rapidly than productivity in
the non-traded goods sector, under the assumption of wage equalization across sectors, the
relative price between traded and non-traded goods has to fall. Since the price of traded
goods are equalized between countries through arbitrage, the general price level will rise at
home. It follows that the real exchange rate will appreciate.
Existing empirical research on the PPP theorem and the productivity-bias hypothesis has
produced mixed results. Among the studies that have supported the productivity-bias
hypothesis can be cited those by Balassa (1964), Hsieh (1982), Edison and Klovland
(1987), Marston (1987), Obstfeld (1993), De Gregorio et al. (1994), Bahmani-Oskooee and
Rhee (1996), and Beachill and Pugh (1998). These studies conclude that the deviation of
the real exchange rate from its time-varying, long-run equilibrium value is a function of
productivity or real shocks. Others such as Froot and Rogoff (1991a,b), Rogers and Jenkins
(1995), Mark and Choi (1997) have little or no support for the productivity-bias hypothesis.
122 J. Ericsson, M. Irandoust / Japan and the World Economy 16 (2004) 121–138

With regard to the PPP theorem, the results are also mixed and contradictory. Examples are
Cheung and Lai (1993), Pedroni (1996), Crowder (1996), Oh (1996), Kouretas (1997),
Papell (1997), and O’Connell (1998).
As a whole, these studies employ different estimation techniques and attempt to explain
many stylized facts, such as the observed variations or trends in real exchange rates and co-
movements between real exchange rates and real shocks. The results, however, are mixed
and highly sensitive to the year chosen and to the countries included in the regressions.
The previous studies that apply time-series techniques can be categorized in two groups.
The first group applies a maximum likelihood procedure suggested by Johansen (1988) and
Johansen and Juselius (1990) to test for co-integration among the variables defined by the
real exchange rate. The second group applies residual-based test for co-integration by using
unit-root test on the real exchange rate. Both of these categories have several drawbacks.
The problem with the first group is that the test is based on asymptotic theory and,
therefore, it requires a large number of observations. Furthermore, the most critical step in
the Johansen method is the determination of the number of co-integration rank. Toda
(1994, 1995) performs a simulation study on the selection of co-integration rank. The result
shows that the number of observations less than 100 can give rise to misleading results and
erroneous inferences. The problems with the second group, which applies unit-root test, are
well known. First, unit-root test has low power against the alternative if the sample size is of
a moderate level. To increase the power of the unit-root test, Pedroni (1996) uses fully
modified OLS for heterogeneous panels to test PPP. O’Connell (1998) proposes a panel
unit-root test that allows cross-sectional correlation between countries, which is thought to
be important for the size and the power of unit-root test. Secondly, in the unit-root test for
PPP, it is assumed that there is a one-to-one relationship between the exchange rate and the
fixed price levels. This restriction holds in theory with no transport costs and no
measurement error and these limitations are not acceptable in practice. In addition,
residual-based test of co-integration is relied on the assumption of a unique co-integrating
vector, which may not be the case. Furthermore, the problem of normalization is presented.
This paper seeks to overcome these problems by using a panel vector autoregressive
model where multiple co-integrating vectors are allowed. Hence, the assumption of a
unique co-integrating vector and the problem of normalization are relaxed. However, the
methodology used in this paper is based on the Johansen multivariate maximum likelihood-
based inference of co-integrated vector autoregressive models and the standard-trace tests.
The trace tests are used to perform the co-integration rank tests for each country separately
and this provides the basis for the panel tests on co-integration rank suggested recently in
the literature.
One of the major advantages of using a panel-rank test is a significant increase in power
when the cross-sectional dimension of the panel is expanded as compared with the well-
known low power of standard co-integration test for small samples (Pedroni, 1996; Kao,
1999; Larsson and Lyhagen, 1999; Larsson et al., 2001). Furthermore, the panel model
allows for straightforward panel tests of model specification.
However, this paper has following advantages: (i) the sample spans different exchange
rate regimes from fixed Bretton–Woods system over the flexible snake period and the
European Monetary System (EMS) period up until today’s floating system; (ii) a number of
the previous studies has focused mainly on estimating models using labor productivity
J. Ericsson, M. Irandoust / Japan and the World Economy 16 (2004) 121–138 123

rather than total factor productivity (TFP), the former is not a complete measure of
productivity and more important it may pick up business cycles frequencies; and (iii) the
technique used here allows for multiple co-integrating vector in the economic relationship.
The paper is organized as follows. Section 2 reviews the theoretical considerations of the
PPP hypothesis and its relationship with the supply side determinants of the real exchange
rate. In Section 3, we present the data and the methodology used in this paper. In Section 4,
we present and interpret the empirical results. Section 5 offers conclusions.
2. Theoretical considerations
The theoretical framework adopted here draws essentially on the conjectures of Balassa
(1964), Samuelson (1964), Froot and Rogoff (1995), and Strauss (1999). The PPP theorem
asserts that nominal exchange rate is equal to the domestic price level and the foreign price
level ratio. This implies that when the nominal exchange rate goes up or down, the relative
price levels will adjust continuously in order to maintain the real exchange close to its long-
run equilibrium level. In other words, PPP is a necessarily condition for the real exchange
rate to be mean reverting.
The PPP theorem has two important implied restrictions. The first restriction is that of
symmetry between the two price indices. The second is the proportionality condition
between the nominal exchange rate and the relative price defined from the symmetry
restriction. The first-order necessary condition is that the three variables comprised by the
PPP relationship have a long-run, stable, and steady-state equilibrium. It is possible that the
necessary condition of a stable steady state exists even when the second-order condition
fails. In this case, PPP is rejected. The PPP theorem is often formulated as
eijt ¼ dþ p1pit � p2pjt (1)
where eijt is the exchange rate defined as domestic currency per unit of foreign currency, pit,
and pjt are domestic and foreign price levels, respectively. All variables are expressed in
natural logs. Unfortunately, Eq. (1) cannot be estimated with a panel.2 To set up a panel
vector autoregressive model, the operationalized version of the PPP relationship is given by
eijt ¼ dþ p1ðpit � pjtÞ (2)
The necessary condition for PPP to hold, and that the real exchange rate is mean
reverting, implies that Eq. (2) presents a co-integrating relationship. In other words, Eq. (2)
is a stable, and steady-state equilibrium. However, the second condition, p1 ¼ 1 in Eq. (2),
must be fulfilled. The second condition implies that the co-integrating space must be
spanned by the co-integrated vector b ¼ ðb1; b2Þ ¼ ð�1; 1Þ, where b1 and b2 are the
long-run coefficients for the nominal exchange rate and the price ratio, respectively, when
normalized on the exchange rate. There is strong empirical evidence that PPP does not
hold in its strict form, supporting that the nominal exchange rate and price ratio are
2 When using the panel approach, the individual country-by-country test must be independent. If Eq. (1) is
used, the Swedish price series is included in all country-by-country tests. This implies that the assumption of
independence is violated.
124 J. Ericsson, M. Irandoust / Japan and the World Economy 16 (2004) 121–138

co-integrated, but the symmetric condition is not satisfied. In other words, the real
exchange rate is mean reverting but the long-run equilibrium value has not the correspond-
ing PPP value.3
Balassa (1964) and Samuelson (1964) argue that deviations between any exchange rate
and its PPP value stem from productivity gap between the traded and non-traded sectors of
economies. They consider a small open economy that produces traded and non-traded
goods. Assume that the price level, p, consists of traded goods, pT, and non-traded good,
pNT.
p ¼ ð1 � aÞpT þ apNT; p� ¼ ð1 � a�Þp�T þ a�p�
NT (3)
where � denotes the foreign economy and a, and (1 � a) are the shares of non-traded and
(traded) goods in the economy. All variables are expressed in logs. Now, the real exchange
rate is defined as
q ¼ e þ p� � p (4)
Substitution of Eq. (3) into Eq. (4) yields the real exchange rates as a function of the
domestic and foreign relative prices of non-tradables:
q ¼ ðe þ p�T � pTÞ � aðpNT � pTÞ þ a�ðp�
NT � p�TÞ (5)
In the Balassa–Samuelson model, the real exchange rate is determined entirely by the
production technology if PPP holds among traded goods so that e þ p�T � pT ¼ 0; the terms
of trade are constant; capital can be transferred across countries; production functions for
sectors are represented by constant returns to scale; and there are free movements of
production factors between sectors. To write Eq. (5) in terms of productivity, it is assumed
that there are competitive markets where firms set prices to reflect unit labor costs. This
results in
pT ¼ w � aT; pNT ¼ w � aNT; p�T ¼ w� � a�
T; p�NT ¼ w� � a�
NT (6)
where ai represents productivity. Eq. (6) implies that the relative price of non-traded goods
is equal to relative productivity on tradables.4 Substitution of Eq. (6) into Eq. (5) yields the
real exchange rate as a function of relative productivities:
q ¼ �aðaT � aNTÞ þ a�ða�T � a�
NTÞ (7)
The above discussion of the real exchange rate and the productivity differentials results in
this final general long-run relation between real exchange rates and productivity ratios in
two-country case (i and j):5
qijt ¼ y0 þ y1ðajt � aitÞ (8)
3 It means that exchange rate may revert to a new equilibrium implied by the weak PPP relation.4 Productivity differentials, defined as non-traded minus traded productivity, explain movements in the relative
price on non-tradables pNT � pT ¼ aT � aNT ; p�NT � p�T ¼ a�T � a�NT .5 Rogoff (1992), Chinn (1994), and Mark and Choi (1997) use tradable sector productivity and assume that
non-tradable sector productivity growth is zero. This is not the case in this study since, we use total factor
productivity in a given country.
J. Ericsson, M. Irandoust / Japan and the World Economy 16 (2004) 121–138 125

Eq. (8) is the possible co-integrating relationship. Two important questions are: If Eq. (8)
is a co-integrating relationship, how could this be interpreted in economic terms?
What does the theory say about the co-integrating space? If productivity-differentials
shocks are permanent, productivity shocks can result in a unit root in the real exchange
rate, which means that Eq. (8) is not a co-integrating relationship. Thus, the model is
incomplete. Greater difference in the productivity ratio of two countries, which leads to a
larger gap between their wages and prices, may create a larger gap between PPP and the
equilibrium exchange rate. This implies that if productivity is increased (decreased) in the
home country relative to the foreign country, the real exchange rate is expected to
appreciate (depreciate). Thus, the Balassa–Samuelson hypothesis is supported if y1 is
positive in Eq. (8). This means that the co-integrating space must be spanned by the
co-integrated vector b ¼ ðb1; b2Þ, where b1 and b2 are the long-run coefficients for the
real exchange rate and the productivity differentials, respectively, and they have opposite
signs.
As a summary, deviation from long-run PPP stems from different productivity ratios in
two countries and that there is a co-integrating relation between the real exchange rate and
productivity ratios. This means that the long-run relation is a stable one and shocks to the
model will only have temporary effects on the real exchange rate. This also implies that, in
the long run, the real exchange rate is stationary with respect to productivity differentials.
In other words, there is a long-run equilibrium exchange rate, but it differs from the long-
run equilibrium PPP value.
3. Data and methodology
The data used in this study is annual observations and covers the period 1973–1999 for
Sweden vis-a-vis nine of its major trading partners (Denmark, Finland, France, Germany,
Italy, Japan, Norway, the UK, and the US). The real exchange rate (qijt) is defined as
qijt ¼ ln Eijt þ ln Pjt � ln Pit, where Pjt is the price level in foreign country j and Pit is the
price level in the domestic country i. The nominal exchange rate (Eijt) is defined as
domestic currency per unit of foreign currency. The exchange rate series is derived from the
OECD Main Economic Indicators, various issues. The price levels are GDP deflators taken
from the OECD Economic Outlook, various issues. The productivity series is total factor
productivity derived from the International Sectoral Database, OECD, Paris.
The methodology used here is an extension of the Johansen (1988, 1991, 1995)
multivariate maximum likelihood developed by Larsson et al. (2001), and Larsson and
Lyhagen (1999). They have developed a likelihood-based panel test of the co-integrating
rank and a general likelihood-based framework for inference in panel-VAR models with
co-integration restrictions, allowing for multiple co-integrating vectors. By using this
method, the assumption of a unique co-integrating vector and the problem of normalization
are relaxed. This is not the case with the usual residual-based tests of co-integration
developed by Kao (1999), Kao and Chiang (1999), and Pedroni (1996, 1999).6 Following
6 For an overview of unit root test and co-integration in panels, see Banerjee (1999), and Baltagi and Kao
(2000).
126 J. Ericsson, M. Irandoust / Japan and the World Economy 16 (2004) 121–138

the literature on panel co-integration methods, we can summarize the model as follows:
consider a panel dataset that consists of a sample of N cross-section (countries) observed
over T time periods. Furthermore, let i ¼ 1; . . . ;N the index groups, t ¼ 1; . . . ; T is the
sample time period, and j ¼ 1; . . . ; p denotes the variables in each group. The observed
p-vector for group i at time t is given by Yit0 ¼ ðyi1t; . . . ; yiptÞ0. For simplicity, it is assumed
that there is no deterministic component.
Following Larsson et al. (2001), suppose that each group in the panel can be char-
acterized by the following heterogeneous VAR(ki) model:
Yit ¼Xki
k¼1
Y
ik
Yi;t�k þ eit (9)
where eit is assumed normally distributed as Npð0;OiÞ. The corresponding heterogeneous
error correction model is
DYit ¼Y
i
Yi;t�1 þXki�1
k¼1
GikYi;t�k þ eit (90)
whereQ
i is of the order p � p. Now, consider a reduced rank specification of the panel
model where the matrixQ
i is of rank 0 ri p, specified asQ
i ¼ aibi0, where the
matrices ai and bi are of the order p � ri. Matrix ai contains the short-run coefficients and
matrix bi the long-run coefficients. Hence, the model is completely heterogeneous and the
panel groups are modeled individually as
DYit ¼ aibi0Yi;t�1 þ mi þ
Xki�1
k¼1
GikDYi;t�k þ eit; i ¼ 1; . . . ;N; t ¼ 1; . . . ; T (10)
where mi contains the deterministic components. The first hypothesis considered is that all
of the N groups in the panel have the same number of co-integrating relationships among
the p variables. The following rank hypothesis is considered:
H0 : rankðPiÞ ¼ ri r; for all i ¼ 1; . . . ;N (11)
against the alternative
H1 : rankðPiÞ ¼ p; for all i ¼ 1; . . . ;N (12)
Larsson et al. (2001) have developed a likelihood-based test for this hypothesis. Let the
trace statistic for group i be given by
LRitðHðrÞ Hj ðpÞÞ ¼ �2 ln QiTðHðrÞ Hj ðpÞÞ ¼ �TXp
i¼rþ1
lnð1 � liÞ (13)
where li is the ith eigenvalue to a certain eigenvalue problem. Define the LR-bar statistic as
the average of the N individual trace statistics as
LRNTðHðrÞ Hj ðpÞÞ ¼ 1
N
XLRiTðHðrÞ Hj ðpÞÞ (14)
J. Ericsson, M. Irandoust / Japan and the World Economy 16 (2004) 121–138 127

Larsson et al. (2001) then define the following panel co-integration rank test as
gLRðHðrÞ Hj ðpÞÞ ¼ffiffiffiffiN
pðLRNTðHðrÞ Hj ðpÞÞ � EðZkÞffiffiffiffiffiffiffiffiffiffiffiffiffiffiffiffiffiffiffi
VARðZkÞp (15)
where EðZkÞ and VARðZkÞ are the mean and variance of the asymptotic trace statistic,
respectively. These can be obtained from stochastic simulations as presented in Johansen
(1995). Table 1 presents the relevant expected value and variance to be used in the panel-
rank tests. The panel trace statistic gLR is asymptotic normal (0,1) as N and T go to infinity
such thatffiffiffiffiN
pT�1 goes to zero.
The testing procedure is the sequential procedure suggested by Johansen (1988). First,
r ¼ 0 is tested. If this hypothesis is rejected, r ¼ 1 is tested. This sequential procedure is
continued until the null is not rejected or the hypothesis r ¼ p � 1 is rejected. This
procedure gives the rank estimate, r. Johansen (1995) has shown that this procedure yields
the correct size of the trace statistic asymptotically.
If there is a common co-integrating rank, it could be interesting to test hypotheses with
restrictions in the b vector. Hypotheses of this kind have been discussed at length in
Johansen and Juselius (1990, 1992) and in Johansen (1988, 1991, 1995), so no further
discussion is provided here. The result is that the likelihood ratio tests for linear restrictions
on b are asymptotically chi-square distributed. The panel test for testing restrictions on b is
constructed under the assumption that the countries in the sample are independent.
Before estimating the VAR model given by Eq. (9), the VAR order ki must be selected.
There are several criteria for choosing the VAR order: final prediction error (FPE),
Akaike’s information’s criterion (AIC), Schwarz’s criterion (SC) and Hannan and Quinn
criterion, are the most commonly used. An important question is, which of these criteria
should be used? Lutkepohl (1985) has made a simulation study where he compared
different VAR order criteria. Overall results clearly favor Schwarz’s criterion for small and
moderate samples, since SC chooses the correct order most often. Further, it can be shown
that SC provides a consistent estimator of the VAR order ki (Judge et al., 1986). (Note that it
is not required that the VAR process is stationary.)
To determine the maximum order of integration, it is necessary to test for stationarity.
We use the test developed by Kwiatkowski et al. (1992), where the series is stationary under
the null hypothesis. Finally, a combination of multivariate diagnostic tests is performed to
check if the underlying statistical assumptions are fulfilled.
Table 1
Simulated moments of Zk
k ¼ p � r E(Zk) VAR(Zk)
1a 4.040 6.954
2a 11.976 19.410
1b 6.279 10.529
2b 16.442 26.210
The moments are obtained from the procedure described in Johansen (1995, Chapter 15).a A constant is restricted in the co-integration space.b An unrestricted constant and a restricted trend in the co-integration space.
128 J. Ericsson, M. Irandoust / Japan and the World Economy 16 (2004) 121–138

4. Empirical results
To investigate whether the real exchange rate drifts apart from its long-run PPP
equilibrium value, we test for panel co-integration between nominal exchange rate and
price ratio. The methodology discussed earlier to test for long-run relationship between
variables consists of two steps. First, the integration order of each variable needs to be
determined. Since the KPSS test is sensitive to the way the deterministic trend is
accommodated, two null hypotheses of stationarity are considered: (i) the series is stationary
around a level, and (ii) the series is stationary around a trend. The second step is to test for
panel co-integration based on panel vector autoregressive models suggested by Larsson et al.
(2001), and Larsson and Lyhagen (1999).
The first step is to examine the unit-root properties of the individual series. The results
show that the nominal exchange rate series and price ratio series are integrated of order one
except for the price ratio between Sweden and Finland, where the order is larger than one.7
Therefore, Sweden vis-a-vis Finland is eliminated from the sample. Furthermore, the test
results are insensitive to the way the deterministic trend is handled.
The next step is to set up the following panel vector autoregressive model and test for co-
integration rank, where the data generating process for each group, Sweden vis-a-vis
individual countries, can be characterized by the following general VARðkiÞ model:
Yit ¼Xki
k¼1
PikYi;t�k þ mi þ eit (16)
where Yitis a vector containing the nominal exchange rate and the price ratio between two
countries. It is quite important to account explicitly for the treatment of the deterministic
component in the model. This is not only important to the PPP theorem itself (since a
deterministic trend that is not eliminated by the co-integrating vector, is a violation of the
theory), but also the limiting distribution of the trace-test statistic is critically dependent
upon the presence or absence of deterministic components in the co-integrating space.
Thus, two different models of the deterministic components are tested: (i) an intercept is
restricted to the co-integrating relations, and (ii) unrestricted intercept and deterministic
trends in the co-integrating relations. By testing Sweden vis-a-vis individual countries and
by constructing a panel test using the sum of the individual test statistics, we obtain a test
statistic which follows a chi-square distribution with eight degrees of freedom. The panel
test statistic, with a value of 5.14 compare to the critical value of 13.61, accepts the
hypothesis of trend exclusion in the co-integrating relation. It seems that the correct model
includes an intercept in the co-integrating space.
The results for the PPP hypothesis for Sweden vis-a-vis nine of its major trading partners
together with the panel test are reported in Table 2. The selection of lags is done by
minimizing the Schwarz information criterion.8 Turning to the rank determination, Table 2
also presents the trace-test statistics for Sweden vis-a-vis all countries in the sample for the
hypotheses of r ¼ 0, and r ¼ 1. As seen from the results the most common selected rank is
r ¼ 1 except for two countries; France and the US, where the rank is r ¼ 0. Hence, there is
7 The results are available from the authors upon request.8 We also examined the procedure by varying the order of the VAR. There was no change in the result.
J. Ericsson, M. Irandoust / Japan and the World Economy 16 (2004) 121–138 129
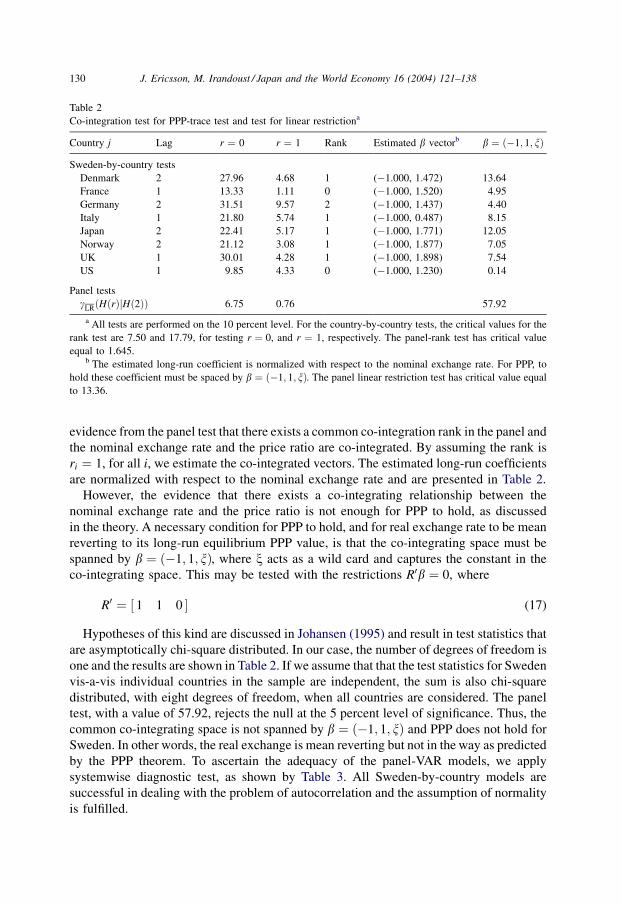
evidence from the panel test that there exists a common co-integration rank in the panel and
the nominal exchange rate and the price ratio are co-integrated. By assuming the rank is
ri ¼ 1, for all i, we estimate the co-integrated vectors. The estimated long-run coefficients
are normalized with respect to the nominal exchange rate and are presented in Table 2.
However, the evidence that there exists a co-integrating relationship between the
nominal exchange rate and the price ratio is not enough for PPP to hold, as discussed
in the theory. A necessary condition for PPP to hold, and for real exchange rate to be mean
reverting to its long-run equilibrium PPP value, is that the co-integrating space must be
spanned by b ¼ ð�1; 1; xÞ, where x acts as a wild card and captures the constant in the
co-integrating space. This may be tested with the restrictions R0b ¼ 0, where
R0 ¼ ½ 1 1 0 (17)
Hypotheses of this kind are discussed in Johansen (1995) and result in test statistics that
are asymptotically chi-square distributed. In our case, the number of degrees of freedom is
one and the results are shown in Table 2. If we assume that that the test statistics for Sweden
vis-a-vis individual countries in the sample are independent, the sum is also chi-square
distributed, with eight degrees of freedom, when all countries are considered. The panel
test, with a value of 57.92, rejects the null at the 5 percent level of significance. Thus, the
common co-integrating space is not spanned by b ¼ ð�1; 1; xÞ and PPP does not hold for
Sweden. In other words, the real exchange is mean reverting but not in the way as predicted
by the PPP theorem. To ascertain the adequacy of the panel-VAR models, we apply
systemwise diagnostic test, as shown by Table 3. All Sweden-by-country models are
successful in dealing with the problem of autocorrelation and the assumption of normality
is fulfilled.
Table 2
Co-integration test for PPP-trace test and test for linear restrictiona
Country j Lag r ¼ 0 r ¼ 1 Rank Estimated b vectorb b ¼ ð�1; 1; xÞ
Sweden-by-country tests
Denmark 2 27.96 4.68 1 (�1.000, 1.472) 13.64
France 1 13.33 1.11 0 (�1.000, 1.520) 4.95
Germany 2 31.51 9.57 2 (�1.000, 1.437) 4.40
Italy 1 21.80 5.74 1 (�1.000, 0.487) 8.15
Japan 2 22.41 5.17 1 (�1.000, 1.771) 12.05
Norway 2 21.12 3.08 1 (�1.000, 1.877) 7.05
UK 1 30.01 4.28 1 (�1.000, 1.898) 7.54
US 1 9.85 4.33 0 (�1.000, 1.230) 0.14
Panel tests
gLRðHðrÞ Hj ð2ÞÞ 6.75 0.76 57.92
a All tests are performed on the 10 percent level. For the country-by-country tests, the critical values for the
rank test are 7.50 and 17.79, for testing r ¼ 0, and r ¼ 1, respectively. The panel-rank test has critical value
equal to 1.645.b The estimated long-run coefficient is normalized with respect to the nominal exchange rate. For PPP, to
hold these coefficient must be spaced by b ¼ ð�1; 1; xÞ. The panel linear restriction test has critical value equal
to 13.36.
130 J. Ericsson, M. Irandoust / Japan and the World Economy 16 (2004) 121–138

Although it has been demonstrated that the strong version of PPP does not hold and the
real exchange rate should not be expected to return to the equilibrium PPP value, the
weak version of PPP receives strong support. The negative evidence on the strong version
of PPP may be attributed to the existence of productivity differential in the Sweden and
foreign economies, as discussed above. Thus, the productivity-bias hypothesis is
examined by using the same test procedure as PPP was tested. First, we consider the
stochastic properties of the series; real exchange rate and productivity differentials.
We use the KPSS test for stationarity around a level and around a trend.9 The real
exchange rate and productivity differentials seem to be integrated of order one, except for
the productivity differential between the UK and Sweden, where the integration order
most likely is two. Therefore, Sweden vis-a-vis the UK is eliminated from the sample.
The test result is insensitive to the way the deterministic trend is handled. The final
Table 3
Systemwise diagnostic testing of the residualsa
Sweden-by-country L-B(5) LM(4) Norm(4)
Denmark
Test value 20.435 1.702 3.123
P-value 0.12 0.79 0.49
France
Test value 19.148 2.556 3.623
P-value 0.16 0.63 0.46
Germany
Test value 20.856 1.003 9.987
P-value 0.11 0.91 0.09
Italy
Test value 21.040 3.949 8.789
P-value 0.10 0.41 0.11
Japan
Test value 19.735 1.485 7.189
P-value 0.14 0.83 0.13
Norway
Test value 19.132 5.475 7.196
P-value 0.15 0.34 0.13
UK
Test value 17.280 0.811 2.068
P-value 0.14 0.94 0.72
US
Test value 12.532 3.835 5.315
P-value 0.14 0.24 0.18
a L-B(k) is the Ljung-Box test for autocorrelation; LM(p) is the Lagrange-multiplier test for residual
autocorrelation of order p; Norm is a test of normal distribution in the residual.
9 The results are available from the authors on request.
J. Ericsson, M. Irandoust / Japan and the World Economy 16 (2004) 121–138 131

step is to set up a panel vector autoregressive model, where each group is modeled as
following:
Yit ¼Xki
k¼1
PikYi;t�k þ mi þ eit (18)
where Yit is a vector containing the real exchange rate and the productivity ratio between
two countries. Two models of the deterministic component are considered: (i) an intercept
is restricted in the co-integrating relations, and (ii) unrestricted intercept and a determi-
nistic trend in the co-integration relations. The panel test statistic, with a value of 23.70
rejects the null hypothesis of trend exclusion. Therefore, an intercept and a trend are
included in the co-integrating relation.
The results for the productivity-bias hypothesis for Sweden vis-a-vis individual coun-
tries together with the panel test are reported in the Table 4. The selection of lags is
done by minimizing the Schwarz information criterion. The trace-test statistics for Sweden
vis-a-vis individual countries test the hypotheses of r ¼ 0 and r ¼ 1. As seen from Table 4,
the results are rather mixed. The most common selected rank is r ¼ 1, except for two
countries, Finland and France, where the rank result is r ¼ 0.
Two panels are considered separately: (i) Sweden vis-a-vis all countries in the sample,
and (ii) Sweden vis-a-vis the Euro-countries, where the Euro-countries are France, Italy
and Germany. For both groups, the panel-rank test suggests that r ¼ 1. As a result, it is
evident from the panel test that there exists a common co-integration rank in the panel and
the real exchange rate and the productivity differentials are co-integrated.
Table 4
Co-integration test for the productivity-bias hypothesis, trace test and test for linear restrictiona
Country j Lag r ¼ 0 r ¼ 1 Rank b vectorb b12 ¼ 0c b ¼ ð�1; 1; xÞd
Sweden-by-country tests
Denmark 1 26.51 9.67 1 (�1.000, 0.271) 5.70
Finland 2 21.93 3.48 0 (�1.000, �0.165) 0.05
France 2 19.93 8.80 0 (�1.000, 1.257) 3.96 0.01
Germany 1 25.76 7.15 1 (�1.000, 1.508) 7.00 1.56
Italy 1 25.27 5.54 1 (�1.000, 1.410) 7.35 2.25
Japan 2 30.78 10.67 2 (�1.000, 13.833) 15.37
Norway 2 23.65 9.00 1 (�1.000, 2.820) 9.90
US 1 26.05 5.60 1 (�1.000, 0.851) 3.28
Panel tests
Group: all
gLRðHðrÞ Hj ð2ÞÞ 4.71 1.05 52.61
Group: Euro
gLRðHðrÞ Hj ð2ÞÞ 2.44 0.47 3.82
a All tests are performed on the 10 percent level. For the country-by-country tests, the critical values for the
rank test are 22.95 and 10.56 for testing r ¼ 0, and 1, respectively. The panel-rank test has critical value equal to
1.645.b The estimated long-run coefficient is normalized with respect to the real exchange rate.c Test if the long-run coefficient for the productivity differential is positive. The critical value is 13.36.d For Sweden vis-a-vis the Euro-countries, the hypothesis b ¼ ð�1; 1; xÞ is tested, the critical value is 6.25.
132 J. Ericsson, M. Irandoust / Japan and the World Economy 16 (2004) 121–138

The existence of a co-integrating relationship between the real exchange rate and the
productivity differential does not prove the productivity-bias hypothesis. As noted in the
theory, the long-run coefficients must have opposite signs. Following the panel-rank test, we
assume that the rank is ri ¼ 1, for all i, and we estimate the co-integrated vectors as shown in
Table 4. The estimated long-run coefficients are normalized with respect to the real
exchange rate. Based on the panel test results, the productivity-bias hypothesis is supported
since long-run coefficients have opposite signs and the null hypothesis b2 ¼ 0 is rejected.
Table 4 also shows that the panel Sweden vis-a-vis the Euro-countries has a common
co-integrating space spanned by b ¼ ð�1; 1; xÞ. This is tested with the restriction R0b ¼ 0
where
R0 ¼ 1 1 0½ (19)
Table 5
Systemwise diagnostic testing of the residualsa
Sweden-by-country L-B(5) LM(4) Norm(4)
Denmark
Test value 22.293 0.14 1.729
P-value 0.22 0.13 0.79
Finland
Test value 28.964 2.591 1.818
P-value 0.05 0.63 0.88
France
Test value 14.431 2.140 2.234
P-value 0.41 0.71 0.55
Germany
Test value 15.013 0.763 3.498
P-value 0.38 0.94 0.43
Italy
Test value 12.666 2.137 2.231
P-value 0.55 0.71 0.57
Japan
Test value 13.297 1.674 3.888
P-value 0.35 0.80 0.42
Norway
Test value 16.904 6.348 4.112
P-value 0.26 0.17 0.34
UK
Test value 15.497 4.163 6.342
P-value 0.35 0.38 0.14
US
Test value 13.529 2.935 2.126
P-value 0.36 0.57 0.63
a L-B(k) is the Ljung-Box test for autocorrelation; LM(p) is the Lagrange-multiplier test for residual
autocorrelation of order p; Norm is a test of normal distribution in the residual.
J. Ericsson, M. Irandoust / Japan and the World Economy 16 (2004) 121–138 133

The panel tests, with a value of 3.82, accept the null at the 10 percent level of
significance. Thus, the common co-integration space is spanned by b ¼ ð�1; 1; xÞ for
the group Sweden vis-a-vis the Euro-countries. The results show that improvements in
domestic productivity relative to foreign productivity in the Euro-area lead to an apprecia-
tion of the real exchange rate, a result that is in line with the work of Balassa (1964) and
Samuelson (1964). The result should be interpreted with some cautions since the co-
integration test for Sweden vis-a-vis France does not imply a long-run relation. However,
there is strong evidence that in the long run, the real exchange rates and productivity
differentials establish a long-run one-to-one relationship.
To analyze closer the long-run relationship for Sweden vis-a-vis the Euro-countries, we
simulate impulse-response functions. By these functions, given in the Appendix A, the
effect of one standard deviation shock in productivity differentials on the real exchange rate
can be traced. As we can expect, a shock in the productivity differential results in an
appreciation in the real exchange rate (with respect to the country that has an increase in
productivity) but the effect is eliminated after approximately 10 years for Sweden vis-a-vis
Germany, Italy, Japan and the US. These results correspond to the established co-
integrating relationship in Table 4. The systemwise diagnostic test is reported in
Table 5. All models are successful in dealing with the problem of autocorrelation and
the assumption of normality is fulfilled.
5. Summary and conclusions
In this study, we investigate some important hypotheses concerning long-run PPP. The
PPP theorem implies that in the long run, two countries’ price levels are equal when
converted to a common currency, which implies that the real exchange rate is constant.
Therefore, fluctuations in the real exchange rate are synonymous with deviations from long-
run PPP. Balassa (1964) and Samuelson (1964) suggested that deviations between any
exchange rate and its PPP value stem from productivity gap between two countries. Thus,
the purpose of this paper was to test the behavior of real exchange rates and the productivity-
bias hypothesis for Sweden vis-a-vis nine of its major trading partners (Denmark, Finland,
France, Germany, Italy, Japan, Norway, the UK, and the US) for the period 1973–1999. The
departure from earlier studies of the productivity-bias hypothesis and the PPP theorem is in
the asymptotic theory of panel co-integration used to test the hypotheses. The tests are based
on the Johansen (1988, 1991, 1995) multivariate likelihood-based inference in co-integrated
VAR models and on a new co-integration rank test for panel models proposed by Larsson
et al. (2001), and Larsson and Lyhagen (1999). This method allows for multiple co-
integrating vectors, which is not the case with the usual residual-based tests of co-integration
developed by Kao (1999), Kao and Chiang (1999), and Pedroni (1999). Hence, the
assumption of a unique co-integrating vector and the problem of normalization are relaxed.
The result of the panel-rank test indicates that a co-integrating relation exists between
the nominal exchange rate and the price ratio in the panel. This result is based on a model
that allows a constant in the co-integrating relation, since a panel test of the hypothesis that
the time trend is excluded in the co-integrating relation was accepted. Although the
nominal exchange rate and the price ratio are co-integrated which implies that the weak
134 J. Ericsson, M. Irandoust / Japan and the World Economy 16 (2004) 121–138

version of PPP receives strong support, the evidence clearly rejects the strong version of
PPP. In other words, the co-integration space is not symmetric for the two variables and
therefore, PPP does not hold in its strict form, implying that the real exchange rate should
not be expected to return to the equilibrium PPP value.
Since there is clear evidence that the strong version of PPP is violated, the productivity-
bias hypothesis is investigated. The panel-rank test indicates that the real exchange rates and
the productivity differentials are co-integrated in the long run. However, this is not sufficient
since the hypothesis requires that the real exchange rates and productivity differentials
should have opposite signs. By estimating the long-run coefficient, it has been shown strong
evidence in favor of the productivity-bias hypothesis. Furthermore, it seems that the vector
b ¼ ð�1; 1; xÞ, which is supported from a panel test, spans the co-integrating space for the
panel Sweden vis-a-vis the Euro-countries: France, Germany, and Italy. This also has been
confirmed by impulse-response functions. It also seems that a one-time shock to the
productivity differential results in appreciation in the real exchange rate, but the effect is
eliminated after 10 time-periods. Thus, a shock to the model will have temporary effect.
However, supporting the productivity-bias hypothesis and evidence in favor of the weak
version of PPP imply that exchange rate adjusts not only to price differentials—as in
conventional PPP calculations—but also to productivity differentials as well. Our results
have important policy implications for monetary integration in Europe, and in particular for
Swedish participation in the European Monetary Union (EMU). In the EMU, by definition,
there will be no possibility of currency realignment to offset adverse output and employ-
ment effects. This implies that in a monetary union with a single currency, the output and
employment effects of relatively slow productivity growth and declining competitiveness
over the long run could cause agitation for the reassertion of monetary sovereignty and
off-setting exchange rate adjustment. Thus, the convergence criteria for a monetary union
should consider differential productivity growth. Furthermore, in the EMU membership,
adjustment that might be needed to offset the competitive effects of productivity differ-
entials over long periods must be internal, such as wage flexibility. And the more inflexible
labor markets, the more problematic is the effect of productivity differentials in the EMU-
area. Generally speaking, these conflicting forces in the form of different inflation rates and
different productivity rates could be a threat to the EMU, where the later may be more
serious. This is because inflation differentials can be squeezed by macroeconomic policies
but there are no reliable policies for improving productivity growth.
According to the test results, it seems that the stationary process that creates deviation
from PPP is common for Sweden vis-a-vis the Euro-countries: Germany, Italy, and France.
Thus, a shock from the EU ‘‘core’’ has identical short-run effect on Sweden. In other
words, if Sweden can achieve labor market flexibility and even better, a sustained higher
productivity growth than the countries of the EU ‘‘core’’, then there is an argument for
Sweden to engage in monetary union as soon as possible.
Acknowledgements
We would like to thank one anonymous referee for valuable comments and suggestions.
Remaining errors are our responsibility.
J. Ericsson, M. Irandoust / Japan and the World Economy 16 (2004) 121–138 135

Appendix A. Impulse-response functions
Response of the real exchange rate to one standard deviation innovation in the
productivity differential for Sweden vis-a-vis the sample countries
136 J. Ericsson, M. Irandoust / Japan and the World Economy 16 (2004) 121–138

References
Asea, P.K., Mendoza, E., 1994. The Balassa–Samuelson model: a general equilibrium appraisal. Review of
International Economics 2, 244–267.
Bahmani-Oskooee, M., Rhee, H.-J., 1996. Time-series support for Balassa’s productivity-bias hypothesis:
evidence from Korea. Review of International Economics 4 (3), 364–370.
Balassa, B., 1964. The purchasing power parity doctrine: a reappraisal. The Journal of Political Economy 72,
584–596.
Baltagi, B.H., Kao, C., 2000. Non-stationary Panels, Co-integration in Panels and Dynamic Panels: A Survey.
Working Paper, Syracuse University.
Banerjee, A., 1999. Panel data unit roots and co-integration: an overview. Oxford Bulletin of Economics and
Statistics, 607–629 (Special Issue).
Beachill, B., Pugh, G., 1998. Monetary cooperation in Europe and the problem of differential productivity
growth: an argument for a ‘‘two-speed’’ Europe. International Review of Applied Economics 12 (3),
445–458.
Cheung, Y.W., Lai, K.K., 1993. A fractional co-integration analysis of purchasing power parity. Journal of
Business and Economic Statistics 11, 103–112.
Chinn, M.D., 1994. Paper Pushers or Paper Money? Empirical Assessment of Fiscal and Monetary Models of
Exchange Rate Determination. Working Paper, UC Santa Cruz.
Crowder, W.J., 1996. A re-examination of long-run PPP: the case of Canada, the UK, and the US. Review of
International Economics 4 (1), 64–78.
De Gregorio, J., Giovannini, A., Wolf, H., 1994. International evidence on tradable and non-tradables inflation.
European Economic Review 38, 1225–1244.
Edison, H., Klovland, J.T., 1987. A quantitative reassessment of the purchasing power parity hypothesis:
evidence from Norway and the United Kingdom. Journal of Applied Econometrics 2, 309–333.
Froot, K., Rogoff, K., 1991a. The EMS, the EMU, and the transition to a common currency. National Bureau of
Economic Research Macroeconomics Annual 6, 269–317.
Froot, K., Rogoff, K., 1991b. Government Consumption and the Real Exchange Rate: The Empirical Evidence.
Mimeo, Harvard Business School.
Froot, K., Rogoff, K., 1995. Perspectives on PPP and long-run real exchange rates. In: Grossman, G., Rogoff, K.
(Eds.), Handbook of International Economics, vol. III.
Hsieh, D., 1982. The determination of the real exchange rate: the productivity approach. Journal of International
Economics 12, 355–362.
Johansen, S., 1988. Statistical analysis of co-integration vectors. Journal of Economic Dynamics and Control 12,
231–254.
Appendix A. (Continued )
J. Ericsson, M. Irandoust / Japan and the World Economy 16 (2004) 121–138 137
Johansen, S., 1991. Estimation and hypothesis testing of co-integration vectors in Gaussian vector autoregressive
models. Econometrica 59, 1551–1580.
Johansen, S., 1995. Likelihood-based Inference in Co-integrated Vector Autoregressive Models. Oxford
University Press, Oxford.
Johansen, S., Juselius, K., 1990. Maximum likelihood estimation and inference on co-integration with
application to the demand for money. Oxford Bulletin of Economics and Statistics 52, 169–210.
Johansen, S., Juselius, K., 1992. Testing structural hypotheses in a multivariate co-integration analysis of the
PPP and the UIP for UK. Journal of Econometrics 54, 211–244.
Judge, G.G., Griffiths, W.E., Hill, R.C., Lutkepohl, H., Lee, T.C., 1986. The Theory and Practice of
Econometrics, 2nd ed. Wiley, New York.
Kao, C., 1999. Spurious regression and residual-based tests for co-integration in panel data. Journal of
Econometrics 90 (1), 1–44.
Kao, C., Chiang, M.-H., 1999. International R&D spillovers: an application of estimation and inference in panel
co-integration. Oxford Bulletin of Economics and Statistics 61, 691–709.
Kouretas, G.P., 1997. The Canadian dollar and purchasing power parity during the recent float. Review of
International Economics 5 (4), 467–477.
Kwiatkowski, D., Phillips, P.C.B., Schmidt, P., Shin, Y., 1992. Testing the null hypothesis of stationarity against
the alternative of a unit root: How sure are we that economic time series have a unit root? Journal of
Econometrics 54, 159–178.
Larsson, R., Lyhagen, J., 1999. Likelihood-Based Inference in Multivariate Panel Co-integration Models.
Stockholm School of Economics. Working Paper Series in Economics and Finance, no. 331.
Larsson, R., Lyhagen, J., Lothgren, M., 2001. Likelihood-based co-integration tests in heterogeneous panels.
Econometrics Journal 4, 109–142.
Lutkepohl, H., 1985. Comparison of criteria for estimating the order of a vector autoregressive process. Journal
of Time Series Analysis 6, 35–52.
Mark, N.C., Choi, D.Y., 1997. Real exchange rate prediction over long horizons. Journal of International
Economics 43, 29–60.
Marston, R., 1987. Real exchange rates and productivity growth in the United States and Japan. In: Arndt, S.,
Richardson, J.D. (Eds.), Real-financial Linkages Among Open Economies. MIT Press, Cambridge, MA.
Obstfeld, M., 1993. Modeling Trending Real Exchange Rates. Centre for International and Development
Economics Research. Working Paper no. C93-011, University of California at Berkeley.
O’Connell, P.H.J., 1998. The overvaluation of purchasing power parity. Journal of International Economics 44,
1–19.
Officer, L.H., 1976. The productivity bias in purchasing power parity: an econometric investigation.
International Monetary Funds Staff Papers 10, 545–579.
Oh, K.Y., 1996. Purchasing power parity and unit-root tests using panel data. Journal of International Money and
Finance 15, 405–418.
Papell, D., 1997. Searching for stationarity: purchasing power parity under the current float. Journal of
International Economics 43, 323–331.
Pedroni, P., 1996. Fully Modified OLS for Heterogeneous Co-integrated Panels and the Case of Purchasing
Power Parity. Working Paper, Indiana University.
Pedroni, P., 1999. Critical values for co-integration tests in heterogeneous panels with multiple regressors.
Oxford Bulletin of Economics and Statistics 61, 653–670.
Rogers, J.H., Jenkins, M., 1995. Haircuts or hysteresis? Sources of movements in real exchange rates. Journal of
International Economics 38, 339–360.
Rogoff, K., 1992. Traded Goods Consumption Smoothing and the Random Walk Behavioral of the Real
Exchange Rate. NBER Working Paper, no. 4119.
Samuelson, P.A., 1964. Theoretical notes on trade problems. Review of Economics and Statistics 46, 145–164.
Strauss, J., 1999. Productivity differentials, the relative price of non-tradables and real exchange rates. Journal of
International Money and Finance 18, 383–409.
Toda, H.Y., 1994. Finite sample properties of likelihood ratio tests for co-integration ranks when linear trends are
presented. Review of Economics and Statistics 76, 66–79.
Toda, H.Y., 1995. Finite sample properties of likelihood ratio tests for co-integration ranks in vector
autoregression. Econometric Theory 12, 123–148.
138 J. Ericsson, M. Irandoust / Japan and the World Economy 16 (2004) 121–138


![AGGREGATION BIAS IN MAXIMUM LIKELIHOOD …tesmith/Aggregation_w_Figs.pdflikelihood estimation of spatial autoregressive processes ... ad is of full row rank, ... = −(add 0a0)−1ad[wd+d0w0]](https://static.fdocuments.in/doc/165x107/5ac04ace7f8b9a1c768b8784/aggregation-bias-in-maximum-likelihood-tesmithaggregationwfigspdflikelihood.jpg)