THE ITFMP FOREST CONCESSION MODEL: OPERATORS … · RINGKASAN Model Konsesi Hutan ... Page 15:...
57
THE ITFMP FOREST CONCESSION MODEL: OPERATORS MANUAL N. Scotland and A. Whiteman Report number: SMAT/EC/97/05 Senior Management Advisory Team Indonesia-UK Tropical Forest Management Programme Gedung Manggala Wanabakti Blok VII, lt. 6 Jl. Jend. Gatot Subroto Jakarta 10270 Tel: (62) 021 572 0225 Fax: (62) 021 571 0467 E-mail: [email protected]
-
Upload
trinhkhanh -
Category
Documents
-
view
214 -
download
0
Transcript of THE ITFMP FOREST CONCESSION MODEL: OPERATORS … · RINGKASAN Model Konsesi Hutan ... Page 15:...
THE ITFMP FOREST CONCESSION MODEL: OPERATORS MANUAL
N. Scotland and A. Whiteman Report number: SMAT/EC/97/05
Senior Management Advisory Team Indonesia-UK Tropical Forest Management Programme
Gedung Manggala Wanabakti Blok VII, lt. 6
Jl. Jend. Gatot Subroto Jakarta 10270
Tel: (62) 021 572 0225 Fax: (62) 021 571 0467
E-mail: [email protected]


___________________________________________________________________ Indonesia-UK Tropical Forest Management Programme
THE ITFMP FOREST INDUSTRY MODEL: OPERATORS MANUAL
SUMMARY The ITFMP Forest Concession Model was developed to assist in calculating the Net Present Value (NPV) and Internal Rate of Return (IRR) for investments in forest concessions and to assist in enumerating and tracing economic rent made from the sale of roundwood. This document provides supplementary information to assist users of the Forest Concession Model.
RINGKASAN Model Konsesi Hutan yang dikembangkan oleh ITFMP untuk membantu perhitungan Net Present Value (NPV) dan Internal Rate of Return (IRR) dalam investasi disektor pengolahan kayu dan membantu pengumpulan data dan mendalami rente ekonomi dari hasil-hasil hutan. Laporan ini dilengkapi dengan tambahan informasi untuk membantu para pemakai Model Konsesi Hutan tersebut.

___________________________________________________________________ Indonesia-UK Tropical Forest Management Programme

___________________________________________________________________ Indonesia-UK Tropical Forest Management Programme
INDONESIA-UK TROPICAL FOREST MANAGEMENT PROGRAMME (ITFMP) The ITFMP is a programme of technical co-operation activities funded jointly by the Indonesian Department of Forestry and the Overseas Development Administration (ODA) from the UK. The overall purpose of the programme is to improve the capacity of Government, industry, and local communities to implement responsive and responsible management policies and practices in Indonesia’s natural forests. The ITFMP comprises five projects working in the areas of policy advice (the Senior Management Advisory Team), sustainable forest management (the Provincial Forest Management project), research, training, and conservation. This report is presented as advice from the Indonesia-UK Tropical Forest Management Programme to the Indonesian Government. The arguments, conclusions, and recommendations presented here do not represent the official policy of the Ministry of Forestry, Republic of Indonesia, or the Overseas Development Administration of the United Kingdom. Program Pengelolaan Hutan Tropis Indonesia-UK (ITFMP), adalah kegiatan kerjasama teknik yang dananya berasal dari Pemerintah Indonesia, Departemen Kehutanan dan Overseas Development Administration (ODA) dari Inggris. Tujuan keseluruhan Program ini adalah meningkatkan kapasitas Pemerintah, Industri dan masyarakat setempat untuk berperan serta dan bertanggung jawab didalam pelaksanaan kebijakan pengelolaan hutan alam Indonesia. Program ITFMP terdiri dari 5 (lima) proyek yaitu: SMAT (Senior Management Advisory Team); PFM (Provincial Forest Management); Penelitian (Research); Pelatihan (Training) dan Konservasi (Conservation). Laporan ini dibuat sebagai sumbang saran dari Program Pengelolaan Hutan Tropis Indonesia-UK untuk Pemerintah Indonesia. Pendapat-pendapat, kesimpulan dan saran yang diuraikan disini tidak mewakili kebijakan yang dibuat oleh Departemen Kehutanan Republik Indonesia ataupun Overseas Development Administration, UK.

___________________________________________________________________ Indonesia-UK Tropical Forest Management Programme

___________________________________________________________________ Indonesia-UK Tropical Forest Management Programme
CONTENTS 1. Introduction ......................................................................................................... 1
2. Loading the model .............................................................................................. 1
3. The structure of the model .................................................................................. 2
4. Data entry ........................................................................................................... 4
Page 1: Concession details .............................................................................. 4
Page 2: Planning and surveying costs .............................................................. 7
Page 3: Harvesting costs and levies ................................................................. 9
Page 4: Forest management costs ................................................................... 11
Page 5: Camp capital and operating costs ....................................................... 12
Page 6: Mobile capital requirements................................................................. 14
Page 7: Other capital requirements .................................................................. 16
Page 8: Roading cost........................................................................................ 18
Page 9: Sales and other financial details .......................................................... 20
Data entry cells on other pages ........................................................................ 22
5. Calculations within the model.............................................................................. 23
Debt repayment by year (page 11) ................................................................... 24
The depreciation calculation (page 12) ............................................................. 25
6. Model outputs ..................................................................................................... 27
Page 13: Financial table I: Sales volumes and revenues.................................. 28
Page 14: Financial table II: Income statement .................................................. 28
Page 15: Financial table III: Cash-flow statement ............................................. 29
Page 16: Financial table IV: Adjusted cash-flow statement .............................. 29
Page 17: Financial table V: Measures of financial performance ....................... 31
Results presented in the summary economic data box (cells A1 to H6) ........... 34
7. Calculation Tables .............................................................................................. 34
Roading ............................................................................................................... 35
Page 18: Calculation Table I Road Schedule.................................................... 35
Page 19: Calculation Table II Roading Capital Cost ......................................... 36
Page 20: Calculation Table III Roading Capital Requirement ........................... 36

___________________________________________________________________ Indonesia-UK Tropical Forest Management Programme
Harvesting ............................................................................................................37
Page 21: Calculation Table IV Harvesting Capital Cost.....................................37
Page 22: Calculation Table V Harvesting Capital Requirements .......................38
Other mobile capital..............................................................................................39
Page 23: Calculation Table VI Other Mobile Capital Cost .................................39
Page 24: Calculation Table VII Other Mobile Capital Requirement ...................39
Page 25: Calculation Table VIII Machine Operating Costs ................................40
Page 26: Calculation Table IX Forest Surveying and Management
Operating Costs ......................................................................................41
8. Printing and saving results...................................................................................41
9. Appendix One: Using the model to evaluate financial performance ....................42

1. Introduction The Forest Concession Model has been designed by the ITFMP Senior Management Advisory Team (SMAT) to assist with some of the complex calculations required in financial appraisal. The model is designed specifically to evaluate financial performance of the forest concession industry (HPHs). It can be used to evaluate data representative of Indonesia as a whole, particular regions in Indonesia or data for any given forest concession. The model will calculate the Internal Rate of Return (IRR) and Net Present Value (NPV) based on cost and price data which the user must enter into the model. Sensitivity analysis is automatically undertaken, since the model calculates the Net Present Value of the investment at three different discount rates specified by the user. The final calculation undertaken in the model is that of identifying how much of any economic rent which exists on the resource is being captured by the Government of Indonesia and how much is going to the private sector as an excess profit. In this guide to the model, commands which can be called upon to undertake certain functions are shown in bold between <> parenthesis, for example to call up the basic Lotus 123r3.1 menu, users must type </>, ie. press the forward slash key.
2. Loading the model The model is designed to work on a basic IBM (or compatible) PC with a small amount of memory and disk space and will work without a mouse or colour monitor. The operating requirements of the model are as follows:
Disk space: 260 KB for each model stored Operating system: Lotus 123 version 1.3+ with WYSIWYG
function1 Memory: 610 KB2
Before loading the model, Lotus 123 must be loaded by either clicking on the Lotus 123 icon (in windows) or by changing to the Lotus directory and typing <123> followed by <enter↵> (in DOS).
1. The model will run on other versions of Lotus-123 and compatable spreadsheet programmes
such as Quattro and Excel. The calculations within the model should still work correctly but the display may not fit onto the screen correctly.
2. If Lotus-123 is started from within Windows, the amount of memory available to Lotus may
not be enough to run the model, in which case the computer should be restarted in DOS mode. Memory problems may also occur in DOS depending on the allocation of memory and the number of other programmes in memory, in which case the computer manual should be consulted to see if the amount of memory available can be increased.
ITFMP Forest Concession Model ___________________________________________________________________
___________________________________________________________________ Indonesia-UK Tropical Forest Management Programme
2
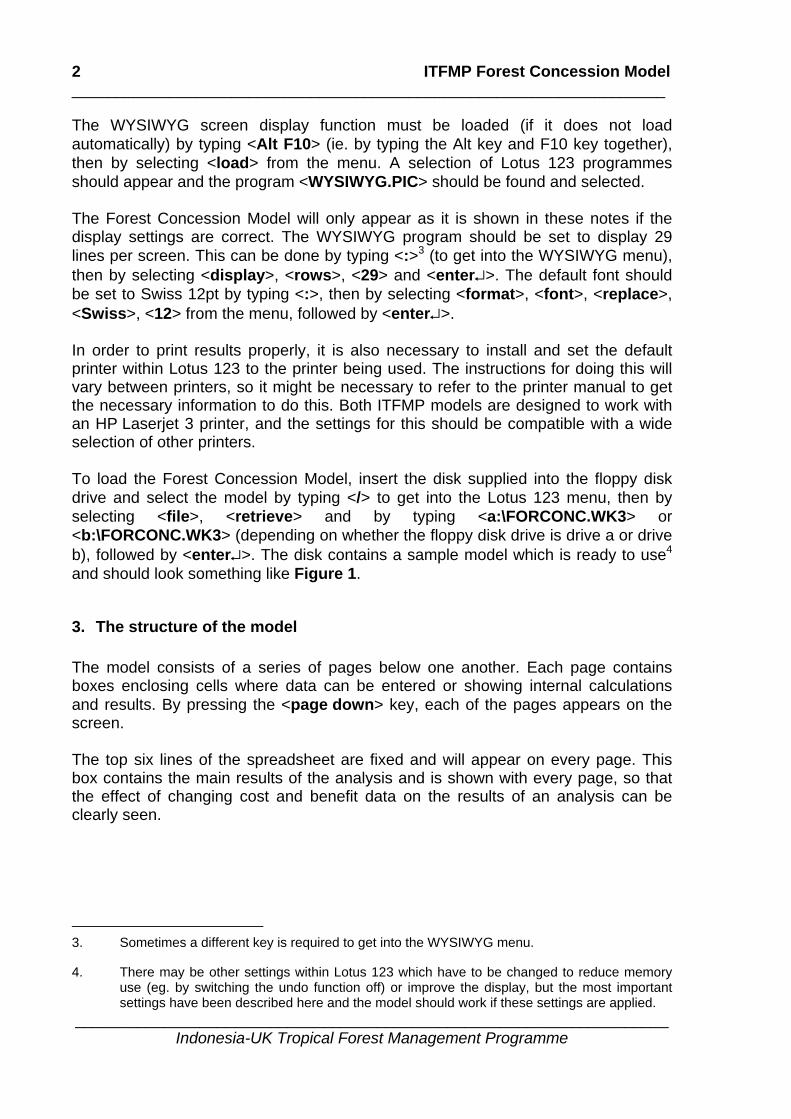
The WYSIWYG screen display function must be loaded (if it does not load automatically) by typing <Alt F10> (ie. by typing the Alt key and F10 key together), then by selecting <load> from the menu. A selection of Lotus 123 programmes should appear and the program <WYSIWYG.PIC> should be found and selected. The Forest Concession Model will only appear as it is shown in these notes if the display settings are correct. The WYSIWYG program should be set to display 29 lines per screen. This can be done by typing <:>3 (to get into the WYSIWYG menu), then by selecting <display>, <rows>, <29> and <enter↵>. The default font should be set to Swiss 12pt by typing <:>, then by selecting <format>, <font>, <replace>, <Swiss>, <12> from the menu, followed by <enter↵>. In order to print results properly, it is also necessary to install and set the default printer within Lotus 123 to the printer being used. The instructions for doing this will vary between printers, so it might be necessary to refer to the printer manual to get the necessary information to do this. Both ITFMP models are designed to work with an HP Laserjet 3 printer, and the settings for this should be compatible with a wide selection of other printers. To load the Forest Concession Model, insert the disk supplied into the floppy disk drive and select the model by typing </> to get into the Lotus 123 menu, then by selecting <file>, <retrieve> and by typing <a:\FORCONC.WK3> or <b:\FORCONC.WK3> (depending on whether the floppy disk drive is drive a or drive b), followed by <enter↵>. The disk contains a sample model which is ready to use4 and should look something like Figure 1.
3. The structure of the model The model consists of a series of pages below one another. Each page contains boxes enclosing cells where data can be entered or showing internal calculations and results. By pressing the <page down> key, each of the pages appears on the screen. The top six lines of the spreadsheet are fixed and will appear on every page. This box contains the main results of the analysis and is shown with every page, so that the effect of changing cost and benefit data on the results of an analysis can be clearly seen.
3. Sometimes a different key is required to get into the WYSIWYG menu. 4. There may be other settings within Lotus 123 which have to be changed to reduce memory
use (eg. by switching the undo function off) or improve the display, but the most important settings have been described here and the model should work if these settings are applied.

ITFMP Forest Concession Model ______________________________________________________________
___________________________________________________________________ Indonesia-UK Tropical Forest Management Programme
3
The first page is a title page listing the contents of all the other pages. The remainder of the pages can be considered as falling into four main sections: the data entry section (pages 1 to 9); the worksheet section (pages 10 to 12); the financial tables section (pages 13 to 17); and the calculation, or workstudy, section (pages 18 to 26). The function of each of these sections is described in more detail below. Figure 1 The Forest Concession Model opening screen
A default set of data has been entered into the model and in addition to this, the model generates cost estimates for a number of road making, harvesting and management activities. Users can change the default data, choose to accept or over-write the model estimates, or change the model estimates by entering their own data on the parameters used to calculate these estimates, depending on the quality and quantity of data available. Boxes where data can be entered into the model are displayed with a yellow background (or light grey background on black and white monitors) and the text in these boxes is shown in bold. To improve the visual appearance of the model, some of these boxes are more than one cell wide, in which case numerical data

ITFMP Forest Concession Model ___________________________________________________________________
___________________________________________________________________ Indonesia-UK Tropical Forest Management Programme
4
should be entered into the cell on the right-hand side of the box and text entries should be entered into the cell on the left-hand side of the box. The worksheet is protected, so it is not possible to enter text or data into cells outside these boxes unless the protection is switched off. There are a few cells containing data and formulae which cannot be seen. The most common of these are cells which check neighbouring data entry cells for possible mistakes and show an error message if it looks like data has been is a mistype (for example, if negative costs are typed in)5. These cells will not display anything unless a mistake is suspected. Other hidden cells contain internal references for lookup tables and short programmes for printing (see section on printing below). Erasing or overwriting the contents of these cells may cause the model to fail so care should be taken if the worksheet protection is switched off.
4. Data entry Most of the data required for the model to work is entered into the computer in the first 9 pages of the model. These can each be accessed by scrolling down the screen using the <↓> key or <page down> key. The data required for the model is explained in the next few pages.
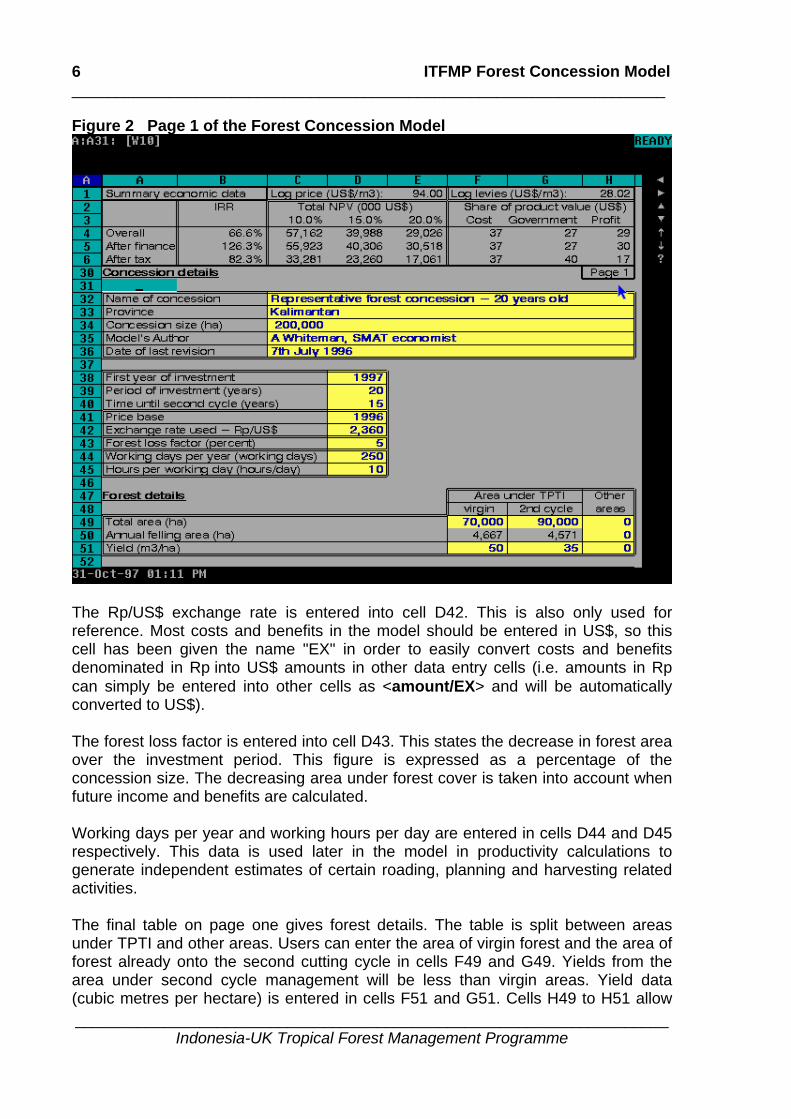
Page 1: Concession details This first page contains some very general information about the concession. Details of each of the data entry cells are given in Table 1 and page 1 of the sample modell is shown in Figure 2. The first five entries (cells C32 to C36) are mainly for reference. All text entries must be preceded by a quotation mark (eg. '24th May 1997 not 24th May 1997). Alternatively, the date could be entered with the month first (eg. May 24th 1997). Cell C34 specifies the concession size. This information is used later to calculate tax liabilities levied on land area. The other four cells in this box are for information only. Labelling the date of the work, who undertook the revisions and to where the work applies greatly assist any future application of the models.
5. The Model has been designed so that most data entry cells will be checked for the most
obvious types of mistake. It is possible however, that some mistakes might not be identified by the model and lead to incorrect results.

ITFMP Forest Concession Model ______________________________________________________________
___________________________________________________________________ Indonesia-UK Tropical Forest Management Programme
5
The first year of the investment (ie. usually the current year) is entered into cell D38. This number is used to identify each of the years in the output tables later on. The length of the investment is entered into cell D39 and is used to identify the last year of the investment in the output tables. This number must be between one and twenty because the model only has the capacity to construct a twenty year cash-flow. Time remaining until the second harvesting cycle commences is entered in cell D40. Forest concessions usually operate on a thirty five year cutting cycle.
Table 1 Details of data entry cells on page 1 of the Forest Concession Model
Data required
Cell location
Data type
Check
Critical Remarks
Name of concession C32 text useful for future reference Province C33 text useful for future reference Concession size C34 number used to calculate land tax
obligations Model's author C35 text useful for future reference Date of last revision C36 text useful for future reference,
must start with a quotation mark
First year of investment D38 number should be > 1996 Period of investment D39 number must be between 1 and 20 Time until second cycle D40 number between 1 and 35 under TPTIPrice base D41 number for future reference
(if required) Exchange rate used D42 number ( ) used elsewhere (optional) Forest loss factor D43 number included in later calculations Working days per year D44 number used to calculate productivity Hours per working day D45 number used to calculate productivity Total area F49-
H49 number used to calculate annual
felling area. For any data entered under other areas a corresponding entry MUST be made on page 9.
Annual felling area F50-H50
number used to calculate production. For any data entered under other areas a corresponding entry MUST be made on page 9.
Yield F50-H50
number used to calculate production. For any data entered under other areas a corresponding entry MUST be made on page 9.
The price base, the year to which all cost and benefit data have been adjusted for inflation, is entered in cell D41. This will usually be the same as the first year of the investment. This is only used for reference. It is useful to note the price base in case the figures used in the model are required for a similar analysis in later years, in which case the price base must be known in order to inflate the data to the price level in a later year.
ITFMP Forest Concession Model ___________________________________________________________________
___________________________________________________________________ Indonesia-UK Tropical Forest Management Programme
6
Figure 2 Page 1 of the Forest Concession Model
The Rp/US$ exchange rate is entered into cell D42. This is also only used for reference. Most costs and benefits in the model should be entered in US$, so this cell has been given the name "EX" in order to easily convert costs and benefits denominated in Rp into US$ amounts in other data entry cells (i.e. amounts in Rp can simply be entered into other cells as <amount/EX> and will be automatically converted to US$). The forest loss factor is entered into cell D43. This states the decrease in forest area over the investment period. This figure is expressed as a percentage of the concession size. The decreasing area under forest cover is taken into account when future income and benefits are calculated. Working days per year and working hours per day are entered in cells D44 and D45 respectively. This data is used later in the model in productivity calculations to generate independent estimates of certain roading, planning and harvesting related activities. The final table on page one gives forest details. The table is split between areas under TPTI and other areas. Users can enter the area of virgin forest and the area of forest already onto the second cutting cycle in cells F49 and G49. Yields from the area under second cycle management will be less than virgin areas. Yield data (cubic metres per hectare) is entered in cells F51 and G51. Cells H49 to H51 allow

ITFMP Forest Concession Model ______________________________________________________________
___________________________________________________________________ Indonesia-UK Tropical Forest Management Programme
7
the user to enter information on any other felling activities which are being undertaken in the concession. This can include areas of forest which are being cleared to make way for logging roads and areas of conversion forest. It is critical that if forest cleared from other areas is included in the appraisal then price and royalty information must also be entered in the <logs from other areas> section on page nine. This information must be entered, even if it is the same as for logs harvested in TPTI areas. If it is not, subsequent calculations undertaken in the model will be inaccurate. TPTI, the Indonesian selective cutting system, requires concessionaires to follow a set of forest management practices designed to allow the natural forest to recover in the thirty five year gap between first and second cutting cycles. Pages two to five cover the costs of these operations.
Page 2: Planning and surveying costs The second page of the model contains information about planning and surveying costs. This information is used, along with the next three pages, to calculate the costs of forest management. Details of each of the data entry cells are given in Table 2 and page two of the sample model is shown in Figure 3. The first table on page two is for information on the main planning costs in a forest concession. Costs incurred in the production of twenty year and five year plans, environmental impact analysis and a village development diagnostic survey are depreciable under the rules of the Indonesian standard forestry accounting system (SAK 32). The costs entered in each of these cells should therefore be the depreciated annual cost. Under the SAK system, this is the format in which companies should provide this data in annual financial reports. All data is entered in cubic metres per hectare (hectarage refers to the size of the annual cutting area). The second table on this page refers to mapping and surveying costs. The costs entered for aerial photography and mapping should be the annual depreciated cost of these operations, in accordance with the specifications of SAK 32. Again costs are based on the cost per hectare for the annual cutting block. Cells G65 to G67 provide model estimates for the cost of mapping and surveying. Similar model estimates appear on other pages of the model and will be discussed in greater detail later. They are referenced from the calculation tables section at the end of the model and provide a default value which will acquiesce to any value entered in the corresponding data entry (yellow coloured) box. If the value to be entered in the yellow box is zero ie. a company does not provide data on this topic, or it is included along with other data, a text entry must be used, for example <zero> or <included elsewhere>. This is because Lotus spreadsheet software equates a numerical zero with a blank cell and does not register the zero value in later calculations.

ITFMP Forest Concession Model ___________________________________________________________________
___________________________________________________________________ Indonesia-UK Tropical Forest Management Programme
8
Having data placed under correct headings is not important, in so far as calculations undertaken by the model are not affected, provided running totals are correct. Aggregated data can be entered in a single cell and the remaining cells in a table can be annotated so that other users can trace steps taken in the analysis. Table 2 Details of data entry cells on page 2 of the Forest Concession Model
Data required
Cell location
Data type
Check Critical Remarks
Production of 20 year plan F57 number Enter depreciated annual cost (US$/ha. of annual felling area)
Village development diagnostic survey
F58 number Enter depreciated annual cost (US$/ha. of annual felling area)
Environmental impact analysis
F59 number Enter depreciated annual cost (US$/ha. of annual felling area)
Production of 5 year plan F60 number Enter depreciated annual cost (US$/ha. of annual felling area)
Production of annual plan F61 number Non-depreciable annual operating cost
Aerial photography F65 number Enter depreciated annual cost (US$/ha. of annual felling area)
Mapping work area F66 number Enter depreciated annual cost (US$/ha. of annual felling area)
Pre-felling inventory F67 number US$/ha. of annual felling area
Boundary marking cost F71 number US$/km marked Length of boundary to mark
F72 number km
Duration of boundary marking
F73 number Time before remarking must be undertaken
Planning overhead F74 number Can enter any other planning costs here
The final planning and surveying table covers other planning costs such as boundary demarcation and planning overheads.

ITFMP Forest Concession Model ______________________________________________________________
___________________________________________________________________ Indonesia-UK Tropical Forest Management Programme
9
Figure 3 Page 2 of the Forest Concession Model
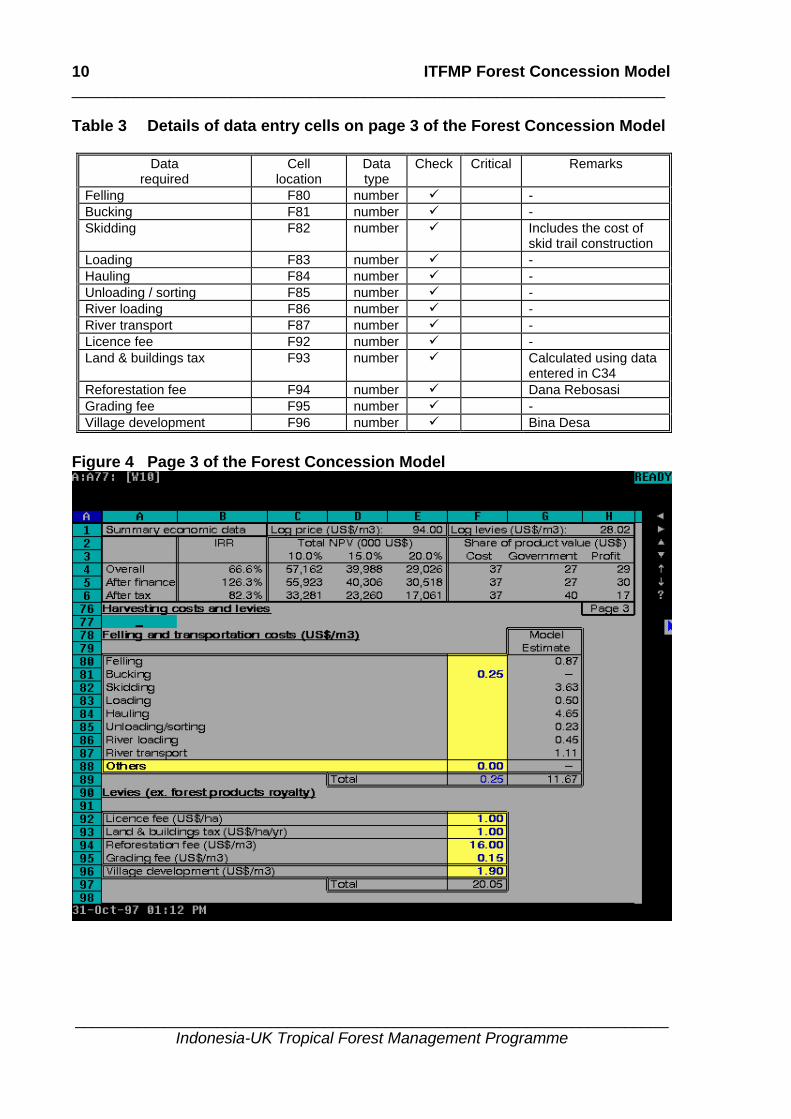
Page 3: Harvesting costs and levies The third page of the model contains information on harvesting costs and levies. Details of each of the data entry cells are given in and page three of the sample model is shown in Figure 4. The first table on page three breaks down into component parts the cost of felling and removing logs to processing sites. Skidding costs include the cost of skid trail construction. The model assumes that skid trails are not maintained in future years, are non-depreciable and are therefore treated differently from other roads constructed and maintained around the forest concession. With the exception of bucking costs and other costs, the model calculates independent estimates for harvesting operations. If better data is held by the model user, this can be entered and will over-ride the model estimates. Harvesting costs are totalled in cells F89 and G89.
ITFMP Forest Concession Model ___________________________________________________________________
___________________________________________________________________ Indonesia-UK Tropical Forest Management Programme
10
Table 3 Details of data entry cells on page 3 of the Forest Concession Model
Data required
Cell location
Data type
Check Critical Remarks
Felling F80 number - Bucking F81 number - Skidding F82 number Includes the cost of
skid trail construction Loading F83 number - Hauling F84 number - Unloading / sorting F85 number - River loading F86 number - River transport F87 number - Licence fee F92 number - Land & buildings tax F93 number Calculated using data
entered in C34 Reforestation fee F94 number Dana Rebosasi Grading fee F95 number - Village development F96 number Bina Desa
Figure 4 Page 3 of the Forest Concession Model

ITFMP Forest Concession Model ______________________________________________________________
___________________________________________________________________ Indonesia-UK Tropical Forest Management Programme
11
If data provided by companies is not in a disaggregated form, it can still be entered in cells for which it is available and the estimates for costs already included in the aggregated data over written by inserting a text entry which either states in which cell the corresponding data is included, or by simply entering <zero>. For example, a company may include river transport and river loading as a single entry in their annual accounts. This aggregated data can be entered in cell F86 (under river loading) and in F87 (under river transport) can be inserted a note drawing attention to this fact, thereby switching of the model estimate for river transport. The second table on page three contains the official payments which concessionaires must make to the government, excluding the forest products royalty, which is entered later on page nine. These payments are totalled in cell F97.
Page 4: Forest management costs Following harvesting, felling blocks require tending to ensure that they recover fully and produce good yields of timber for the second harvest. Data for these maintenance operations is entered in the first table on page four, shown in Figure 5. Details of each of the data entry cells are given in Table 4. Figure 5 Page 4 of the Forest Concession Model

ITFMP Forest Concession Model ___________________________________________________________________
___________________________________________________________________ Indonesia-UK Tropical Forest Management Programme
12
Table 4 Details of data entry cells on page 4 of the Forest Concession Model Data
required Cell
location Data type
Check Critical Remarks
Liberation cutting F103 number - Post-felling inventory
F104 number -
Planting / enrichment
F105 number -
Maintenance I F106 number - Maintenance II F107 number - Thin I F108 number - Thin II F109 number - Thin III F110 number - Protection F111 number - Seedling production F115 number - Fire protection F119 number - Forest management overheads
F120 number -
TPTI sets out a timetable for performing post harvesting activities. Column C displays the year in which each operation is performed and the year in which the model builds this into the cash flow. For a new concession, the cost of TPTI maintenance will rise each year until, after twenty years, the concession will have old felling blocks requiring each of the forest management activities in each financial year, and costs will reach a plateau. Costs entered in the yellow shaded data entry cells will overwrite estimates produced by the computer and displayed in cells G103 to G111. The second table on page four, nursery costs, functions in the same way. As before, if the new value for any of these operations is zero, a text entry must be placed in the yellow box. Other management costs are entered in the last two rows of this page. The model does not produce estimates for these costs.
Page 5: Camp capital and operating costs Page five treats capital investments for the first time in the model. Capital costs are considerably more complex to deal with than operating costs because capital costs depreciate over the working life of the investment.

ITFMP Forest Concession Model ______________________________________________________________
___________________________________________________________________ Indonesia-UK Tropical Forest Management Programme
13
Capital invested in the concession is split into three categories:
1. initial capital (ie. buildings and machinery which are acquired at the start of the investment);
2. working capital (ie. cash and stocks of inputs and outputs required for day to day operations); and
3. replacement capital (ie. machinery and buildings which have to be replaced during the investment period).
Page five deals with new and existing base camp capital. Details of each of the data entry cells are given in Table 5 and page five of the sample model is shown in Figure 6. Table 5 Details of data entry cells on page 5 of the Forest Concession Model
Data required
Cell location
Data type
Check
Critical Remarks
New camp investment D126 to D133 number Value of new (current year) investments
Existing camp investment
E126 to E133 number Current book value of existing investments
Total depreciation period F126 to F133 number Expected working life of the investment
Remaining depreciation period
G126 to G133 number Time remaining of the expected working life
Camp operating costs E138 to E141 number Enter non-depreciable camp costs

ITFMP Forest Concession Model ___________________________________________________________________
___________________________________________________________________ Indonesia-UK Tropical Forest Management Programme
14
Figure 6 Page 5 of the Forest Concession Model
The cost of new investments are entered in cells D126 to D133. New investments are investments made in the current year. The value of existing investments (the current book value) is entered in the range E126 to E133. The total depreciation period and the number of years remaining out of this estimated working life are entered in cells F126 to F133 and G126 to G133 respectively. The cash flow tables in section three of the model include the capital costs in the calculations and also introduce replacement capital into the cash flow using the information entered on the depreciation of capital. The second table on page five deals with camp operating costs. Operating costs do not require any depreciation calculation. The model does not produce independent estimates for these costs. Costs per year are entered in US$.
Page 6: Mobile capital requirements Large amounts of mobile capital are required in initial capital investments for felling, roading and transport operations. Mobile capital has a short working life when worked to the very limits of its engineering in demanding forest terrain. Consequently forest concessions also have a large outlay for replacement mobile capital. Page six (displayed in) deals with concession mobile capital. Data to be entered is summarised in Table 6 below.

ITFMP Forest Concession Model ______________________________________________________________
___________________________________________________________________ Indonesia-UK Tropical Forest Management Programme
15
Table 6 Details of data entry cells on page 6 of the Forest Concession Model
Data required
Cell location
Data type
Check
Critical Remarks
Unit cost C150 to C164 number - Number currently available
D150 to D164 number -
Estimated future requirements (input)
F150 to F164 number Will overwrite data shown in the range E150 to E164
Depreciation period G150 to G164 number - Unit life H150 to H164 number Working life of the
machinery Mobile capital unit cost data is entered in range C150 to C164. All mobile capital is depreciable under the Indonesian standard forestry accounting system (SAK 32), with the exception of chainsaws which have an estimated working life of one year. The number of units of each type of capital available is entered in the range D150 to D164. The model estimates future capital requirements in cells E150 to E164, but if a concession has different future requirements to those produced by the model then the default values can be over written by entries made in the input column (cells F150 to F164). Information about the depreciation and unit life of these capital assets is entered in columns G and H. For example, if it is assumed that a bulldozer will work for eight years, <8> should be entered into cell G151. These figures are used to calculate the annual allowance for depreciation and to introduce replacement capital expenditure into the cash flows in section three of the model.

ITFMP Forest Concession Model ___________________________________________________________________
___________________________________________________________________ Indonesia-UK Tropical Forest Management Programme
16
Figure 7 Page 6 of the Forest Concession Model
Page 7: Other capital requirements The seventh page of the model (Figure 8) contains information about other capital requirements. Any mobile capital not stated on page six can be entered here. The table is laid out in the same style as on page six, however no independent estimates are provided by the computer. This table is useful for concessions which operate under unusual circumstances or in unusual areas and therefore have unusual capital needs. Data entry cells are discussed in Table 7. Replacement stationary capital is entered in the second table on this page. The year of the investment cycle (one to twenty) in which existing capital must be replaced is entered in the range D182 to D190. Replacement cost is entered in the range F182 to F190 and the working life (and hence depreciation period) of replacement capital is entered in the range H182 to H190.

ITFMP Forest Concession Model ______________________________________________________________
___________________________________________________________________ Indonesia-UK Tropical Forest Management Programme
17
Figure 8 Page 7 of the Forest Concession Model

ITFMP Forest Concession Model ___________________________________________________________________
___________________________________________________________________ Indonesia-UK Tropical Forest Management Programme
18
Table 7 Details of data entry cells on page 7 of the Forest Concession Model Data
required Cell
location Data type
Check
Critical Remarks
Capital items A173 to A177 text Enter any additional capital items
Unit cost C173 to C177 number - Number currently available
D173 to D177 number -
Estimated future requirements (input)
F173 to F177 number Will overwrite data shown in the range E150 to E164
Depreciation period G173 to G177 number - Unit life H173 to H177 number Working life of the
machinery Replacement capital item
A182 to A190 text Enter item of camp capital to be replaced
Year D182 to D190 number Enter year of investment cycle in which capital must be replaced
Amount F182 to F190 number Cost of replacement Depreciation period H182 to H190 number Working life of capital
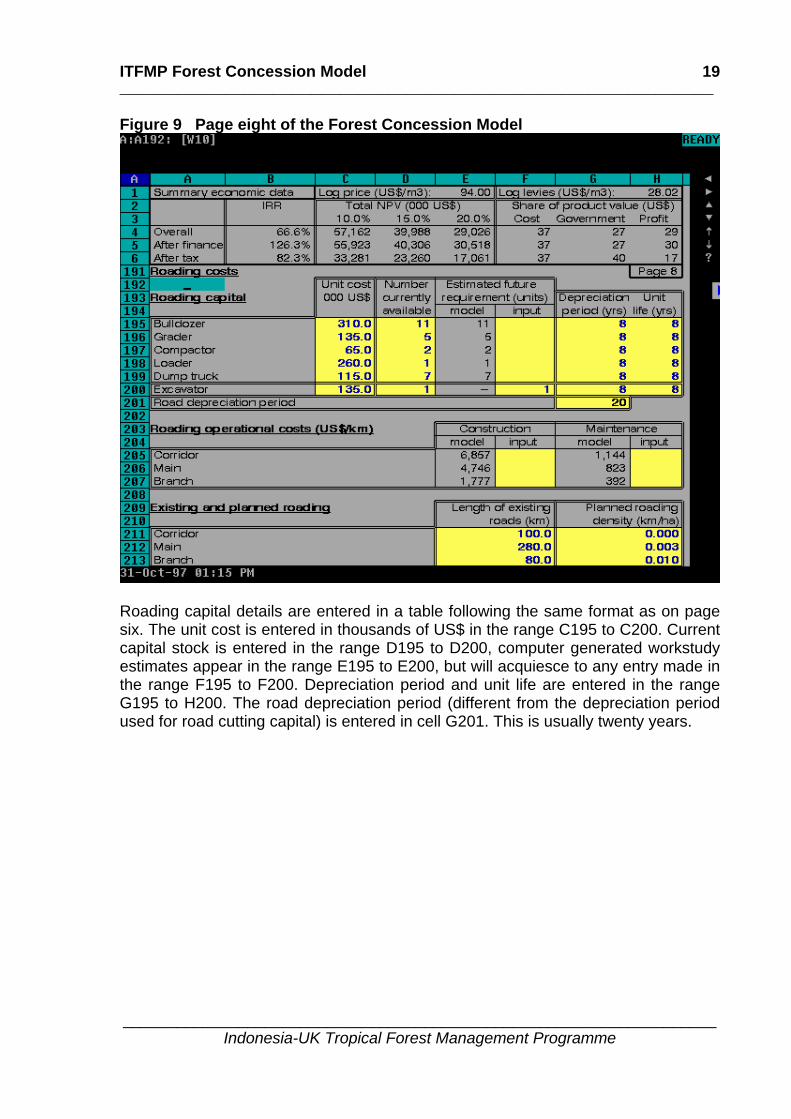
Page 8: Roading cost Roading costs make up a substantial and complicated proportion of forest concession expenditure. In building roads, both capital and operating costs are incurred, while in some cases substantial amounts of saleable timber are recovered to offset part of this outlay. Forest areas cleared for roads, if known, can be entered in H50 along with other forest details and a yield estimate entered in H51. Page eight (Figure 9) deals only with the costs incurred in laying a road network. Data entry cells are described in Table 8.
ITFMP Forest Concession Model ______________________________________________________________
___________________________________________________________________ Indonesia-UK Tropical Forest Management Programme
19
Figure 9 Page eight of the Forest Concession Model
Roading capital details are entered in a table following the same format as on page six. The unit cost is entered in thousands of US$ in the range C195 to C200. Current capital stock is entered in the range D195 to D200, computer generated workstudy estimates appear in the range E195 to E200, but will acquiesce to any entry made in the range F195 to F200. Depreciation period and unit life are entered in the range G195 to H200. The road depreciation period (different from the depreciation period used for road cutting capital) is entered in cell G201. This is usually twenty years.

ITFMP Forest Concession Model ___________________________________________________________________
___________________________________________________________________ Indonesia-UK Tropical Forest Management Programme
20
Table 8 Details of data entry cells on page 8 of the Forest Concession Model Data
required Cell
location Data type
Check
Critical Remarks
Capital items A173 to A177 text Enter any additional capital items
Unit cost C173 to C177 number - Number currently available
D173 to D177 number -
Estimated future requirements (input)
F173 to F177 number Will overwrite data shown in the range E150 to E164
Depreciation period G173 to G177 number - Unit life H173 to H177 number Working life of the
machinery Construction input F205 to F207 number Will over-write
corresponding model estimate
Maintenance input H205 to H207 number Will over-write corresponding model estimate
Length of existing roads F211 to F213 number - Planned roading density H211 to H213 number -
Table 2 on page eight covers data on the operating costs of road construction and maintenance. These costs have been split between the different types of roads assumed by the model to exist in a forest concession area. Corridor roads are roads which link the forest concession to the national road network and may in fact even be part of the national road network. Main roads are arterial routes through the concession, from which branch roads emanate, providing links to felling areas. Branch roads are not skid trails, the construction cost of which is included under harvesting costs. Branch roads, like main and corridor roads, are considered to be depreciable investments, while skid trails are not. Roading is classified in this way by SAK 32, the Indonesian standard forestry accounting system.
Page 9: Sales and other financial details To calculate sales revenues, total production is divided into species groupings. The common species groupings are Meranti, Rimba Campuran (mixed species) and Kayu Indah (fancy wood). These three species groupings can be seen in Figure 10. Royalty payments due on each species vary. The current IHH royalty for each of the species groupings must be entered in the range C221 to C225. Information on current royalty rates can be obtained from a pamphlet published every six months by the Directorate General of Forest Utilisation (DitJen PH) in the Ministry of Forestry. The proportion of each species harvest, expressed as a percentage of the total harvest, is entered in the range D221 to D225.

ITFMP Forest Concession Model ______________________________________________________________
___________________________________________________________________ Indonesia-UK Tropical Forest Management Programme
21
Figure 10 Page 9 of the Forest Concession Model
Current log prices are entered in the range F221 to F225. Price details are required for each species grouping. The price required is the delivered price of roundwood, since transportation costs have already been included earlier in the model. The second section of the first table on page nine covers logs from other areas. Any harvest from non-TPTI areas, entered in the range H49 to H51, must have a corresponding entry on page nine, otherwise later calculations will be inaccurate. The final data entry cells on page nine are for entering other financial information. The proportion of the total initial capital requirements which will be funded by the investor (ie. the investor's equity share in the investment) should be entered into cell D235. The rest of the initial capital requirement will be funded by borrowing. The debt and equity requirement affects the debt repayment calculations on page eleven of the model and the NPV results given in the output tables. The interest rate on borrowed funds should be entered into cell H234. The corporate tax rate should be entered into cell H235.

ITFMP Forest Concession Model ___________________________________________________________________
___________________________________________________________________ Indonesia-UK Tropical Forest Management Programme
22
Table 9 Details of data entry cells on page 9 of the Forest Concession Model Data
required Cell
location Data type
Check Critical Remarks
Logs from TPTI areas
A221 to A225 text Species group (for revenue purposes)
Royalty C221 to C225 number IHH rate per cubic metre Output (percent) D221 to D225 number Percentage of each
species group harvest Delivered price F221 to F225 number - Real price change
H221 to H225 number -
Logs from other areas
A227 to A230 text If any data entry has been made in cells H50 and H51 a corresponding entry MUST be made here
Royalty C227 to C230 number As above Output (percent) D227 to D230 number As above Delivered price F227 to F230 number As above Real price change
H227 to H230 number As above
Equity D235 number Share of investment financed by the investors own funds
Interest rate H234 number Current interest rate Corporate tax rate
H235 number Current tax rate
Data entry cells on other pages There are a number of pages in the worksheet and output sections of the model in which users can enter additional data. Some calculation tables also consist largely of data entry cells. The calculation tables will be discussed in greater detail later, this section describes cells in the worksheet and output sections which can be changed by users. The proportion of operating costs required as working capital, the number of annual loan payments and the value of existing mobile capital as a proportion of unit cost are entered onto page ten. This information is used later in cash flow calculations. Page ten is shown below in Figure 11. The model also allows the user to enter additional revenues in each year of the investment directly into the cash-flows presented in the output tables. Any such revenues can be entered into cells E371 to X371 on page thirteen. Any costs incurred over and above those already stated in the data entry can be entered into cells E403 to X403 on page fourteen. These additional costs and benefits will then be incorporated into the final cash flow.

ITFMP Forest Concession Model ______________________________________________________________
___________________________________________________________________ Indonesia-UK Tropical Forest Management Programme
23
Figure 11 An example of page 10 of the Forest Concession Model
Data has to be entered into the model on page seventeen. The model will calculate the net present value of the investment at three different discount rates and these should be entered into cells D517 to D519. The default values have been selected to represent a low, average and high discount rate for Indonesia, based on current interest rates. In order to calculate IRR it is also necessary to specify an estimated IRR before the model will calculate the IRR exactly. The default estimates already present in the sample model should be sufficient for most calculations, but if the model is displaying an error message <ERR> in one of the cells showing the IRR, alternative values should be tried in cells S524 to S526 on page seventeen.
5. Calculations within the model The most complicated calculations undertaken in the model are those used to generate independent estimates for certain planning and management activities and road construction and maintenance. The calculation tables are discussed in greater detail below. Calculations undertaken in the data entry section of the model are fairly simple. Annual felling area is calculated assuming that virgin forest is felled first, therefore

ITFMP Forest Concession Model ___________________________________________________________________
___________________________________________________________________ Indonesia-UK Tropical Forest Management Programme
24
the remaining area of virgin forest is divided by the number of years left until the second cycle commences (when it is assumed that virgin forests will be exhausted). The second cycle felling area is calculated by dividing total forest area by thirty five, the cycle over which forest concessions are usually managed. Most data entered in disaggregated form continues to be used in this fashion by the model and so very little calculation is done to summarise the data. Totals calculated for Felling and transportation costs on page three are for information only. Data entered is referenced from cash flow tables in a more disaggregated form ("felling and bucking" and "transportation"). The most complicated calculations within the model are for the following items:
1. The debt repayment by year (calculated and shown on page 11); and 2. The depreciation calculation (shown on page 12).
An explanation of how each of these items is calculated is given below.
Debt repayment by year (page 11) The debt repayment schedule is calculated from the capital requirements and debt and equity information shown on page ten. An example of a debt repayment calculation for an existing concession is shown in Figure 12, and the following text explains how the schedule for a concession is constructed. The model assumes that the amount of debt in the opening balance for year one is determined by the book value of existing capital assets and the debt to equity ratio. This is shown as the existing amount of debt and equity in cells F248 and F249 on page ten of the model. The existing level of debt is copied from page ten to give the opening level of debt in year one. The annual loan repayment is calculated by dividing total debt by the number of annual (yearly) payments entered in cell D256. This repayment is copied onto page eleven. The closing level of debt in each year is then calculated as the opening level of debt minus the loan repayment. The interest payment shown in column E on page 11 is calculated as follows: interest payment = ⎡opening + closing ⎤
⎣ balance balance⎦ x 0.5 x interest rate
Interest is calculated on the average level of outstanding debt (ie. the average of the opening and closing balances). The total debt repayment given in column H of page eleven is simply the sum of the loan repayment and interest payment in each year given in columns F and G.

ITFMP Forest Concession Model ______________________________________________________________
___________________________________________________________________ Indonesia-UK Tropical Forest Management Programme
25
Figure 12 An example of page 11 of the Forest Concession Model
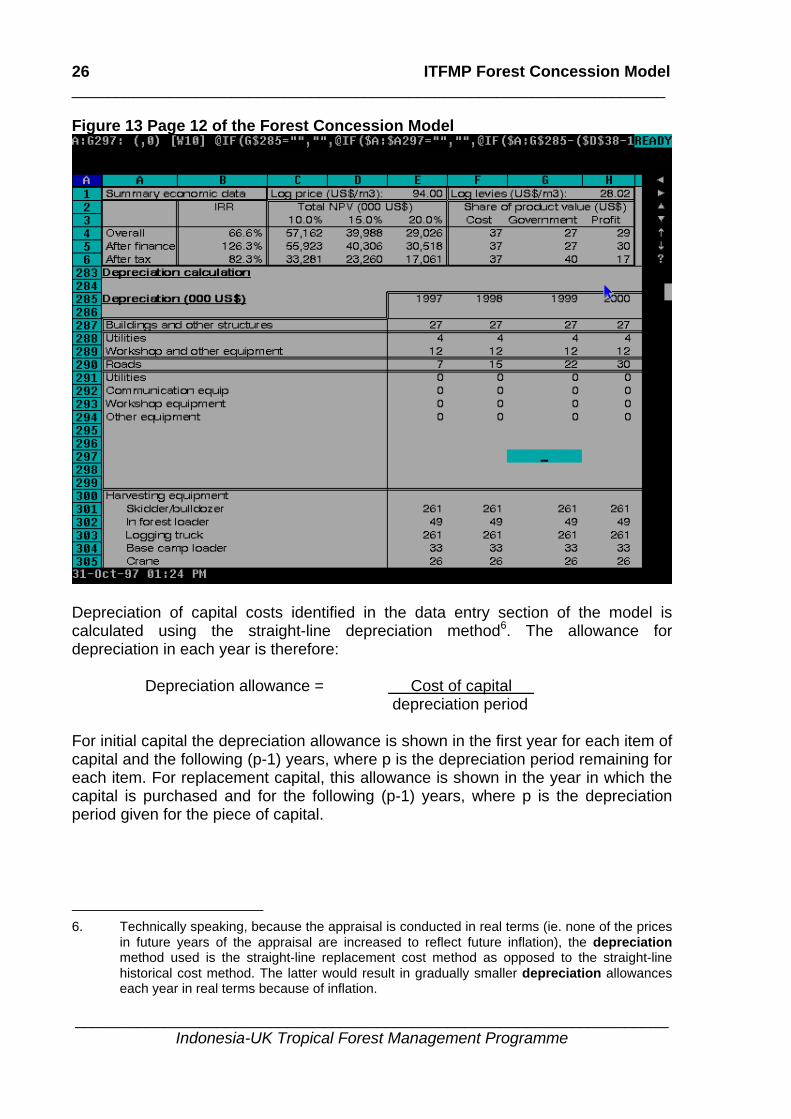
The depreciation calculation (page 12) The page is twice as long as earlier pages (ie. 46 lines) so the user must press <page down> twice to get past this page. The page is also much wider in order to show the depreciation allowance for each year and runs from column A to column X. Only columns A to H can be seen on the screen without moving across the worksheet. To move across the worksheet, the user must use the <→> or <←> keys to move across one column at a time or the <→⎜> or<⎥←> keys to move across eight columns at a time. Page twelve of the sample model is shown in Figure 13. Basic data on the cost of capital and depreciation periods is copied from pages five, six, seven and eight of the model and is used to calculate the allowance for depreciation in each year of the investment.
ITFMP Forest Concession Model ___________________________________________________________________
___________________________________________________________________ Indonesia-UK Tropical Forest Management Programme
26
Figure 13 Page 12 of the Forest Concession Model
Depreciation of capital costs identified in the data entry section of the model is calculated using the straight-line depreciation method6. The allowance for depreciation in each year is therefore:
Depreciation allowance = Cost of capital depreciation period
For initial capital the depreciation allowance is shown in the first year for each item of capital and the following (p-1) years, where p is the depreciation period remaining for each item. For replacement capital, this allowance is shown in the year in which the capital is purchased and for the following (p-1) years, where p is the depreciation period given for the piece of capital.
6. Technically speaking, because the appraisal is conducted in real terms (ie. none of the prices
in future years of the appraisal are increased to reflect future inflation), the depreciation method used is the straight-line replacement cost method as opposed to the straight-line historical cost method. The latter would result in gradually smaller depreciation allowances each year in real terms because of inflation.

ITFMP Forest Concession Model ______________________________________________________________
___________________________________________________________________ Indonesia-UK Tropical Forest Management Programme
27
Total depreciation allowance is summed for each year of the investment cycle and presented in the range E328..X328.
6. Model outputs The model constructs a series of cash-flows and calculates a range of measures of economic performance based on the information entered in the data entry section of the model and the calculations performed in the worksheet section. The measures of economic performance are summarised in the box which appears on the first six lines of each page of the model. The five output pages (pages 13 to 17) contain a large amount of information and are designed to be printed rather than examined on the screen (key results are given in the summary economic data box). So, like the depreciation calculation page, each of the pages are twice as long as earlier pages (46 lines) and the user must press <page down> twice to get past each page. Again, each page also runs from column A to column X, but only columns A to H can be seen on the screen so, to move across the worksheet, the user must use the <→> or <←> keys to move across one column at a time or the <→⎜> or<⎥←> keys to move across eight columns at a time. Each of the output pages contains a title describing what the page shows. Pages thirteen to sixteen present cash-flows showing the timing and amounts of costs and benefits occurring throughout the appraisal period and page seventeen presents a complete set of the economic performance measures calculated from these cash-flows. The years in each cash-flow are identified as calendar years (based on the first year of investment entered into page one of the model). The model will produce cash-flows for up to twenty years, depending on the period of investment entered into page one. If the period of investment being considered is less than twenty years, then some of the right-hand columns in the cash-flows will appear blank. The following text will briefly explain how each of the tables are constructed and discuss how the summary economic data box should be interpreted.

ITFMP Forest Concession Model ___________________________________________________________________
___________________________________________________________________ Indonesia-UK Tropical Forest Management Programme
28
Page 13: Financial table I: Sales volumes and revenues This is the first of the output tables and is the easiest to interpret. Sales volumes are calculated using the forest area and forest loss factor data entered on page one of the model. The top of the table shows the area and condition (virgin or secondary) of forest felled in that year. The expected yields from different forest types are shown below this. Based on these two pieces of information and the forest loss factor entered into cell D43, the total volume of the annual harvest is calculated. The delivered price of roundwood by species group is presented and a weighted average of the product prices calculated, based on the data entered in the range D221 to D224 (and D227 to D230, if applicable). Sales revenue is calculated by multiplying volume harvest by the weighted average price. The user can also enter other revenue not counted elsewhere in the model (eg. sales of residues), if desired. Any additional data entered is included in the grand total at the foot of this page. If logs from other areas contribute to the total revenue then users must check to see that price and royalty information has been entered under logs from other areas on page nine. If it has not, rows 262 and 268 will remain blank and revenue from the additional timber will not be included in the total revenue.
Page 14: Financial table II: Income statement This table shows the net annual income before and after tax for each year of the investment. The first row shows total sales revenue, copied from the previous table. Below this, manufacturing and other tax deductible costs are shown. Total manufacturing costs are broken down into fixed and variable costs. These are calculated using production data and the unit manufacturing and operating costs entered earlier in the model. The user can also enter any other manufacturing costs not counted elsewhere in the model into this table if desired. Other tax deductible costs, consisting of the depreciation allowance (copied from page twelve), interest expense (ie. interest payments copied from page eleven), and payment of export taxes in each year are summarised. Manufacturing and other tax deductible costs are subtracted from the total sales revenue to give the net income before tax. Corporate tax dues are calculated by multiplying the net income before tax by the corporate tax rate entered into cell H235 on page nine and net income after tax is derived by subtracting corporate tax obligations from net income before tax. Finally, cumulative net income is shown at the bottom of this table. For each year, this is calculated by adding net income after tax for the current year to a running total of previous years net income after tax.

ITFMP Forest Concession Model ______________________________________________________________
___________________________________________________________________ Indonesia-UK Tropical Forest Management Programme
29
Page 15: Financial table III: Cash-flow statement The investment cash-flow, taking into account the money received from operations, capital funds and expenditure on capital and debt repayments is calculated on page fifteen. Net income and the depreciation allowance are copied from the page fourteen and summed to give the total cash receipts from operations. The depreciation allowance is added back into the cash receipts - this money is only subtracted from income in the previous table because it is a tax deductible cost. The next three lines show the amounts and sources of money invested in the mill - money received from loans (long term debt), money received from the investors own funds (equity), copied from the debt repayment calculation shown on page ten, and a sub-total. Subtotalled cash receipts and capital funds are added together to give total cash receipts for the operation. Expenditure on capital and debt repayment, copied from pages six, nine and eleven, are summed to give total expenditure for each year of operation. The net cash-flow is calculated by subtracting total expenditures from total receipts for each year, and a cumulative net cash-flow is calculated by adding the current year net cash flow to a running total from previous years in the investment. Years in which negative figures, shown in brackets, appear in the net cash-flow are years in which receipts from operations are not sufficient to cover capital expenditures. This might occur in years when there is a significant amount of expenditure on replacement capital. If the cumulative net cash-flow remains positive, this would indicate that capital expenditure in such years could be funded from previous years profits. Alternatively, whether the cumulative net cash-flow remains positive or not, the difference between receipts and capital expenditures could be funded by an additional investment of equity or a restructuring of borrowing requirements. If the latter is desired, then this table should be used to examine how the total amount and repayment of loans (pages seven and eleven of the model) could be adjusted to achieve this aim.
Page 16: Financial table IV: Adjusted cash-flow statement The final cash-flow table presents the cash-flow for the concession broken down into its individual components. The first section gives the adjusted cash-flow, which shows the total flow of costs and benefits, irrespective of where the money to finance outflows comes from. The second section shows the effect of financing or borrowing on the flow of costs and benefits to the investor and the third section shows the effect of tax on the flow of costs and benefits to the investor. These three cash-flows are used to calculate the overall returns to the investment, the returns after financing, and the returns after tax. The last section of this table presents the flow of government revenue paid by the mill and is used to calculate the share of final product value captured by the government.
ITFMP Forest Concession Model ___________________________________________________________________
___________________________________________________________________ Indonesia-UK Tropical Forest Management Programme
30
The cash-flow presented in the first table on page sixteen represents the overall investment of money in the concession and annual returns. In the default settings on the model it is always positive. This is because the default model settings are chosen to reflect an existing concession. In a new concession the cash flow may be negative in the first years of operation and become positive later in the life span of the investment. The total inflow is composed of product revenue plus other revenue, copied from financial table I on page thirteen. Total outflow includes manufacturing costs, the change in gross fixed assets and expenditure on working capital (both copied from financial table III on page fifteen). Net benefit before financing and tax equals the total outflow of money subtracted from the total inflow for each of the years of the investment. The second section of the adjusted cash flow statement calculates the effect of financing or borrowing on the cash-flow. Long term loans received are copied from the flow of long-term debt shown in financial table III on page fifteen. Repayment of long-term loans is copied from the debt repayment shown in financial table III and interest payments are copied from the interest expense shown in financial table II on page fourteen. The net effect of financing in each year is calculated as:
Net = Long-term loans - Repayment of - Interest financing received long-term loans payments
If money is borrowed for the investment, net financing will be positive in early years and negative in later years. Net benefit after financing and before tax is shown at the bottom of this section and is calculated by adding net financing to the net benefit before financing and tax given above. This shows the cash-flow received by the investor, taking into account the effects of borrowing. So, if there is any borrowing, this will have the effect of increasing the cash-flow in earlier years (as money is borrowed) and reducing it in later years (as the debt is repaid and interest is paid). The tax payment section takes the corporate tax paid each year (from financial table II on page fourteen) and subtracts this from the net benefit after financing and before tax given above, to give the net benefit after financing and tax. This shows the cash- flow received by the investor taking into account the effects of borrowing and taxation and will be lower than the cash-flows given in the earlier sections of the table. The last section of this table shows the government revenue collected from corporate taxes paid by the concession, log levies paid on the roundwood supply and any other government levies and taxes. These figures are all copied from earlier financial tables and added together in the last row of this table.

ITFMP Forest Concession Model ______________________________________________________________
___________________________________________________________________ Indonesia-UK Tropical Forest Management Programme
31
Page 17: Financial table V: Measures of financial performance The final output table presents a range of measures of financial performance for the mill including:
1. Net Present Value; 2. Net Present Value converted to an annuity; and 3. Internal Rate of Return.
The three measures of financial performance used by the model are defined below: Net Present Value (NPV) is the sum of the discounted annual values of the net benefits of a project, or of any other type of separately analysed activity. There will be a different NPV value for every different set of annual benefits. At any positive discount rate, a present value can be converted into a stream of annual amounts over a period of time which have the same present value. The annual amount is called an annuity. Discounted costs, discounted benefits and NPVs can be converted into annuities. This measure is usually used to compare options with different duration. The Internal Rate of Return (IRR) is often used to determine the financial viability of a capital project such as a forest concession. The IRR is the rate of interest which discounts the net revenue generated by an investment such that the net present value, calculated by the method above, equals zero ie. net benefits equal net costs and the project breaks even. The SMAT models assume that an IRR of 20% after tax offers sufficient incentive for operators to remain in the industry in the long-run. Returns of 20% are well above the rate at which money can be borrowed, making the investments very attractive propositions. The table also shows the share of the average product value accounted for by production and capital costs (including normal profit), the share captured by the government as taxes and levies and the remainder going to the investor as excess profit. All of these measures are shown before tax and financing, after financing but before tax and after financing and tax.
Three discount rates should be entered into cells D517 to D519 on this page, to represent the low, medium, and highest returns that the investor would wish to receive from the investment. These are used to calculate the measures given in the rest of the table. The first three columns give the Net Present Value (NPV) of the investment calculated at each of the three discount rates, before and after financing and tax. These figures are calculated using the NPV function within Lotus-123, from the three cash-flows given at the end of each of the first three sections of financial table IV on page sixteen.

ITFMP Forest Concession Model ___________________________________________________________________
___________________________________________________________________ Indonesia-UK Tropical Forest Management Programme
32
The NPV calculation discounts all the costs and benefits presented in each of the cash-flows given previously as though they occur in the middle of each year. This is a reasonable assumption to make for costs and benefits occurring in later years of an investment. The value of existing assets is treated as a cost at the start of the first year. The next three columns give the NPV converted to an annuity. These figures are calculated from the NPV results shown to the left and the period of investment entered into cell D41 on page one of the model. The annuity calculated is a year-end annuity. Thus, for example, in the sample model the NPV at a 15% discount rate after financing and tax is US$ 23,260,000 and the corresponding annuity is US$ 3,716,000 per year. This means that the NPV of US$ 23,260,000 has the same present value as twenty annual payments of US$ 3,716,000 at the end of each of the years from one to twenty. The share of product value at each of the three discount rates used in the analysis is shown in the next nine columns. The shares are defined as follows:
1. Cost = total manufacturing cost + all capital costs + normal profit 2. Govt. = log levies + export taxes + corporate tax 3. Profit = excess profit = average product value - cost - govt.
It is very important to note that normal profit is included in the cost share given above, and the profit share represents the excess profit earned by the investor and not the total profit or return on the investment. Normal profit is defined as the rate of return on capital which is just sufficient to persuade the investor to participate in the investment. It is assumed that this required rate of return is the same as the discount rate in each of the low, medium and high discount rate scenarios. Excess profit is any profit received over and above this minimum required level and is therefore, by definition, equal to the NPV at each discount rate. The assumption that the required rate of return is equal to the discount rate has the effect of increasing the share of product value required to cover costs (including normal profit) as the discount rate (and implicitly the required rate of return) increases.

ITFMP Forest Concession Model ______________________________________________________________
___________________________________________________________________ Indonesia-UK Tropical Forest Management Programme
33
Thus, for example, in the sample model, at a discount rate of 10% cost (including normal profit) is equal to US$ 36/m3 and profit (ie. excess profit) is US$ 18/m3. At a discount rate of 15%, these two figures are US$ 37/m3 and US$ 17/m3 respectively. The higher share of product value required to cover costs at the higher discount rate (an additional US$ 1/m3) represents the additional amount required to earn a rate of return of 15% rather than 10%, if 15% rather than 10% is considered a normal level of profit. Comparison of the profit (ie. excess profit) share of product value at these two discount rates also shows how the amount of excess profit declines as the discount rate (and implicitly the level of normal profit) increases. This occurs because part of the profit which would have been considered as excess profit at a 10% required rate of return, is now considered as normal profit at a 15% required rate of return. The share of product value between each of these three components is calculated as follows: 1. The profit (ie. excess profit) share of product value is calculated by dividing the
total NPV (before and after tax) at each of the discount rates given, by total discounted production7.
2. The government share before tax is calculated in two stages. Firstly, the total
discounted flow of log levies and export taxes is calculated from financial table IV. This is then divided by total discounted production to give the government's share of product value. To calculate the government's share after tax, the flow of corporate tax payments is added to the first stage of this calculation
3. The share of product value required to cover costs (including normal profit) is
calculated in three stages. Firstly, the total discounted benefit from the concession is calculated from the revenue data given in financial table I. This is then divided by total discounted production to give the average product (roundwood) value (in the sample model, this equals US$ 94/m3). The excess profit and government shares of product value are then subtracted from the average product value to give the share of product value required to cover costs.
Column R in this table presents the IRR of the investment before and after financing and tax. This is calculated from the three cash-flows presented in financial table IV, using the IRR function within Lotus-123. In order to calculate IRR it is also necessary to specify an estimated IRR before the model will calculate the IRR exactly. The default estimates already present in the sample model should be sufficient for most calculations, but if the model is displaying an error message <ERR> in one of the 7. Production volumes can also be discounted to take into account the timing of production.
Discounted volume is calculated in the same way as discounted cost or discounted benefit but with volume used in the discounting formula instead of cost and benefit data. Discounted volumes can be used for a variety of short-cuts in complicated calculations such as these.
ITFMP Forest Concession Model ___________________________________________________________________
___________________________________________________________________ Indonesia-UK Tropical Forest Management Programme
34
cells showing the IRR, alternative values should be tried in cells S524 to S526 on page seventeen.
Results presented in the summary economic data box (cells A1 to H6) The results presented in the summary economic data box are copied from page seventeen of the model and from other ranges containing production, price and royalty data. This box is designed to appear on every screen so that the user can immediately see the impact of changes in cost, price and forest levy data on the profitability of the forest concession. The log cost is calculated from rows 369 and 348 and appears in cell E1 in the summary table. Log levies are calculated from data entered on page three and from the stream of royalties calculated in row 399. The figures presented in this row are the average log cost and log levy paid by the concession. Cells B4 to B6 show the IRR of the investment before and after financing and tax. This is copied from page seventeen. Cells C4 to E6 show the total NPV of the investment at the low, medium and high discount rates used in the analysis and this is also copied straight from page seventeen. Cells F4 to H6 present the share of product value used by the investor to cover production and capital costs including normal profit (cost), the share captured by the government in taxes and levies (government) and the remaining share collected by the investor as excess profit (profit). The partition of product value presented is calculated using the median discount rate and is copied from page seventeen of the model. The sharing of product value at the high and low discount rates used in the analysis can only be seen on page seventeen (see above). In terms of economic rent (see Chapter 4), the economic rent from the investment is equal to the government and profit (ie. excess profit) shares of product value added together.
7. Calculation Tables The set of calculation tables set from page eighteen to twenty six provide the model estimates set in the data entry sections of the models. The estimates provided by the calculation tables are independent estimates, since they are compiled from data related to basic productivity. This method of estimating costs is known as a workstudy. In a workstudy, an activity is broken down into its basic inputs and costs for each of these inputs are identified. For example, team composition, daily wage rates, working hours per day and days per year are taken and used to calculate harvesting operating costs. Similar processes are undertaken to calculate capital costs and requirements.

ITFMP Forest Concession Model ______________________________________________________________
___________________________________________________________________ Indonesia-UK Tropical Forest Management Programme
35
A number of the calculation tables consist largely of data entry cells, containing a default set of data which is used to generate model estimates of harvesting and roading costs. If users hold better workstudy data, then this can be entered and the model estimates will be altered accordingly.
Roading There are three roading calculation tables. These tables produce a road schedule which estimates annual roading requirements, roading capital purchases and roading capital requirement. Each calculation table is discussed in greater detail below, but in essence the model calculates roading costs and requirements as follows. Road construction requirements are calculated by multiplying planned roading density information with felling area data. Road maintenance requirements are based on the length of existing roads in the concession. The total cost of roading capital is calculated on the basis of the estimated capital requirements in calculation table III and unit cost data entered earlier in the model. The working capacity of road making capital is calculated using basic data on machine productivity and usage. This provides an independent estimate of the annual output of each item of road making capital. Roading capital requirements can then be calculated by dividing the calculated road requirement in the roading schedule by the independent estimates of the annual output of road making capital. Estimates are copied to cells E195 to E200, providing model estimates in the data entry section.
Page 18: Calculation Table I Road Schedule The first calculation table encountered is the road schedule. This table will calculate the length of road which needs to be constructed annually in the concession area. Roads must be constructed to link new felling blocks with the existing transport infrastructure. The model calculates road construction requirements by multiplying planned roading density information from page eight with felling area data on page thirteen (which in turn is calculated from forest details entered on page one) for each of the road classes. The three classes - corridor, main and branch - are then totalled in row 549. Once constructed, roads must be maintained. The length of roading requiring maintenance is assumed to be all existing roading in the concession, unless data stating otherwise is entered in the yellow data entry cells in the range E554 to X556. The third table visible on page eighteen calculates the depreciated value of new roads. As the investment period advances, this table takes into account the value of previous years roading. The final table on page eighteen calculates annual road

ITFMP Forest Concession Model ___________________________________________________________________
___________________________________________________________________ Indonesia-UK Tropical Forest Management Programme
36
depreciation by dividing total depreciated value of new roads by the road depreciation period entered in cell G201.
Page 19: Calculation Table II Roading Capital Cost The first table visible on this page details roading capital purchases. Pre-project capital is calculated using data on calculated machine requirements and available equipment. The model looks up calculated machine requirements on page twenty. The model assumes that any shortfall in available equipment on the calculated requirements will be met with the procurement of new capital and enters this under the purchased heading. Available capital is referenced from the relevant cell in the range D195 to D200. During the investment cycle, machine requirements and availability in calculation table III are again referred to. The model checks to see if current year end availability of capital is sufficient to meet next years calculated capital requirements. If not, the shortfall is entered into the capital purchases table and in this way, depreciation and the replacement of worn capital can be built into the investment cycle. The cost of roading capital is then calculated by multiplying purchases with the unit cost of capital entered in the range C195 to C200 on page eight. In the case of available (existing) capital, the value is factored down using information on the value of existing mobile capital as a proportion of unit cost (%) entered on page ten in cell H255.
Page 20: Calculation Table III Roading Capital Requirement Calculation table III estimates roading capital requirements. Users enter basic productivity data on road construction capital which is used to calculate a final output of annual road construction (kilometres per year). Steps taken in the process of constructing roads are listed in the range A634 to A639. Plant required to undertake these activities are listed in the range D634 to D639. Data on the availability and utilisation of this capital is entered, expressed as a percentage. Using this data, working days per year (cell D44) and hours per working day (cell D45), effective working hours per year are calculated. Where the activity represented in column A requires a stone supply, this is entered in column M. For activities not requiring a stone supply, the output of roading per hour must be entered in the range N634 to P636. For the activities of loading, transporting and laying stone, this section is calculated by the model. The productivity estimates are derived by dividing the stone supply listed in column M by the total stone requirement per kilometre of road visible in the range N640 to P640. Hourly rates of productivity for activities not involving the transport or laying of stone can be entered directly by the user. Final outputs for road construction are arrived at by multiplying road production per hour by the number of effective working hours in a year.

ITFMP Forest Concession Model ______________________________________________________________
___________________________________________________________________ Indonesia-UK Tropical Forest Management Programme
37
The second table on this page uses the same method to calculate road maintenance. Activities, plant, machine availability and use are entered and used, along with working day and working year information, to calculate effective working hours per year. This estimate is then used along with productivity data to calculate a final output for road maintenance for each of the listed capital items. The model will calculate capital requirements for roading by dividing the calculated road requirement in the roading schedule by the estimated annual road construction for each item of road making capital. Road mileage requiring maintenance is divided by the estimated annual road maintenance capabilities of roading capital. This process is carried out for each of the three classes of road and summed to give a calculated estimate of road construction and maintenance capital requirements. Results are rounded up to account for the "lumpiness" present in capital investments, ie. if a concession requires 4.3 bulldozers, it must in fact purchase five, not all of which can be put to full use. Estimates are copied to cells E195 to E200, providing model estimates in the data entry section. Data entered in the range E654 to X659 on this page, or in the range F195 to F200 will over write these calculated requirements. Finally, this table calculates year end availability of capital. The previous year closing stock is added to current year purchases. From this total, pending purchases are subtracted since it is assumed that new capital is only brought in when existing capital becomes defunct. Pending purchases, ie. next years purchases, are therefore designed to replace capital worn out in the current year and no longer considered to be 'available'.
Harvesting There are two harvesting calculation tables. These tables estimate harvesting capital requirements and purchases. Harvesting capital purchases are based on calculated machine requirements on page twenty two and information on available capital entered on page six. Independent productivity estimates are derived for all harvesting capital. Harvesting capital requirements can then be calculated by dividing annual production by the independent estimates of the annual capacity of harvesting capital.
Page 21: Calculation Table IV Harvesting Capital Cost Page twenty one treats harvesting capital cost in the same way as page nineteen treats roading capital cost. Harvesting capital purchases are derived using data on calculated machine requirements and available equipment. The model assumes that any shortfall in available equipment on the calculated requirements will be met with the procurement of new capital entered under the purchased heading. Available capital is referenced from the relevant cell in the range D195 to D200. Total capital is the sum of purchased and available capital.

ITFMP Forest Concession Model ___________________________________________________________________
___________________________________________________________________ Indonesia-UK Tropical Forest Management Programme
38
During the investment cycle, machine requirements and availability in calculation table V are again referred to. The model checks to see if current year end availability of capital is sufficient to meet next years calculated capital requirements. If not, the shortfall is entered into the capital purchases table and in this way, depreciation and the replacement of worn capital can be built into the investment cycle. The cost of harvesting capital is then calculated by multiplying purchases with the unit cost of capital entered in the range C150 to C164 on page six. In the case of available (existing) capital, the value is factored down using information on the value of existing mobile capital as a proportion of unit cost (%) entered on page ten in cell H255.
Page 22: Calculation Table V Harvesting Capital Requirements Calculation table V estimates harvesting capital requirements using the same method as used for roading capital requirements in page twenty. Harvesting activities, machinery used during these activities, data on machine availability and usage is entered. Using this basic data, the figures for working days per year (cell D44) and hours per working day (cell D45), an estimate of effective working hours per year is calculated. Where the activity represented in column A requires travelling, distance travelled and speed whilst laden and unladen must be entered in column M, N and O respectively. Data on unproductive time and the average volume of roundwood handled must be entered for all activities. The final piece of data held in this table is the skid marking indirectness factor. Different methods are used to calculate the productivity per effective working hour for activities which do and do not include travelling. For skidding and transportation, hourly productivity is calculated as follows:
travel distance + travel distance + travel distance unladen speed laden speed unproductive time
For other harvesting activities, hourly productivity is calculated as follows:
60 - unproductive time x volume handled 60
The second table on page twenty two calculates harvesting machinery requirements and availability. Data entered in the yellow cells across the range E738 to X744 will overwrite model calculations. If these data entry cells are left blank then the model will calculate capital requirements for harvesting by dividing the total volume harvest by the annual productive capacity of harvesting capital. In the case of barge requirements, no such calculations are made and the entry made into cell F157 is
ITFMP Forest Concession Model ______________________________________________________________
___________________________________________________________________ Indonesia-UK Tropical Forest Management Programme
39
referenced directly. Any fractions of numbers are rounded up to account for the "lumpiness" present in capital investments. Finally, this table calculates year end availability of capital. The previous years closing stock is added to current year purchases. From this total, pending purchases are subtracted since it is assumed that new capital is only brought in when existing capital becomes defunct.
Other mobile capital Other mobile capital is treated in the same way as roading and harvesting capital. Two calculation tables produce requirements, purchase and cost estimates.
Page 23: Calculation Table VI Other Mobile Capital Cost Pre-project capital is calculated using data on calculated machine requirements and available equipment. The model looks up calculated machine requirements on page twenty four and assumes that any shortfall in available equipment on the calculated requirements will be met with the procurement of new capital. Available capital is referenced from the relevant cell in the range D158 to D164. During the investment cycle, machine requirements and availability in calculation table V are again referred to. The model checks to see if current year end availability of capital is sufficient to meet next years calculated capital requirements. If not, the shortfall is entered into the capital purchases table and in this way, depreciation and the replacement of worn capital can be built into the investment cycle. The cost of capital is then calculated by multiplying purchases with the unit cost of capital entered in the range C158 to C164 on page six. In the case of available (existing) capital, the value is factored down using information on the value of existing mobile capital as a proportion of unit cost (%) entered on page ten in cell H255.
Page 24: Calculation Table VII Other Mobile Capital Requirement Calculated requirements are copied directly from entries made into column D on page six. End of year availability of capital is calculated by adding the previous years closing stock to current year purchases. From this total, pending purchases are subtracted since it is assumed that new capital is only brought in when existing capital becomes defunct. If purchases are planned in the following year, then some capital has reached the end of its working life in the current year and is no longer classed as available.

ITFMP Forest Concession Model ___________________________________________________________________
___________________________________________________________________ Indonesia-UK Tropical Forest Management Programme
40
Page 25: Calculation Table VIII Machine Operating Costs Page twenty five consists of three tables. On the first of these tables, cost data common to all machine types such as fuels, oil and labour can be entered. Only one calculation is undertaken in this table, the calculation of chainsaw capital cost. A chainsaw is a capital item but is assumed to have a working life of one year, so no depreciation allowance can be claimed for wear and tear of chainsaws at the end of the financial year. Nevertheless, using a chainsaw does incur a capital cost and this is calculated as a principle interest payment, where the cost of the chainsaw is repaid over a single year. The repayment value is divided by annual productivity giving an estimate of the chainsaw capital cost for every cubic metre of timber harvest, expressed as Rupiah per cubic metre. The second table on page twenty five calculates harvesting machinery operating costs. Harvesting activities and machinery are copied respectively from calculation table V. Fuel, diesel, oil and grease consumption for each capital item is then entered in columns G to J. Details of repairs and spares required by each capital item are entered in columns K to N. The cost of fuel and repairs is calculated by multiplying fuel and oil consumption with the unit cost stated earlier on this page and adding this to the total repairs bill. Manpower requirements for each activity are listed and from this a labour cost is calculated with reference to daily wage rates and hours per working day entered on page one and daily utilisation of capital entered on page twenty two. Total operating costs are calculated by summing the fuel and repairs bill with labour cost. This total is multiplied by effective working hours per year and divided by annual productivity so that costs are expressed as a cost per cubic metre. In the case of chainsaws, the capital cost is also added to this total. The totals are expressed in terms of US$ and copied to the range G80 to G87, where they appear as the model estimates for harvest operating costs. Barge loading and river transportation are calculated from a total operating cost (Rp./hr) entered by the user and labour requirements only. The third table appearing on this page is used to calculate operating costs for roading capital. The table is laid out similarly to table two and calculates fuel and repair bills and labour cost in the same way as harvesting capital operating costs are calculated. The total costs for construction and maintenance of each class of road is calculated by multiplying the sum of fuel and labour with effective working hours per year. This total is then converted to a unit cost by dividing through by the final output of road construction on page twenty. Maintenance is calculated by the same method, but using the final output of road maintenance, also displayed on page twenty.

ITFMP Forest Concession Model ______________________________________________________________
___________________________________________________________________ Indonesia-UK Tropical Forest Management Programme
41
The cost of constructing and maintaining culverts, arched channels used to direct water beneath roads, must be entered manually in cells S892 to X892. The model includes this cost and the costs of operating each item of capital in the total construction and maintenance operating costs shown in cells S893 to X893. These totals are copied to cells E205 to E207 and G205 to G207 on page eight of the model.
Page 26: Calculation Table IX Forest Surveying and Management Operating Costs The final page of the model calculates forest surveying and management operating costs. The model requires data on the proportion of felled area covered by the activity (%), productivity (ha./day), team composition and daily wage rates per person. A subtotal of labour costs is calculated, other costs are added then a total labour cost per hectare for forest surveying is calculated. The second table visible on page twenty six reiterates the same process for forest management costs. The third table calculates cost per hectare for enrichment planting in logged over areas, again using basic productivity data. The final entries in the model are pre-project felling blocks, which are referenced in the calculation of forest management operating costs in the income statement under financial table two.
8. Printing and saving results To save the results call up the menu by pressing the </> key then select <File>, <Save>. The name of the file you wish to save will then appear. Users may wish to change the file name to a title which is indicative of the analysis, containing, for example, an abbreviation of the province in which the factory is located and the year which the analysis represents. It is sometimes useful to print the model results. The model is best printed from the WYSIWYG menu, which allows the user to specify the range to be printed, page orientation and other features which improve the overall presentation. To retrieve the WYSISYG menu press the <:> button, then select <Print>, <Range>, <Set>. Users should select two pages at a time for the first twelve pages, since these fit snugly on A4 paper with a portrait orientation. From page twelve onwards, the page orientation must be changed to landscape. This can be done from within the WYSIWYG menu.
ITFMP Forest Concession Model ___________________________________________________________________
___________________________________________________________________ Indonesia-UK Tropical Forest Management Programme
42
9. Appendix One: Using the model to evaluate financial performance Introduction A technical research team has been established to evaluate the economics of different levels of branch road (or skid trail) density in forests within different regions within Indonesia. The regions which will be examined are:
1. Sumatera and Sulawesi; 2. Kalimantan Barat; 3. Kalimantan Tengah; 4. Kalimantan Timur; 5. Maluku; and 6. Irian Jaya
You have been picked as a member of this team and have been asked to prepare a short presentation on the optimal level of roading density in one of the above regions. The following pages contain all of the information which will be required to investigate each of these regions. The following sheets (BACKGROUND DATA) contain information about capital and operating costs for typical HPHs in each of the regions, current roading costs and density and production levels and prices. Other members of the team will be assisting you with this task, so you do not have to calculate the profitability of HPHs in all the regions. Your contribution to the team's work will be to complete the following tasks:
1. read the background data and enter the necessary changes into the Forest Concession Model for your chosen region(s).
2. calculate the IRR of a typical HPH in this region and examine the
effect of different skid trail densities on IRR (by altering the planned level of branch road density on page 8 of the model); and
3. prepare a short presentation of your results showing the profitability of
HPHs in your region and explaining the optimal level of skid trail density.

ITFMP Forest Concession Model _________________________________________________________________________________________________
___________________________________________________________________ Indonesia-UK Tropical Forest Management Programme
43
BACKGROUND DATA (SHEET 1 OF 7) Concession details Region Sumatera and
Sulawesi Kalimantan
Barat Kalimantan
Tengah Kalimantan
Timur Maluku Irian
Jaya Concession size 130,000 180,000 200,000 200,000 200,000 200,000 Time to 2nd cycle 15 15 15 15 25 25 Total area - virgin 45,000 60,000 75,000 75,000 125,000 125,000 Total area - 2nd 60,000 80,000 100,000 100,000 50,000 50,000 First year of investment
1997 1997 1997 1997 1997 1997
Yield - virgin 35 40 50 50 50 30 Yield - 2nd 20 20 35 35 35 15

ITFMP Forest Concession Model _______________________________________________________________________________________________________
___________________________________________________________________ Indonesia-UK Tropical Forest Management Programme
44
BACKGROUND DATA (SHEET 2 OF 7) Planning and surveying costs Region Sumatera and
Sulawesi Kalimantan
Barat Kalimantan
Tengah Kalimantan
Timur Maluku Irian
Jaya 20 year plan 2.5 2.5 2.5 2.5 0 0 Village dev diagnostic survey
4 3 1.5 1.5 1.5 2
EIA (AMDAL) 0.75 0.75 0.75 0.75 0 0 Aerial photography 0.9 0.9 0.9 0.9 0 0 Length of boundary 30 40 50 50 0 0

ITFMP Forest Concession Model _________________________________________________________________________________________________
___________________________________________________________________ Indonesia-UK Tropical Forest Management Programme
45
BACKGROUND DATA (SHEET 3 OF 7) Camp investment (US$ 000) Region Sumatera and
Sulawesi Kalimantan
Barat Kalimantan
Tengah Kalimantan
Timur Maluku Irian
Jaya Buildings 450 (new)
20 yrs 500 (new)
20 yrs 530 (new)
20 yrs 530 (new)
20 yrs 350 (existing)
10 yrs 350
(existing) 10 yrs
Electricity 8 (existing) 10 yrs
8 (existing) 10 yrs
8 (existing) 10 yrs
8 (existing) 10 yrs
4 (existing) 5 yrs
4 (existing) 5 yrs
Gen set 8 (existing) 10 yrs
8 (existing) 10 yrs
8 (existing) 10 yrs
8 (existing) 10 yrs
4 (existing) 5 yrs
4 (existing) 5 yrs
Water supply 8 (existing) 10 yrs
8 (existing) 10 yrs
8 (existing) 10 yrs
8 (existing) 10 yrs
4 (existing) 5 yrs
4 (existing) 5 yrs
Comms equipment 16 (existing) 10 yrs
16 (existing) 10 yrs
16 (existing) 10 yrs
16 (existing) 10 yrs
8 (existing) 5 yrs
8 (existing) 5 yrs
Workshop equipment 84 (existing) 10 yrs
84 (existing) 10 yrs
84 (existing) 10 yrs
84 (existing) 10 yrs
42 (existing) 5 yrs
42 (existing) 5 yrs
Other equipment 34 (existing) 10 yrs
34 (existing) 10 yrs
34 (existing) 10 yrs
34 (existing) 10 yrs
17 (existing) 5 yrs
17 (existing) 5 yrs

ITFMP Forest Concession Model _______________________________________________________________________________________________________
___________________________________________________________________ Indonesia-UK Tropical Forest Management Programme
46
BACKGROUND DATA (SHEET 4 OF 7) Replacement capital requirements (US$ 000) Region Sumatera and
Sulawesi Kalimantan
Barat Kalimantan
Tengah Kalimantan
Timur Maluku Irian
Jaya Renovate camp - - - - 700 in yr 11
20 yr life 700 in yr 11
20 yr life Utilities 39 in yr 11
15 yr life 39 in yr 11 15 yr life
39 in yr 11 15 yr life
39 in yr 11 15 yr life
39 in yr 6 15 yr life
39 in yr 6 15 yr life
Comms equipment 25 in yr 11 15 yr life
25 in yr 11 15 yr life
25 in yr 11 15 yr life
25 in yr 11 15 yr life
25 in yr 6 15 yr life
25 in yr 6 15 yr life
Workshop equipment 127 in yr 11 15 yr life
127 in yr 11 15 yr life
127 in yr 11 15 yr life
127 in yr 11 15 yr life
127 in yr 6 15 yr life
127 in yr 6 15 yr life
Other equipment 51 in yr 11 15 yr life
51 in yr 11 15 yr life
51 in yr 11 15 yr life
51 in yr 11 15 yr life
51 in yr 6 15 yr life
51 in yr 6 15 yr life

ITFMP Forest Concession Model _________________________________________________________________________________________________
___________________________________________________________________ Indonesia-UK Tropical Forest Management Programme
47
BACKGROUND DATA (SHEET 5 OF 7) Roading Region Sumatera and
Sulawesi Kalimantan
Barat Kalimantan
Tengah Kalimantan
Timur Maluku Irian
Jaya Maintenance cost of existing branch roads
0 0 0 0 0 0
Length of existing roads Corridor 60 100 100 100 100 100 Main 180 240 300 300 150 150 Branch (skid trail) 600 800 1000 1000 500 500

ITFMP Forest Concession Model _______________________________________________________________________________________________________
___________________________________________________________________ Indonesia-UK Tropical Forest Management Programme
48
BACKGROUND DATA (SHEET 6 OF 7) Prices, IHH and yields Region Sumatera and
Sulawesi Kalimantan
Barat Kalimantan
Tengah Kalimantan
Timur Maluku Irian
Jaya Proportion of each species
Meranti 50 60 70 70 70 30 Rimba C 40 20 15 15 15 65 Kayu Indah 20 20 15 15 15 5 Price Meranti 120 100 100 100 100 90 Rimba C 100 80 80 80 80 80 Kayu Indah 120 80 80 80 80 80 IHH Meranti 11 11 11 11 11 10 Rimba C 7 7 7 7 7 4 Kayu Indah 14 14 14 14 14 14

ITFMP Forest Concession Model ______________________________________________________________
___________________________________________________________________ Indonesia-UK Tropical Forest Management Programme
49
BACKGROUND DATA (SHEET 7 OF 7) Other information For Irian Jaya and Maluku, add US$ 516,000 as other operating costs in year 2006 in Financial Table II, to reflect the cost of preparing another 20 year plan (RKPH) in this year, plus EIA (AMDAL), aerial photographs, and boundary marking. Add the following travelling distances into Calculation Table V:
Sumatera: Road = 60 km; River = 100 km Other areas: Road = 100 km; River = 200 km