The Evolution of Retirement Wealth
36
Finance and Economics Discussion Series Divisions of Research & Statistics and Monetary Affairs Federal Reserve Board, Washington, D.C. The Evolution of Retirement Wealth Sebastian Devlin-Foltz, Alice M. Henriques, and John Sabelhaus 2015-009 Please cite this paper as: Devlin-Foltz, Sebastian, Alice M. Henriques, and John Sabelhaus (2015). “The Evolution of Retirement Wealth,” Finance and Economics Discussion Series 2015-009. Washington: Board of Governors of the Federal Reserve System, http://dx.doi.org/10.17016/FEDS.2015.009. NOTE: Staff working papers in the Finance and Economics Discussion Series (FEDS) are preliminary materials circulated to stimulate discussion and critical comment. The analysis and conclusions set forth are those of the authors and do not indicate concurrence by other members of the research staff or the Board of Governors. References in publications to the Finance and Economics Discussion Series (other than acknowledgement) should be cleared with the author(s) to protect the tentative character of these papers.
Transcript of The Evolution of Retirement Wealth
Finance and Economics Discussion SeriesDivisions of Research & Statistics and Monetary Affairs
Federal Reserve Board, Washington, D.C.
The Evolution of Retirement Wealth
Sebastian Devlin-Foltz, Alice M. Henriques, and John Sabelhaus
2015-009
Please cite this paper as:Devlin-Foltz, Sebastian, Alice M. Henriques, and John Sabelhaus (2015). “TheEvolution of Retirement Wealth,” Finance and Economics Discussion Series2015-009. Washington: Board of Governors of the Federal Reserve System,http://dx.doi.org/10.17016/FEDS.2015.009.
NOTE: Staff working papers in the Finance and Economics Discussion Series (FEDS) are preliminarymaterials circulated to stimulate discussion and critical comment. The analysis and conclusions set forthare those of the authors and do not indicate concurrence by other members of the research staff or theBoard of Governors. References in publications to the Finance and Economics Discussion Series (other thanacknowledgement) should be cleared with the author(s) to protect the tentative character of these papers.

The Evolution of
Retirement Wealth
Sebastian Devlin-Foltz1
Alice Henriques1,2
John Sabelhaus1
February 2015
Abstract
Is the current mix of tax preferences for employer-sponsored pensions and individual retirement
saving in the U.S. delivering the best possible retirement-preparedness across and within
generations? Using data from the triennial Survey of Consumer Finances for 1989 through 2013,
cohort-based analysis of life-cycle trajectories shows that (1) overall retirement plan participation
was relatively stable or even rising through 2007, though participation fell noticeably in the wake
of the Great Recession and has remained lower, (2) participation is strongly correlated with
income, and the shift in the type of pension coverage occurred within—not just across—income
groups, (3) relative to previous cohorts and a counterfactual lifecycle benchmark, the recent
decline in retirement plan participation and defined contribution (DC) retirement account balance-
to-income ratios is concentrated among younger families and lower-income families.
JEL Codes: D14, H55, J32
1Board of Governors of the Federal Reserve System, Washington, DC. 2Corresponding author,
email: [email protected]. The analysis and conclusions set forth are those of the authors
and do not indicate concurrence by other members of the research staff or the Board of Governors.
We thank Karen Smith Conway, other participants at the National Tax Association annual
meetings in November 2014, and our colleagues at the Federal Reserve Board for many helpful
comments.

1
1. Introduction
Employer-sponsored retirement plans and Social Security have both evolved substantially
in the U.S. over the past several decades, and it is important to revisit the question of whether the
current combination of tax preferences for retirement saving and Social Security tax and benefit
rules are delivering on the overarching goal of adequate retirement preparedness. A key first
step in such an investigation is to measure retirement wealth—including the claims to future
retirement income streams—using a framework that shows how retirement resources are
evolving across and within generations as they progress through the lifecycle.1 The triennial
Survey of Consumer Finances (SCF) is well-suited for this measurement exercise, because the
survey covers a long time period, includes households headed by all age groups, and combines
careful measurement of work-related pensions, personal retirement accounts, and earnings
histories with other relevant demographic, income, and balance sheet information.2
Aggregate data on retirement wealth provides (at best) a mixed view about trends in
retirement preparedness (Figure 1). The ratio of aggregate (non-Social Security) retirement
claims to aggregate personal income has nearly doubled since 1989, but most of that growth
occurred between 1989 and 1999. Since 2000, financial market volatility has led directly to
large swings in the overall retirement wealth to personal income ratio, and there is no net upward
movement even as the population continues to rapidly age and income growth (affecting the
1 There is substantial disagreement in the U.S. about the state of retirement preparedness across and within
generations; Poterba (2014) provides an excellent overview of the literature. Most notably, Scholz et al. (2006)
argue that most households have retirement resources that are largely consistent with the predictions of a lifecycle
planning model, while Munnell et al. (2012) and Wolff (2014) argue that retirement preparedness is deteriorating for
many. Bernheim et al. (2001) argue that standard lifecycle determinants of retirement preparedness do not explain
substantial differences between households nearing retirement. 2 The synthetic-cohort approach applied to the SCF in this paper is methodologically similar to recent work by
Collins et al. (2013), looking at typical U.S. balance sheets across birth cohorts. SCF cross-sections have also been
used to analyze lifecycle saving by Sabelhaus and Pence (1999) and Gale and Pence (2006).

2
denominator) is slowing. The share of retirement assets accounted for by defined benefit (DB)
plans has fallen, as defined contribution (DC) coverage expanded, especially among working-age
households. Even if the overall trend was clear, however, the aggregate wealth to income ratio
does not tell us anything about the distribution of retirement wealth across and within cohorts,
which is the key to thinking about how retirement policy is changing over time.
The starting point for analyzing the evolution of retirement wealth across and within
generations is measuring participation in employment-related pension plans and individual
retirement accounts (IRAs). SCF data for 1989 through 2013 shows that retirement plan
participation was stable or even increasing through 2007, especially when viewed from a
lifecycle perspective. Younger generations were achieving systematically higher rates of
participation than their predecessors, at any given age. There was a (well-documented) shift in
the type of retirement plan from DB to DC, especially in the private sector, but there was no
substantial net decrease in overall participation during this period. That upward trend ended with
the onset of the Great Recession, and the 2010 SCF showed a decrease in retirement plan
participation that has, as of the 2013 survey, yet to be reversed. The declines after 2007 in
participation trajectories, relative to previous cohorts, are widespread, but most pronounced for
the families with the youngest household heads.
The SCF also makes it possible to break down these cohort-level trends and look within
birth cohorts to investigate how retirement plan participation is evolving across income groups.
It is not surprising, given labor market fundamentals and the structure of Social Security, that
participation in employment-related retirement plans is always and everywhere positively
correlated with income. The lifecycle peak for participation in (any form of past, current, or
future) retirement plans is now just over 60 percent for the cohort approaching retirement in the

3
bottom half of the income distribution, but over 90 percent for families in the 50th through 95th
percentiles, and near 100 percent for families in the top 5 percent of the income distribution.
The conditional distributions of DB versus DC coverage within income groups provide an
important corollary to the observation about overall retirement plan coverage across income
groups, and the shift from DB to DC. Even though overall retirement plan participation is
greater for the highest income groups in every year, the mix of coverage by type in any given
year does not vary substantially by income. Higher income families are more likely to have a
combination of DB and DC coverage, but the overall rate for DB inclusion (conditional on any
coverage) is roughly the same. Thus, the data confirms that all income groups saw the same
dramatic compositional shift from DB to DC during the past several decades.
The lifecycle perspective applied to the SCF by income group shows that the historical
differences in retirement plan coverage by income have widened in recent years, and especially
since the Great Recession. The relative declines in participation and in the ratio of retirement
wealth to income after 2007 are widespread, but most pronounced for younger cohorts, and
within any given cohort, most pronounced for lower-income families. This divergence in
retirement wealth accumulation trajectories across income groups is consistent with a dramatic
slowdown in lifecycle income growth, and indicates that systematic retirement saving was
sacrificed by many families experiencing diminished economic resources, in the wake of the
Great Recession.

4
2. Measuring Retirement Plan Participation and Retirement Wealth Using the SCF
The data used here to study retirement plan participation and wealth accumulation is the
series of cross-sections from the triennial Survey of Consumer Finances (SCF) conducted
between 1989 and 2013. The SCF is well-suited for analyzing retirement savings from a life-
cycle perspective, because the survey covers a long time period, includes households headed by
all age groups, and combines careful measurement of work-related pensions, personal retirement
accounts, and earnings histories with other relevant demographic, income, and balance sheet
information. 3 Tracking of retirement resources in the SCF is intended to be comprehensive,
including all forms of past, current, and future claims in both defined benefit (DB) and defined
contribution (DC) pensions, as well as individual retirement accounts (IRAs).4
The concept of retirement plan “participation” used here is based on the observation of
any evidence of claim to tax-advantaged retirement resources through a current account balance
or current income stream, or as an expected income stream to commence in some future year.
The financial asset section of the SCF questionnaire captures IRAs, the employment section of
the survey captures information about DB and DC pensions associated with current employment,
and the future pensions section captures claims to future DB pension benefits or DC accounts
associated with past jobs and not rolled over (as most are) to an IRA. The survey has a number of
built-in checks across the sections to make sure the measurement of claims to retirement
resources are complete, and without double-counting. Benchmarking to available evidence
3 For an overview of the SCF and latest results see Bricker, et al. (2014). 4 The focus of this paper is on overall retirement plan participation and the accumulation of DC plan balances, but
other questions in the SCF about expected DB benefits and lifecycle earnings histories can be used to estimate the
other components of the retirement balance sheet, including Social Security. Examples of papers that develop more
comprehensive estimates using the SCF include Poterba (2014) and Wolff (2014). Estimating and valuing DB and
Social Security income streams across and within generations is the next step in this research agenda.

5
suggests the SCF does a very good job identifying participation in tax-advantaged retirement
accounts.5
Based on this comprehensive measure, overall retirement plan participation has not
evolved much in the past quarter century, even though the retirement landscape has gone through
substantial changes. The fraction of all families with any evidence of retirement plan
participation has hovered between 60 and 70 percent (Figure 2A) while the fraction of working-
age families (ages 25 to 59) with evidence of coverage has hovered between 70 and 80 percent
(Figure 2B). Overall coverage trends for all and working-age families indicate recent declines in
retirement plan participation.
The more noteworthy change in retirement plan participation is in the type of pension
coverage. The shift in employer-sponsored plans from DB to DC was well under way before the
1989 SCF was conducted, and very few families (and even fewer working-age families) had only
DB coverage even in that base year. It is important to remember that a family with a DB plan in
their current job and any form of DC balance, including the (generally small) IRAs opened
during the IRA heyday of the early 1980s, or a rolled-over distribution from a previous job DB
plan, will show up as having both DB and DC coverage in these tabulations.
More noteworthy than the levels and trend in only DB is the shift towards only DC. The
top part of the stacked bars shows that the fraction of all families with only DC coverage has
nearly doubled since 1989. The trend for all families includes retirees who are receiving DB
pension benefits from a prior job. Thus, the trend for working-age families is a clearer indicator
of the trajectory for retirement resources going forward. About 50 percent of working-age
5 See Argento, et al. (2014) for a comparison of SCF retirement plan participation with information from tax returns.
Evidence of participation using tax returns is based on the same principles, because form W2 indicates current job
coverage, and forms 5498 and 1099-R indicate account balances or flows for accounts not linked to the current job.

6
families had some form of DB coverage (current or past job) in 1989, and that fell to about 30
percent by 2013.
The increasing importance of DC plans for younger cohorts motivates the initial focus
here on lifecycle trajectories for DC accounts and IRA balances, the components of retirement
wealth directly observed in the SCF. Sample representativeness and respondent reporting bias
are sources of concern when using household surveys to measure outcomes, and it is useful to
benchmark the survey values before looking at trends in retirement wealth from a distributional
perspective. Retirement resources (other than Social Security) are concentrated at the top of the
income and wealth distribution. The SCF sampling strategy is unique among U.S. household
surveys in terms of capturing wealthy families, and thus provides a more comprehensive view of
the retirement wealth distribution.6
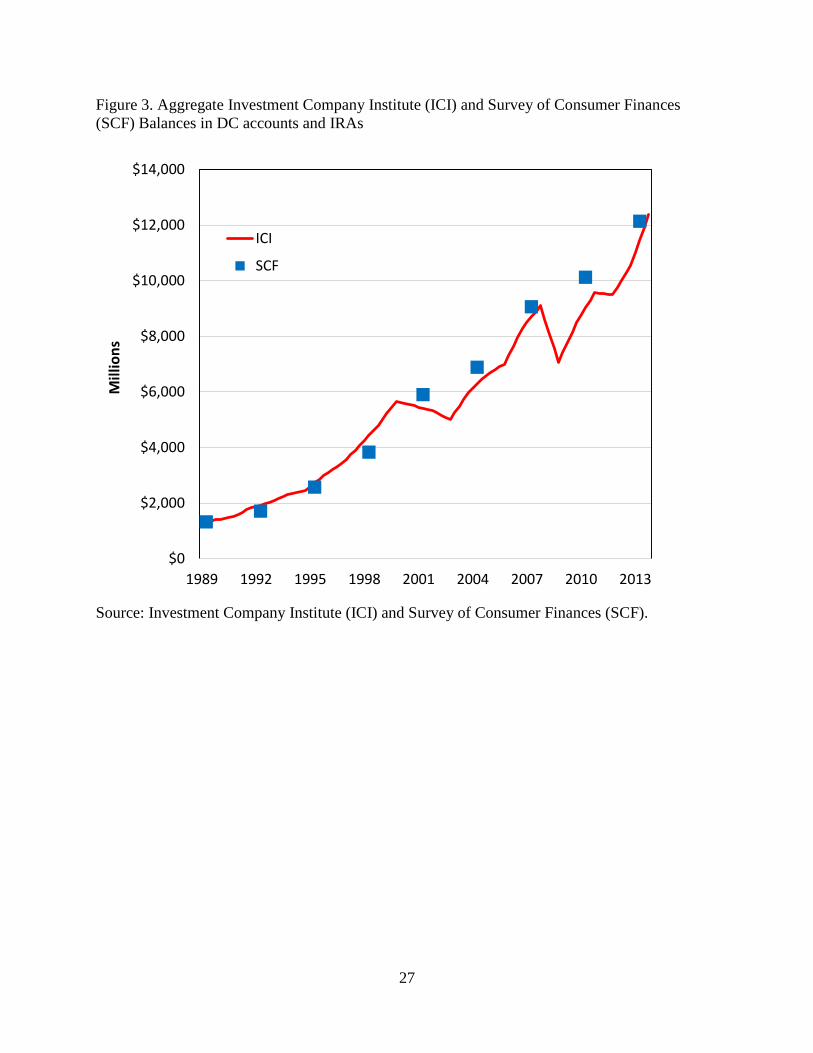
Direct comparison of SCF with published aggregates confirms that the survey has indeed
done a good job capturing the entirety of DC balances over the sample period (Figure 3). There
is some evidence that respondent-reported values for retirement account balances diverge from
the estimates based on financial institution and government sources following dramatic swings in
asset values, such as in 2001 and 2010. Those deviations seem temporary, however, perhaps due
to respondent lags in updating account balances. Even those deviations are never more than a
few percentage points, and overall aggregate DC holdings are well-captured by the SCF for
1989-2013.
6 The appendix to Bricker et al. (2014) provides an overview of the SCF sampling strategy, including over-sampling
and the weighting adjustments to correct for differential non-response of wealthy families.

7
3. Retirement Plan Participation across and within Birth Cohorts
Overall trends in tax-preferred retirement plan participation are a good starting point for
analyzing policy towards retirement tax-preferences, and the SCF makes it possible to go further
and look across and within birth cohorts to investigate how the evolving retirement landscape is
affecting different groups in the population. The usual approach in this sort of distributional
analysis is to measure retirement plan participation and account balances across age groups and
time, but a lifecycle framework provides a more dynamic view of changes across and within
generations. This lifecycle view shows dramatic swings in retirement plan participation across
cohorts during the 1989-2013 period and dramatic differences in participation within cohorts (by
income) in every time period.
The SCF lacks a long panel component that would make it possible to directly observe
changes in retirement plan participation and account balances for a sample of families, but the
synthetic-cohort approach used here is well-suited for studying typical outcomes across different
types of families at various points in the lifecycle.7 Synthetic-cohort analysis makes it possible to
study outcomes across the population using different cross-sections at different points in time,
such as in the SCF. The identifying assumption is that any given cohort is well-represented in
each of the cross-sections, and the summary statistics observed from one cross-section to another
provide useful information about the changes for that group over time. The SCF is an excellent
data source for the analysis here across broad birth cohorts and income groups, as the sample
7 The Health and Retirement Study (HRS) is a good resource for studying retirement wealth trajectories for U.S.
families approaching or in retirement, and the HRS has a panel structure. See, in particular, Gustman et al. (2010,
2011, 2014) and Poterba et al. (2007, 2012, 2013). Unfortunately, the HRS does not include the younger families
and the very wealthy families who are included in the SCF, and those missing groups are the focus of much of the
analysis in this paper.

8
sizes for generating the summary retirement plan participation and account balance measures are
sufficiently large to infer changes over time.8
The SCF cross-sections used here span the period 1989 to 2013, and thus any given birth
cohort can be tracked for (at most) that twenty-four year period. Looking across ten-year birth
cohorts born between 1920 and 1990, and using all of the SCF surveys, one sees a very
predictable lifecycle pattern in retirement plan participation by age (Figure 4). The overall
pattern is hump-shaped, as retirement plan participation (generally) rises steeply for families as
they move from their twenties to their fifties, before stabilizing, and declining (though perhaps
only slightly) for families that have crossed into retirement.9
The lifecycle trajectories within birth cohorts tell the more interesting story about
evolving retirement coverage, however. The height difference (by age) for any two overlapping
cohort lines indicates the difference in participation (at that age) between the two cohorts. Figure
4 thus shows two clearly different stories about trends in retirement plan participation over the
1989-2013 period. In the early part of the period, younger cohorts were achieving generally
higher rates of plan participation at younger ages. After 2007, however, that trend reversed, and
the drop in participation has been such that younger cohorts are failing to achieve the levels
reached by predecessor cohorts at the same ages.
8 This is not meant to imply that the synthetic cohort approach used here is necessarily inferior to panel data for this
type of long-run distributional analysis across groups and time. Micro panels suffer from non-random attrition bias
on top of any selection bias associated with participation in a cross-section survey, and reporting/measurement
variability in panel surveys is such that analyzing the distribution of individual changes in retirement wealth can be
highly problematic. Indeed, most analysis of data sets such as the HRS involve comparing summary statistics for a
given cohort at different points in time, just like those produced here. The more salient difference is in how families
are grouped—for example, by current versus permanent income—when estimating those summary statistics at each
point in time. 9 The tendency of retirees to not draw down tax-preferred accounts has been analyzed extensively by Love et al.
(2009) and Poterba et al. (2013). Whether or not these trajectories are consistent with optimizing behavior depends
importantly on one’s underlying model, and even the concept of “consumption” versus “spending” one has in mind.
See, for example, Aguiar and Hurst (2005) and Hurd and Rohwedder (2013).

9
The 1961-1970 birth cohort provides the clearest example of this sharp break in trend.
When that cohort was first observed in their early twenties in the 1989 survey, just under 40
percent were participating in retirement plans. A decade later the 1961-1970 cohort was observed
in their early thirties, and some 70 percent of families had coverage, nearly 10 percentage points
above the participation rate for the previous cohort (born between 1951 and 1960) when they
were in their early thirties (as observed around 1990). However, not only did the 1961-70 cohort
seem to peak in terms of coverage in their early thirties, their participation has now fallen, such
that the last time they were observed (approaching age 50, in 2013) their participation rate was
nearly 10 percentage points below the 1951-1960 birth cohort (as observed in the early 2000s)
and even the 1941-1950 birth cohort (as observed in the early 1990s). Although the 1961-1970
cohort is the most extreme example, every cohort shows the pattern of first exceeding, and then
falling below, earlier cohorts at the same age, in terms of overall retirement plan participation.
This dramatic takeaway from the lifecycle perspective on cohort-level retirement plan
participation provides a sharp contrast with the much more nuanced view from the aggregate
charts (Figures 2A and 2B). The key to reconciling the two is demographic trends. As the Baby
Boom approached middle age, if lifecycle trajectories had not changed, the overall retirement
plan participation would have risen substantially because the Baby Boom has a greater
population weight and is at their lifecycle peak in retirement plan participation. The only reason
aggregate participation stabilized and then fell slightly was that within-cohort changes dominated
the demographic effect.
Acknowledging that participation in retirement plans is down substantially from a
lifecycle perspective, especially for younger cohorts, is an important starting point for thinking
about the evolution of retirement outcomes, but the more pressing question is who, within those

10
birth cohorts, is experiencing those changes? The obvious dimension on which to cut the cohort
data is income, as there are well-known differences in retirement plan offerings and participation
across income groups. The SCF makes it possible to look within birth cohorts across income
groups using the same lifecycle perspective, to study both levels and changes in participation
over time.
One potential problem in synthetic cohort analysis is the possibility that families in a
given group in a given year are not the same families (probabilistically) as the families in the
same group in a different year. This is obviously not a problem with something mechanical like
birth cohort, but sorting families on income is problematic, especially if there large transitory
shocks to incomes in a given year. When that happens, for example, the (usually) higher-
families who experience large negative shocks will be grouped with the (usually) lower-income
families, and their accumulated retirement wealth will be averaged in with those (usually) lower-
income families.
Fortunately, since 1995 the SCF has included a set of income questions that make it
possible to eliminate most of this sorting bias in the synthetic-cohort analysis. The income
measure used in this paper is derived from the survey questions about the gap between actual and
“usual” income in the SCF. Towards the end of the SCF interview, after detailed income
components have been summed to arrive at a total, respondents are asked if that total income is
higher than, lower than, or about the same as their income in a “usual” year. Most respondents
say their reported total income is in fact about normal—the median gap between actual and usual
income is zero in every survey year. However, sizable minorities of respondents indicate that
their income is either unusually high or unusually low, and those fractions vary predictably and
systematically with business cycle conditions. Those sizable minorities who say they

11
experienced a shock are then asked what their income would be in a “usual” year, and that (along
with actual income for the majority who say their income is equal to the usual value) is the
classifier used here.10
Differences in lifecycle patterns for retirement plan participation across usual income
groups are not surprising, especially given what we know about compensation patterns, labor
market dynamics, and Social Security replacement rates (Figure 5).11 Retirement plan
participation is always and everywhere strongly and positively associated with usual income, and
there are very different lifecycle trajectories and peaks across the three usual income groups
represented here: the bottom 50 percent of families, the “next” 45 percent of families (percentiles
50 through 95), and the top 5 percent of families.12 Indeed, it really does not even make sense to
think of retirement plan participation among the top 5 percent as a “trajectory” per se, because
participation is nearly universal for that income group at every point in the lifecycle.
The possible (and perhaps competing) explanations for these differences in retirement
plan participation rates by income are well known. Families in the bottom 50 perfect of the usual
income distribution experience not just lower overall compensation, of which retirement plan
offerings are a component, but also much more employment volatility and job change, which
also affect retirement plan offerings and participation. On the positive side, those lower-income
10 Box 2 in Bricker et al. (2014) show how the usual income classifier affects conclusions about changes in family
finances over time. Indeed, the regular Federal Reserve Bulletin publication on SCF findings now uses only usual
income to sort families for the standard tables, because recent widespread income shocks have underscored the
problems with grouping families by actual income when comparing outcomes over time. 11 Although the SCF has maintained a consistent methodological design since the 1989 survey, the question on
“usual” income was not added until the 1995 survey, and thus the within-cohort results presented here are limited to
the period 1995-2013. Relative to Figure 4, which plotted participation across birth cohorts for 1989-2013, the
sorting by usual income eliminates the first two points (representing six years) for the cohorts who could have been
observed prior to the 1995 survey. 12 Families are sorted by usual income within their respective birth cohorts. The specific usual income groups are
motivated in part by analysis of income inequality that suggests a clear trend separation near the top few percentiles
of families by income, with the top five percent chosen specifically to provide sufficient sample size for the
synthetic cohort tabulations. The oversampling of the SCF at the very top plays an important role here, because that
top 5 percent is represented by a disproportionate number of families.

12
families also receive a much higher replacement rate from Social Security, such that their need to
save is greatly diminished relative to higher-income families, for whom Social Security is much
less adequate in terms of replacing earned income.13
Although explaining the levels of participation by income and age is beyond the scope of
the current paper, the lifecycle trajectories do make it possible to address the distributional
question about changes in participation raised above. The largest decreases in retirement plan
participation, relative to the lifecycle trajectories of previous cohorts in the same income groups,
have occurred for pre-retirement families in the bottom half by usual income, and to some extent
for the younger cohorts in the next 45 percent. The only groups who have not seen large changes
in retirement plan coverage are older families across all income groups, and all age groups at the
top of the usual income distribution. Again, the 1961-1970 cohort provides a useful benchmark:
families in the bottom half by usual income within that cohort have reached only a 50 percent
participation rate as they approach age 50, in 2013, which is well below the lifecycle peak
achieved by lower-income families in the three previous cohorts.
There is an important corollary that ties together the shift in type of pension coverage
(Figures 2A and 2B) with changes in the distribution of retirement plan participation by usual
income and cohort (Figure 5). 14 Overall participation is positively correlated with income, but
the type of coverage, conditional on any participation, is roughly proportional across income
groups at every point in time (Table 1).
13 This assertion is based on the highly progressive formula for determining Social Security benefits (specifically,
Primary Insurance Amount, or PIA) relative to lifetime earnings (specifically, Average Indexed Monthly Earnings,
or AIME). Mitchell and Phillips (2006) discuss conceptual issues involved with measuring Social Security
replacement rates. 14 Butrica et al. (2009) and Wolff (2014) also explore the distributional implications of the decline in DB coverage
for future retirement outcomes.

13
Among working age families (headed by individuals 25 to 59 years old) the overall
retirement plan participation rates in 1995 were 54 percent for the bottom half by usual income,
and 96 percent for the top 5 percent of families by usual income. By 2013 the overall
participation rates had fallen to 44 percent for the bottom half, and 94 percent for the top 5.
However, conditional on having coverage, the types of coverage were about the same across
income groups. In 1995, 53 percent of those with coverage in the bottom half by usual income
had a DB or mixed DB+DC, while 48 percent of those in the top 5 had such coverage. By 2013,
the conditional DB+DC coverage rates had fallen to 38 percent for the bottom half, and 25
percent in the top 5 percent.
In an important sense, the shift away from DB was most prominent at the top, because
they experienced the largest overall and conditional declines in DB coverage during this period.
However, another way to look at the same phenomenon is that the replacement of DC for DB
coverage was much more effective at the top. When DB plans disappeared, higher-income
families had more opportunities and/or were more likely to voluntarily participate in the
emerging DC system.

14
4. DC Retirement Account Wealth to Income Ratios
The lifecycle perspective on participation in tax-preferred retirement saving plans shows
a somewhat dramatic recent decline for many younger and lower-income families, but
participation is only the first margin of behavior. It is possible, for example, that the decrease in
participation was concentrated among those for whom actual accumulations are relatively small,
at least relative to their incomes or other resources. The overall assessment of evolving
retirement wealth requires comprehensive measures of accumulated balances and claims to
future income streams, including DB plans and Social Security.15 In this section we take a first
step towards that ultimate goal and focus on the most rapidly growing form of retirement wealth,
DC balances, which are directly observed in the SCF.
There are a few different ways to (statistically) look across and within cohort groups to
evaluate the importance of accumulated retirement wealth at any point in time (Table 2). The
unconditional mean of retirement balances captures both the participation and accumulation
dimensions in one statistic, the conditional median gives an indication of importance of
accumulated balances for the typical family in the group with any retirement balances, and the
conditional mean further shows how skewed balances are (relative to the conditional median)
among families in the group who have balances. Although the three measures diverge somewhat
in terms of levels, the patterns across and within birth cohorts are generally similar.
The 1961-1970 birth cohort serves as a good example, once again. As of 2013, this
group was on average 48 years old, and their retirement plan participation was around 70 percent
15 Wolff (2014) and Poterba (2014) have both taken important steps towards developing more comprehensive
retirement resources measures using the SCF, which is the next step in our research project as well. Measuring
retirement adequacy comprehensively also requires assumptions about retirement ages, and increasing lifespans
suggests that measuring retirement wealth using fixed retirement and/or Social Security claim ages across cohorts
may be misguided. For a discussion of trends and determinants of claiming and retirement ages, see Henriques
(2012) and Behaghel and Blau (2012).

15
(Figure 4) but there are big differences in participation across the three usual income groups
(Figure 5). The unconditional mean DC retirement balances for this group in 2013 were $15,330
for the bottom half by usual income, $130,372 for the next 45 percent, and $552,170 for the top 5
percent (Table 1). The within-cohort values for conditional medians and means are also highly
skewed, though slightly less so, because of the big differences in retirement plan participation by
income noted above. Although all three statistics are useful in their own right for answering
specific questions, the focus here will be on unconditional means, which capture both
participation and accumulation behavior.
The across and within-cohort differences in unconditional mean DC balances at a point in
time do not provide direct evidence about adequacy, though normalizing by income is an
important step in that direction. The static measures also do not indicate anything about changes
over time, which (as with participation) is best conveyed using the lifecycle framework that
shows within and across cohort movements. Thus, the analysis below focuses on the ratio of
(unconditional) average DC retirement assets to average usual income across and within cohorts,
1995 through 2013 (Figure 6).
The differences in retirement wealth to income ratios by usual income (Figure 6) are
much less stark than the differences in DC balances (Table 2) or retirement account participation
(Figure 5). Average DC balances for cohorts around age 60 in 2007 (that is, the 1941-1950
cohort) were roughly 100 percent of average usual income for the bottom half of the usual
income distribution, and about 150 percent of average usual income for the next 45 percent and
top 5 percent.16 Thus, dramatic differences in average usual income—especially for the top 5
16 These similarities across usual income groups helps to explain why Clark and Sabelhaus (2009) found that
relatively modest changes in retirement ages, extending working lives by just a few months for many people, would
be needed to completely offset the drop in asset values associated with the Great Recession. Similarly, Goda et al.
(2011) found that although stock market fluctuations do affect expected retirement ages for workers close to

16
percent relative to the other two income groups—largely offset the dramatic differences in
average DC balances shown in Table 2, and the income groups are much more similar on this
relative basis.
Although peak DC balances relative to usual income did not diverge greatly by usual
income within the 1941-1950 cohort when they were at the beginning of their retirement years,
there are clear differences in lifecycle trajectories for DC balances across all cohorts, both before
and after retirement. There are also indications that within-cohort accumulation patterns are
changing dramatically, especially for younger cohorts, as the lower-income groups are falling
below the DC wealth to income ratios achieved by their predecessors at the same age in earlier
periods.
Retirement wealth accumulation is much slower early in the lifecycle for lower-income
families than it is for middle- and higher-income families. To some extent, this reflects the
participation patterns described earlier, as fewer lower-income families participate in tax-
preferred retirement saving at all ages. The differences in accumulated wealth relative to income
are starker, however, as lower-income families approach (on average) balances equal to about
one year’s usual income around age fifty, while the next 45 and top 5 hit that benchmark in their
mid-thirties. The trajectories after retirement age also seem to diverge, and again in a way that is
consistent with changes in retirement plan participation at older ages. The suggestion is, of
course, that lower-income families are more likely than other families to spend down their DC
accounts after retirement. Some of the change in trajectory after retirement is due to the
denominator (usual income) of course, as the different usual income groups exhibit different
(usual) income trajectories after retirement as well.
retirement, the increase in respondent-reported expected time until retirement that occurred during the Great
Recession cannot be explained by losses on financial assets alone.

17
As with participation rates, a key message that emerges from the within-cohort DC
balance to income trajectories involves for whom retirement balances are failing to grow with
income. In a world with declining DB coverage and less generous Social Security (at any given
claim age) for all income groups, one would suspect the DC balance to income trajectories would
lie always and everywhere above predecessor cohorts (if expected retirement ages are
unchanged). The fact that middle-age families generally seem to be just keeping up with the
cohorts ahead of them is therefore somewhat surprising, and suggestive that retirement
accumulation may indeed (in a relative sense) be slipping for many (again, holding expected
retirement ages constant).
The observation that younger cohorts in the bottom half of the distribution and next 45
percent are not even keeping up with the cohorts ahead of them as they progress through the
lifecycle is even more worrisome. In addition, middle-age families in the bottom half of the
income distribution (notably the 1951-1960 cohort) do not seem to be going through the
substantial run up in wealth to income ratios as they get close to retirement, as was the case for
lower-income families in previous cohorts. This takeaway on recent divergence in the
trajectories of DC balance to income ratios closely mirrors the findings on participation
described above.

18
5. Economic Conditions and Retirement Wealth Accumulation
To what extent is tax policy towards retirement saving affecting trends in plan
participation and wealth accumulation across birth cohorts and income groups? More
importantly, are there changes in policy that might improve retirement preparedness for the
younger families and lower-income families who are (apparently) falling behind their
predecessors? Answering these sorts of questions necessarily involves considering the effects of
overall economic conditions on retirement wealth accumulation, because the U.S. economy
experienced a dramatic shock during the Great Recession, and seems to be on a very different
growth trajectory in the on-going recovery.
One factor driving DC balance to income ratios is asset prices, particularly stock prices.
Holding portfolio composition constant, volatility in stock prices has a mechanical impact on DC
balance to income ratios. That is clear in the aggregate time series data (Figure 1) and also
affects the values by cohort and income (Figure 6) though the three year gaps between SCF
observations makes it difficult to discern trend from cycle. Still, and especially if SCF
respondents have any lag in their perceptions about stock prices, values for DC balances in the
past two surveys (2010 and 2013) reflect (relative to past trends) relatively poor stock market
performance. Although we do not explore this effect further in the current paper, it is worth
noting that it could cut both ways, because the belief that those stock market losses will never be
recovered could lead to increased saving, in order to achieve the original DC balance to income
ratios.
The other mechanical determinant of the DC balance to income ratios is income itself,
and the Great Recession and slow-growth aftermath have had a significant impact on usual
income growth, especially when viewed from the lifecycle perspective (Figure 7). The clear

19
takeaway is that the shocks to income levels and growth rates are most pronounced for the young
and for lower- to middle-income families, though to some extent, almost every group has seen a
reversal of fortunes since 2007. The fact that the cohort income lines fall below the predecessor
cohort values in 2010 and 2013 shows that the younger families are failing to achieve even the
same level of income as their predecessors, after having seen income levels surpassing those
earlier cohorts prior to 2007.
Widespread slowing income growth has two distinct and competing effects on retirement
wealth to income ratios. First, the denominator is mechanically reduced, so any given level of net
saving and rate of return will yield a higher ratio than if income had grown. Second, the
slowdown in income growth suggests that current resources are more constrained, and one would
expect that retirement saving itself would fall. Indeed, this reaction may in fact be rational: if a
lifecycle consumer believes that slow income growth is the new normal, and they are balancing
consumption between working and retired periods, their target saving rate might fall. Separating
these two effects is a key step in understanding how retirement tax policy is affecting retirement
wealth trajectories.
Although separating the effects of economic conditions and retirement tax policy requires
a more comprehensive modeling framework, one simple exercise confirms that the conclusions
above about the distribution of changes in retirement wealth. The exercise involves creating a
lifecycle counterfactual that answers the question, “What would the lifecycle charts have looked
like if past (age- and income-specific) growth rates remained in force after 2007?” SCF data for
earlier cohorts at a given age for the 1995 through 2007 period are used to make projections for
cohorts in 2010 and 2013.

20
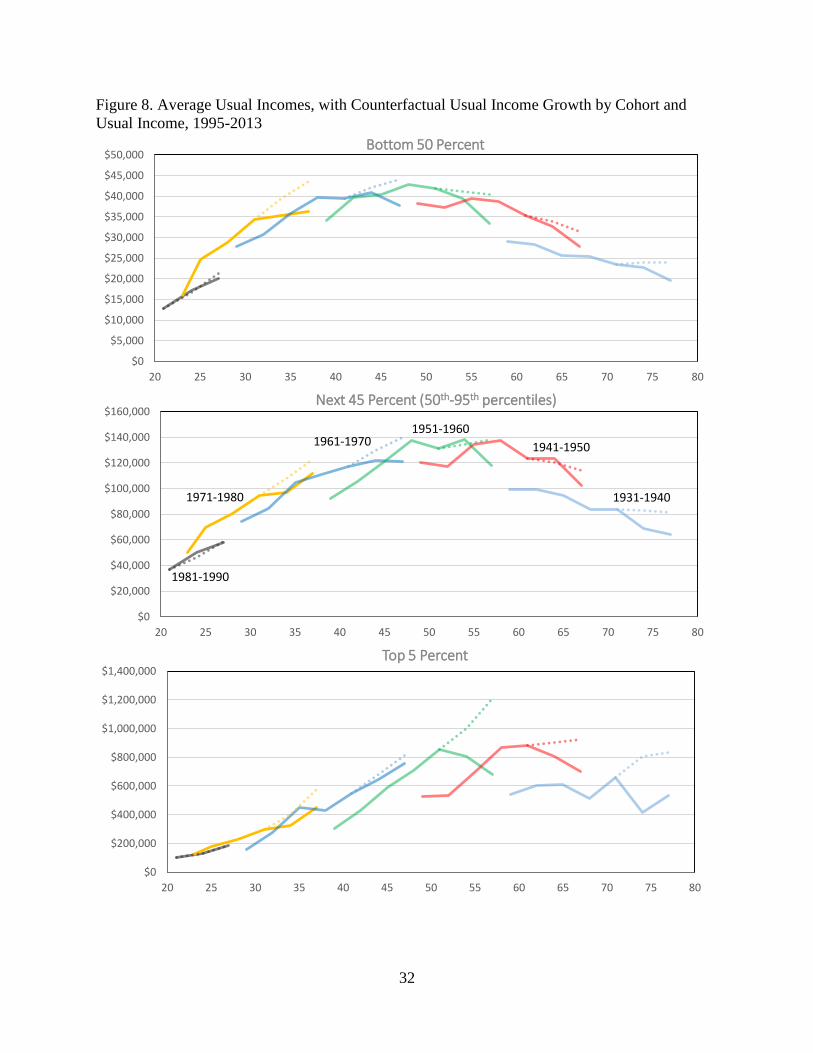
The results of the counterfactual applied to income are in some ways not surprising,
given the depth of the Great Recession and subsequent slow growth (Figure 8). In general, the
counterfactual income levels (represented by the dotted lines) are well above the actual income
levels (reproduced from Figure 7). One can interpret the gap between the dotted and solid lines
as “lifecycle shortfall” in income growth, the changes relative to previous cohorts at the same
age.
What may be surprising is that the counterfactual view suggests that the slowdown in
income growth was much more widespread than indicated by the basic lifecycle charts. That is,
the counterfactual gaps are generally large for all income and age groups, not just the young and
lower-income groups. This is driven by the relative slowdown in average income growth at the
top of the income distribution. Incomes were growing more rapidly at the top prior to the
recession, and thus the relative drop is larger for many cohorts within that highest-income group.
The same counterfactual exercise can be applied to the DC balance to income ratios
(Figure 9). Again, the growth rates for prior age/income groups are applied to the 2007 base to
generate 2010 and 2013 counterfactuals, and the gap between actual and counterfactual
outcomes are very informative. The fact that income growth slowed, mechanically lowering the
denominator, is the dominant force for most cohort and income groups, and the actual and
counterfactual ratios do not diverge sharply. One very notable exception to this pattern is the
lowest-income group within the 1951-1960 birth cohort, the group moving through their mid-late
fifties in the past two surveys. Data from the same income group at previous points in time
(earlier cohorts at the same age) saw large increases in DC balances relative to income. This
group, even though their incomes fell substantially during the 2007 to 2013 period, saw their DC
balance to income ratio fall in line, meaning the numerator was actually decreasing.

21
6. Conclusions
Changes in DC balances over time depend on contributions, rates of return, and
withdrawals, and a comprehensive analysis of retirement saving behavior requires separating the
three, as well as bringing in other forms of retirement preparedness (DB plans and Social
Security) and other balance sheet components. However, the results here suggest that recent
disappointing macroeconomic performance has revealed important concerns about the ability of
the existing system of tax preferences for retirement saving, as embodied in the mostly voluntary
DC system, to provide widespread retirement security.
The results here do not necessarily imply that a voluntary DC system is doomed to fail,
and in no way suggests that the mostly DB system in place prior to the 1980s was superior. DB
pensions have their own set of problems, which also have a distributional component. Career-
long attachment to a particular job (or even industry) has become increasingly rare, especially
among lower-income and younger workers. The value of a DB plan is very much tied to
longevity within the plan.
The results here do suggest that continuing consideration of DC plan design is warranted,
in terms of rules governing employer offerings, inducements for participation and for setting
contribution levels, and even early withdrawal provisions.17 The results also suggest that
avoiding retirement income shocks associated with underfunding of Social Security should
remain a key part of public policy toward retirement saving. It is by far the single largest
component of saving for most families, and the most important key to their retirement security.18
17 See, for example, Carroll et al (2009), Argento et al (2014), and Bryant (2008). 18 See, for example, Weller and Wolff (2005).

22
6. References
Aguiar, Mark, and Erik Hurst. 2005. “Consumption versus Expenditure,” Journal of Political
Economy, 113(5): 919-948.
Argento, Robert, Victoria L. Bryant, and John Sabelhaus. 2014. “Early Withdrawals from
Retirement Accounts during the Great Recession,” Contemporary Economic Policy.
(Forthcoming)
Behaghel, Luc, and David M. Blau. 2012. “Framing Social Security Reform: Behavioral
Responses to Changes in the Full Retirement Age,” American Economic Journal: Economic
Policy. 4(4): 41–67. (November)
Bernheim, B. Douglas, Jonathan Skinner, and Steven Weinberg. 2001. “What Accounts for the
Variation in Retirement Wealth Among U.S. Households?” American Economic Review, 91(4):
832-857.
Bricker, Jesse, Lisa J. Dettling, Alice Henriques, Joanne W. Hsu, Kevin B. Moore,
John Sabelhaus, Jeffrey Thompson, and Richard A .Windle. 2014. “Changes in U.S. Family
Finances from 2010 to 2013: Evidence from the Survey of Consumer Finances,” Federal
Reserve Bulletin, 100(4): 1-40. (September)
Bryant, Victoria L. 2008. “Accumulation and Distribution of Individual Retirement
Arrangements, 2004.” Statistics of Income Bulletin (Spring): 90–101. Washington, DC: Internal
Revenue Service, Statistics of Income Division.
Butrica, Barbara A., Howard M. Iams, Karen E. Smith, and Eric J. Toder. 2009. “The
Disappearing Defined Benefit Pension and Its Potential Impact on the Retirement Incomes of
Baby Boomers,” Social Security Bulletin, 69(3): 1-27.
Carroll, Gabriel D., James J. Choi, David Laibson, Brigitte C. Madrian, and Andrew Metrick.
2009. “Optimal Defaults and Active Decisions,” Quarterly Journal of Economics, 124(4): 1639-
74. (November)
Clark, Robert L., and John Sabelhaus. 2009. “How Will the Stock Market Crash Affect the
Choice of Pension Plans?” National Tax Journal 62(3): 1-20. (September)
Collins, J. Michael, John Karl Scholz, and Ananth Seshadri. 2013. “The Assets and Liabilities of
Cohorts: The Antecedents of Retirement Security.” Ann Arbor MI: University of Michigan
Retirement Research Center (MRRC) Working Paper, WP 2013-296. (October)

23
Gale, William G., and Karen Pence. 2006. “Are Successive Generations Getting Wealthier, and
If So, Why? Evidence from the 1990s,” Brookings Papers on Economic Activity, 2006:1, 155-
234.
Goda, Gopi Shah, John B. Shoven, and Sita Nataraj Slavov 2011. “What Explains Changes in
Retirement Plans during the Great Recession,” American Economic Review, 101(3): 29-34.
(May)
Gustman, Alan L., Thomas L. Steinmeier and Nahid Tabatabai. 2010. “What the Stock Market
Decline Means for the Financial Security and Retirement Choices of the Near-Retirement
Population,” Journal of Economic Perspectives 24(1): 161-182.
Gustman, Alan L., Thomas L. Steinmeier, and Nahid Tabatabai. 2011. “How Did The Recession
Of 2007-2009 Affect The Wealth And Retirement Of The Near Retirement Age Population In
The Health And Retirement Study?” National Bureau of Economic Research Working Paper
17547. (October)
Gustman, Alan L., Thomas L. Steinmeier, and Nahid Tabatabai. 2014. “The Great Recession,
Decline and Rebound In Household Wealth For The Near Retirement Population,” National Bureau
of Economic Research Working Paper 20584. (October)
Henriques, Alice M. 2012. “How Does Social Security Claiming Respond to Incentives?
Considering Husbands' and Wives' Benefits Separately.” Washington, DC: Federal Reserve
Board, Finance and Economics Discussion Series 2012-19, available at
http://www.federalreserve.gov/pubs/feds/2012/201219/201219abs.html.
Hurd, Michael D., and Susann Rohwedder, 2013. “Heterogeneity in spending change at
retirement,” Journal of the Economics of Ageing, 1(2): 60-71.
Love, David A., Michael G. Palumbo, and Paul A. Smith. 2009. “The Trajectory of Wealth in
Retirement,” Journal of Public Economics, 93: 191-208.
Mitchell, Olivia S., and John W.R. Phillips. 2006. “Social Security Replacement Rates for
Alternative Earnings Benchmarks,” Ann Arbor MI: University of Michigan Retirement Research
Center (MRRC) Working Paper, WP 2006-116. (May)
Munnell, Alicia H., Anthony Webb, and Francesca Golub-Sass. 2012. “The National Retirement
Risk Index: An Update.” Boston MA: Boston College Center for Retirement Research Issue in Brief
12-20. (October)
Poterba, James M., Joshua Rauh, Steven Venti, and David Wise. 2007. “Defined contribution
plans, defined benefit plans, and the accumulation of retirement wealth,” Journal of Public
Economics, 91: 2062-2086.
Poterba, James M., Steven Venti, and David Wise. 2012. “Were They Prepared For Retirement?
Financial Status at Advanced Ages in the HRS and Ahead Cohorts,” National Bureau of
Economic Research Working Paper 17824. (February)

24
Poterba, James M., Steven Venti, and David Wise. 2013. “Health, Education, and the Post-
Retirement Evolution of Household Assets,” National Bureau of Economic Research Working
Paper 18695. (January)
Poterba, James M. 2014. “Retirement Security in an Aging Society,” National Bureau of
Economic Research Working Paper 19930. (February)
Sabelhaus, John, and Karen Pence. 1999. “Household Saving in the ‘90s: Evidence From
Cross-Sectional Wealth Surveys,” Review of Income and Wealth, (45): 435-53. (December)
Scholz, John Karl, Ananth Seshadri, and Surachai Khitatrakun. 2006. “Are Americans Saving
Optimally for Retirement?” Journal of Political Economy, 114(4):607-643.
Weller, Christian, and Edward N. Wolff. 2005. Retirement Income: The Crucial Role of Social
Security. Washington, DC: Employment Policy Institute.
Wolff, Edward N. 2014. “U.S. Pensions in the 2000s: The Lost Decade?” Review of Income and
Wealth. (Forthcoming).

25
Figure 1. Aggregate Retirement Wealth as a Percent of Aggregate Personal Income
Source: Investment Company Institute and Bureau of Economic Analysis. Retirement assets
include IRAs, private DC and DB pensions, government pensions, and annuities.
0%
50%
100%
150%
200%
1989 1991 1993 1995 1997 1999 2001 2003 2005 2007 2009 2011 2013
Per
cen
t R
atio
All
DC+IRA

26
Figure 2a. Aggregate Retirement Plan Participation, All Households, 1989-2013
Figure 2b. Aggregate Retirement Plan Participation, Working Age Households (Household Head
Aged 25-59), 1989-2013
Source: Survey of Consumer Finances, 1989-2013. DB coverage includes any traditional pension
benefits through a current or past job for any member of the primary economic unit (PEU). DC
coverage includes IRA and DC pension coverage from a current or former employer in the
(PEU).
0
10
20
30
40
50
60
70
80
90
100
1989 1992 1995 1998 2001 2004 2007 2010 2013
Shar
e o
f A
ll H
Hs
Co
vere
d
DB Only DB and DC DC Only
0
10
20
30
40
50
60
70
80
90
100
1989 1992 1995 1998 2001 2004 2007 2010 2013
Shar
e o
f A
ll W
ork
ing
Ho
use
ho
lds
Co
vere
d
DB Only DB and DC DC Only
27
Figure 3. Aggregate Investment Company Institute (ICI) and Survey of Consumer Finances
(SCF) Balances in DC accounts and IRAs
Source: Investment Company Institute (ICI) and Survey of Consumer Finances (SCF).
$0
$2,000
$4,000
$6,000
$8,000
$10,000
$12,000
$14,000
1989 1992 1995 1998 2001 2004 2007 2010 2013
Mill
ion
s
ICI
SCF

28
Figure 4. Retirement Plan Participation by Cohort, 1989-2013
Source: Survey of Consumer Finances, 1989-2013
Note: Population grouped by birth year (displayed above) of household head. Retirement plan
participation includes holding of an individual retirement account (IRA) or participation in
defined benefit (DB) or defined contribution (DC) plan through a current or former employer.
0%
10%
20%
30%
40%
50%
60%
70%
80%
90%
100%
20 25 30 35 40 45 50 55 60 65 70 75 80
Age
1981-1990
1971-1980
1961-1970
1951-1960 1941-1950
1931-1940

29
Figure 5. Retirement Plan Participation by Cohort and Usual Income, 1995-2013
Source: Survey of Consumer Finances 1989-2013.
Note: Ranking determined by normal income distribution within each cohort. For definitions, see notes to Figure 4.
20%
30%
40%
50%
60%
70%
80%
90%
100%
20 25 30 35 40 45 50 55 60 65 70 75 80
Bottom 50 Percent
20%
30%
40%
50%
60%
70%
80%
90%
100%
20 25 30 35 40 45 50 55 60 65 70 75 80
Next 45 Percent (50th-95th percentiles)
1981-1990
1971-1980
1961-19701951-1960 1941-1950
1931-1940
20%
30%
40%
50%
60%
70%
80%
90%
100%
20 25 30 35 40 45 50 55 60 65 70 75 80
Top 5 Percent

30
Figure 6. Ratio of Average DC Balances to Average Usual Income, by Cohort & Usual Income,
1995-2013
Source: Survey of Consumer Finances 1995-2013.
Note: Ranking determined by usual income distribution within each cohort. For definitions, see notes to Figure 3.
0%
50%
100%
150%
200%
250%
300%
20 25 30 35 40 45 50 55 60 65 70 75 80
Bottom 50 Percent
0%
50%
100%
150%
200%
250%
300%
20 25 30 35 40 45 50 55 60 65 70 75 80
Next 45 Percent (50th-95th percentiles)
1981-1990
1971-1980
1961-1970
1951-1960
1941-19501931-1940
0%
50%
100%
150%
200%
250%
300%
20 25 30 35 40 45 50 55 60 65 70 75 80
Top 5 Percent

31
Figure 7. Average Usual Incomes by Cohort and Usual Income, 1995-2013
$0
$5,000
$10,000
$15,000
$20,000
$25,000
$30,000
$35,000
$40,000
$45,000
20 25 30 35 40 45 50 55 60 65 70 75 80
Bottom 50 Percent
$0
$20,000
$40,000
$60,000
$80,000
$100,000
$120,000
$140,000
$160,000
20 25 30 35 40 45 50 55 60 65 70 75 80
Next 45 Percent (50th-95th percentiles)
1981-1990
1971-1980
1961-19701951-1960
1941-1950
1931-1940
$0
$100,000
$200,000
$300,000
$400,000
$500,000
$600,000
$700,000
$800,000
$900,000
$1,000,000
20 25 30 35 40 45 50 55 60 65 70 75 80
Top 5 Percent
32
Figure 8. Average Usual Incomes, with Counterfactual Usual Income Growth by Cohort and
Usual Income, 1995-2013
$0
$5,000
$10,000
$15,000
$20,000
$25,000
$30,000
$35,000
$40,000
$45,000
$50,000
20 25 30 35 40 45 50 55 60 65 70 75 80
Bottom 50 Percent
$0
$20,000
$40,000
$60,000
$80,000
$100,000
$120,000
$140,000
$160,000
20 25 30 35 40 45 50 55 60 65 70 75 80
Next 45 Percent (50th-95th percentiles)
1981-1990
1971-1980
1961-19701951-1960
1941-1950
1931-1940
$0
$200,000
$400,000
$600,000
$800,000
$1,000,000
$1,200,000
$1,400,000
20 25 30 35 40 45 50 55 60 65 70 75 80
Top 5 Percent

33
Figure 9. Ratio of Average DC Balances to Average Usual Income with Counterfactual Growth,
by Cohort & Usual Income, 1995-2013
Source: Survey of Consumer Finances 1995-2013.
Note: Ranking determined by usual income distribution within each cohort. For definitions, see notes to Figure 3.
0%
50%
100%
150%
200%
250%
300%
20 25 30 35 40 45 50 55 60 65 70 75 80
Bottom 50 Percent
0%
50%
100%
150%
200%
250%
300%
20 25 30 35 40 45 50 55 60 65 70 75 80
Next 45 Percent (50th-95th percentiles)
1981-1990
1971-1980
1961-1970
1951-1960
1941-19501931-1940
0%
50%
100%
150%
200%
250%
300%
20 25 30 35 40 45 50 55 60 65 70 75 80
Top 5 Percent

3434
Table 1. Type of Pension Coverage by Cohort and Usual Income, Working Age Families, 1995 and 2013
1995 2013 Change, 1995 to 2013
Retirement Plan Coverage Bottom 50 Next 45 Top 5 Bottom 50 Next 45 Top 5 Bottom 50 Next 45 Top 5
Any Coverage 54 87 96 44 87 94 -9 -1 -2
DB Only 10 3 1 8 4 1 -1 1 0
DB and DC 19 41 45 8 32 23 -10 -9 -23
DC Only 25 43 49 28 51 70 2 7 20
DB, Conditional on Any Coverage 53 51 48 38 42 25 -15 -9 -23
Table 2. DC Balances by Cohort and Usual Income, 2013
NORMAL INCOME GROUP
Bottom 50 Next 45 Top 5 Bottom 50 Next 45 Top 5 Bottom 50 Next 45 Top 5
Cohort
Age
(2013) Unconditional Mean Conditional Median Balance Conditional Mean Balance
1981-90 28 500 7,000 49,300 1,700 7,500 27,400 3,900 14,500 57,900
1971-80 38 6,700 59,800 289,600 9,000 49,000 220,000 21,300 81,300 309,400
1961-70 48 15,300 130,400 552,200 17,000 100,000 440,000 43,500 167,600 571,700
1951-60 58 20,500 213,300 914,300 23,000 130,000 578,000 58,900 257,900 975,300
1941-50 68 31,000 245,800 1,426,300 63,200 170,000 974,300 110,800 337,700 1,530,500
1931-40 78 6,200 120,700 1,525,300 38,000 120,000 700,000 63,800 231,100 1,669,500
Source: Survey of Consumer Finances, 1989-2013.
Note: Ranking determined by usual income distribution within each cohort. For definitions, see notes to Figure 3.