Cross National Comparison of Income and Wealth Status in Retirement: First Results from the...
32
Cross National Comparison of Income and Wealth Status in Retirement: First Results from the Luxembourg Wealth Study (LWS) Eva Sierminska Luxembourg Wealth Study Andrea Brandolini Bank of Italy Timothy M. Smeeding Syracuse University and Luxembourg Income Study Prepared for the 8 th Annual Joint Conference of the Retirement Research Consortium “Pathways to a Secure Retirement” August 10-11, 2006 Washington, DC
-
Upload
merilyn-goodwin -
Category
Documents
-
view
220 -
download
0
Transcript of Cross National Comparison of Income and Wealth Status in Retirement: First Results from the...

Cross National Comparison of Income and Wealth Status in Retirement:First Results from the Luxembourg Wealth Study (LWS)
Eva SierminskaLuxembourg Wealth Study
Andrea BrandoliniBank of Italy
Timothy M. SmeedingSyracuse University and Luxembourg Income Study
Prepared for the 8th Annual Joint Conference of the Retirement Research Consortium “Pathways to a Secure Retirement”
August 10-11, 2006Washington, DC

I. Introduction
A. First Look at Results from a New Project: LWS
B. Technical Details at: http:www.lisproject.org/lws.htm (and especially, Sierminska et al, 2006; August 7, 2006 “IARIW” paper
C. Rest of Presentation

II. Older Persons in Comparative Perspective
A. Income and WealthB. Limits for this PaperC. Research and Policy Questions
Addressed BelowD. The Literature on Wealth and Low
Income in Comparative Perspective

III. Data, Variables, Methods and Measurement Issues
A. The LWS Data SetsB. Income and Wealth DefinitionsC. Principal Omissions: Pensions (Still
in Accrual) and Business Wealth

Earnings: Wages and Salaries, Self Employment IncomeCapital Income: Interest and Dividends, Rental Income, Income from Savings PlansPrivate Transfers: Occupational and Other Pensions; Interhousehold TransfersPublic Transfers: Social Incurance and Social Assistance
See Methodological Notes for more.
Income and Wealth Definitions
A. Income Components

Financial Assets
Deposit AccountsStocksMutual FundsBonds
Non-financial assetsPrincipal ResidenceOther Real Estate
Minus Total Debt(including home secured debt)
Equals Net Worth
See Methodological Notes for more.
Income and Wealth Definitions
B. Wealth Components

III. Data, Variables, Methods and Measurement Issues (con’t)
D. ‘Elderly’ Sample (Table A-1)E. Adjustments for Household SizeF. Measures of Income Poverty and
Wealth Poverty

United States(SCF ) Canada Finland Germany Italy Sweden
United Kingdom
84 81 82 79 71 81 78
16 19 18 21 29 19 22
4 4 6 7 5 8 7
8 7 7 10 9 10 9
1 2 1 1 3 0 3
1 1 1 2 7 1 2
(2) (5) (3) (1) (5) (0) (1)
14 14 15 20 24 19 21
Household composition
Single Age 65+ only (examined here)Couple head or spouse 65+ only
Single with others: head 65+
Table A-1. Household Composition(percentage of households)
Source: Authors' calculations from the Luxembourg Wealth Study.
Households with no Elderly
All Households with Elderlyof which:
Minus Other Units with Persons 65+ not Head or Spouse
Household Units with Head or Spouse 65+ (examined here)
Couple 65+ Head or Spouse with others
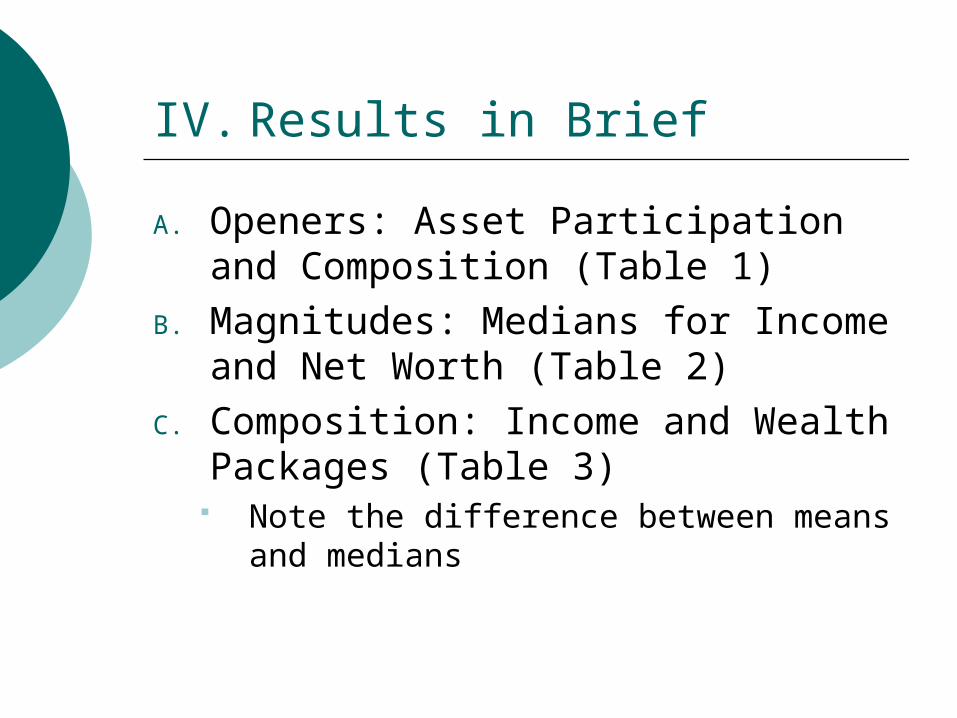
IV. Results in Brief
A. Openers: Asset Participation and Composition (Table 1)
B. Magnitudes: Medians for Income and Net Worth (Table 2)
C. Composition: Income and Wealth Packages (Table 3)
Note the difference between means and medians

Wealth componentsUnited States Canada Finland Germany Italy Sweden
Financial assets 95 93 91 62 2 75 86 82
Deposit accounts 95 93 89 n.a. 75 74 77 3
Stocks 23 10 33 n.a. 7 41 n.a. Mutual funds 21 14 3 n.a. 9 59 n.a. Bonds 17 17 4 n.a. 16 28 n.a.
Non-financial assets 84 76 81 55 78 64 70
Principal residence5 83 74 77 52 77 58 69 Other Real Estate 24 20 33 15 22 18 6
Total debt 49 32 14 13 9 39 21of which: Home secured debt 27 15 5 10 3 n.a. 4 8
Table 1. Asset Participation and Portfolio Composition in Households with
Elderly Persons as Head or Spouse1
A. Asset Participation
United Kingdom
4 In Sweden, home secured debt (is not separated from other loans).5 The self-assessed current value of the home is reported except for Sweden, where the tax value is reported inflated by a regional constant.
Source: Authors' calculations from the Luxembourg Wealth Study, Beta-version (June 29th, 2006); see also methodolgical notes.Notes: 1 Elderly are those where head or spouse are 65+ years of age. 2 Germany records liquid assets only when they exceed 2,500 per year. There is no further breakdown by type.3 Only savings or deposit accounts are separately identified in the UK.

Wealth componentsUnited States Canada Finland Germany Italy Sweden
Financial assets 44 33 17 14 2 17 41 26
Deposit accounts 12 17 11 n.a. 10 17 13 3
Stocks 18 8 5 n.a. 1 8 n.a. Mutual funds 9 6 0 n.a. 3 13 n.a. Bonds 4 3 1 n.a. 3 3 n.a.
Non-financial assets 56 67 83 86 83 59 74
Principal residence5 35 55 59 65 65 57 69 Real estates 21 12 23 20 18 12 5
Total assets 100 100 100 100 100 100 100
Total debt 6 5 1 6 1 11 2of which: Home secured debt 5 4 1 4 0 n.a. 4 1
Total net worth 94 95 99 94 99 89 98
4 In Sweden, home secured debt (is not separated from other loans).5 The self-assessed current value of the home is reported except for Sweden, where the tax value is reported inflated by a regional constant.
Source: Authors' calculations from the Luxembourg Wealth Study, Beta-version (June 29th, 2006); see also methodolgical notes.Notes: 1 Elderly are those where head or spouse are 65+ years of age. 2 Germany records liquid assets only when they exceed 2,500 per year. There is no further breakdown by type.3 Only savings or deposit accounts are separately identified in the UK.
United Kingdom
Table 1. Asset Participation and Portfolio Composition in Households with
Elderly Persons as Head or Spouse1
B. Portfolio Composition for Aggregate Wealth

Median Equivalized DPI as
a Percentage of Median DPI of All
Households
Country (yr)
All Householdswith an
Elderly Personas Head/Spouse
United States (SCF) (00) 93 20,043 (123) 21,637 (114)Canada (98) 92 19,231 (118) 20,957 (110)Finland (98) 79 13,287 (81) 16,908 (89)Germany (01) 90 16,886 (103) 18,779 (99)Italy (01) 88 13,847 (85) 15,753 (83)Sweden (02) 78 14,834 (91) 18,935 (99)United Kingdom (00) 80 16,369 (100) 20,458 (107)
Simple Average 86 16,357 (100) 19,061 (100)
Source: Authors' calculations from the Luxembourg Wealth Study.
Median Equivalized DPI in US 2002 Dollars
AllHouseholds
Table 2. Median Income and Net Worth in Households Containing Elderly Persons vs. All
A. Median Income Measures of Well-Being Across Countries
All Householdswith an
Elderly Personas Head/Spouse

Country (yr)
All Householdswith an
Elderly Personas Head/Spouse
United States (SCF) (01) 452 $104,528 (142) $25,215 (70)Canada (99) 250 61,313 (83) 24,525 (68)Finland (98) 156 56,033 (76) 35,903 (100)Germany (02) 307 71,585 (97) 23,343 (65)Italy (02) 106 81,281 (110) 76,418 (213)Sweden (02) 285 47,591 (65) 16,715 (47)United Kingdom (00) 193 94,014 (127) 48,723 (136)
Simple Average 250 $73,764 (100) $35,834 (100)
Table 2. Median Income and Net Worth in Households Containing Elderly Persons vs. All
B. Net Worth Measures of Well-Being Across Countries
Median Equivalized Net
Worth as a Percentage of
Median Net Worth of All Households
Median Equivalized Net Worth:2002 PPP Dollar Value and Relative to
Average Value for SampleAll Households
with anElderly Person
as Head/Spouse
Source: Authors' calculations from the Luxembourg Wealth Study.
All Households

United States (SCF) Canada Finland Germany Italy2 Sweden
United Kingdom
Earnings 34 34 9 16 26 11 18Capital Income 23 9 15 10 6 10 12Private Transfers 17 22 57 5 12 14 24Public Social Assistance 27 35 19 69 56 65 46TOTAL 100 100 100 100 100 100 100
Notes:1 Earnings include both wages and salaries and income from self-employment activities. Capital income includes interests and dividends, rental income, income from savings plans (including annuities from life insurance and private pensions), royalties and other property income. Private transfers include occupational and other pensions (e.g., pensions of unknown type or foreign pensions), alimony, regular transfers from other households/charity/private institutions, and other incomes not elsewhere classifiable. Public transfers include social insurance (including some universal benefits such as demo-grant pensions and family allowances) as well as public social assistance, which includes means-tested cash and near-cash public income transfers.2 Italy is net of taxes.
Source: Authors' calculations from the Luxembourg Wealth Study.
Table 3. Older Person's Income and Wealth Components:All Households with Elderly Persons as Head/Spouse
All Households
Panel A. Income Packages (ratio of means)1

United States (SCF) Canada Finland Germany Italy Sweden
United Kingdom
Financial Assets4 44 30 17 14 17 41 26Principal Residence 35 58 59 66 65 47 69Investment Real Estate 21 12 23 20 18 12 5Total Assets 100 100 100 100 100 100 100(Debt) 6 10 1 6 1 11 2(Net Worth) 94 90 99 94 99 89 98
United States (SCF) Canada Finland Germany Italy Sweden
United Kingdom
Financial Assets4 24 18 12 53 10 51 26Principal Residence 70 76 82 44 84 41 73Investment Real Estate 6 6 7 4 6 8 1Total Assets 100 100 100 100 100 100 100(Debt) 12 20 2 5 2 11 6(Net Worth) 88 80 98 95 98 89 94
Notes:
Source: Authors' calculations from the Luxembourg Wealth Study.
Table 3. Older Person's Income and Wealth Components:All Households with Elderly Persons as Head/Spouse
All Households
All Households
Panel B. Wealth Packages (ratio of overall means)3
Panel C. Wealth Packages for median household (ratio of means in middle of distribution)5
4 Financial assets include deposit accounts, stocks, bonds, and mutual funds. Non-financial assets include (owned) principal residence and investment real estate. Finally, total debt refers to all outstanding loans, both home-secured and non-home secured.
3 Ratio of means is the ratio of the respective population means for each item.
5 Median household is defined as having equivalized total assets between 40 to 60 percent of the distribution of all households. The ratio of means is the ratio of the respective means of the median household.

IV. Results in Brief (con’t)
D. Home Ownership and Home Value for All Elders, and for Low Income Units (Table 4)
E. Financial Assets for All and for Low Income Units (Table 5)

Country
Median Value Home Equity (equivalized)
Median Value Home Equity
(unequivalized)United States (SCF) 83.3 72.0 88,365 111,727Canada 74.0 74.4 61,936 96,349Finland 77.3 93.4 52,031 66,036Germany 53.6 84.9 155,620 205,171Italy 75.8 95.6 84,870 124,270Sweden 58.4 na 44,210 56,929United Kingdom 69.0 88.7 114,594 147,328
Notes:
Table 4. Homeownership and Home Values
All Households with an Elderly Person as Head/Spouse
A. Owners in Households Containing Elderly Persons
4 All observations with missing or zero disposable income or missing net worth were dropped from the sample.
Source: Authors' calculations from the Luxembourg Wealth Study.
1 DPI is the sum of total revenues from earnings, capital income, private transfers, public social insurance and public social assistance -- net of taxes and social security contributions. Incomes were bottom-coded at 1% of the mean equivalized DPI and top-coded at 10 times the median unequivalized. 2 Net worth consists of financial assets and non-financial assets -- net of total debt. No bottom- or top-coding were applied. 3 Both income and wealth are equivalized; adjusted = unadjusted / square root of household size.
Percent Homeowners
Percent Owners
Who Own Outright
For Owners:

Country
Median Value Home Equity (equivalized)
Median Value Home Equity
(unequivalized)United States (SCF) 67.5 77.3 53,866 71,099 Canada 52.3 73.2 37,226 49,050 Finland 83.2 100.0 46,585 47,168 Germany 46.8 91.2 116,715 165,060 Italy 70.4 99.5 46,636 62,197 Sweden 44.3 100.0 38,993 44,880 United Kingdom 68.6 90.0 101,288 119,704
Notes:
Percent Homeowners
Percent Owners
Who Own Outright
For Owners:
4 All observations with missing or zero disposable income or missing net worth were dropped from the sample.
Source: Authors' calculations from the Luxembourg Wealth Study.
1 DPI is the sum of total revenues from earnings, capital income, private transfers, public social insurance and public social assistance -- net of taxes and social security contributions. Incomes were bottom-coded at 1% of the mean equivalized DPI and top-coded at 10 times the median unequivalized. 2 Net worth consists of financial assets and non-financial assets -- net of total debt. No bottom- or top-coding were applied. 3 Both income and wealth are equivalized; adjusted = unadjusted / square root of household size.
B. Owners in Income Poor Households Containing Elderly Persons
All Households with an Elderly Person as Head/Spouse
Table 4. Homeownership and Home Values

Country
Percent with
Financial Assets
Median Value
($ 2002)
Median Value for All
($ 2002)
Median Value
($ 2002)
Median Value for All
($ 2002)United States (SCF) 94.9 22,336 16,678 4398 3,321Canada 90.3 6,255 5,110 2,168 1,548Finland 91.1 4,686 3,694 2,723 2,316Germany 61.8 22,008 6,239 14,096 0Italy 75.3 8,968 5,022 7,143 5,022Sweden 85.7 21,061 15,702 6943 4,209United Kingdom 82.4 14,975 9,506 5954 3,131
Source: Authors' calculations from the Luxembourg Wealth Study.
2The income poverty rate is defined as the percentage of persons living in households whose adjusted DPI is lower than 50% of the median DPI.
Notes: 1All values for financial wealth are equivalized using the square root (E=.5) equivalence scale.
All Households with an Elderly Person as
Head/SpouseHouseholds of
All Ages
Table 5. Financial Asset Holdings1 for the Elderly and for All Households
A. All Households Containing Elderly Person as Head or Spouse and Households of All Ages

Country
Percent with
Financial Assets
Median Value
($ 2002)
Median Value for All
($ 2002)Median ($ 2002)
Median Value for All
($ 2002)United States (SCF) 83.6 2,285 1,239 396 124Canada 76.0 1,517 540 310 114Finland 89.9 3,019 2,830 585 453Germany 28.7 11,004 0 6,353 0Italy 33.0 3,954 0 2,779 0Sweden 77.5 18,081 11,714 4,453 528United Kingdom 65.7 5,525 1,551 2,653 68
Table 5. Financial Asset Holdings1 for the Elderly and for All Households
Source: Authors' calculations from the Luxembourg Wealth Study.
2The income poverty rate is defined as the percentage of persons living in households whose adjusted DPI is lower than 50% of the median DPI.
Notes: 1All values for financial wealth are equivalized using the square root (E=.5) equivalence scale.
All Households with an Elderly Person as
Head/SpouseHouseholds of
All Ages
B. Income Poor Households Containing Elderly Persons as Head or Spouse2
and Households of All Ages

IV. Results in Brief (con’t)
F. Income and Asset Poverty (Figure 1)G. Home Ownership amongst the Income
and Asset Poor (Table X)H. Net Worth and Education (Figures 2, 3)I. Income and Net Worth Inequality: Median
Net Worth by Income Quartile (Figure 4)J. Joint Distributions: Income Quartile
Position of Various Wealth Quartile Members (Figure 5)

Source: Authors' calculations from the Luxembourg Wealth Study.
5Neither are the fraction who are neither income nor asset poor.
Notes: 1Percent of all persons living in units containing an elderly person who are poor. Totals may not add to 100 due to rounding.2Income and asset poor are the fraction meeting both income and wealth povery criteria.3Income poor are those with disposable incomes less than 50 percent of overal median disposable income.4Asset poor are those with financial assets less than 25 percent of median financial assets.
Figure 1. Older Persons' Income and Asset Poverty
15.4
3.9 3.98.3 9.8 9.6
7.8
4.6
5.3
20.546.4
49.2 36.8 33.9
27.4
30.5
56.348.4 44.7
52.3 54.3
65.454.5
2.71.3
2.22.5 1.9
0%
10%
20%
30%
40%
50%
60%
70%
80%
90%
100%
United States Canada Finland Germany Italy Sweden UnitedKingdom
Per
cen
t P
oo
r1
Income and Asset Poor Income Poor Only Asset Poor Only Neither 2 3 4 5
United States

CountryUnited States (SCF) 59.5 (43.3)Canada 45.1 (18.6)Finland 73.7 1 (73.7) 1
Germany 44.6 (28.9)Italy 69.1 (63.0)Sweden 41.6 (42.9)United Kingdom 61.8 (53.0)
Source: Authors' calculations from the Luxembourg Wealth Study.Notes: 1 The income and asset poor are less than 30 observations.
Table X. Homeownership of the Income and Asset Poor
All Poor Households with an Elderly Person as
Head/Spouse
(Only Poor Single Elderly
Persons)

Source: Authors' calculations from the Luxembourg Wealth Study.
Figure 2. Net Worth, Financial Assets and Education
A. Median Net Worth by Education Level of Head of Household for Older Households
-
50,000
100,000
150,000
200,000
250,000
300,000
low medium high
United States (SCF) Canada Finland
Germany Italy Sweden
United Kingdom

Source: Authors' calculations from the Luxembourg Wealth Study.
Figure 2. Net Worth, Financial Assets and Education
B. Median Financial Assets by Education Level of Head of Household for Older Households-500,000
low medium highUnited States (SCF) Canada Finland
Germany Italy Sweden
United Kingdom
-
10,000
20,000
30,000
40,000
50,000
60,000
70,000
80,000
low medium high
United States (SCF) Canada Finland
Germany Italy Sweden
United Kingdom

Source: Authors' calculations from the Luxembourg Wealth Study.
Figure 3. Homeownership, Home Values, and Education
A. Homeownership by Education Level of Head of Household for Older Households
0
10
20
30
40
50
60
70
80
90
100
low medium high
United States Canada Finland Germany
Italy Sweden United Kingdom
-500,000
low medium highUnited States Canada Finland Germany
Italy Sweden United Kingdom

Source: Authors' calculations from the Luxembourg Wealth Study.
Figure 3. Homeownership, Home Values, and Education
B. Median Housing Equity for Homeowners by Education Level of Head of Household for Older Households
0100
low medium highUnited States Canada Finland Germany
Italy Sweden United Kingdom
-
50,000
100,000
150,000
200,000
250,000
low medium high
United States Canada Finland Germany
Italy Sweden United Kingdom

Source: Authors' calculations from the Luxembourg Wealth Study.
Figure 4. New Worth Medians by Quartiles of DPI(in thousands, 2002 USD)
0.0
50.0
100.0
150.0
200.0
250.0
300.0
350.0
1 2 3 4
DPI quartiles
,000
$
United States (SCF) Canada Finland Germany Italy Sweden United Kingdom

Note: All values of income and wealth are equivalized.Source: Authors' calculations from the Luxembourg Wealth Study.
Figure 5. The Income Quartile Positionwith Top, Bottom and Middle Wealth Quartiles
A. Top Net Worth Quartile Distribution by DPI Quartiles
-5
5
15
25
35
45
55
65
75
85
1 2 3 4
DPI Quartiles
%
United States (SCF) Canada Finland
Germany Italy Sweden
United Kingdom
-1585
1 2 3 4DPI Quartiles
% -1585
1 2 3 4DPI Quartiles
%
United States (SCF) Canada Finland
Germany Italy Sweden
United Kingdom
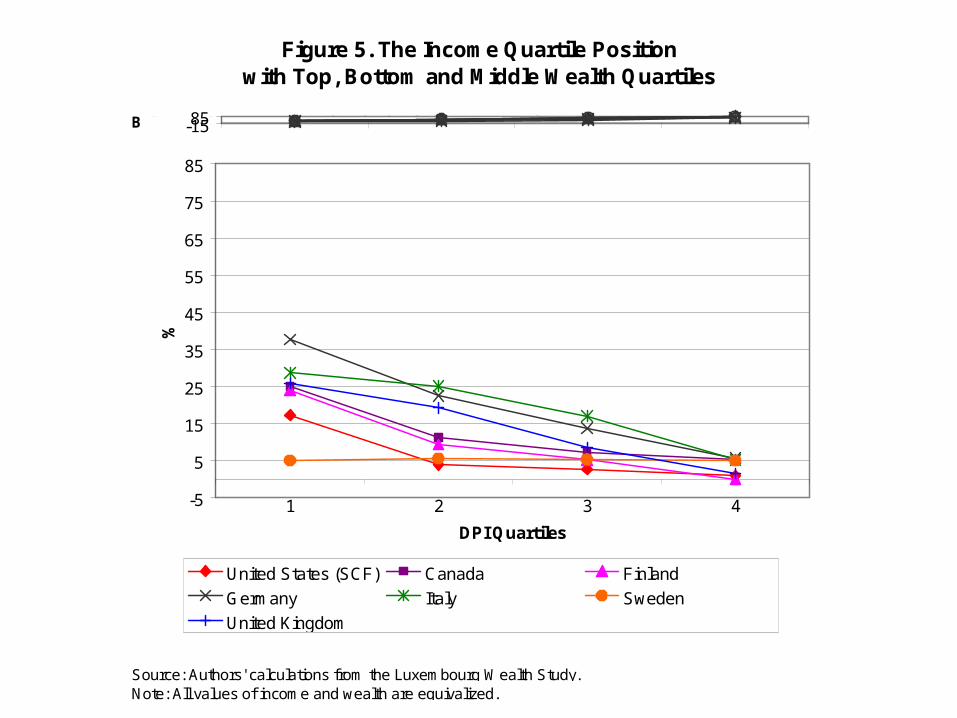
Note: All values of income and wealth are equivalized.Source: Authors' calculations from the Luxembourg Wealth Study.
Figure 5. The Income Quartile Positionwith Top, Bottom and Middle Wealth Quartiles
B. Bottom Net Worth Quartile Distribution by DPI Quartiles-1585
1 2 3 4DPI Quartiles
%
-5
5
15
25
35
45
55
65
75
85
1 2 3 4
DPI Quartiles
%
United States (SCF) Canada Finland
Germany Italy Sweden
United Kingdom

Note: All values of income and wealth are equivalized.Source: Authors' calculations from the Luxembourg Wealth Study.
Figure 5. The Income Quartile Positionwith Top, Bottom and Middle Wealth Quartiles
C. Middle Two Net Worth Quartile Distribution by DPI Quartiles-1585
1 2 3 4DPI Quartiles
% -1585
1 2 3 4DPI Quartiles
%
-5
5
15
25
35
45
55
65
75
85
1 2 3 4
DPI Quartiles
%
United States (SCF) Canada Finland
Germany Italy Sweden
United Kingdom

V. Discussion
A. First Look: Signal vs. NoiseB. Research Implications: Next StepsC. Policy Relevance: Public and
Private Sources of Security in Old Age
D. Bottom Lines:1. Safety Nets2. Home Ownership and Value
E. Tip of the Iceberg: Shades of 1985 and LIS