Managing Lifetime Wealth: retirement planning in the UK
39
Managing Lifetime Wealth: retirement planning in the UK Charting the course of retirement advice through a global pandemic, market volatility and continued regulatory change
Transcript of Managing Lifetime Wealth: retirement planning in the UK
Managing Lifetime Wealth: retirement planning in the UK
Charting the course of retirement advice through a global pandemic, market volatility and continued regulatory change
Foreword from Aegon
The last year has seen significant challenges as we have adapted to
the ongoing Covid-19 pandemic which has influenced all aspects
of our society and economy. We have become acutely aware of the
health impact of the pandemic but have also begun to understand
its effect on wealth. Financial advisers have been well positioned to
support their clients through this period, transitioning to the new
way of working with remote meetings and the huge acceleration of
digital processes.
Retirement advice continues to be a key driver of adviser business
and demand has been growing in recent years following the
introduction of the pension freedoms and as the UK population
ages. The pandemic has further highlighted the value of personalised
advice in retirement planning with many people reevaluating their
priorities and seeking help to navigate through stock market volatility.
Aegon is delighted to sponsor NextWealth’s comprehensive research for the second year
running. We hope that it will offer valuable insight to advisers and those within the retirement
advice industry to understand the latest views on some of the biggest industry trends.
The global pandemic provides the backdrop to this report and it looks to understand how
advisers have managed their approach through this. This includes the approach to portfolio
construction and recommendations of investment products such as multi-asset funds for
clients in decumulation. The regulatory environment continues to evolve and this report also
brings to light adviser attitudes towards the latest developments, in particular the new rules
for defined benefit transfer advice and investment pathways.
Aegon is committed to providing insight to advisers and their businesses to help support their
clients through the challenges they face. Many of the trends in this report will inform the
development of Aegon’s propositions which seek to provide the tools and solutions advisers
need. We hope you find this report both engaging and informative.
For more adviser focused insights and research please visit the Advice Makes Sense section
of our website:
https://www.aegon.co.uk/advisers/advice-makes-sense.html
Ronnie Taylor,
Chief Distribution Officer at Aegon
2
3
Contents
Introduction 4Methodology 4Executive Summary 51. Retirement Advice and Financial Advice Businesses 71.1 Covid-19 impact on retirement advice 71.2 Importance of retirement advice to financial advice businesses 102. Client Profile 112.1 Average value of retirement portfolios 122.2 Client objectives in retirement 132.3 Clients' hopes and fears 143. Retirement advice and investment approach 163.1 Retirement advice techniques 163.2 Structuring portfolios for retirement income 183.3 Withdrawal strategy 193.4 Taking tax-free cash at retirement 203.5 Impact of investment pathways 214. Investment products used in decumulation 224.1. Investment products used for retirement clients 224.2 DFM model portfolios 254.3 Adviser managed model portfolios 264.4 Use of proprietary multi-asset funds 264.5 Use of ESG funds and solutions 274.6 Use of property funds 285. Defined benefit pension transfer advice 295.1. Firms offering defined benefit transfer advice 295.2. Reasons for ceasing to offer DB transfer advice 305.3. Time taken to complete a DB transfer 315.4. Abridged advice for DB transfers 335.4. Abridged advice for DB transfers 34Conclusion Trends and opportunities ahead 35 Trend: Regulatory focus on value 35Trend: Shift to retirement assets for ongoing fees 35Trend: Simplification of systems and tools 36Opportunity: advice and solutions for clients with lower value portfolios 36Opportunity: Advice to drive behavioural change 36Respondent Profile 37

This report is kindly supported by Aegon and considers the increasingly important and fast-moving topic of retirement advice. There is plenty of evidence to show that helping clients plan for and manage retirement is growing in importance for advisers.
This report provides financial advisers with a benchmark for comparison to help them think through their own retirement advice process and to learn from the practices of other firms. It also offers stakeholders within the retirement advice industry insight into the new challenges facing advisers against the backdrop of the global pandemic, market volatility and a changing regulatory landscape. We publish this report each year and welcome any input for future updates. You can send feedback to [email protected].
Introduction
The report findings are based on quantitative and qualitative inputs:
• Online quantitative survey of 212 financial advisers conducted between 3 and 11 December 2020
• In-depth qualitative interviews with 10 financial advisers, conducted between 3 and 11 December 2020
Methodology
• Comparisons are offered to the January 2020 and July 2018 versions of this report which were also based on in-depth qualitative interviews with financial advisers and quantitative surveys of 227 and 267 financial advisers, respectively.
NB The term financial adviser is used throughout this report to refer to financial advisers and financial planners.
4

5
• Most advisers say client acquisition has been significantly more difficult since the start of the COVID-19 pandemic. Advisers servicing clients with smaller portfolios have felt the pinch most acutely.
• Most advisers say that portfolios have performed as expected through the market volatility of 2020. Nearly half said clients viewed the market fall in early 2020 as a buying opportunity.
58% of adviser assets are for clients receiving retirement advice.
Executive summary
Covid Impact Covid Performance
Importance of retirement advice to financial advice businesses
Client Profile Retirement at a Glance• Financial advisers that have offered defined
benefit (DB) advice have a larger average client portfolio size.
• Among advisers that provide DB transfer advice or have done so in the past, 43% report an average client portfolio size of 250K or more in comparison to 23% for those who have never provided DB transfer advice.
Average advised retirement client has assets of £270,000
Ad
vise
rs
47% AGREE clients saw themarket fall as a buying opportunity
54% ofclients
19% are phasing into retirement
35% of advised clients are fully retired
• Client objectives with retirement savings are most often to use savings to create a sustainable retirement income, followed by passing savings to a loved one. Financial advisers with larger average portfolio sizes are more likely to say that passing on wealth is a priority for the majority of clients.
• Client hopes and fears centre on the ability to maintain their standard of living in retirement. This is followed by concerns about health, running out of money and long-term care costs.
4 in 5 advisers ask clients about meaning,
purpose and happiness
Client objectives, hopes and fears

6
Retirement advice
Investment Proposition
• 58% of adviser assets are for clients receiving retirement advice.• Safe withdrawal rates are in flux as the 4% rule loses ground to modelling
tools
• 56% of advisers say they always or often recommend multi-asset or multi-manager funds to clients in drawdown, up from 36% last year. Growth is expected to continue, with 22% saying they will increase use in the next 3 years.
• Among those using multi-asset funds, 43% always or mainly use proprietary funds – where the firm that manages the money has custody of the assets.
• Smoothed multi-asset funds saw the most significant decline only 15% of financial advisers always or often recommend smoothed funds to clients, down from 23% last year.
• Half of advisers would never use a DFM for bespoke or model portfolios for clients in drawdown. But this may be set to change: 21% expect to increase use of DFM model portfolios in the next three years.
• Most advisers only consider ESG criteria as a result of a client request. Nearly one third say ESG credentials are among the factors considered when selecting managers or funds.
• 42% of advisers use property funds for clients in drawdown. About half of these would continue to use these funds if an FCA proposed notice period were introduced however most of those would use them less.
38% use a modelling tool such as Timeline, up from 28% last year
37% use a fixed rate (typically 4%), down from 41%
23% of clients take less of the tax-free lump sum at retirement, with most of these preferring to take tax-free cash via drip-feed drawdown
Top Investment Approaches to Retirement Income
Total return (39%)
Bucket (31%)
Income driven (25%)
(% Always use/ Use most of the time)
123
Defined Benefit Pension Tranfers• Among firms that have stopped offering defined benefit
(DB) transfer advice, most said the decision to stop was down to business risk or increases to PII premiums and excess.
• 81% of advisers say DB transfers take at least 3 months from the first conversation to completion. Nearly a quarter said it takes longer than 6 months. Two thirds say that transfer times have increased in the past year.
• 60% agree or strongly agree that abridged advice is an effective way to identify clients for whom a transfer is not suitable, up 14% from last year.
• Half of advisers providing DB transfer service offer abridged advice. Just over 30% don’t charge for this and 58% of those who charge levy a fee of less than £1,000.
% of advisers offering DB advice is declining
Defined Benefit Advice
-37
%
-46
%
56%
2018 2020 2021
41%
22%
An ageing population, the introduction of Pension Freedom and increasing complexity of managing retirement income has driven up demand for financial advice and is having an impact on the structure and focus of financial advice businesses. These changes continue to permeate the industry as we work through the implications of an ongoing global pandemic. In this section we explore the impact of the Covid-19 pandemic on retirement advice and the growing importance of retirement advice to financial advice businesses.
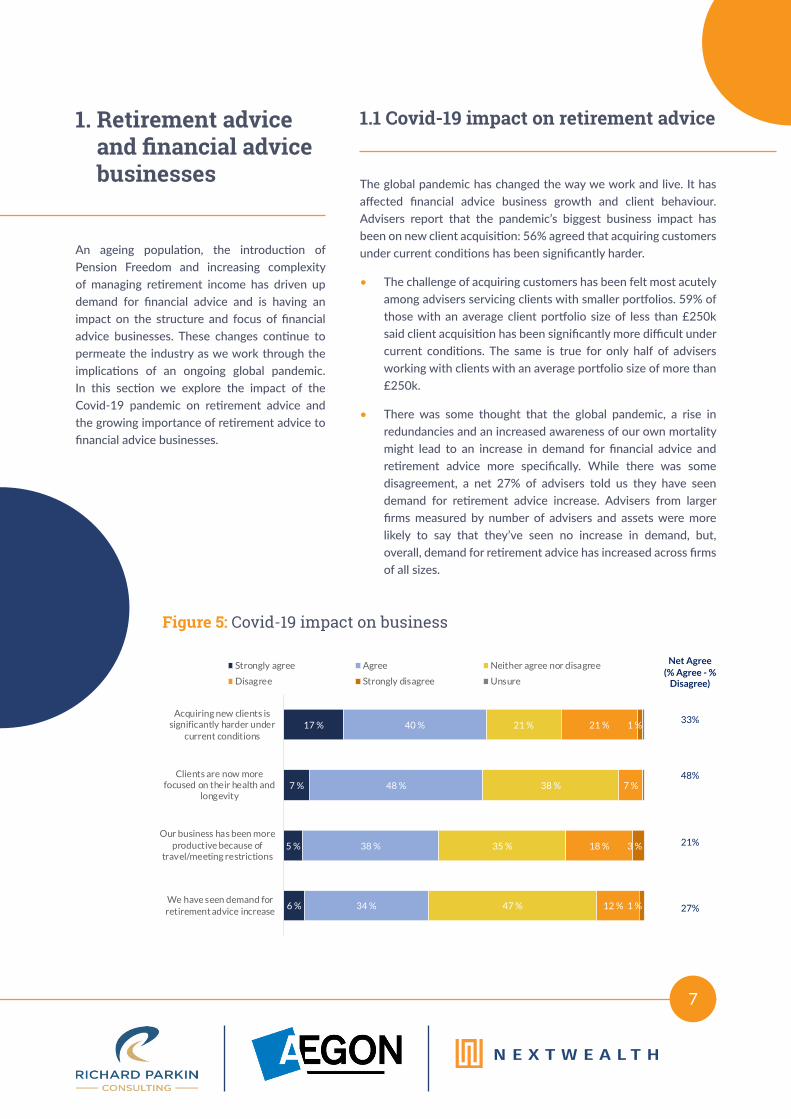
The global pandemic has changed the way we work and live. It has affected financial advice business growth and client behaviour. Advisers report that the pandemic’s biggest business impact has been on new client acquisition: 56% agreed that acquiring customers under current conditions has been significantly harder.
• The challenge of acquiring customers has been felt most acutely among advisers servicing clients with smaller portfolios. 59% of those with an average client portfolio size of less than £250k said client acquisition has been significantly more difficult under current conditions. The same is true for only half of advisers working with clients with an average portfolio size of more than £250k.
• There was some thought that the global pandemic, a rise in redundancies and an increased awareness of our own mortality might lead to an increase in demand for financial advice and retirement advice more specifically. While there was some disagreement, a net 27% of advisers told us they have seen demand for retirement advice increase. Advisers from larger firms measured by number of advisers and assets were more likely to say that they’ve seen no increase in demand, but, overall, demand for retirement advice has increased across firms of all sizes.
1. Retirement advice and financial advice businesses
1.1 Covid-19 impact on retirement advice
7
Figure 5: Covid-19 impact on business
17 %
7 %
5 %
6 %
40 %
48 %
38 %
34 %
21 %
38 %
35 %
47 %
21 %
7 %
18 %
12 %
1 %
3 %
1 %
Acquiring new clients issignificantly harder under
current conditions
Clients are now morefocused on their health and
longevity
Our business has been moreproductive because of
travel/meeting restrictions
We have seen demand forretirement advice increase
Strongly agree Agree Neither agree nor disagree
Disagree Strongly disagree Unsure
Net Agree(% Agree - %
Disagree)
33%
48%
21%
27%

Figure 6: Covid-19 impact on retirement investments
We also asked about the impact of Covid-19 on retirement investment portfolios. Figure 6 illustrates that, for the most part, portfolios have performed as expected. Nearly half of advisers also told us that clients viewed the market fall early in 2020 as a buying opportunity. Few have changed their investment strategy for clients in retirement as a result
of the pandemic and subsequent market shifts. While portfolios performed as expected, some advisers did encourage retired clients to draw income from cash reserves (or buffers) rather than sell when markets were down. One third of advisers said they advised clients to reduce or stop taking income from investments.
15%
3 %
5 %
6 %
2 %
75 %
44 %
36 %
28 %
22 %
6 %
7 %
39 %
23 %
29 %
27 %
35 %
12 %
26 %
29 %
36 %
44 %
9 %
8 %
13 %
15 %
The portfolios we use for retirementhave generally performed in line with
expectations
Clients have seen the market fall as abuying opportunity and invested new
cash
Illiquid holdings (e.g. property funds)have caused issues for retired clients
We have advised clients to reduce orstop taking income from investments
for the time being
We have delayed rebalancing clientportfolios because of market
volatility
We have fundamentally changed ourinvestment strategy for clients in
retirement
Strongly agree Agree Neither agree nor disagree
Disagree Strongly disagree UnsureNet Agree
(% Agree - % Disagree)
88%
34%
5%
-3%
-25%
-53%
8
Our in-depth interviews with financial advisers confirm that the pandemic has led some clients to reassess priorities and lifestyle. Early retirement was a common theme but so too was the desire to move out of urban centres.
“We’ve had a few people who have decided to retire early or have taken redundancy. People’s circumstances changed. Some changing thoughts on lifestyle. People not want-ing to live in city/London anymore. Looking at spending more time in rural areas.”
“A good extra 10% to 15% of clients are moving into retirement either early, having been made redundant or losing employment because they’ve had to close their company. So it’s a definite move this year. I’m hoping it will reverse but it’s noticeable at the moment that that’s what we’re doing”

Our interviewees also told us that things that were once theoretical became true in practice.
“The main thing about Covid-19 is that we’ve got some actual market volatility, that’s making people think a little bit more about it. Sequencing risk, that was this thing that was a conceptual thing that’s never happened, that suddenly happened.”
“For clients who have given me a hard time about holding a cash buffer, they finally did what I told them they’d do – they took cash rather than selling. The plan worked!”
9
One adviser also told us that clients started taking out less money, not because of market shifts but because they didn’t need the money:
Many of the changes brought on by Covid-19 should pass as we return to some form of business as usual. What is certain is that advisers have found that the tools they use to illustrate portfolios and to analyse scenarios have become more valuable than ever. We explore the use of tools in section 3.
“Our investment approach is a long-term investment approach. We recognise volatility and the impact of sequencing risk and all that stuff. But we manage that through cash. So we take a view on when to top up the cash accounts, if you like, but their income doesn’t come directly out of the markets. So therefore we can afford to ride it out. You saw this year, back in Springtime, we wouldn’t want to be drawing down money at that point, but we would never be drawing down anyway. At that stage, we would always have a cash balance. So it’s not changed our thinking directly at all.”
“Some clients have actually stopped taking income or reducing the income, because they weren’t spending any money, because they weren’t going anywhere.”

Our survey reveals that 58% of advised assets are for retirement clients. Financial advisers have lowered their projections for the speed of the shift of assets to retirement. Three years ago, advisers said that 53% of their assets were for clients receiving retirement advice and they projected that to grow to 60% in three years – representing a 13% change. Roll forward three years and advisers say that the increase will only be 9%, from 58% to 63%.
10
1.2 Importance of retirement advice to financial advice businesses
• 69% of advisers said that at least half of their assets are for clients seeking retirement advice. 5% said that all of their assets are for retirement advice.
• The most common single response was 70%, followed closely by 75%. Each was selected by only 7% and 6% of advisers, further illustrating the spread of responses.
Table 1: Average share of assets for clients receiving retirement advice
Figure 7: Looking ahead three years: Assets under advice, per adviser
Average adviser assets for clients receiving
retirement advice
Projection three years ahead – average adviser assets for clients
receiving retirement advice
Expected percentage
change
2021 58% 63% 9%
2020 60% 66% 10%
2018 53% 60% 13%
0 %
1 %
2 %
3 %
4 %
5 %
6 %
7 %
8 %
9 %
10 %
0% 10% 20% 30% 40% 50% 60% 70% 80% 90% 100%
2018 2020 2021
While the average is 58%, there was a wide variety in the share of assets forecast to be for clients in retirement, as illustrated in Figure 7.
On average, 58% of adviser assets are for
clients receiving retirement advice

Pension Freedom, and the associated changes to the inheritance tax treatment of pension savings, have fundamentally changed how retirement savings are used. On top of this, changes in working patterns have also affected what income people need in retirement and when they need it. More and more people are working beyond traditional retirement ages. No doubt part of this is driven by an increasing State Pension Age, but the idea that work stops at 60 or 65 has become increasingly alien.
However, employment rates in those over age 65 dipped significantly during 2020 as the pandemic took hold. Employment in this age group fell by nearly 12% between March and June 2020 compared to less than 1% for those aged 16 to 64, although this has recovered somewhat since then.
The very concept of retirement being a point in time when people move from full-time employment to not working at all is changing. Increasingly, whether by necessity or desire, retirement has become more of a transition period when people move from full-time to part-time employment before stopping work altogether. As figure 9 shows, those at older ages who are employed are more likely to have part-time employment and, interestingly, many of these will be part-time self-employed.
2. Client profile
11
Figure 8: Employment rate for those aged 65 and above
Source: ONS Labour Force Survey
This change to retirement being a transitionary period is reflected in the profile of advised clients as shown in Figure 10.
Figure 9: Employment type by single year of age
68697071727374
02 03 06 0
Full-Time Employee
75+
Full-Time Self-Employe d
10 40 50 70 10080 90
6061626364656667
5253545556575859
4445464748495051
3637383940414243
2829303132333435
2021222324252627
16171819
Ag
e
Proportion in employment
Part-Time Employee Part-Time Self-Employed
Other
Source: “Independent Review of the State Pension Age, Smoothing the Transition”, Cridland 2017. Contains public sector information licensed under the Open Government Licence v3.0.
0.0
2.0
4.0
6.0
8.0
10.0
12.0
14.0
Apr-92
Apr-93
Apr-94
Apr-95
Apr-96
Apr-97
Apr-98
Apr-99
Apr-00
Apr-01
Apr-02
Apr-03
Apr-04
Apr-05
Apr-06
Apr-07
Apr-08
Apr-09
Apr-10
Apr-11
Apr-12
Apr-13
Apr-14
Apr-15
Apr-16
Apr-17
Apr-18
Apr-19
Apr-20
Em
plo
ymen
t ra
te (%
)
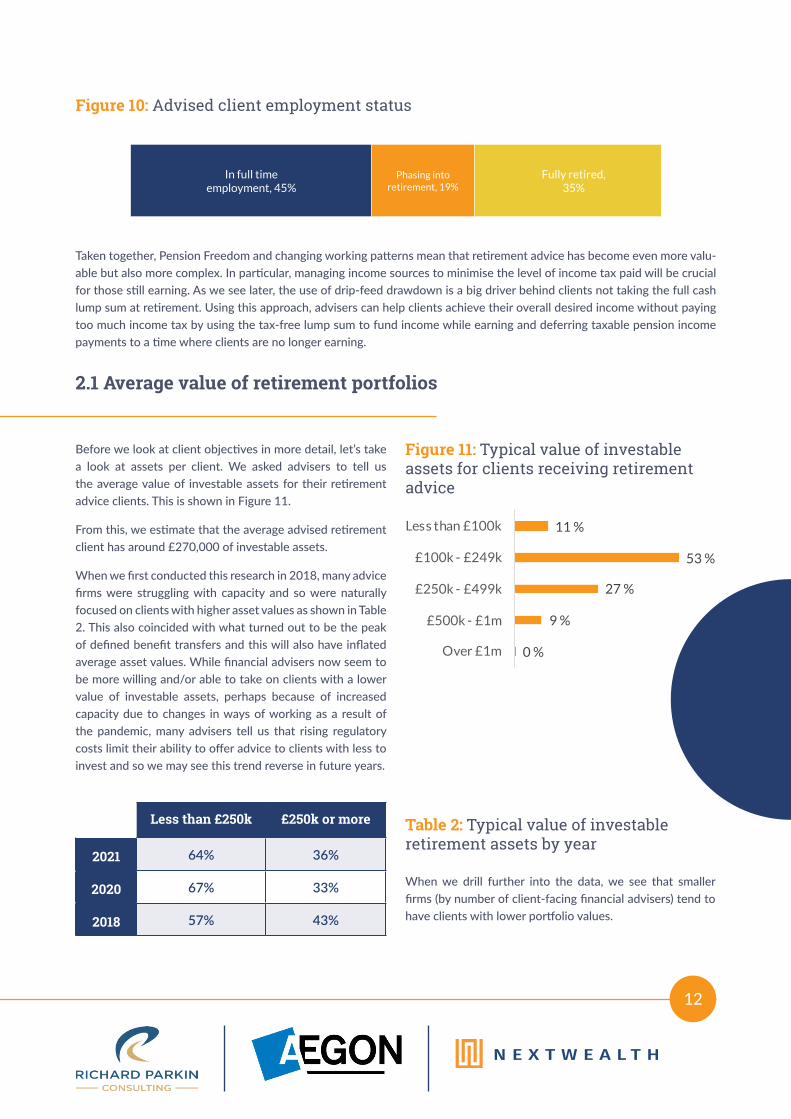
Taken together, Pension Freedom and changing working patterns mean that retirement advice has become even more valu-able but also more complex. In particular, managing income sources to minimise the level of income tax paid will be crucial for those still earning. As we see later, the use of drip-feed drawdown is a big driver behind clients not taking the full cash lump sum at retirement. Using this approach, advisers can help clients achieve their overall desired income without paying too much income tax by using the tax-free lump sum to fund income while earning and deferring taxable pension income payments to a time where clients are no longer earning.
Figure 10: Advised client employment status
12
In full time employment, 45%
Phasing into retirement, 19%
Fully retired, 35%
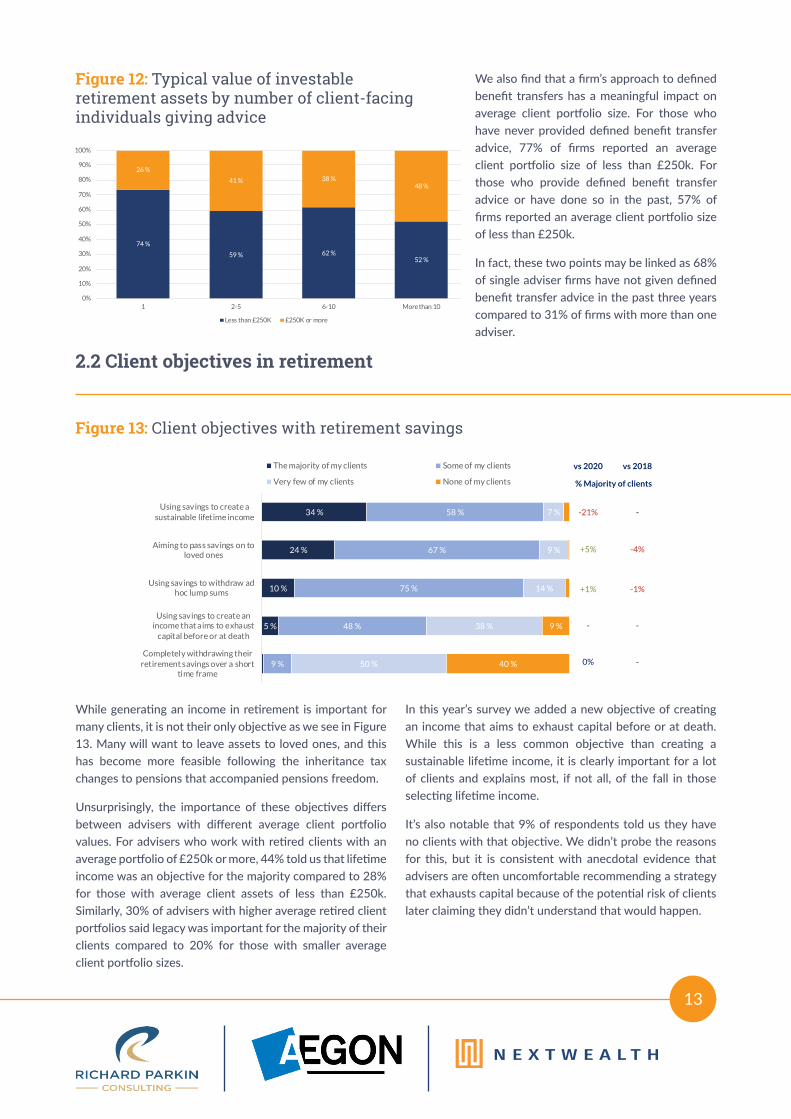
Table 2: Typical value of investable retirement assets by year
Less than £250k £250k or more
2021 64% 36%
2020 67% 33%
2018 57% 43%
Before we look at client objectives in more detail, let’s take a look at assets per client. We asked advisers to tell us the average value of investable assets for their retirement advice clients. This is shown in Figure 11.
From this, we estimate that the average advised retirement client has around £270,000 of investable assets.
When we first conducted this research in 2018, many advice firms were struggling with capacity and so were naturally focused on clients with higher asset values as shown in Table 2. This also coincided with what turned out to be the peak of defined benefit transfers and this will also have inflated average asset values. While financial advisers now seem to be more willing and/or able to take on clients with a lower value of investable assets, perhaps because of increased capacity due to changes in ways of working as a result of the pandemic, many advisers tell us that rising regulatory costs limit their ability to offer advice to clients with less to invest and so we may see this trend reverse in future years.
When we drill further into the data, we see that smaller firms (by number of client-facing financial advisers) tend to have clients with lower portfolio values.
2.1 Average value of retirement portfolios
Figure 11: Typical value of investable assets for clients receiving retirement advice
11 %
53 %
27 %
9 %
0 %
Less than £100k
£100k - £249k
£250k - £499k
£500k - £1m
Over £1m
13
Figure 12: Typical value of investable retirement assets by number of client-facing individuals giving advice
Figure 13: Client objectives with retirement savings
We also find that a firm’s approach to defined benefit transfers has a meaningful impact on average client portfolio size. For those who have never provided defined benefit transfer advice, 77% of firms reported an average client portfolio size of less than £250k. For those who provide defined benefit transfer advice or have done so in the past, 57% of firms reported an average client portfolio size of less than £250k.
In fact, these two points may be linked as 68% of single adviser firms have not given defined benefit transfer advice in the past three years compared to 31% of firms with more than one adviser.
74 %
59 % 62 %52 %
26 %
41 % 38 %48 %
0%
10%
20%
30%
40%
50%
60%
70%
80%
90%
100%
1 2-5 6-10 More than 10
Less than £250K £250K or more
2.2 Client objectives in retirement
While generating an income in retirement is important for many clients, it is not their only objective as we see in Figure 13. Many will want to leave assets to loved ones, and this has become more feasible following the inheritance tax changes to pensions that accompanied pensions freedom.
Unsurprisingly, the importance of these objectives differs between advisers with different average client portfolio values. For advisers who work with retired clients with an average portfolio of £250k or more, 44% told us that lifetime income was an objective for the majority compared to 28% for those with average client assets of less than £250k. Similarly, 30% of advisers with higher average retired client portfolios said legacy was important for the majority of their clients compared to 20% for those with smaller average client portfolio sizes.
In this year’s survey we added a new objective of creating an income that aims to exhaust capital before or at death. While this is a less common objective than creating a sustainable lifetime income, it is clearly important for a lot of clients and explains most, if not all, of the fall in those selecting lifetime income.
It’s also notable that 9% of respondents told us they have no clients with that objective. We didn’t probe the reasons for this, but it is consistent with anecdotal evidence that advisers are often uncomfortable recommending a strategy that exhausts capital because of the potential risk of clients later claiming they didn’t understand that would happen.
34 %
24 %
10 %
5 %
58 %
67 %
75 %
48 %
9 %
7 %
9 %
14 %
38 %
50 %
9 %
40 %
Using savings to create asustainable lifetime income
Aiming to pass savings on toloved ones
Using savings to withdraw adhoc lump sums
Using savings to create anincome that aims to exhaust
capital before or at death
Completely withdrawing theirretirement savings over a short
time frame
The majority of my clients Some of my clients
Very few of my clients None of my clients
vs 2020 vs 2018
% Majority of clients
-21% -
+5% -4%
+1% -1%
- -
0% -
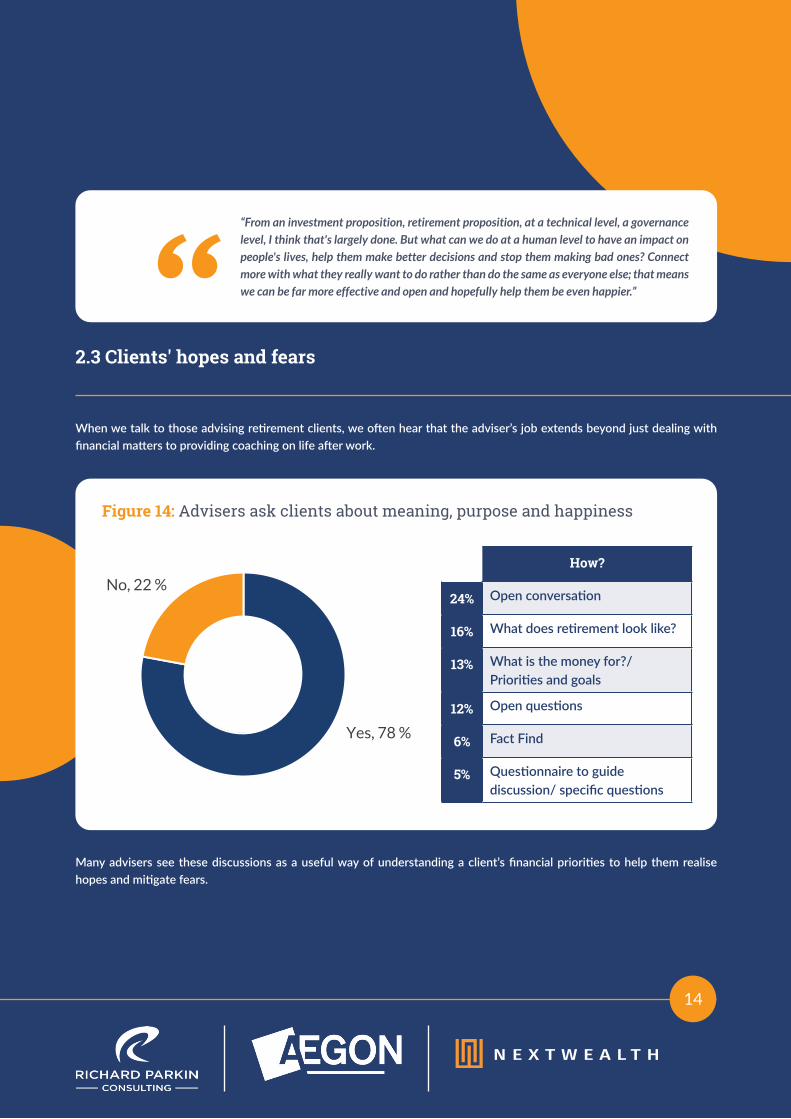
When we talk to those advising retirement clients, we often hear that the adviser’s job extends beyond just dealing with financial matters to providing coaching on life after work.
Many advisers see these discussions as a useful way of understanding a client’s financial priorities to help them realise hopes and mitigate fears.
Figure 14: Advisers ask clients about meaning, purpose and happiness
14
2.3 Clients' hopes and fears
How?
24% Open conversation
16% What does retirement look like?
13% What is the money for?/ Priorities and goals
12% Open questions
6% Fact Find
5% Questionnaire to guide discussion/ specific questions
“From an investment proposition, retirement proposition, at a technical level, a governance level, I think that's largely done. But what can we do at a human level to have an impact on people's lives, help them make better decisions and stop them making bad ones? Connect more with what they really want to do rather than do the same as everyone else; that means we can be far more effective and open and hopefully help them be even happier.”
Yes, 78 %
No, 22 %

Generally, these hopes and fears seem to be consistent across clients of all advised firms with some interesting exceptions. 52% of the advisers with higher value retirement clients (£250k or more of investable assets) reported that the majority of their clients are seeking to maintain living standards in retirement compared to 31% of advisers with average client assets below £250k. Conversely, paying off debt was more important for clients of advisers with lower average retirement client portfolios.
As one might expect, advisers with wealthier clients had fewer clients who are concerned about running out of money, but one might also expect they would be less inclined to think about downsizing. However, we saw little evidence of this: a relative lack of interest in downsizing or releasing housing equity was reasonably consistent across all respondents.
Going forward, we expect that the role of the financial adviser will extend further into “retirement coaching” and become less focused on just dealing with products and investments. Indeed, a number of firms are already centralising their advice processes with field advisers concentrating on understanding the client needs and providing more holistic retirement support. Advisers will, of course, aim to help clients achieve their objectives, but it will be as important, if not more so, to improve their clients’ financial wellbeing. That is, to help their clients feel confident in their relationship with money and to feel that they have control over their financial future.
We note the burgeoning focus on financial wellbeing from financial planners who want to help clients achieve their goals, not just maximise the value of the portfolio. Aegon are proud supporters of the Initiative for Financial Wellbeing (IFW). For more information on the IFW, visit https://initiativeforfinancialwellbeing.org.uk/.
Figure 15: Client hopes and fears in retirement
15
39 %
12 %
12 %
11 %
10 %
4 %
43 %
61 %
57 %
63 %
56 %
48 %
41 %
37 %
50 %
36 %
17 %
26 %
28 %
23 %
28 %
42 %
50 %
54 %
44 %
56 %
1 %
3 %
4 %
6 %
6 %
8 %
8 %
6 %
8 %
Expect to maintain the same standard ofliving in retirement as before retirement
Are concerned about their health andlongevity or that of their loved ones
Are worried about running out of moneybefore they die
Are concerned about long-term care andcosts
Are planning to travel and/or live overseas
Are concerned about replacing the socialaspects of work
Intend to use retirement lump sums toclear outstanding debt
Are daunted by the prospect of life afterwork
Are considering downsizing or releasingequity from property
Intend to find part-time employmentand/or start a business in retirement
The majority of my clients Some of my clientsVery few of my clients None of my clients

There is no doubt that advising clients in retirement presents a different set of challenges from advising them in accumulation. In particular, client objectives in retirement, such as required income or legacy, while more complex, may be easier to articulate precisely than objectives in accumulation which may simply focus on maximising wealth within certain risk constraints.
Arguably, it may be more appropriate to consider risk in terms of the likelihood of meeting those objectives, and the potential shortfall if the objective is not met, rather
than focusing on investment volatility as is often the case in accumulation. Cash flow modelling is likely to be an important tool to support the definition and development of those objectives.
The following chart shows various techniques used in delivering retirement advice. We asked advisers not just about their current use but, for those not using them today, whether they are likely to use them in the future.
Overall, use of these techniques is broadly consistent with what we reported in last year’s research. We would have expected to see more firms adopting cash flow modelling, scenario analysis and different sets of portfolios for retirement based on intentions stated in last year’s report, where around 10% of firms said they were likely to adopt these techniques over the next twelve months.
3. Retirement advice and investment approach
16
Figure 16: Techniques used to manage retirement income
3.1 Retirement advice techniques
44 %
51 %
34 %
41 %
31 %
6 %
19 %
12 %
11 %
9 %
9 %
11 %
9 %
11 %
6 %
22 %
11 %
19 %
24 %
18 %
20 %
7 %
25 %
13 %
35 %
Specific attitude to risk (ATR)questionnaire for retirement
clients
Cash flow modelling to estimate a client’s income needs year on
year
Specific set of fundchoices/portfolios for retirement
clients
Scenario analysis to assesspossible outcomes for different
market conditions
Different platforms/providers fordrawdown than accumulation
Have used this for 12 months or more Have introduced this in the past 12 months
Intend to use in the next 12 months May use in the future (more than 12 months away)
Do not intend to use
Make use
2021 vs 2020
50% -10%
71% +1%
47% -1%
52% No change
40% No change

17
Figure 17: Current use of retirement advice techniques by firm AuA
While there will inevitably be differences due to sampling from year to year, we conclude that there seems to have been limited development of retirement advice approaches over the past twelve months. This conclusion is consistent with what we hear from advisers directly. The business issues of dealing with the Covid-19 pandemic, and the challenges of volatile investment markets, have meant that innovation has been focused elsewhere.
It is interesting that the proportion of advisers who say they have no intention of adopting these techniques is virtually identical to last year’s survey. This further supports the idea that adviser attitudes to these techniques hasn’t changed significantly but that implementation has slowed.
There are some interesting variations in the use of these techniques across adviser firms as we see in Figure 17.
The most striking difference is in the use of a different Attitude to Risk (ATR) approach for retired clients. We see that larger firms are almost half as likely to use this than smaller firms. It’s not wholly clear why this should be the case though, in previous reports, we have found that larger firms sometimes find it more difficult to implement a consistent approach to advice across their business than smaller firms. The chart also suggests that larger firms are more likely to use cash flow modelling than smaller firms and are significantly more likely to use scenario analysis.
58 %64 %
45 %40 %
43 %
50 %
76 %
50 %
64 %
31 %30 %
77 %
45 %
59 %
48 %
Specific attitude to risk (ATR)questionnaire for retirement
clients
Cash flow modelling to estimate a client’s income
needs year on year
Specific set of fundchoices/portfolios for
retirement clients
Scenario analysis to assesspossible outcomes for
different market conditions
Different platforms/providersfor drawdown than
accumulation
Less than £50m £50m - £249m £250m or more
“There are advisers across the industry who are massively into cash flow, as the answer to everything. But in the main, most people use it because they think they have to justify an outcome rather than because they actually think it adds value to the outcome.”
It is interesting to note that over half of firms still use the same portfolios for retirement as they do for accumulation. There has been a lot of discussion of sequencing risk over recent years. However, investment markets have been relatively benign since Pension Freedom was introduced, delivering attractive returns with historically low volatility, at least until the pandemic hit. This may have contributed to firms not feeling they need to think very differently
about retirement investing, though we noted in last year’s report that there is extensive use of cash buffers for clients taking income which will have helped manage the impact of volatile markets. It will be interesting to see whether recent volatility and future market uncertainty lead more firms to think again about how they approach investing for clients seeking retirement advice.

As in previous years, we asked advisers how they approach investing for clients who are looking to take a regular income. The three main approaches to this are:• Total return approach – invest for total return with income payments funded by selling investments
• “Bucket” or time segmentation approach – dividing account into short, medium and long-term components to match future income needs
• Income-driven approach – income payments made from income paid on investments and perhaps topped-up by selling investments
The chart below details the extent to which our respondents use each approach.
Figure 18: Approach to structuring investment portfolios for retirement income
18
3.2 Structuring portfolios for retirement income
As in previous years, the total return approach remains most popular. This is consistent with the finding that most advisers use the same funds and portfolios for retirement as they do for accumulation since, generally, accumulation portfolios will be built on a total return basis.
What is notable though is that most advisers don’t just use a single approach and this pluralism seems to be increasing, albeit slowly. However, income-driven strategies are waning in popularity overall with 26% of advisers saying they never use them, up from 17% last year. Many advisers tell us that it’s not possible to meet client income expectations solely from natural investment income and so tend to discount
the income-oriented approach. No doubt this argument has become stronger given the impact of the pandemic on dividend payments and interest rates.
Our discussions with advisers also tell us that many are attracted to the “bucket” approach but find it difficult to implement. In particular, understanding when and how to rebalance between buckets is a challenge. Certainly, simply rebalancing on a regular basis undermines the main principle that underlies this approach which is to avoid having to realise assets at depressed market prices.
12 %
7 %
2 %
26 %
24 %
23 %
50 %
51 %
49 %
12 %
18 %
26 %
Total return approach
“Bucket” approach
Income-driven approach
Always use Use most of the time Sometimes use Never use
% Always use/ Use most of the time
2021 vs 2020 vs 2018
39% -9% -5%
31% -3% -2%
25% -3% -8%
19
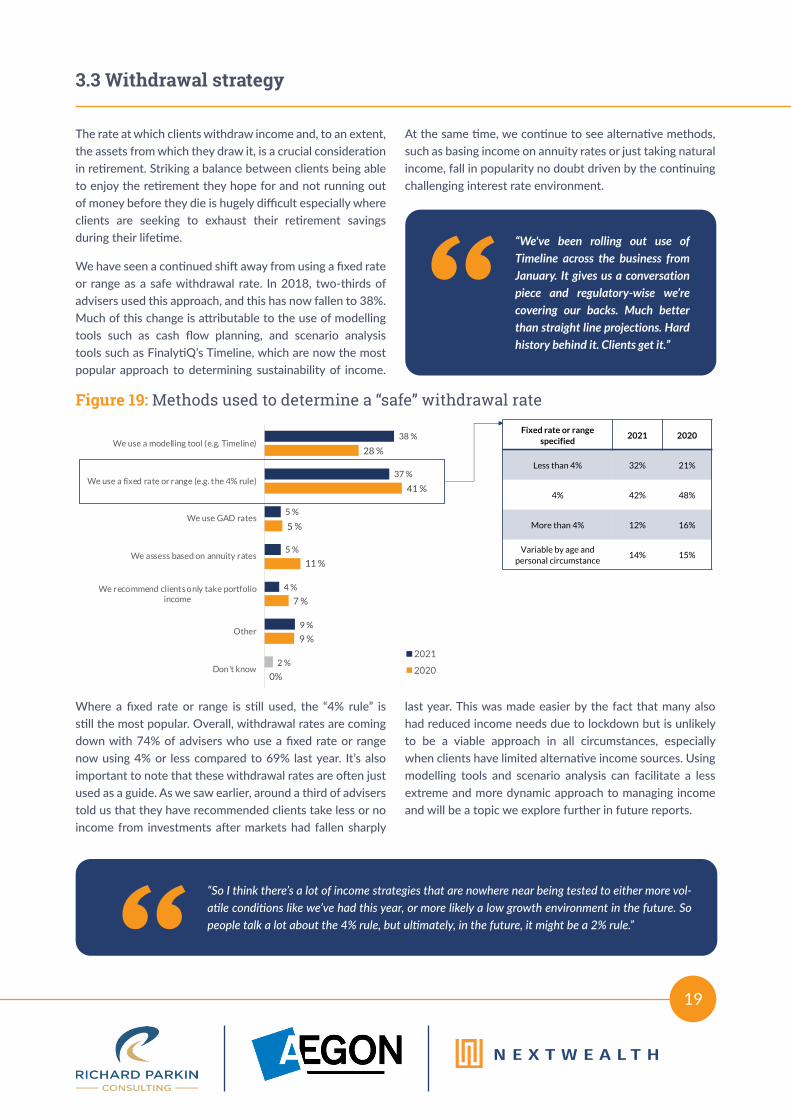
The rate at which clients withdraw income and, to an extent, the assets from which they draw it, is a crucial consideration in retirement. Striking a balance between clients being able to enjoy the retirement they hope for and not running out of money before they die is hugely difficult especially where clients are seeking to exhaust their retirement savings during their lifetime.
We have seen a continued shift away from using a fixed rate or range as a safe withdrawal rate. In 2018, two-thirds of advisers used this approach, and this has now fallen to 38%. Much of this change is attributable to the use of modelling tools such as cash flow planning, and scenario analysis tools such as FinalytiQ’s Timeline, which are now the most popular approach to determining sustainability of income.
At the same time, we continue to see alternative methods, such as basing income on annuity rates or just taking natural income, fall in popularity no doubt driven by the continuing challenging interest rate environment.
3.3 Withdrawal strategy
“We've been rolling out use of Timeline across the business from January. It gives us a conversation piece and regulatory-wise we’re covering our backs. Much better than straight line projections. Hard history behind it. Clients get it.”
Where a fixed rate or range is still used, the “4% rule” is still the most popular. Overall, withdrawal rates are coming down with 74% of advisers who use a fixed rate or range now using 4% or less compared to 69% last year. It’s also important to note that these withdrawal rates are often just used as a guide. As we saw earlier, around a third of advisers told us that they have recommended clients take less or no income from investments after markets had fallen sharply
last year. This was made easier by the fact that many also had reduced income needs due to lockdown but is unlikely to be a viable approach in all circumstances, especially when clients have limited alternative income sources. Using modelling tools and scenario analysis can facilitate a less extreme and more dynamic approach to managing income and will be a topic we explore further in future reports.
Figure 19: Methods used to determine a “safe” withdrawal rate
“So I think there’s a lot of income strategies that are nowhere near being tested to either more vol-atile conditions like we’ve had this year, or more likely a low growth environment in the future. So people talk a lot about the 4% rule, but ultimately, in the future, it might be a 2% rule.”
38 %
37 %
5 %
5 %
4 %
9 %
2 %
28 %
41 %
5 %
11 %
7 %
9 %
0%
We use a modelling tool (e.g. Timeline)
We use a fixed rate or range (e.g. the 4% rule)
We use GAD rates
We assess based on annuity rates
We recommend clients only take portfolioincome
Other
Don't know
2021
2020
Fixed rate or range specified
2021 2020
Less than 4% 32% 21%
4% 42% 48%
More than 4% 12% 16%
Variable by age and personal circumstance
14% 15%

The concept of phased drawdown, where clients crystallise their retirement savings in stages, has been around for many years. Pension Freedom allows even greater flexibility so that, subject to having sufficient tax-free cash entitlement, income withdrawals can be structured as a mixture of tax-free cash and taxable income in whatever proportion best suits the client’s tax position.
We asked advisers the extent to which, over the past three years, clients have taken the tax-free lump sum at retirement.
Overall, the position is mixed with 23% of advisers saying fewer clients had been taking the tax-free lump sum at retirement with the same proportion saying more had taken it. Where advisers told us fewer clients were taking the lump-sum at retirement the reasons for this are shown in Figure 21.
Using drip-feed drawdown is the biggest reason for this. By taking the tax-free cash in stages, advisers can ensure clients’ total income tax liability is minimised, perhaps by keeping overall taxable income payments within personal income tax allowances or within the basic rate tax band.
Another benefit of deferring taking all the lump sum at retirement is that it can continue to grow and so provide a higher value of tax-free cash later in retirement. Another reasons given for not taking the full amount were that clients didn’t need the money. Also, as discussed earlier, many clients are choosing not to access pension savings until other retirement savings have been exhausted thereby reducing the value of their assets that are subject to inheritance tax on death.
Significantly: 7%
Slightly: 16%
54%
Slightly: 21%
MO
RE: 23%LESS: 2
3%
NO CHANGE
Figure 20: Proportion of clients taking tax-free lump sum at retirement
Figure 21: Reasons for clients taking less tax-free cash at retirement (n=48)
20
3.4 Taking tax-free cash at retirement
42 %
79 %
10 %
2 %
Ensuring the majority of their pension iskept invested with potential for growth
Increased use of drip feed drawdown tomeet income requirement while
minimising tax bills
Other
Don’t know/ prefer not to say
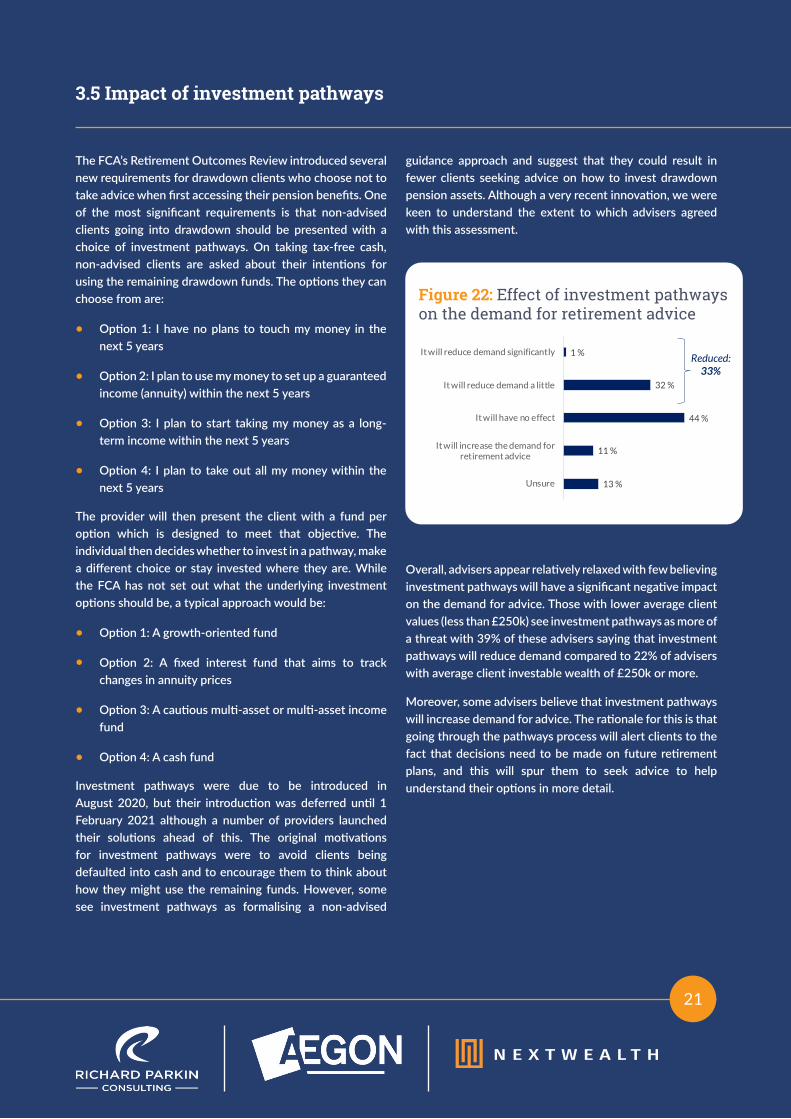
The FCA’s Retirement Outcomes Review introduced several new requirements for drawdown clients who choose not to take advice when first accessing their pension benefits. One of the most significant requirements is that non-advised clients going into drawdown should be presented with a choice of investment pathways. On taking tax-free cash, non-advised clients are asked about their intentions for using the remaining drawdown funds. The options they can choose from are:
• Option 1: I have no plans to touch my money in the next 5 years
• Option 2: I plan to use my money to set up a guaranteed income (annuity) within the next 5 years
• Option 3: I plan to start taking my money as a long-term income within the next 5 years
• Option 4: I plan to take out all my money within the next 5 years
The provider will then present the client with a fund per option which is designed to meet that objective. The individual then decides whether to invest in a pathway, make a different choice or stay invested where they are. While the FCA has not set out what the underlying investment options should be, a typical approach would be:
• Option 1: A growth-oriented fund
• Option 2: A fixed interest fund that aims to track changes in annuity prices
• Option 3: A cautious multi-asset or multi-asset income fund
• Option 4: A cash fund
Investment pathways were due to be introduced in August 2020, but their introduction was deferred until 1 February 2021 although a number of providers launched their solutions ahead of this. The original motivations for investment pathways were to avoid clients being defaulted into cash and to encourage them to think about how they might use the remaining funds. However, some see investment pathways as formalising a non-advised
guidance approach and suggest that they could result in fewer clients seeking advice on how to invest drawdown pension assets. Although a very recent innovation, we were keen to understand the extent to which advisers agreed with this assessment.
Overall, advisers appear relatively relaxed with few believing investment pathways will have a significant negative impact on the demand for advice. Those with lower average client values (less than £250k) see investment pathways as more of a threat with 39% of these advisers saying that investment pathways will reduce demand compared to 22% of advisers with average client investable wealth of £250k or more.
Moreover, some advisers believe that investment pathways will increase demand for advice. The rationale for this is that going through the pathways process will alert clients to the fact that decisions need to be made on future retirement plans, and this will spur them to seek advice to help understand their options in more detail.
21
3.5 Impact of investment pathways
Figure 22: Effect of investment pathways on the demand for retirement advice
1 %
32 %
44 %
11 %
13 %
It will reduce demand significantly
It will reduce demand a little
It will have no effect
It will increase the demand forretirement advice
Unsure
Reduced: 33%
22
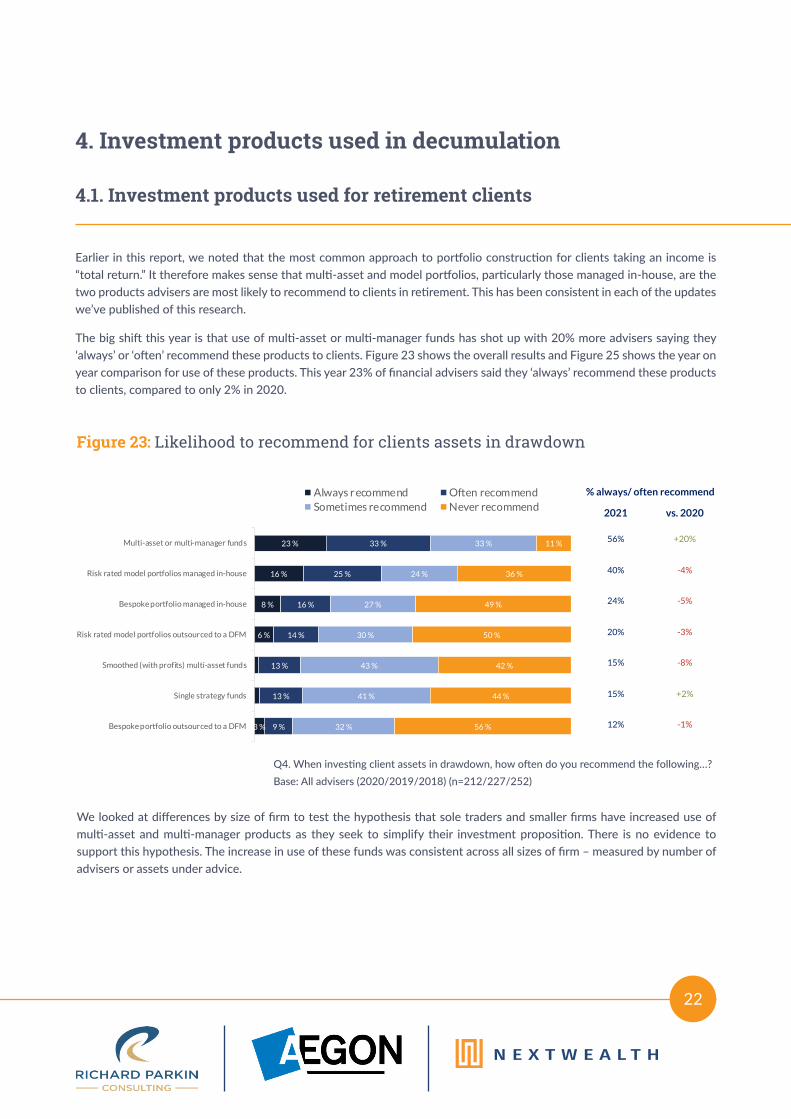
Earlier in this report, we noted that the most common approach to portfolio construction for clients taking an income is “total return.” It therefore makes sense that multi-asset and model portfolios, particularly those managed in-house, are the two products advisers are most likely to recommend to clients in retirement. This has been consistent in each of the updates we’ve published of this research.
The big shift this year is that use of multi-asset or multi-manager funds has shot up with 20% more advisers saying they ‘always’ or ‘often’ recommend these products to clients. Figure 23 shows the overall results and Figure 25 shows the year on year comparison for use of these products. This year 23% of financial advisers said they ‘always’ recommend these products to clients, compared to only 2% in 2020.
4. Investment products used in decumulation
4.1. Investment products used for retirement clients
We looked at differences by size of firm to test the hypothesis that sole traders and smaller firms have increased use of multi-asset and multi-manager products as they seek to simplify their investment proposition. There is no evidence to support this hypothesis. The increase in use of these funds was consistent across all sizes of firm – measured by number of advisers or assets under advice.
Figure 23: Likelihood to recommend for clients assets in drawdown
% always/ often recommend
2021 vs. 2020
56% +20%
40% -4%
24% -5%
20% -3%
15% -8%
15% +2%
12% -1%
23%
16%
8%
6%
33%
25%
16%
14%
13%
13%
9%
33%
24%
27%
30%
41%
43%
32%
11%
36%
49%
50%
44%
42%
56%
Multi-asset or multi-manager funds
Risk rated model portfolios managed in-house
Bespoke portfolio managed in-house
Risk rated model portfolios outsourced to a DFM
Single strategy funds
Smoothed (with profits) multi-asset funds
Bespoke portfolio outsourced to a DFM
Always r ecommend Often recommendSometimes recommend Never recommend
23 %
16 %
8 %
6 %
3 %
33 %
25 %
16 %
14 %
13 %
13 %
9 %
33 %
24 %
27 %
30 %
43 %
41 %
32 %
11 %
36 %
49 %
50 %
42 %
44 %
56 %
Multi-asset or multi-manager funds
Risk rated model portfolios managed in-house
Bespoke portfolio managed in-house
Risk rated model portfolios outsourced to a DFM
Smoothed (with profits) multi-asset funds
Single strategy funds
Bespoke portfolio outsourced to a DFM
Always recommend Often recommendSometimes recommend Never recommend
% always/ often recommend
2021 vs. 2020
56% +20%
40% -4%
24% -5%
20% -3%
15% -8%
15% +2%
12% -1%
Q4. When investing client assets in drawdown, how often do you recommend the following…? Base: All advisers (2020/2019/2018) (n=212/227/252)
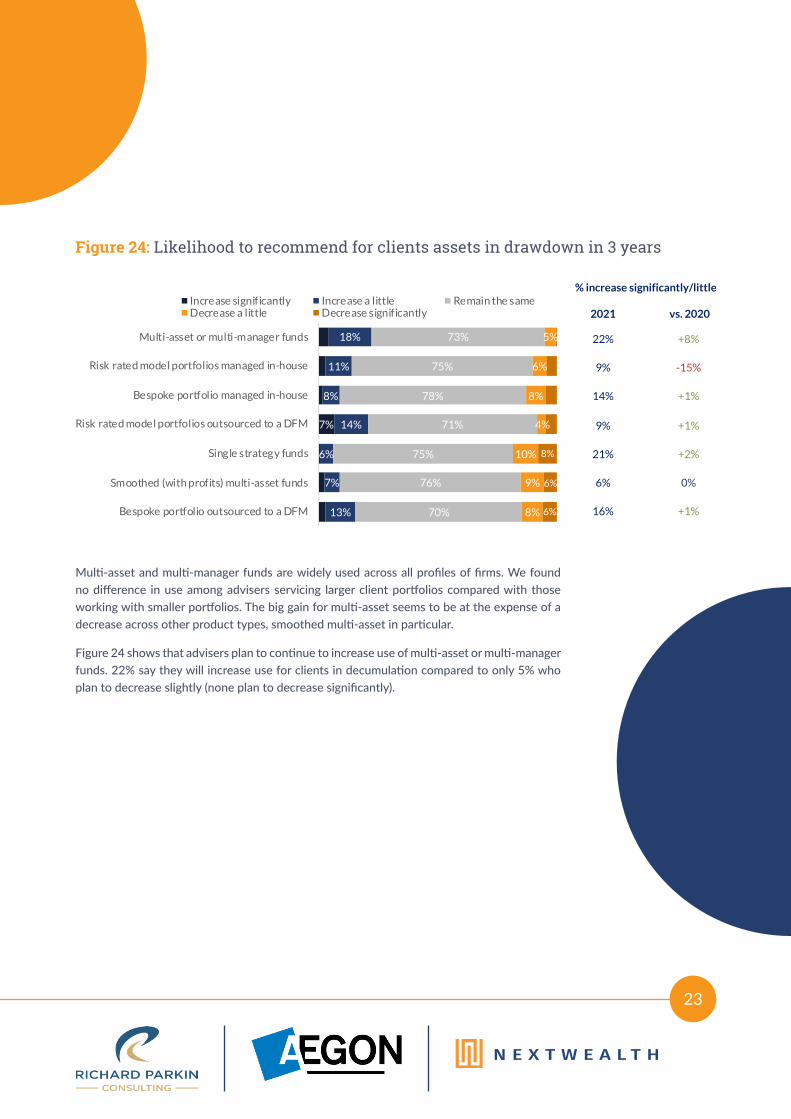
Figure 24: Likelihood to recommend for clients assets in drawdown in 3 years
7%
18%
11%
8%
14%
6%
7%
13%
73%
75%
78%
71%
75%
76%
70%
5%
6%
8%
4%
10%
9%
8%
8%
6%
6%
Multi-asset or multi-manager funds
Risk rated model portfolios managed in-house
Bespoke portfolio managed in-house
Risk rated model portfolios outsourced to a DFM
Single strategy funds
Smoothed (with profits) multi-asset funds
Bespoke portfolio outsourced to a DFM
Increase significantly Increase a little Remain the sameDecrease a little Decrease significantly
% increase significantly/little
2021 vs. 2020
22% +8%
9% -15%
14% +1%
9% +1%
21% +2%
6% 0%
16% +1%
Multi-asset and multi-manager funds are widely used across all profiles of firms. We found no difference in use among advisers servicing larger client portfolios compared with those working with smaller portfolios. The big gain for multi-asset seems to be at the expense of a decrease across other product types, smoothed multi-asset in particular.
Figure 24 shows that advisers plan to continue to increase use of multi-asset or multi-manager funds. 22% say they will increase use for clients in decumulation compared to only 5% who plan to decrease slightly (none plan to decrease significantly).
23
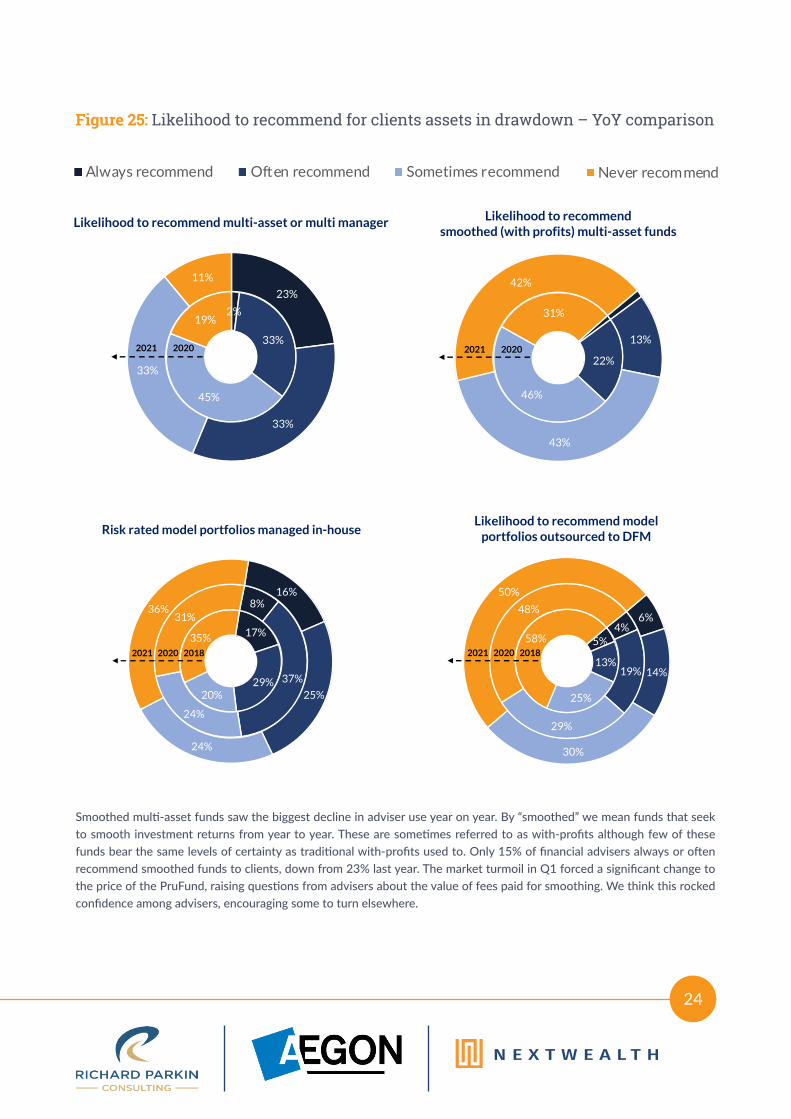
Figure 25: Likelihood to recommend for clients assets in drawdown – YoY comparison
16 %
8 %
17 %
25 %
37 %
29 %
24 %
24 %
20 %
36 %
31 %
35 %
2021
2020
2018
Always recommend Often recommend Sometimes recommend Never recommend
16 %
8 %
17 %
25 %
37 %
29 %
24 %
24 %
20 %
36 %
31 %
35 %
2021
2020
2018
Always recommend Often recommend Sometimes recommend Never recommend
16 %
8 %
17 %
25 %
37 %
29 %
24 %
24 %
20 %
36 %
31 %
35 %
2021
2020
2018
Always recommend Often recommend Sometimes recommend Never recommend
16 %
8 %
17 %
25 %
37 %
29 %
24 %
24 %
20 %
36 %
31 %
35 %
2021
2020
2018
Always recommend Often recommend Sometimes recommend Never recommend
Smoothed multi-asset funds saw the biggest decline in adviser use year on year. By “smoothed” we mean funds that seek to smooth investment returns from year to year. These are sometimes referred to as with-profits although few of these funds bear the same levels of certainty as traditional with-profits used to. Only 15% of financial advisers always or often recommend smoothed funds to clients, down from 23% last year. The market turmoil in Q1 forced a significant change to the price of the PruFund, raising questions from advisers about the value of fees paid for smoothing. We think this rocked confidence among advisers, encouraging some to turn elsewhere.
24
Likelihood to recommendsmoothed (with profits) multi-asset funds
22%
46%
31%
13%
43%
42%
20202021
17%
29%20%
35%
8%
37%
24%
31%
16%
25%
24%
36%
Risk rated model portfolios managed in-house
20202021 20185%
13%
25%
58%4%
19%
29%
48%6%
14%
30%
50%
Likelihood to recommend modelportfolios outsourced to DFM
20202021 2018
Likelihood to recommend multi-asset or multi manager
2%
33%
45%
19%
23%
33%
33%
11%
20202021

DFMs continue to have their fans and detractors. Half of advisers said they would ‘never’ outsource to a DFM either for model portfolios or bespoke portfolios. DFMs are sometimes perceived as expensive and better at growing portfolios than supporting withdrawals. There has been much talk about new propositions from DFMs to support retirement clients, but we’ve seen little true innovation as yet. One of the challenges is the agent as client framework under which DFMs offering services through 3rd party platforms typically operate. Agent as client usually means that the DFM can’t see the underlying client. This means the DFM cannot manage the tax or withdrawal strategy of individual clients.
Financial advisers do expect to increase use of DFM model portfolios: Figure 24 shows that 21% of advisers plan to increase use for clients in drawdown in the next three years. The objections we hear from advisers are a lack of product innovation to support clients in decumulation from DFMs and also the layering of costs.
On product innovation, we heard of two solutions in our research that address some of the DFM shortcomings. A large national is developing a series of target dated portfolios. As each target date approaches, the client and adviser decide if the client should take the income or invest in an annuity pot. The solution offers flexibility of income levels and reduces the cost of the annuity by deferring the purchase. Another innovative solution we heard about was a proposition combining a tool to model the withdrawal strategy integrated to DFM model portfolios.
We think these innovative solutions address a number of shortcomings of DFM portfolios for retired clients. But advisers also want products to be straightforward enough for clients to understand. Many solutions that sound great in theory end up too complex to be used in practice.
On cost of DFMs, one financial adviser we interviewed lamented the challenge posed by the cumulative cost of the supply chain in a low growth environment.
25
4.2 DFM model portfolios
“But the challenge of that is, all in with their fees, it’s probably about 1.6%. So, in a low growth environment, if you’re a medium risk client, making maybe 4%. If you net off 1.6% and our ongoing adviser charge of 75 basis points, that takes you to 2.3%. If inflation is run-ning at two and a half, you’re losing money in real terms, aren’t you?”
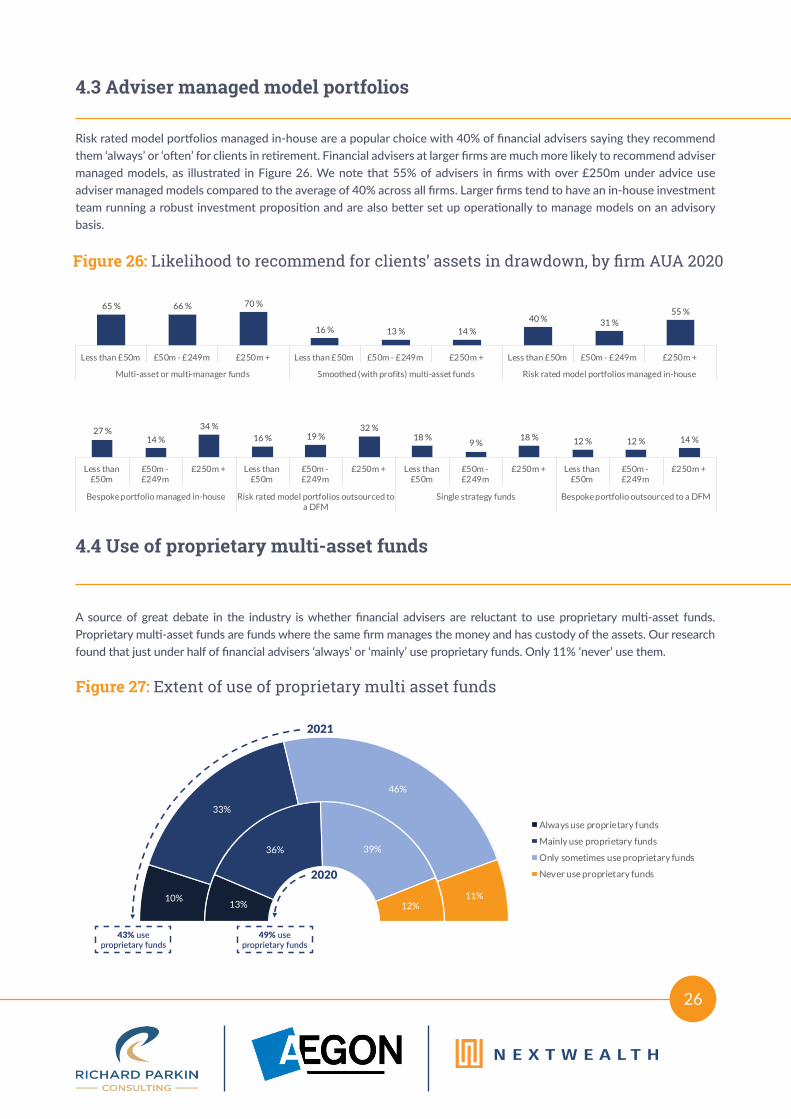
Risk rated model portfolios managed in-house are a popular choice with 40% of financial advisers saying they recommend them ‘always’ or ‘often’ for clients in retirement. Financial advisers at larger firms are much more likely to recommend adviser managed models, as illustrated in Figure 26. We note that 55% of advisers in firms with over £250m under advice use adviser managed models compared to the average of 40% across all firms. Larger firms tend to have an in-house investment team running a robust investment proposition and are also better set up operationally to manage models on an advisory basis.
A source of great debate in the industry is whether financial advisers are reluctant to use proprietary multi-asset funds. Proprietary multi-asset funds are funds where the same firm manages the money and has custody of the assets. Our research found that just under half of financial advisers ‘always’ or ‘mainly’ use proprietary funds. Only 11% ‘never’ use them.
26
Figure 26: Likelihood to recommend for clients’ assets in drawdown, by firm AUA 2020
Figure 27: Extent of use of proprietary multi asset funds
4.3 Adviser managed model portfolios
4.4 Use of proprietary multi-asset funds
65 % 66 % 70 %
16 % 13 % 14 %
40 % 31 %55 %
Less than £50m £50m - £249m £250m + Less than £50m £50m - £249m £250m + Less than £50m £50m - £249m £250m +
Multi-asset or multi-manager funds Smoothed (with profits) multi-asset funds Risk rated model portfolios managed in-house
27 %14 %
34 %16 % 19 %
32 %18 %
9 %18 % 12 % 12 % 14 %
Less than£50m
£50m -£249m
£250m + Less than£50m
£50m -£249m
£250m + Less than£50m
£50m -£249m
£250m + Less than£50m
£50m -£249m
£250m +
Bespoke portfolio managed in-house Risk rated model portfolios outsourced toa DFM
Single strategy funds Bespoke portfolio outsourced to a DFM
13%
36% 39%
12%10%
33%
46%
11%
Always use proprietary funds
Mainly use proprietary funds
Only sometimes use proprietary funds
Never use proprietary funds
2021
43% use proprietary funds
49% use proprietary funds
2020

ESG is a popular topic of discussion and has garnered much media attention in recent months. Other research from NextWealth suggests that most financial advisers take account of a client’s ethical considerations when constructing investment portfolios but few are integrating ESG criteria more broadly. About half of financial advisers say they consider ESG criteria only at the client’s request.
However, nearly one third say they consider ESG credentials among the criteria used to select and manage funds.
27
4.5 Use of ESG funds and solutions
Figure 28: Extent that Environmental, Social and Governance (ESG) issues are considered when building portfolios for retirement clients
Our interviewees confirmed that the demand is low from clients. That doesn’t mean they aren’t taking action. One adviser we spoke to has shifted to an ESG integrated DFM solution. He told us: “Clients aren’t asking about it. The industry is talking about it.”, but he concluded it was the right thing to do to make the shift.
Most of the advisers we spoke to are unsure how to approach determining a client’s ESG preferences and how to translate that into an investment portfolio.
“Problem we have is clients can be quite specific, like avoid tobacco or arms. Funds we use on the advisory side of the business, when we drill down, one of the funds will invest in something they don’t agree with.”
3 %
31 %
52 %
7 %
8 %
We apply a strict ESG screening process to allmanagers/funds selected
ESG credentials are amongst the factors we considerwhen selecting managers/funds
We consider ESG criteria only at the clients’ request
Other
Prefer not to say
Most agreed that there needs to be better standards in data and language to support wider adoption of ESG integrated investing.
28
“We’ve been kicking the can down the road really, with a view that until the rules came in… When we talk about this, what we’re constantly looking for is some sort of industry taxon-omy such that we can actually have a sensible conversation about this. We’ve sort of devel-oped our own in a way to lead people to where we think the answer is. When we talk about sustainable, responsible investing, it’s great, but every client’s going to be different.”
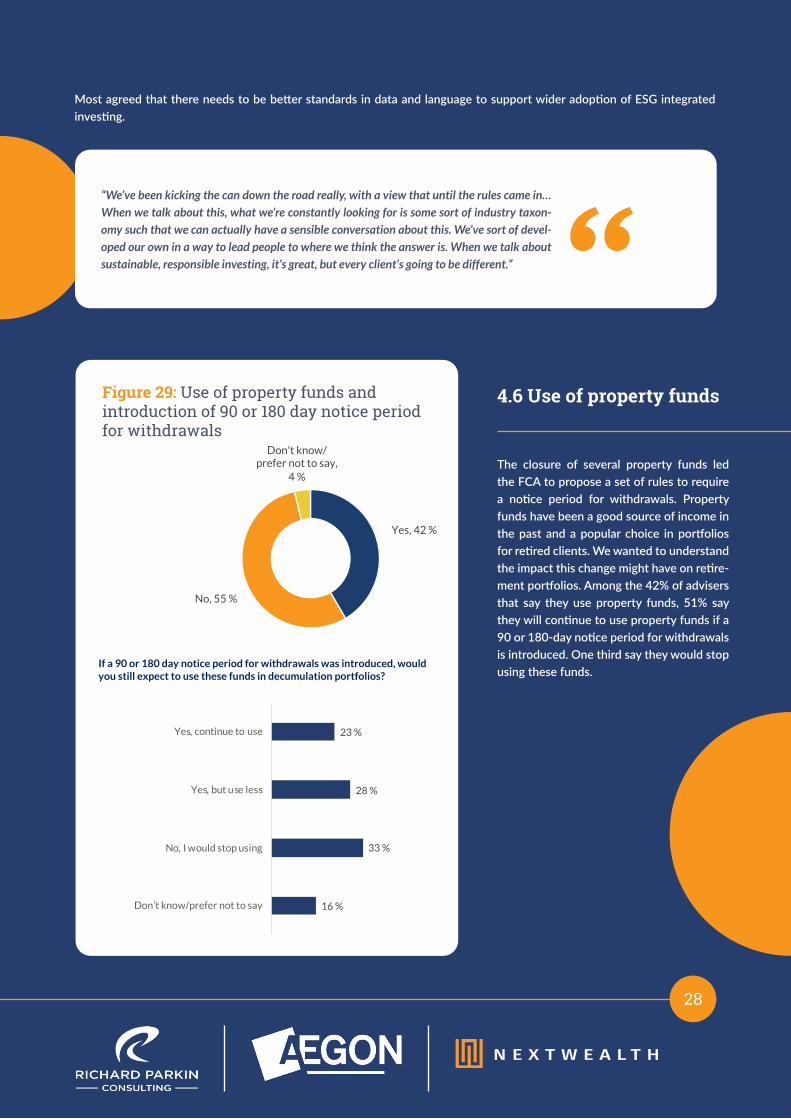
The closure of several property funds led the FCA to propose a set of rules to require a notice period for withdrawals. Property funds have been a good source of income in the past and a popular choice in portfolios for retired clients. We wanted to understand the impact this change might have on retire-ment portfolios. Among the 42% of advisers that say they use property funds, 51% say they will continue to use property funds if a 90 or 180-day notice period for withdrawals is introduced. One third say they would stop using these funds.
4.6 Use of property fundsFigure 29: Use of property funds and introduction of 90 or 180 day notice period for withdrawals
If a 90 or 180 day notice period for withdrawals was introduced, would you still expect to use these funds in decumulation portfolios?
23 %
28 %
33 %
16 %
Yes, continue to use
Yes, but use less
No, I would stop using
Don’t know/prefer not to say
If a 90 or 180 day notice period for withdrawals was introduced, would you still expect to use these funds in decumulation portfolios?
23 %
28 %
33 %
16 %
Yes, continue to use
Yes, but use less
No, I would stop using
Don’t know/prefer not to say
Yes, 42 %
No, 55 %
Don't know/ prefer not to say,
4 %

Our first report on retirement advice in 2018 was, in part, motivated by a desire to understand how the then booming market in defined benefit (DB) transfer advice would develop. Many of the advisers that we spoke to at that time were confident the market would continue to grow further but we were less convinced. The issues with mis-advice of British Steel scheme members were starting to emerge, professional indemnity insurers were getting nervous about the risk represented by advisers writing this business, and it was clear that the FCA was getting increasingly focused on the quality of advice being given.
5. Defined benefit pension transfer advice
29
Figure 30: Number of DB to DC pension transfers received
Source: FCA Retirement Income Data, September 2020
32,249
24,575
20,202 20,432
0
5,000
10,000
15,000
20,000
25,000
30,000
35,000
Apr - Sept 2018 Oct 2018 - Mar 2019 Apr - Sept 2019 Oct 2019 - Mar 2020
DB transfer activity peaked at the end of 2017 and has declined sharply since then. While the Office of National Statistics has discontinued its time series on pension transfers, the number of DB to DC transfers is now included in the FCA’s annual Retirement Income Data analysis, and this is shown in Figure 30. This only provides data to the end of March 2020 and, while DB transfers do seem to have plateaued after further sharp falls, we expect volumes during the rest of 2020 continued to fall.
5.1. Firms offering defined benefit transfer advice

As the chart shows, the proportion of firms offering DB transfer advice has contracted significantly again, and certainly by a greater extent than foreseen in last year’s report. Currently only 22% of firms offer DB advice with 2% of firms saying they will leave the market in the next 12 months. Moreover, over a third of firms who still give DB advice have, or expect to, significantly reduce how much of this business they do.
30
Figure 30: Approach to providing DB transfer advice
“It’s very, very difficult to do this because there’s a load of people doing wrong things with people, because they don’t care. There’s a hell of a lot of people out there, we’re trying to do the right thing. And now they won’t try and do the right thing anymore. They just won’t get involved because it’s just not worth it.”
In last year’s report we found that a significant proportion of firms had stopped providing DB transfer advice with 41% of firms offering it compared to 56% in 2018.
We asked those firms who have stopped, or intend to stop, giving DB transfer advice, and those who expect to significantly reduce the volume of this business, to rank the top three reasons that led to this decision.
5.2. Reasons for ceasing to offer DB transfer advice
44 %
34 %
2 %
8 %
13 %
0 %
40 %
17 %
3 %
15 %
23 %
2 %
We do not, and have not, provided DB advice inthe past 3 years
We used to provide DB advice but no longer doso
We provide DB advice but expect to stopproviding it in the next 12 months
We provide DB advice but have or expect tosignificantly reduce the volume of this
We provide DB advice and expect to continueto do so
We do not currently provide DB advice butintend to start doing so in the next 12 months 2021
2020
22% currently provide(2020: 41%)

31
Figure 32: Reasons for stopping or reducing the volume of DB transfer advice
30 %
30 %
10 %
18 %
3 %
3 %
4 %
75 %
75 %
37 %
34 %
20 %
16 %
11 %
Overall business risk of giving DB transferadvice
Increase in Professional Indemnity Insurancepremiums and excess
Limits imposed by PI insurer on volume ofbusiness
FCA supervisory activity
Lack of client demand
Proposed ban on contingent charging
Any other reason
Main Reason
Additional Reason
One of the key drivers of these decisions was the general risk of giving this type of advice. FOS compensation limits were increased from £150,000 to £350,000 for complaints referred to FOS after 1 April 2019 where the cause of complaint occurred after 1 April 2019. This limit has now been increased further to £360,000 and may well rise again in 2021. Combined with significant increases in professional indemnity insurance excesses and, in some cases, the exclusion of past DB transfer business from cover altogether, many firms could find themselves bankrupted by a small number of upheld complaints. Indeed, compensating DB transfer clients of failed advice firms is one of the main reasons for the sharp increase in FSCS levies on advisers.
Given this backdrop, and the further risk that the decline in markets as a result of the pandemic could increase compensation claims, we expect more firms will withdraw from the market completely over the coming year.
We asked advisers how long recent DB transfers had taken to complete.
Where advisers were able to answer this question, over 80% of transfers took at least 3 months with nearly a quarter of transfers taking more than 6 months. DB transfers are complex at the best of times involving significant client interaction, correspondence with the ceding scheme to understand benefits, and detailed analysis by the adviser. However, two-thirds of advisers told us that recent transfers have taken longer than usual to complete.
Figure 33: Time taken from initial conversation to completion of DB transfer
5.3. Time taken to complete a DB transfer
0 %
14 %
58 %
14 %
7 %
2 %
5 %
Less than 1 month
1 - 2 months
3 - 6 months
6 - 9 months
9 - 12 months
More than one year
Don’t know

32
Delays in the transfer process are not only frustrating for the client and their advisers but can lead to transfer values having to be recalculated. This in turn can lead to clients receiving a lower transfer than originally offered which could be a reason for complaint against the adviser. In the past, the main reason for delays was the tortuous process of gathering the necessary information on benefits from the ceding scheme provider. This traditional challenge was exacerbated by the effects of the pandemic lockdown on schemes' administration capacity and the Pensions Regulator also allowed schemes to suspend transfer activity between April and June 2020 because of the pandemic. However, it seems that recent delays are now as much due to firms’ stricter internal processes as they are to tardy responses from schemes.
Figure 34 Change in time to complete a DB transfer over past year
Figure 35: Cause of delay in completing recent pension transfer
52 %
3 %
0 %
42 %
3 %
Delay getting information from DBpension providers
Delay in processing by receivingprovider
Delay getting paperwork signed byclients due to social distancing
Longer process due to more stringentprocess in firm
Other, please specify
It has increased a lot,
30 %
It has increased a little, 36 %
Stayed the same, 23 %
Not sure, 11 %
3 %
19 %
52 %
13 %
0 %
0 %
13 %
Less than 2 weeks
2 - 4 weeks
1 - 2 months
3 - 6 months
6 - 9 months
9 - 12 months
Don’t know
Increased by..

33
Figure 36: Attitudes towards abridged advice
The FCA introduced a ban on contingent charging for DB transfer advice from 1 October 2020. This prevents firms from charging different levels of fee depending on what the outcome of the advice is. Prior to this, it was common for advisers not to charge a fee where the advice was not to transfer, or to charge an additional “implementation fee” where transfer was recommended. The FCA concern was that these arrangements incentivise advisers to recommend transfer.
While this ban may reduce the incentive for firms to recommend transfer, it also creates a barrier to clients seeking advice on DB transfers. Payment for transfer advice is almost always deducted from the transfer proceeds. If the advice is not to transfer, then the advice fee will have to be met directly by the client from other sources. Given the potential cost of this advice, the expectation is that few clients will be willing to take the risk of assessing whether they should transfer.
To help combat this, the FCA introduced “abridged advice” to allow advisers to identify where a transfer is unlikely to be in a client’s best interest. The expectation is that this will allow firms to identify these clients more cost-effectively than taking them through a full advice process.
Overall, advisers are more positive about abridged advice than they were a year ago with 60% now saying it’s an effective way of identifying clients for whom a transfer is not suitable. Moreover, only 11% of advisers disagreed with this, down from 19% last year. A third of advisers agreed that abridged advice would save sufficient time and be suitably priced to attract potential clients.
5.4. Abridged advice for DB transfers
(n=47 advisers that offer DB advice)
6 %
2 %
2 %
53 %
32 %
32 %
32 %
30 %
36 %
32 %
40 %
9 %
19 %
21 %
19 %
11 %
4 %
6 %
11 %
Abridged advice is an effectiveway of identifying clients for
whom a transfer is not suitable
As proposed, abridged advicewith full fact-find will savesufficient time to appeal to
customers
Abridged advice is a way ofidentifying individuals who qualify
for a carve out from thecontingent charging ban
Clients will be more willing to payfor abridged advice than full
transfer advice
Strongly agree Agree Neither agree nor disagree
Disagree Strongly disagree Unsure
% Strongly Agree/Agree
vs 2020% Strongly
Agree/Agree
60% +14%
34% -2%
32% N/A
34% -1%
34
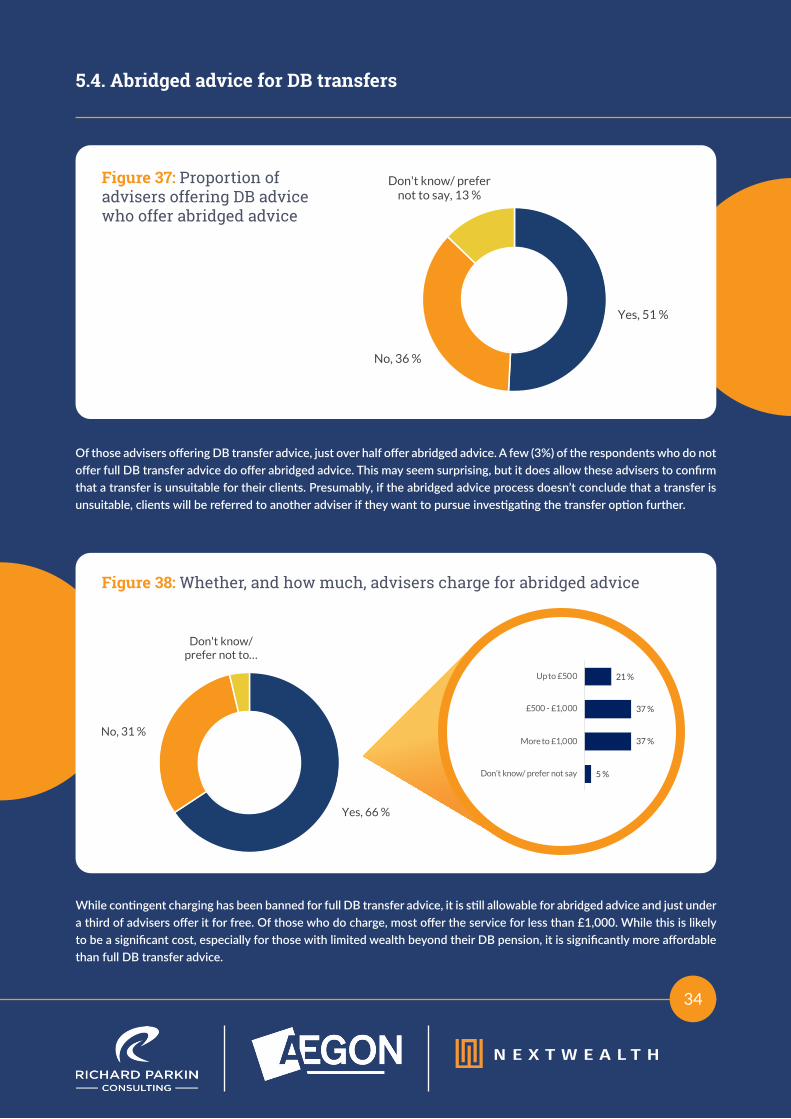
Figure 37: Proportion of advisers offering DB advice who offer abridged advice
Figure 38: Whether, and how much, advisers charge for abridged advice
Of those advisers offering DB transfer advice, just over half offer abridged advice. A few (3%) of the respondents who do not offer full DB transfer advice do offer abridged advice. This may seem surprising, but it does allow these advisers to confirm that a transfer is unsuitable for their clients. Presumably, if the abridged advice process doesn’t conclude that a transfer is unsuitable, clients will be referred to another adviser if they want to pursue investigating the transfer option further.
While contingent charging has been banned for full DB transfer advice, it is still allowable for abridged advice and just under a third of advisers offer it for free. Of those who do charge, most offer the service for less than £1,000. While this is likely to be a significant cost, especially for those with limited wealth beyond their DB pension, it is significantly more affordable than full DB transfer advice.
5.4. Abridged advice for DB transfers
21 %
37 %
37 %
5 %
Up to £500
£500 - £1,000
More to £1,000
Don’t know/ prefer not say
66 %
31 %
3 %
Yes
No
Don't know/ prefernot to say
Yes, 51 %
No, 36 %
Don't know/ prefer not to say, 13 %
Yes, 66 %
No, 31 %
Don't know/ prefer not to …
The FCA has focused on value for money across the value chain and we expect that theme to continue in the years ahead. The December 2020 Evaluation of the impact of the Retail Distribution Review and the Financial Advice Market Review published by the FCA, confirmed this focus. The regulator has challenged the value of ongoing fees in particular. This could lead financial advisers to focus more on clients in decumulation where the value of ongoing advice is easier to justify. Accumulation is perceived as more straightforward and some question the need for ongoing annual reviews. Decumulation can be much more complex, requiring focus on managing the investment strategy and withdrawal strategy amid very little certainty.
This leads to our second trend, a continued shift to retirement assets. In our survey for this report, financial advisers said that 58% of their assets are for clients seeking retirement advice and they expect that to increase to 63% in three years’ time. While the shift to retirement assets has slowed over the four years since we first published our report on retirement advice, we think the gradual shift will continue.
Part of this is a result of the regulator’s focus on value which will force financial advice businesses to focus on areas where they deliver value on an ongoing basis, one of which is advice in decumulation. Managing retirement portfolios is also increasingly complex, which will also fuel demand.
The challenge is of course that while value may increase, the pot of money on which fees are being earned will in most cases decline while the work involved may increase. Financial advice businesses need to carefully consider how to charge for their services.
“The fee side of things with clients and decumulation, fees based on AUM. Clients become less profitable as time goes on. How does fixed fee model work in that space?”
Trend: Shift to retirement assets for ongoing fees
Trend: Regulatory focus on value
35
One financial adviser we spoke to put it this way:
“I think there’s been too much in the past with advisers finding three, four pots and going, ‘Well, you obviously want things in one place, don’t you?’ Because it’s easier. And I’ll now charge you for managing that pot that really didn’t need managing. And I think the FCA have really got to the point where, if people are in accumulation, they almost don’t need an adviser on a regular basis, whereas in decumulation advisers really need to add a lot more value. I think that by accident, the FCA sort of hit this year with a real focus on value and charges and adviser fees.”
Conclusion Trends and
opportunities ahead
There has been a proliferation of systems and tools to support retirement advice. One adviser put it this way:
“The tech thing becomes a pain. Platforms, cash flow modellers, Timeline – very bitty in terms of the whole process. Doesn’t help
the client journey.”
In a column in CityWire’s New Model Adviser, Jennifer Ellis of Wellington Wealth estimated that the firm deals with 42 different online systems across the providers they work with.
“We deal with 42 separate agencies, which means 42 online systems to learn and 42 online client journeys or wizards to remember.” (https://citywire.co.uk/new-model-adviser/news/learning-42-provider-systems-that-can-t-be-the-meaning-of-life/a1431762)
Some advisers see an opportunity to help clients make behavioural changes that will allow them to make better decisions.
This report demonstrates that retirement advice continues to be critical to financial advice businesses with a continued shift expected among advisers to working with more retirement clients. From a suitable investment portfolio, to achieving financial goals and right through to achieving non-financial goals that bring meaning to advised clients. We are bullish about continued demand for quality financial advice and financial planning.
Advisers we spoke to believe that there is an opportunity to support clients with lower portfolio values but that their needs can’t be served under the current regulatory environment for advisers.
Trend: Simplification of systems and tools
Opportunity: Advice to drive behavioural change
Opportunity: advice and solutions for clients with lower value portfolios
“How can we help people connect more with what they re-ally want to do rather than do the same as everyone else; holidays, and cruises and stuff. The most impactful things for people tend to be around family, community, stuff that actually matters. Otherwise you spend £50 grand and you feel a bit empty because you didn’t really connect with why you were doing it in the first place. It was just what every-one says you’re supposed to do when you retire. Giving that money to a local homeless charity, you would have felt amazing about that, because that really matters. So being able to connect with people at that level, means we can be far more effective and open and hopefully help them be even happier.”
36
“We need a halfway point for some clients. I really worry there are a lot of people walking into problems. Nowhere to get proper advice. Someone in 40s/50s/60s with a bunch of different pensions. Need something - not full ser-vice, but not robo-advice. There are lots of opportunities for advice.”

Figure 1: Types of advice offered
37
The profile of respondents is similar to past years:
100 %
96 %
95 %
83 %
66 %
34 %
32 %
27 %
26 %
Personal retirement planning
Investment & saving
ISAs / OEICs / Unit trusts
Personal protection
Taxation planning
Mortgages
Investment trusts
Equity release
Structured investment products
Figure 2: Firm status
Figure 3: Assets under firm’s advice (AUA)
Figure 4: Individuals providing advice within firm
87 %
13 %
Independent
Restricted
2020: 11%
2020: 89%
34 % 33 % 34 %
43 % 48 % 44 %
12 %9 %
10 %
4 % 6 % 6 %4 % 2 %3 % 3 % 3 %
More than 100
51 - 100
21 - 50
11 - 20
6 - 10
2 - 5
1
20 or more individuals:
7%
17 %
29 %
19 %
14 %
9 %
6 %
6 %
£0 - £19m
£20m - £49m
£50m - £99m
£100m - £249m
£250m - £499m
£500m - £999m
£1bn or more34 % 33 % 34 %
43 % 48 % 44 %
12 %9 %
10 %
4 % 6 % 6 %4 % 2 %3 % 3 % 3 %
More than 100
51 - 100
21 - 50
11 - 20
6 - 10
2 - 5
1
2021 20 or more client facing
financial advisers:
7%
Respondent profile

In the UK Aegon is a leading provider of pensions, investments and protection. Our purpose is to help our nearly four million customers achieve a lifetime of financial security.
Aegon’s roots go back more than 175 years – to the first half of the nineteenth century. Since then, Aegon has grown into an international company, with businesses in the Americas, Europe and Asia. Today, Aegon is one of the world’s leading financial services organisations, providing life insurance, pensions and asset management.
Richard Parkin Consulting is an independent research and consulting business providing insight and advice to pension providers, asset managers and others on all aspects of pension and retirement strategy, proposition design and product development. We combine strategic insight with a detailed understanding of the business challenges and technical complexities of defining and delivering change projects.
The NextWealth Directory lists and reviews all of the tech providers supporting financial advice businesses. It is free to use and already and has 1,700 reviews from people working in financial adviser businesses. From back office systems to cash flow modelling – we publish ratings and reviews. Read a review. Leave a review. nextwealthdirectory.co.uk
Contact [email protected] for media enquiries. For more information visit www.aegon.co.uk.
NextWealth is a research, data and events business helping firms to adapt and thrive amid disruption. We focus on retail investing and in particular the financial advice market, investment propositions and adviser technology.
To find out more about how we can help you build a successful retirement business contact [email protected].
About Aegon
About NextWealth
About Richard Parkin Consulting
38
To sign up to our research panel, email [email protected].