
The Earned Income Tax Credit - SSCC - Homescholz/Research/EITC_Survey.pdf · chapter, we review the...
81
The Earned Income Tax Credit V. Joseph Hotz University of California, Los Angeles, and NBER [email protected] and John Karl Scholz University of Wisconsin–Madison and NBER [email protected] August 29, 2002 We thank Robert Moffitt for guidance, Janet Holtzblatt for comments and for teaching us a lot about the EITC over the years, Dan Feenberg and the NBER for putting TAXSIM on the Web, and Janet McCubbin, Bruce Meyer, Jeffrey Liebman, John Wolf, and conference participants for helpful suggestions.
Transcript of The Earned Income Tax Credit - SSCC - Homescholz/Research/EITC_Survey.pdf · chapter, we review the...

The Earned Income Tax Credit
V. Joseph Hotz University of California, Los Angeles, and NBER
and
John Karl Scholz University of Wisconsin–Madison and NBER
August 29, 2002
We thank Robert Moffitt for guidance, Janet Holtzblatt for comments and for teaching us a lot about the EITC over the years, Dan Feenberg and the NBER for putting TAXSIM on the Web, and Janet McCubbin, Bruce Meyer, Jeffrey Liebman, John Wolf, and conference participants for helpful suggestions.

Abstract Since its inception in 1975, the Earned Income Tax Credit (EITC) has grown into the largest federally funded means-tested cash assistance program in the United States. In this chapter, we review the political history of the EITC, its rules, and its goals, and we provide a broad set of program statistics on its growth and coverage. We summarize conceptual underpinnings of much of the recent economic research on the EITC and discuss participation in the credit and compliance with its provisions, as well as its effects on labor force participation and hours of work, marriage and fertility, skill formation, and consumption. We note that participation rates of the credit are high, as are rates of credit noncompliance, and that there are theoretical reasons to prefer the EITC to other antipoverty programs if the objective is to encourage work among the poor. We also note that the predicted effects of the EITC are not all pro-work, especially with respect to hours and its labor market incentives for two-earner couples. We summarize the existing empirical research on the behavioral effects of the EITC, with particular emphasis on the effects of the 1986, 1990, and 1993 expansions of the credit on labor force participation and hours of work. The literature provides consistent evidence, generated from a variety of empirical approaches, that the EITC positively affects labor force participation. The literature also finds small, negative effects on hours of work for secondary workers. We conclude the chapter with a discussion of ongoing EITC-related policy debates and highlight what, if any, critical economic issues underlie these debates. V. Joseph Hotz John Karl Scholz Department of Economics Department of Economics University of California, Los Angeles University of Wisconsin – Madison Los Angeles, CA 90095-1477 Madison, WI 53706 and NBER and NBER [email protected] [email protected]

1
I. Introduction
The Earned Income Tax Credit (EITC) grew from $3.9 billion in 1975 (in 1999 dollars), the
first year it was part of the tax code, to $31.5 billion in 2000. No other federal antipoverty
program has grown at a comparable rate. In 2000 EITC spending was within $4 billion of the
combined federal spending on Temporary Assistance for Needy Families (TANF) and food
stamps.1
The growth of the EITC has been even more striking given the antipathy most Americans
express toward welfare, at least prior to welfare reform in 1996, and the rhetoric of both political
parties about recognizing the limitations of government programs.2 The EITC’s popularity
relative to means-tested cash transfers like the former Aid to Families with Dependent Children
(AFDC) and new TANF programs stems, at least in part, from the perception that the EITC
rewards work.
The credit began as part of a broader effort by Senator Russell Long (D-LA) to derail
congressional and presidential interest in a negative income tax (NIT) in the late 1960s and early
1970s. The initial debates highlighted a tension that exists to this day. The attraction of the NIT
was that as a universal antipoverty program it would provide a guaranteed minimal standard
of living to all in an administratively efficient way (though the tax system) without having the
notches and high cumulative marginal tax rates that characterize a patchwork system of narrower
programs. Sen. Long’s primary objection to the NIT was that it provided its largest benefits to
those without any earnings, and hence would dull the labor market attachment of poor families.
1The FY2002 budget showed total food stamp spending in 2000 at $18.3 billion and total TANF spending at $18.4 billion. 2Views on welfare are illuminated by questions on the General Social Survey, which asks, “Are we spending too much money, too little money, or about the right amount on welfare?” In the 1972−82 surveys, 54.8 percent of the respondents replied “too much.” In the 1996 survey, 57.7 replied “too much,” though the percentage giving this response had fallen to 45.8 percent in 1998 and to 38.9 percent in 2000.

2
His alternative, initially called the “work bonus,” would phase in and thus increase with earnings
up to a point.
Over the years, the EITC has played different tax policy, labor market, and antipoverty
roles. In Section II, we review the political history of the EITC, its rules, and its goals, and we
provide a broad set of program statistics that summarize its growth and coverage. Various goals
of the program occasionally come into conflict. For example, when the EITC was increased as
part of the 1993 budget bill, it was singled out as an important antipoverty program that has
positive (relative to alternatives) labor market incentives. Around the same time, however,
studies of EITC noncompliance suggested that the credit was difficult for the Internal Revenue
Service (IRS) to administer. One’s view of the credit will be influenced significantly by the
weight one places on its antipoverty effects, its labor market effects, and the ability of the IRS to
administer the credit.
The core of this chapter is a discussion of EITC-related behavioral issues and research.
Section III provides EITC program statistics. As would be expected with a program that has
more than tripled in size (in real dollars) in the 1990s, a considerable amount of attention has
been paid to the EITC in recent years. In Section IV, we outline the conceptual underpinnings of
much of this recent work and discuss EITC participation and compliance, its effects on labor
force participation and hours of work, marriage and fertility, skill formation, and consumption.
In this overview, we show that there are theoretical reasons to prefer the EITC to other
antipoverty programs if the objective is to encourage work among the poor. At the same time, the
predicted effects of the EITC are not all pro-work, especially with respect to hours and its labor
market incentives for two-earner couples. But a policy focus only on labor markets would be
overly narrow, since it is clear that the EITC has the potential to affect a much broader set of

3
economic behaviors.
Section V reviews the evidence to date on these behavioral issues. Given the design and size
of the credit, it is not surprising that it delivers significant resources to working poor families. A
large set of studies examine the credit’s labor market effects, as would be expected given that a
central distinction between the EITC and NIT approach to antipoverty policy is the likely
superiority of the EITC in encouraging labor force participation. Recent studies also have
focused on the degree to which expansions of the EITC over the last 20 years can account for
trends in labor force participation for single women with children in the United States.
As highlighted in Moffitt (1998), many studies over the last 10 years have examined the
effects of programs like AFDC, Medicaid, and Food Stamps on family structure and children’s
well-being. These studies have been motivated by a growing concern that public assistance
programs contributed to the rise in out-of-wedlock childbearing and female headship, two
behaviors associated with the incidence of poverty, especially among children. Until very
recently, however, little attention has been paid to the effects of the EITC expansions on these
same behaviors. We discuss recent EITC-related studies of this issue. We also discuss recent
studies of the EITC’s effect on consumption patterns of the poor. Because the credit is
administered through the nation’s (and, in some cases, state’s) income tax systems, EITC
payments to low-income households are typically received once a year, as an adjustment to tax
liabilities or refunds. This payment pattern contrasts to monthly payments typically associated
with AFDC/TANF and food stamps, and may provide a way to gain additional insight into the
nature of credit markets and consumption behavior for low-income families.
Our goal in Section V is to summarize succinctly what has been done, to evaluate the
strengths of this work, and to identify areas where additional work could be useful to either

4
verify existing conjectures or alter what we thought was known.
In the final sections, we briefly discuss EITC-related policy debates and highlight what, if
any, critical economic issues underlie these debates. We also briefly identify issues on which
future research is needed.
II. Program History, Rules, and Goals3
It is not surprising that fundamental tensions in the design of the safety net emerge at
different points in the program’s history, given the EITC’s status as the largest cash or near-cash
antipoverty program. In the mid-1960s and early 1970s there was a great deal of discussion about
the appropriate design of antipoverty policy. At the risk of oversimplifying, one part of the
policy debate focused on either direct earnings subsidies (of which the EITC is one) or on
subsidies paid to employers to hire disadvantaged workers. Remnants of the latter approach are
found in the current, modest Work Opportunity and Welfare-to-Work Tax Credits that are part of
the federal income tax.4 A problem with earnings or employment subsidies is that they do
nothing for adults (and the children that live with them) who are unable or unwilling to work.
Consequently, they must be matched with programs that help provide food, housing, health care,
and other basic needs to those not in the labor market.
The EITC was established amidst the political debate over the negative income tax that
occurred in the 1960s and 1970s. The NIT held great promise to the early designers of the War
on Poverty since it would solve the difficult integration issues that arise with categorical
antipoverty programs the need for bureaucracies to administer and enforce eligibility and
benefit rules and the need to mitigate potentially high marginal tax rates that recipients face as
3Our discussion of the EITC’s political history comes directly from Liebman’s (1997a) and Ventry’s (2000) interesting accounts. 4For further discussion of employment subsidies and a broader treatment of employment strategies for low-wage labor markets, see Killingsworth (2002), Bishop and Haveman (1978), and Haveman (1996).

5
earnings increase. Partly for these reasons, in 1966 an NIT was the capstone of the Office of
Economic Opportunity’s the federal agency in charge of conducting the War on Poverty plan
to eradicate poverty. President Johnson, however, opposed the NIT and a leading alternative
proposal at the time, a guaranteed annual income, on the grounds that both proposals undermined
work effort. Without support of the president, a negative income tax was not adopted.
Nevertheless, in the late 1960s and early 1970s, the government launched the first widespread
social experiments, the Gary (Indiana), New Jersey, Iowa, and Seattle-Denver Income
Maintenance Experiments, to examine the effects of a negative income tax.
In 1969 President Nixon introduced a negative income tax called the Family Assistance Plan
(FAP) that would have replaced the AFDC program. Though it enjoyed widespread initial
support, FAP was subsequently attacked by liberals as being insufficiently generous and by
conservatives as being overly expensive and having insufficiently stringent work requirements.
Russell Long, then Chair of the Senate Finance Committee, opposed the FAP and, as an
alternative, designed a proposal targeted at those willing to work. His 1972 proposal included a
large public service jobs component and a “work bonus” equal to 10 percent of wages subject to
Social Security taxation. FAP was defeated in 1972, but Sen. Long aggressively pushed his work
bonus scheme over the next three years. His efforts were aided by the confluence of three events.
First, from 1960 to 1970 the payroll tax rate increased to 4.8 percent from 3.0 percent (on both
employers and employees), and it increased further to 5.8 percent in 1973, which focused
attention on the rising tax burdens of low-income families. Second, fostered in part by the
income maintenance experiments, there continued to be a great deal of intellectual attention paid
to the NIT and NIT alternatives in think tanks, universities, and government agencies. Third, a
recession started in 1974. This prompted members of Congress in 1975 to try to stimulate

6
aggregate demand by refunding $8.1 billion in 1974 income taxes, and cutting 1975 income
taxes by an additional $10 billion. With passage of a tax bill in 1975, Sen. Long was able to
enact a variant of his work bonus, called the EITC, on a temporary, 18-month basis. The
provision added a 10 percent supplement to wages up to $4,000 ($12,387 in 1999 dollars) for
taxpayers with children and it phased out at a 10 percent rate over the $4,000 to $8,000 income
range.
Sen. Long undoubtedly understood that once a provision is in the tax code, it is likely to
remain. Indeed, the EITC remained in the tax code each subsequent year until it was made
permanent in 1978. Legislation in 1978 also added a flat range to the EITC’s phase-in and phase-
out ranges, as shown in Figure 1.5 An “advance payment” option was also added to the credit in
1978, so that workers would be able, if they desired, to receive the credit incrementally
throughout the year.
Spending on the safety net slowed in the late 1970s and shrank in the 1980s. Between 1978
and the Tax Reform Act of 1986 (TRA86), the fact that the tax credit (and tax code) was not
indexed for inflation caused a substantial erosion of the EITC’s real value. TRA86, as part of its
provisions to eliminate income taxes on families with incomes below the poverty line, increased
the EITC to the point where the maximum credit in 1987 equaled the real value of the credit in
1975. TRA86 also indexed the credit for inflation. During this period the EITC continued to be
supported by liberals and conservatives, both of whom were sympathetic to the idea of reducing
tax burdens on low-income families and rewarding work.
Through much of the 1980s and into the 1990s, deficits were a dominant topic in
Washington economic policy discussions. By 1990, annual deficit forecasts exceeding $300 5The phase-in rate for the credit was 10 percent on earnings up to $5,000, for a maximum credit of $500. Over the flat portion of the schedule, the maximum credit was available for taxpayers with earnings between $5,000 and $6,000. The phase-out rate for the credit was 12.5 percent on incomes between $6,000 and $10,000.

7
billion “as far as the eye can see” were common, so that year President Bush agreed to
abandon his “no new taxes” pledge and meet with Democratic leaders of Congress to fashion
deficit-reduction legislation. The tortuous negotiations led to the 1990 tax bill, which phased out
exemptions and itemized deductions on high-income taxpayers and raised the highest marginal
tax rate from 28 percent to 31 percent. Whereas distributional issues have always played a role in
tax policy, they played an exceptionally important role in 1990, perhaps because of the antipathy
of Democratic congressional leaders toward the Republican president and the sense by those
leaders that policy in the 1980s disfavored low-income families.6 The EITC proved to be a
straightforward way to alter the distributional characteristics of various deficit-reduction
packages, and distributional tables became an important factor behind the 1990 EITC expansion
that was phased in over three years. In 1991, the credit for the first time was also made larger for
taxpayers with two or more children than for taxpayers with one child.
Another major change to the EITC occurred as part of the 1993 budget bill. In his first State
of the Union Address, President Clinton said, “The new direction I propose will make this
solemn, simple commitment: by expanding the refundable earned income tax credit, we will
make history; we will reward the work of millions of working poor Americans by realizing the
principle that if you work 40 hours a week and you’ve got a child in the house, you will no
longer be in poverty.” This declaration completed the evolution of the EITC from Sen. Long’s
modest “work bonus” to a major antipoverty initiative. President Clinton set a target for the
EITC: full-time work at the minimum wage plus the EITC (and any food stamps a family is
eligible for) should be enough to raise the family’s net-of-payroll-tax income above the poverty
6Many of the newspaper articles about 1990 budget talks emphasized distributional issues. See, for example, “GOP’s Tax Proposal Said to Favor Wealthy; Budget Talks Proceeding at ‘Glacial’ Pace,” Washington Post, 9/14/90 (A12); and “Budget Negotiations Recess Amid Confusion on Progress; Officials Disagree on Extent of Disagreement,” Washington Post, 9/18/90 (A1).

8
line. To achieve this goal, the EITC was again increased, and increased sharply for families with
two or more children.7
The 1993 budget bill (and EITC expansion) passed by one vote in the Senate and received
not a single supporting Republican vote. This too marked a transformation in the EITC’s
political history. For the first time, the EITC became a policy linked exclusively to Democrats. In
subsequent years, there have been highly partisan battles over EITC-related issues.
EITC Rules
To receive the earned income credit, taxpayers file their regular tax return and fill out the
six-line Schedule EIC that gathers information about qualifying children. The EITC is
refundable, meaning that it is paid out by the Treasury regardless of whether the taxpayer has
any federal income tax liability. There are several basic tests for EITC eligibility. The taxpayer
must have both earned and adjusted gross income below a threshold that varies by year and by
family size. Most EITC payments go to taxpayers with at least one “qualifying child.” A
qualifying child needs to meet age, relationship, and residence tests. The age test requires the
child to be younger than 19, younger than 24 if a full-time student, or any age if totally disabled.
The relationship test requires the claimant to be the parent or the grandparent of the child or for
the child to be a foster child.8 Under the residence test the qualifying child must live with the
taxpayer at least six months during the year.9 Another rule limits the sum of taxable and tax-
7 The specific goal was achieved only for families with fewer than three children, and only after the minimum wage was increased in 1996 and 1997. 8 Until late 1999, a foster child was any child for whom the claimant cared for “as if the child is their own.” The caring stipulation still holds, but now the child must also be placed in the home by an authorized placement agency. Prior to the 2001 tax legislation, EITC-eligible foster children also needed to live with the taxpayer for 12, rather than 6, months. 9In 1990 (tax year 1991) the residency and AGI tiebreaker (see below) tests replaced a support test, since in principle it is easier to verify where a child lives than it is to verify who supports a child. Under the support test the taxpayer had to pay for at least half the child’s support, where items like transfer payments (i.e., AFDC and housing subsidies) and child support were not considered support provided by the taxpayer.

9
exempt interest, dividends, net capital gains, rents, royalties, and “passive” income to less than
$2,350 (indexed for inflation).
In 2001, taxpayers with two or more children could receive a credit of 40 percent of income
up to $10,020, for a maximum credit of $4,008. Taxpayers (with two or more children) with
earnings between $10,020 and $13,090 received the maximum credit. Their credit was reduced
by 21.06 percent of earnings between $13,090 and $32,121. The EITC schedule in 2001 for
families with two or more children is shown in Figure 1. A small credit available for childless
taxpayers between the ages of 24 and 65 with very low incomes was added in 1994. The credit
rate for these taxpayers is 7.65 percent, and the maximum credit in 2001 was $364. Table 1
shows the complete evolution of income eligibility thresholds, credit rates, and phase-out (or
implicit tax) rates.
Figure 2a shows total tax payments and marginal tax rates for two-parent, two-child families
in Illinois (a state with relatively high tax rates on low-income families) in 1998.10 We assume
workers bear the full burden of payroll taxes, so the employer and employee share of payroll
taxes is 14.2 percent.11 The marginal tax rate line is initially at �25.8 percent, reflecting the sum
of the 14.2 percent effective payroll tax rate and the �40 percent EITC rate. The flat portion of
the EITC occurs around $10,000, where the Illinois household would face a 3 percent marginal
state tax rate. Effective rates are 38.3 percent over much of the phase-out range, reflecting the
sum of the 14.2 percent payroll tax, the 21.1 percent EITC phase-out, and the 3 percent Illinois
state income tax. Rates jump to 53.3 percent between $25,000 and $29,000 as this family enters
10Nineteen states impose positive (but typically small) state income taxes on families of four with incomes below the poverty line (Johnson, 2001). 11Employers and employees both contribute 7.65 percent of earnings as payroll taxes, but the standard incidence assumption for payroll taxes implies that after-tax earnings would be 7.65 percent larger in the absence of payroll taxes, so the effective payroll tax rate is (.153 / 1.0765) or 14.2 percent.

10
the 15 percent bracket of the federal income tax.12 The corresponding average tax burdens are
shown in the bars. Two-parent, two-child Illinois families would have negative combined income
and payroll taxes up to roughly $17,200.13
Figure 2b shows the analogous situation for the same type of family in 1984, before the
1986 tax reform, and the 1990 and 1993 EITC expansions, all of which reduced taxes on low-
income families. The pattern of marginal and average tax rates is strikingly different from what
applied in 1998. The payroll tax (7 percent on employers and employees) was almost as high as
it is now, resulting in an effective rate of 13.1 percent. The EITC was only 10 percent on
incomes up to $7,844 (in 1998 dollars), so even taxpayers with very low incomes faced positive
marginal rates. The EITC was phased out at a 12.5 percent rate beginning at $9,413 (again, in
1998 dollars). In addition, the 11 percent federal marginal tax bracket started at around $9,413 of
income. Thus, all but the lowest-income families faced marginal tax rates of at least 28 percent,
and some faced significantly higher marginal rates.
In calendar year 2001, 14 states and the District of Columbia had EITCs as part of their state
income tax systems.14 The parameters of these credits are summarized in Table 2. Most are
structured as percentages of the federal credit and use the same eligibility definitions. In New
York, for example, the state EITC was 25 percent of the federal credit in 2001, rising to 30
percent by 2003. Ten of the state EITCs (including D.C.) are refundable and most make the
credit available to workers without qualifying children. 12The EITC phase-out rate is lower for taxpayers with one child, but because they only receive one child credit and have one less personal exemption, one-child families in 2002 begin to pay the federal 10 percent marginal income tax rate at an income of $22,850. Hence, EITC recipients with one child and incomes between $22,850 and $29,201 have cumulative marginal tax rates around 40 percent (including payroll taxes). 13Low-income families would generally file returns because their incomes exceed filing thresholds or to get back withheld taxes. With the $600 child credit along with exemptions of $3,000 and the standard deduction of $7,850, a married couple with two children in 2002 will not have a positive income tax liability until their earnings exceed $31,850, even without the EITC. 14 This discussion is from Johnson (2001).

11
Two unusual features show up in state EITCs. Wisconsin’s state EITC has a three-tiered
schedule equaling 4 percent of the federal credit for taxpayers with one child, 14 percent of the
federal credit for taxpayers with two children, and 43 percent of the federal credit for taxpayers
with three or more children. This schedule was developed with explicit reference to the higher
incomes needed to keep families with three or more children out of poverty. The Minnesota
schedule includes a second phase-in range to combat the problem that increases in wages or
hours for certain minimum-wage workers made them no better off because of the loss of cash
assistance and food stamps and increases in taxes (see Johnson, 2001, page 21, for more details).
The state credits in combination with the federal credit can be substantial. A family with
three or more children earning $9,600 in Wisconsin, for example, could receive a combined state
and federal EITC of $5,457, or a 57 percent supplement to their earned income.
Interaction with Other Social Welfare Programs
The tax system operates independently of transfer programs, so there is relatively little
interaction between the EITC and other programs. In 1979 (as part of a technical corrections bill)
Congress required both advance and lump-sum EITC payments to be treated as earned income
for AFDC, food stamp, and SSI recipients. The 1981 tax legislation went even further in
requiring welfare agencies to assume that individuals eligible for both the EITC and AFDC
received the EITC incrementally through the year, thus likely lowering AFDC and food stamp
benefits. In 1984 this position was reversed and states were allowed to reduce AFDC benefits
only when they could verify that individuals actually received the EITC. The 1990 tax legislation
prohibited the counting of the EITC as income or as a resource in the month received or in the
following month when determining eligibility for AFDC, Medicaid, food stamps, SSI, and low-
income housing benefits. Finally, the 1993 Mickey Leland Hunger Act prohibited counting the

12
EITC for the first 12 months after receipt for food stamp eligibility and benefits. Beyond these
time intervals, the EITC could cause potential recipients to fail program asset tests.
Since the abolition of AFDC, it has not yet become clear how the EITC will interact with
state TANF programs. There are two major issues. First, states now have the authority to count
the EITC as income when determining eligibility for their welfare programs. Second, many
TANF programs contain employer subsidies and other job-related activities, which may or may
not trigger tax obligations and potential EITC payments. The 1997 budget bill made clear that
the EITC could not be claimed on income resulting from “community service” and “work
experience” jobs funded under TANF. Other situations will be judged by their “facts and
circumstances” under the general welfare doctrine.15 The law is not yet well developed in this
area.
Quality Control and Noncompliance
Relative to alternative delivery mechanisms, the EITC is inexpensive to administer. Most
EITC recipients would be required to file a tax return even in the absence of the credit, so the
marginal cost of obtaining the EITC is simply the small cost of filling out Schedule EIC. The
cost to the IRS is also quite small. The IRS has a budget of roughly $8 billion to serve some 120
million individual taxpayers and 15 million corporations. The incremental cost of administering
the EITC is surely a very small fraction of this total. The costs of administering two other major
income-support programs for low-income families are much higher. Administrative costs in
FY1995 were $3.7 billion for food stamps and $3.5 billion for AFDC, though a significant
portion of those costs also paid for client services.
15A loose description of the general welfare doctrine is that if payments are made for the general welfare, meaning payments are public support for a disadvantaged family, they are not taxable and do not trigger the EITC. If payments are more job-related, they are less likely to be viewed as payments made to support the general welfare and more like compensation for services rendered. In this case they would be taxable and trigger the EITC.

13
A system based largely on self-assessment (like the U.S. income tax) will have lower
administrative costs than a more bureaucratic approach, but it will also have higher
noncompliance. The most recent study of EITC noncompliance examined returns filed in 2000
(for tax year 1999) and found that of the $31.3 billion claimed in EITC, between $8.5 and $9.9
billion, or 27.0 to 31.7 percent of the total, exceeded the amount to which taxpayers were eligible
(Internal Revenue Service, 2002b).
Of the errors the IRS was able to classify, roughly half involve qualifying-child errors.16
About half of these arose because the child claimed was not the taxpayer’s qualifying child. Of
these errors, the most common problem was that EITC-qualifying children failed to live for at
least six months (see footnote 8 for the rules applying to foster children) with the taxpayer who
was claiming the child. Reasons for mistakes of this type can run the gamut from innocent
taxpayers running afoul of complex IRS rules to fraud. Consider, for example, a divorced couple
where the divorce agreement gives the dependency exemption to the noncustodial parent, who in
turn is regularly paying child support. Since the noncustodial parent receives the dependency
exemption, that parent could easily assume that he or she could also claim the child to receive the
EITC if they are otherwise qualified. But in this case the claim would be inappropriate, since the
child does not live with the claimant for more than six months. In the category of clear
noncompliance, consider the situation described in the ethnographic study of Romich and
Weisner (2000). They write that “one woman relies on her mother to baby-sit her younger
daughter every weekend. The grandmother also buys school clothes for the child. In return for
this care, the grandmother ‘gets hers back at the end of the year’ by (illegally) filing the child as
her dependent and receiving an EITC” (page 1256).
16Also see McCubbin (2000), Scholz (1997), U.S. General Accounting Office (1998), and Holtzblatt (1991) for discussions of earlier EITC compliance studies.

14
Two other sources of qualifying-child errors arise with the adjusted gross income (AGI)
tiebreaker and relationship rules. The AGI tiebreaker rule stipulated that if two people could
legitimately claim the same EITC qualifying child (such as a mother and grandmother in the
same house), the one with the greater income was supposed to. Something like a tiebreaker rule
is necessary to establish legitimacy in cases where more than one taxpayer claims the credit
based on the same child. But it led to outcomes, where, for example, a parent who lived and
cared for a child could not claim the child because the child’s grandparent also lived in the house
and had a higher income. The AGI tiebreaker rule was simplified beginning in 2002 and now
applies only if two taxpayers actually claim the same EITC-qualifying child. This change should
significantly reduce errors related to the AGI tiebreaker rules, which accounted for 17.2 percent
of all errors in 1999. The relationship test is violated when the person claiming the EITC-
qualifying child is not the child’s parent (including the parent of an adopted child, stepchild, or
foster child) or grandparent.
The IRS found that 21.4 percent of overclaims resulted from income-reporting errors. These
problems may arise from both underreporting and overreporting income (including
underreporting of investment income, which could make a taxpayer ineligible for the EITC).
This category also includes situations where a married couple living together chooses to file two
separate tax returns (perhaps two head of household returns, or one head of household and one
single return), strategically splitting their incomes and children to maximize the EITC.
Another source of EITC errors arose in situations where the taxpayer filed as single or head
of household but should have used the married-filing-separate status. Like other sources of error,
these can range from the innocent to blatant. For example, the custodial parent in a married
couple that separates but does not get a divorce should, in some cases, file a joint or married-

15
filing-separate return rather than file as a head of household, where they may be more likely to
be eligible for the credit.17 Only the savviest taxpayers would likely understand these rules.
Several EITC changes since the 1999 compliance study may have beneficial effects on
EITC compliance. One that has already been mentioned is the change to the AGI tiebreaker
test.18 Another initiative was put in place as part of the 1997 budget agreement, in which
Congress directed the Secretaries of Treasury and Health and Human Services to jointly use the
Federal Case Registry (FCR) of Child Support Orders to improve the accuracy of EITC claims.
The FCR typically identifies a child, the custodial parent, and a noncustodial parent. Since a
large fraction of EITC errors arise in cases where someone other than the person living with the
child is claiming the child for EITC purposes, the FCR has the potential to allow the IRS to
identify a substantial number of noncompliant cases, where previously they had no useful
information to scrutinize residence claims about EITC-qualifying children. It is too early to know
whether the FCR’s apparent potential can be realized, though the system will be used by the IRS
to target pre-refund audits in 2002 and Congress has given the IRS authority to treat an EITC
claim by a noncustodial parent as a “math error” during return processing beginning in 2004.19
The rate of EITC noncompliance appears higher than the overall U.S. tax gap, where it is
estimated that 17 percent of total taxes are not paid (Internal Revenue Service, 1996).20 Although
compliance appears to be very high for wage and salary income, presumably because of third-
party information reporting, compliance rates on self-employment income, sales of business
17See Holtzblatt and Rebelein (1999, page 8) for a discussion of the “abandoned spouses” rules. 18Income and foster child definitions have also been simplified. 19Whereas the FCR would appear to be a promising compliance tool, the data in the registry could be low quality; living arrangements could be fluid, making the FCR data insufficiently up-to-date; or it could be infeasible or inefficient (from a cost-benefit standpoint) to use FCR data during processing to stop questionable refund claims before money is paid out. Once inappropriate EITC claims are paid out, it is very difficult to get the money back. 20 There is some question about the reliability of the tax gap estimates since the underlying data are from 1988.

16
property, certain types of capital income, and income earned in the informal sector are
comparable and in some cases far worse than EITC compliance rates.
III. Program Statistics
Table 3 provides information on the maximum real EITC benefit (in 1999 dollars) over
time, real expenditures, and caseloads since the credit was established in 1975. For the first 16
years of the credit, the real value of the maximum EITC never exceeded its 1975 value by more
than $10. Real spending on the credit increased sharply starting with the 1986 EITC expansion.
Prior to 1986, the EITC cost between $2.6 and $4.7 billion. The 1986 expansion roughly doubled
total spending on the credit by increasing the maximum credit (to make up for the loss in the
value of the credit due to inflation), indexing the credit, and extending its phase-out range. The
credit rate, maximum credit, and spending increased every year from 1990 through 1996 as a
consequence of the three-year phase-ins of the 1990 and 1993 EITC increases. Real EITC
spending more than tripled in the 1990s.
The evolution of the number of EITC claimants shown in Table 3 closely mirrors the
changes in EITC statutes and, to a lesser extent, business cycle changes. Between 5.2 and 7.4
million taxpayers claimed the credit between 1975 and 1986. By extending EITC eligibility to
taxpayers with incomes up to an indexed level of $18,576 in 1988, the 1986 EITC changes
increased the number of EITC recipients by roughly 50 percent. The phased-in 1990 expansions
also modestly increased the income thresholds that determine EITC eligibility, so the number of
recipients increased by roughly 1 million per year from 1990 to 1993. The number of claimants
increased by roughly 4 million as a consequence of the childless-worker credit that became
available for the first time in 1994. Possibly in part due to increased compliance efforts, the
number of EITC claimants has been constant since 1995, despite the increasing labor force

17
participation rate of single-parent families.
It appears that the EITC reaches a large percentage of its intended beneficiaries. Scholz
(1994) used matched data from tax returns and the Survey of Income and Program Participation
(SIPP) to calculate that 80 to 86 percent of taxpayers eligible for the EITC appeared to receive it
in 1990.21 Developments since 1990 have an ambiguous effect on EITC participation rates. The
maximum credit has increased sharply since then, from $1,215 to around $3,800 in 1999 dollars,
and the credit extends further up in the income distribution, where filing propensities are high.
The IRS, state agencies, and nonprofit organizations have also expanded outreach efforts.
However, there has been a steady increase in labor force participation of single women with
children (Meyer and Rosenbaum, 2000, 2001), and new workers in this group presumably have
lower filing propensities than typical workers in the population. Hill, Hotz, Mullin, and Scholz
(1999), for example, suggest that EITC participation rates for single mothers who recently had
been on AFDC in California were in the range of 42 to 54 percent in 1993 and 1994. In addition,
the IRS no longer will intervene (as it did until the early 1990s) and award the credit when
taxpayers file and appear eligible, but do not take the credit. Instead the IRS sends a letter to
taxpayers encouraging them to consider filing an amended return. EITC compliance efforts may
also have discouraged some eligible taxpayers from claiming the credit.
The Internal Revenue Service (2002a) used data from the Current Population Survey (CPS)
matched to tax returns and data from the SIPP for calendar year 1996 to estimate that of the
households that appeared to be eligible for the EITC, between 82.2 and 87.2 percent filed tax
returns and hence either claimed the EITC, or likely received a notice from the IRS telling them
they may have been eligible. These calculations suggest that the EITC changes between 1990
21Blumenthal, Erard, and Ho (1999) present similar participation rates for 1988, making use of detailed audit data from the 1988 Taxpayer Compliance Measurement Program.

18
and 1996 had relatively little net effect on EITC participation.
Liebman (2000) uses matched data from the 1990 Current Population Survey and tax returns
to examine the characteristics of EITC-eligible taxpayers. He writes (page 1178):
50 percent of eligible 1990 EITC taxpayers are married, while 30 percent are formerly married, and 20 percent have never been married. A little more than half are white, a quarter are Black, and 18 percent are Hispanic. Of eligible EITC recipients, 74 percent have a high school education or less; 44 percent live in the South; and 36 percent live in a central city. Fifty-eight percent work 1500 hours or more, though this average is brought down by married couples in which one spouse does not work. Sixteen percent of eligible EITC tax returns are filed by individuals in households that receive welfare income during the year and 26 percent are in households receiving food stamps.
It is difficult to predict how the characteristics of EITC participants have evolved between 1990
and now. The income threshold at which the EITC is fully phased out has increased from
$20,000 to over $30,000 (nominal) dollars since 1990. Many taxpayers have incomes in that
range, so it is likely that EITC recipients appear somewhat more affluent than what Liebman
found. At the same time, labor force participation rates of single women with children have
increased over this period, and many of these new workers have low levels of human capital.
Antipoverty Effects, Target Efficiency, Distributional Impact The EITC was available in 2001 only to taxpayers with earned income and adjusted gross
income less than $32,121 if they had more than one qualifying child, $28,281 if they had one
qualifying child, and $10,708 if they had no qualifying children. Scholz and Levine (2001)
calculate that in April 1997 over 60 percent of EITC payments went to taxpayers with pre-EITC
incomes below the poverty line and roughly half of total payments directly reduced the poverty
gap.22 Liebman (1997a) plots density functions for EITC payments following the 1993 expansion
22The HHS poverty guidelines for 2002 are $8,860 for a one-person family, $11,940 for two-person families, $15,020 for three-person families, and $18,100 for four-person families.

19
that show a right-skewed distribution, centered at roughly $13,000, with most payments going to
families with incomes between $7,000 and $26,000.23
Figure 3 presents data from 1999 tax returns on the distribution of EITC returns and
payments by adjusted gross income class for EITC claimants with children. Roughly 23 percent
of claimants are in the phase-in range of the credit and they receive 24 percent of total payments.
Roughly 19 percent are in the flat range and they receive 26 percent of total payments. The
remaining 58 percent of claimants are in the phase-out range of the credit; they receive roughly
half of total payments. Of the 19.3 million total EITC claims in 1999, 3.2 million had no
qualifying children and they claimed $0.6 billion, 7.8 million had one qualifying child and they
claimed $12.0 billion, and 8.2 million had two or more and they claimed $19.3 billion. Data are
not available for the distribution of EITC claims by filing status.
Because the EITC is based on annual family income and not wages, it is possible that people
with high hourly wages who, for some reason or another, choose to work relatively few annual
hours could receive the credit. In fact, the evidence suggests that in low-wage labor markets,
incomes and wages are tightly linked. Scholz (1996) describes tabulations from SIPP showing
that roughly two-thirds of EITC payments go to taxpayers with wages in the bottom 25
percentile of all workers with children (below $6.43 per hour) and more than 95 percent of all
EITC benefits are paid to workers with wages below the median of $9.42 per hour. Liebman
(1997a) reports that in 1990, 75 percent of EITC recipients worked at least 1,000 hours and 60
percent worked more than 1,500 hours per year. Incomes and wages are now even more tightly
linked for EITC recipients since EITC-eligible taxpayers cannot have more than $2,350 of
capital (and net capital gains) income. 23 Burkhauser, Couch, and Glenn (1996) compare the distributional effects of the EITC and minimum wage. They show the EITC is much more “target efficient” than minimum wage increases, if the objective of policy is to increase incomes of low-income workers.

20
Liebman (1997a) also presents calculations that provide an interesting perspective on the
importance of the EITC in low-wage labor markets. Between 1976 and 1996, the share of
income received by the lowest fifth of the population fell from 4.4 percent to 3.7 percent. The
share received by the top 5 percent increased from 16.0 percent to 21.4 percent over that period.
Liebman’s calculations show that for households with children, the EITC offsets 29 percent of
the decline in incomes in the first quintile of the population and 9 percent of the decline in the
second quintile.
A more direct measure of the EITC’s importance is that in 1997 and 1998 it removed 4.3
million persons from poverty (Council of Economic Advisers, 1998, 2000). Recalling President
Clinton’s antipoverty goal for the EITC, a full-time (2000 hours) minimum-wage worker
heading a single-parent, two-child family would earn $10,300 in wages and be eligible for a
$3,656 EITC in 1997. The poverty line for this family was $12,802.24 The combination of full-
time minimum wage work and the EITC for a family of three in 1986 was $7,226 while the
poverty line was $8,737. A full-time minimum-wage worker receiving the EITC and heading a
family of three in 1975, the first year of the EITC, would have had an income of $107 above the
poverty line of $4,293.
IV. Review of Behavioral Issues
In this section we consider several conceptual issues related to the behavioral effects of the
EITC.
Program Participation: Claiming the EITC Perhaps the most basic behavioral issue associated with the EITC is whether eligible
24 A married family with two children would have had an EITC and earnings of $13,956, and the poverty line was $16,400. We look at 1997 since this is the most recent minimum wage increase. Given the absence of minimum-wage indexing, full-time minimum-wage work supplemented by the EITC after 1997 will be a smaller percentage of the poverty line than in 1997.

21
taxpayers actually file tax returns to receive it. At first glance the analytic underpinnings of this
decision appear straightforward: the benefit of filing for the credit is the dollar value of the
EITC. The costs include the transactions costs associated with filing a return (for those who
would not otherwise file) and gathering the necessary information to claim the EITC (or
resources to pay a professional tax preparer). These cost-benefit considerations lead to
straightforward implications. Claiming the credit becomes more likely in cases where the
potential credit is larger and where the filer’s familiarity with the program and the U.S. tax
system is greater.
From the work of Holtzblatt (1991), McCubbin (2000), and others, however, we know that a
significant fraction of taxpayers receive the EITC when they are not technically eligible. Thus, a
focus on participation among eligibles may, in some circumstances, be too narrow. For
policymakers and scholars interested in overall EITC participation, participation and compliance
issues are intertwined. Even when thinking about participation of eligibles, participation and
compliance are linked, since legitimate current-year claims, for example, may lead to scrutiny of
past tax returns or the possibility that funds may be garnished to cover defaulted student loans,
past taxes, or child support.
Compliance issues can usefully be thought of in the classic tax evasion framework of
Allingham and Sandmo (1972). Taxpayers will adopt an optimal reporting strategy, weighing the
trade-off between the return to misreporting a dollar of income and the corresponding increased
risks of detection and penalty. Interestingly for the case of the EITC, some taxpayers may gain
by overreporting income, a situation the IRS has little experience with.25 Also, unlike the classic
tax evasion model that focuses on income reporting, a central issue with EITC noncompliance
25Steurele (1991) has referred to this phenomenon as the “superterranean economy.”

22
has to do with the residence of the qualifying child. The IRS (until perhaps recently) has had
little information with which to examine these claims.
The Decision to Work and Hours of Work
As noted in both the introduction and political history of the EITC, one of the arguments
frequently given for the EITC is that it provides stronger work incentives than the negative
income tax or entitlement programs like AFDC, Food Stamps, and Medicaid. This assessment,
while true in a comparative sense, obscures a complicated set of work and labor supply
incentives created by the EITC for different household structures and individuals at different
parts of the income distribution. As a result of these complicated incentives, the overall effect of
the EITC on hours of work is ambiguous.
The simplest framework in which to consider the work incentive effects of the EITC is the
static labor-leisure model displayed in Figure 4. In this stylized setting, the EITC creates, for
eligible households, an expanded budget constraint, shifting out the constraint from ade to abcde.
The phase-in region is represented by the segment ab, the flat region by bc, and the phase-out
region by cd. Consider the implications for individuals who do not work, whose well-being is
indexed by utility level, 0IU , in the absence of the EITC. As illustrated in Figure 4, the
introduction of the EITC induces such individuals to enter the labor force and work, and their
utility increases to 1IU from 0
IU . The EITC creates an incentive for these nonworkers to enter the
labor force since it increases the marginal value of working by raising the effective wage. More
formally, the rise in the effective wage rate due to the EITC for individuals initially out of the
labor force results in only a positive substitution effect and no income effect.
Figure 4 also displays preferences for two additional types of individuals, indexed by II and
III, who, in the absence of the EITC (or other social programs), would participate in the labor

23
force. As can be seen, the introduction of an EITC program does not alter their decision to work.
Thus, the incentive effects of the EITC with respect to labor force participation are
unambiguously positive: the EITC will encourage some workers to enter the labor force and
should not induce individuals, low-skilled or otherwise, to leave it. This result stands in contrast
to the labor force participation predictions that arise with programs related to the negative
income tax (like AFDC), where a guaranteed benefit at zero hours of work creates incentives for
some people to leave the labor force.
At the same time, the predicted effect of an EITC from the simple static labor-leisure model
on the extent of work, i.e., number of hours of work, is ambiguous. As Figure 4 illustrates, this is
because of the differential effects that the credit has in its flat and phase-out regions. The EITC
structure implies different marginal returns to work (i.e., effective marginal wage rates) for
different parts of the preprogram income distribution. For Type II individuals, who would
participate in the labor force in the absence of the EITC, the introduction of the EITC does not
change the value of their time in the labor market and only alters the income they can receive
through the tax credit. As such, there is only an income effect associated with the introduction of
the EITC for Type II individuals. Whether this income effect is negative (leisure is a normal
good) or positive is not clear a priori. The empirical evidence on income effects associated with
labor supply decisions suggests that leisure is a normal good, so, as illustrated in Figure 4, the
EITC may result in a reduction of hours of work for this type of individual.
The phase-out region of the EITC is relevant for the Type III individuals in Figure 4. These
individuals, as drawn, have an incentive to reduce their hours of work enough so that they
actually receive a credit. This final case illustrates the potentially negative effect on hours that is
generated in the phase-out region of the EITC. There the EITC implies a lower effective wage

24
rate relative to the absence of the EITC, which, by itself, results in a negative substitution effect.
In addition, there is an income effect that, if negative, will lead to a further reduction in hours of
work.
The above considerations suggest that the consequences of the EITC expansions for
affecting the work behavior of low-income workers are more complicated than the commonly
held view that the EITC is pro-work. In particular, the labor market effects of the credit depend
on the distribution of taxpayers within the credit’s ranges and the degree to which people in and
out of the labor market respond to incentives. On the former issue, as noted earlier, around 77
percent of EITC recipients will have incomes that fall in the flat or phase-out range of the credit,
which raises the concern that the EITC may lead to a net reduction in the labor supplied by low-
income workers. The latter issue concerning the responsiveness to the “effective” wage and
income changes associated with the EITC expansions also cannot be resolved a priori. It is an
empirical matter. Below, we discuss the empirical evidence to date on the magnitudes of these
effects.
The simple model illustrated in Figure 4 focuses on the behavioral effects for individuals
and ignores an important feature of the U.S. tax code applicable to the EITC. Married couples
generally file joint tax returns and, thus, the adjusted gross income subject to taxes depends on
their combined income and not the separate incomes of each spouse. The fact that families,
rather than individuals, are the unit of analysis for the tax system has consequences for the
effective wage rates of secondary earners, which is an issue made even more important by the
EITC. To see this, consider the following example discussed in Eissa and Hoynes (1998).
Suppose that the husband earns $11,650 (in 1997) and that the couple makes its time
allocation decisions sequentially, with the wife taking actions under the assumption that her

25
husband’s income is given. In this case, the family will receive the maximum credit of $3,656
(assuming the couple has two children) if the wife does not participate in the labor force. If she
does participate, the family’s credit, at the margin, will be reduced by $0.21 and that dollar will
be subject to the Social Security payroll tax of $0.142 percent and any state taxes. As such, her
marginal tax rate is at least 35 percent, i.e., her effective wage rate will be only 65 percent of her
gross wage rate.
This lowering of the wife’s effective wage provides an incentive for the wife not to
participate in the labor force, even though the presence of an EITC might induce her husband to
enter the labor force. Furthermore, if she works, she has an incentive to reduce her hours of work
in the presence of the EITC (compared to no EITC) due to lowering of her effective wage
(inducing a substitution effect) and to the higher income the family receives from the EITC
(inducing an income effect). Note that the ambiguous effect of the EITC on the labor force
participation choice of one of the spouses does not hinge on the sequential decision-making
assumption noted above. Under a more general model of joint decision-making, the greater the
disparity in the gross wage rates and/or tastes for nonwork time across spouses, the greater the
incentive for an expansion of the EITC to induce one of the spouses to not participate in the labor
force. Again, the importance of this potential work disincentive effect of the EITC depends on
the magnitudes of the labor supply and labor force participation wage elasticities of husbands
and wives, on the degree to which people correctly perceive tax incentives, and on the
distributions of their wage rates relative to the phase-in, flat, and phase-out regions of the EITC.
We examine empirical evidence on the labor force participation and labor supply effects of the
EITC for married couples below.

26
Marriage and Fertility The previous discussion of the potential for differential effects of the EITC by marital status
raises an important issue about the potential effects of the EITC on family structure. As noted
above, the tax treatment of married couples is different from that of single parents or individuals,
which leads to situations where a married couple may face larger total tax liabilities than they
would pay if they separated. Similarly, two unmarried people may pay lower taxes than they
would if they got married. This is the well known “marriage penalty” that has been the focus of
attention in the public finance literature and policy circles.26 In practice, marriage penalties tend
to accrue to two-earner couples if both partners have similar earnings, and marriage bonuses tend
to accrue to couples if the partners have disparate earnings or only one earner. Two recent
studies have suggested that the EITC and its expansions over the last 10 years are an important
contributing source of the marriage penalty.27 For example, Holtzblatt and Rebelein (1999)
estimated that the EITC increased the net marriage penalties in the individual income tax by
between $3.6 and $9.9 billion in 2000, depending on the specific assumptions, and that these
EITC-related net penalties accounted for 10.0 to 31.7 percent of the total net projected marriage
penalties.
A natural question to ask is whether changes in the EITC are likely to affect rates of
marriage and divorce among the poor. That is, the EITC may decrease the incentive for single
parents to marry by providing resources to families with children. The credit also provides fairly
substantial incentives for some people to marry and others to separate or not marry. This
potential for the EITC to influence marital status is reminiscent of the concerns about the effects
26See Feenberg and Rosen (1995), Alm and Whittington (1995), U.S. Congressional Budget Office (1997), Bull et al. (1999). The general statement of the problem is that the tax system cannot simultaneously be progressive, treat the family as the unit of taxation, and be neutral with respect to marriage. 27See Dickert-Conlin and Houser (1998) and Holtzblatt and Rebelein (1999).

27
of other public assistance programs, most notably the AFDC program, on marriage and the
incidence of female headship.28 To date, much less attention has been paid in the literature to the
impacts of the EITC on marital status than to those of other assistance programs.
A related question arises as to whether the structure of the EITC also may affect the fertility
decisions of households. As noted in Section II, the EITC was only available to families with
children prior to 1994, and, even now, the maximum credit available to families with children is
much larger than that available to childless taxpayers. In addition, households with two or more
children were able to claim a higher EITC than households with only one child, starting in 1991.
Both of these EITC features constitute a modest pronatalist incentive for taxpayers. There is a
substantial literature that examines the effects of AFDC on fertility, especially on out-of-wedlock
births.29 Furthermore, studies have found nonnegligible effects of provisions of the tax code,
namely the presence and generosity of the dependent exemptions, on fertility and the timing of
birth.30
There is no direct empirical evidence on whether EITC fertility incentives have actually
influenced behavior. The question, however, is important for two reasons. First, the effects of
policy on fertility are of general interest as part of an effort to assess the potential for unintended
consequences of tax policy. Second, many of the methods used by researchers to isolate the
effects of the EITC on other behaviors, especially labor supply, hinge crucially on the
assumption that the EITC expansions have had no effects on the fertility of couples. We return to
this issue below.
28 See Moffitt (1998) for a discussion of this issue and a summary of the empirical evidence on it. 29Again, see Moffitt (1998) for a summary of that literature and its findings. 30See Whittington, Alm, and Peters (1990) and Dickert-Conlin and Chandra (1999).

28
Consumption Behavior and Income Smoothing The fundamental tenet of the life-cycle consumption model is that utility-maximizing
households will vary their consumption and savings so as to equate the marginal utility of
consumption across periods. To do this, families typically save in periods when income is
unusually high and borrow when income is unusually low. EITC-eligible families generally have
lower incomes and are younger than other taxpayers. Thus, one would expect EITC-eligible
households to include many who would like to borrow.
There is evidence, however, that some of these families that would like to borrow are unable
to do so.31 For these liquidity-constrained families, the EITC could enhance utility more than it
would for an otherwise equivalent consumer who was not liquidity-constrained. The EITC
advance payment option might seem like a particularly important feature for credit-constrained
taxpayers. By delivering a portion of the EITC incrementally with every paycheck, families
presumably have an enhanced ability to smooth the marginal utility of consumption.32 As we
discuss below, however, only 1.1 percent of EITC recipients took advantage of the advance
payment option in 1998, though “refund anticipation loans” (with very high implied interest
rates) are popular.
Further evidence of credit constraints among the EITC-eligible population might be inferred
from unusual patterns of seasonality in consumption. In particular, most EITC payments are
received in February and March of each year (Barrow and McGranahan, 2000). Since these
31Jappelli (1990) looks at direct measures from the 1983 Survey of Consumer Finances and finds that roughly 20 percent of the population appears to be constrained. Also see Jappelli, Pischke, and Souleles (1998). 32Taxpayers can receive a portion of their EITC incrementally throughout the year via the advance payment option. They do this by filing Form W-5 with their employer, who then includes the advance payment in their regular paycheck (the employer is held harmless as they reduce payroll tax remittances to the government). To reduce the possibility that advanced EITC payments will lead to an end-of-year tax liability, advance payments are limited to 60 percent of the maximum credit available to families with one child. Taxpayers receiving the advance payment are obligated to file at the end of the year to reconcile their tax liabilities.

29
payments can be a large fraction of a family’s quarterly income, one might expect to see a
corresponding increase in consumption for credit-constrained families. Souleles (1999), for
example, presents evidence based on consumption Euler equations for the entire population that
is consistent with tax refunds influencing the seasonality of consumption, which in turn is
consistent with the existence of liquidity-constrained consumers.
Consumption-related issues also arise if one steps away from the canonical life-cycle model
of consumption. Thaler (1994) and others have argued that self-control problems are pervasive in
the economy. If rules of thumb, habit, innumeracy, or other psychological factors have a
dominant influence on economic behavior, the forward-looking model of utility-maximizing
consumers may not do a particularly good job characterizing economic behavior. In this case, it
is possible that self-control problems or other factors prevent families from accumulating
resources that might allow them to enhance their long-run economic well-being. The lump-sum
EITC may therefore provide a substantial one-time payment that can be used to purchase a car,
enhance human capital, or move out of an undesirable neighborhood (and in doing so break a
cycle of economic deprivation). It is difficult to develop and test rigorous formulations of
nonoptimizing consumption behavior.
V. Review of Evidence on the Behavioral Effects of the EITC In this section, we summarize the empirical evidence concerning the effects of changes in
the EITC on a range of behavioral outcomes. We begin by discussing empirical studies of EITC
take-up (or participation) decisions and what is known about the extent of non-compliance in
actual claims of the credit. We then summarize the literature on the effects of the EITC
expansions on labor force behavior, including labor force participation and labor supply
decisions. Most of the empirical investigations of the EITC have focused on the latter set of

30
behaviors. We discuss the econometric approaches taken in these studies and consider their
potential shortcomings. We then provide a summary of the less-extensive literature on the effects
of the EITC on other behaviors, including marriage and living arrangements, human capital
investment decisions, and consumption decisions, commenting on the importance of expanding
on these studies in future work.
Evidence on EITC Participation and Noncompliance
It would be helpful to policymakers to know what fraction of EITC nonparticipation (among
eligible taxpayers) is due to information barriers and what fraction is due to purposeful
nonparticipation. The decision of individuals or households to participate in the EITC entails at
least two choices: households must work and have income below the EITC break-even
thresholds and households must file a tax return to claim the credit.
As mentioned in Section IV, there are three studies of EITC participation among eligibles,
Scholz (1994) for 1990, Blumenthal, Erard, and Ho (1999) for tax year 1988, and Internal
Revenue Service (2002) for tax year 1996. None of the studies model the EITC participation
decision based a formal optimizing model. Scholz (1994) presents reduced-form regressions of
factors correlated with nonparticipation. He finds some evidence, based on his analysis of linked
data from the 1990 SIPP and tax returns, that factors like working in the household service sector
or being eligible for a small EITC were positively correlated with not claiming the credit when
eligible. The question is still open, however, about the degree to which EITC participation can be
increased by additional outreach and information.
Formally modeling the decision to claim the EITC will require one to confront several
information and noncompliance issues. There is mixed anecdotal evidence on the degree to

31
which taxpayers are aware of the EITC.33 The only systematic evidence comes from Phillips
(2001), who presents tabulations from the 1999 National Survey of America’s Families showing
that roughly two-thirds of Americans have heard about the EITC. Past welfare recipients and
parents with incomes near the poverty line were among the most knowledgeable.
The degree of awareness of the credit is critical for some issues and less important for
others. The credit could, for example, significantly increase labor force participation even if
people know little about it as long as workers have some understanding that the tax system
rewards work at low levels of earnings. The link between the marginal incentives of the credit
shown in Figure 2 and the labor supply decisions discussed in Figure 4 depends on people
understanding the specific incentives inherent in the credit’s structure. Given the lag between
labor market decisions and receipt of the credit, which can be as much as 16 months,
informational considerations suggest that the credit’s effect on participation may be larger than
its effect on hours, compared to a world where taxpayers have perfect knowledge of the credit.
Informational issues are probably less fundamental when thinking about EITC participation
among taxpayers eligible for the credit. Scholz (1997) reports that roughly 95 percent of EITC
claimants are either legally required to file tax returns or would file to recover over-withheld
taxes, so most eligible taxpayers would get into the system even in the absence of the EITC. In
1996, 56.5 percent of claimants used paid tax preparers, who surely are aware of the credit. The
IRS also has a policy of notifying all taxpayers who do not claim the credit but appear to be
eligible for it based on their filing information, that they may be eligible and can file an amended
return to claim the credit.
33 Liebman (1997a) suggests that awareness of the credit might be quite low. Smeeding, Ross-Philips, and O’Connor (2000) and Romich and Weisner (2000) find greater awareness, though the former study is based on a sample seeking help with tax preparation and the latter is based on a small sample from Project New Hope, a work-based welfare reform project in Milwaukee.

32
Behavioral work on overall EITC participation and noncompliance must take into
consideration three central facts. First, there appears to be little scope for overstating EITC
claims by systematic, ongoing misreporting of wage and salary income. The IRS, using
information returns filed by employers, can in principle corroborate wage and salary reports.34
Second, there appear to be ample opportunities to misreport self-employment income to
strategically manipulate the size of the available EITC, since most forms of self-employment do
not include information reporting. McCubbin (2000), however, reports that only a small fraction
of EITC noncompliance in 1994 involved self-employment income. In addition, only 17.6
percent of all EITC filers claim any self-employment income and 54.3 percent of those reporting
self-employment income have incomes in the phase-out range of the credit (Internal Revenue
Service, 1999), so it appears that strategic misreporting of self-employment income is not
currently a dominant feature of EITC noncompliance. Perhaps this is because EITC incentives
can be complicated for those wishing to strategically manipulate self-employment income. To be
effective, would-be tax cheats need to be sophisticated enough to overstate self-employment
income in the phase-in range of the credit or understate self-employment income in the phase-
out range.
Third, as pointed out by Liebman (1997a), Liebman (2000), and McCubbin (2000), among
others, the major area of EITC noncompliance—particularly participation by ineligibles—has to
do with qualifying-child errors. This is a particularly difficult area for the IRS to enforce, since
information on children (beyond ages and Social Security numbers) is not collected in the tax
34 The Internal Revenue Service (1996) reports that, in aggregate, net underreporting on wage and salary income was 0.9 percent, lower than any items other than state tax refunds (at 0.8 percent). EITC-related wage and salary errors can still occur because claimants may not realize that employers provide independent information to the IRS, may unintentionally omit a Form W-2 for a second job, may wish to use the IRS as a “loan shark” for the period between submitting a claim and being audited (Andreoni, 1992), or may wish to take the chance that the IRS will be unable to recover money once it is paid out (and spent).

33
system.35 Liebman (1997b) develops the following intuitive idea: If noncompliance is
inadvertent, it should not respond to the size of the available credit. He examines this by looking
at whether the probability of erroneously claiming a dependent child depends on the tax gain to
such a claim (McCubbin, 2000, pursues a similar strategy). He estimates that roughly one-third
of ineligible claimants in 1988 did so in response to the EITC incentive.
Good compliance studies will be difficult to conduct outside of Treasury, the IRS, or Census
Bureau because of data-access limitations. An interesting question for public servants and
affiliated scholars at these agencies is whether data gathered for one purpose for example,
administering child support laws could be useful in reducing erroneous EITC claims. To be
useful for tax administration, ways to identify erroneous payments before money goes out must
be developed, since once payments are made they are rarely recovered. In addition, the IRS has
limited resources, so research is also needed on the cost-effectiveness of alternative ways of
improving compliance, focusing on both the EITC and the broader tax system. Although EITC
compliance has received considerable scrutiny in recent years, comparable work on other areas
of the tax code is badly dated or nonexistent.
New studies documenting changes in EITC participation rates of eligible taxpayers in the
late 1990s are needed, given the sharp changes in the credit over the decade and changes in low-
wage labor markets. Greater detail on the characteristics of nonparticipants would also be useful,
both for outreach and for understanding linkages between programs. These studies would be
straightforward, though to do them, data rich enough to determine eligibility need to be linked
35 Despite some evidence that error rates are high for certain subgroups for example, Liebman (2000) reports that roughly one-third of male heads of households did not appear to have children in matched CPS data audits are expensive, so “hit rates” need to be much higher than 1 in 3 for compliance initiatives to pass any sensible cost-benefit test. The U.S. General Accounting Office (2000), for example, reports that 86 percent of EITC claims selected for audit in fiscal year 1999 were, in fact, noncompliant.

34
with data indicating whether or not a potentially eligible taxpayer files a return and receives the
credit.
Effects of EITC on Labor Force Participation and Labor Supply Most of the existing empirical investigations have focused on the consequences of the
expansion of the EITC for labor force participation rates and hours of work. Most of these
studies have sought to estimate the overall, or “reduced-form,” effects of the historical
expansions of this program on these labor market outcomes. Another strand of these studies
focuses on estimating the effects of the EITC with now-standard labor supply models by
exploiting the fact that the EITC expansions have varied the effective wages and incomes
confronting individuals and households over the last 25 years. We also provide a brief discussion
of the evidence derived from more structural optimizing models of time allocation and program
participation decisions in which household preferences and budget and time constraints are
explicitly parameterized.
Reduced Form Effects of EITC
Reduced-form studies typically exploit statutory EITC changes to assess their effects on
behavior. This approach is a time-honored strategy in policy analysis and applied economics, and
is often referred to as “natural experiments” or “difference-in-differences.”36
Consider the following framework to help clarify the underlying identification issues.
Suppose we are interested in estimating the effect of a policy (or bundle of policies) on some
outcome, y. In most of the reduced form studies of the EITC, the identifying variation used come
from the periodic legislative expansions and other changes in the credit. For example, Eissa and
Liebman (1996) study the effects of the changes in the EITC contained in the Tax Reform Act of 36 The following discussion draws heavily on Moffitt and Wilhelm (2000). Also see Blundell and MaCurdy (1999), Meyer (1995), and Angrist and Krueger (1999) for other discussions of approaches to estimating the effects of policy interventions.

35
1986. Furthermore, as noted above, these changes were not always applicable to everyone in the
population. Prior to 1994, childless adults were not eligible to claim the EITC and adults with
qualifying children were eligible for the same schedule of credits, while, starting in 1994,
childless adults were eligible and adults with two or more children were eligible for a more
generous credit than adults with only one child. To characterize these sources of policy variation,
let dt(Qit) denote the EITC regime prevailing as of period t, where the particular features of the
EITC code applicable to the ith individual or household depends on their characteristics, Qit (e.g.,
presence and number of children). That is:
1 if individual is "eligible" for a policy reform that prevails in period
( )0 otherwiset it
i td Q
�� ��
. (1)
Finally, consider the following linear specification of the determinants of behavioral outcomes,
yit, such as labor force participation or hours of work,
( )it t it t it t ity d Q X u� � �� � � � , (2)
where Xit is a vector of individual and household characteristics that may include Qit, uit is an
error term, and β , λt, and αt are parameters to be estimated.
To understand what is required to identify β, the overall effect of the policy change,
consider what would be learned if one could assign the values of dt(Qit) by a controlled
experiment, where some individuals (experimentals) would face a new policy regime [dt(Qit) = 1]
and others (controls) would not have access to this new regime (dt(Qit) = 0). It would follow, by
design, that dt(Qit) would be uncorrelated with (orthogonal to) uit and, for that matter, to Xit. In
this case, the standard conditions for consistently estimating the parameters in (2) would apply.
In fact, in this case, the mean difference in outcomes for experimentals and controls would
consistently estimate β.

36
In the absence of random assignment of individuals to policy regimes, we must rely on
temporal changes (or, possibly, locational differences) in policies and/or variation in dt(Qit) due
to individual differences in Qit. However, these sources of variation, in general, are not sufficient
for identifying β. For example, reliance only on the changes in the EITC over time to identify the
credit’s effect is confounded with other temporal changes in the economy (or environment) that
may have influenced the labor supply of the low-income population. Thus, additional
assumptions, in conjunction with the availability of certain types of data, are required in order to
identify the effects of the EITC. Existing studies of the EITC, and studies of related tax and
public assistance policy changes, make use of alternative data sources and assumptions.
Suppose dt is defined as in (1) and assume we have data, either repeated cross-section or
panel data, on households for periods t′′ and t′, where t′ denotes a period before an EITC
expansion and t′′ is a period after the expansion. Furthermore, recall that prior to 1994, the EITC
required claimants to have children present to be eligible for the credit. This implies that
households without children both before and after EITC expansions (such as occurred in 1986)
were not eligible for the EITC, while households with children faced a change in the credit with
the expansion. In this case Qit can be represented as an indicator variable, where Qit = 1 if
children are present in household i and in period t and = 0 if not, and dt(0) = 0 for t′ and t′′ . The
difference-in-differences estimator of β results from differencing equation (2) for periods t′ and
t′′ for each individual/household:
[ ( ) ( )] ( )it it t it t it t it t it it ity y d Q d Q X X u u� � ��� � �� �� � � �� �� � � �� �� � � � � � � . (3)
The validity of the difference-in-differences estimator for β relies on several additional
assumptions about Qit and its effects on y in (2). The first concerns the nature of independent
effects of Qit on y. Recall that we allowed for the possibility that Xit includes Qit. In the current

37
context, this amounts to assuming that the presence of children affects the labor supply decisions
of parents, an assumption consistent with various behavioral models of optimal time allocation.37
The standard difference-in-differences estimator maintains the assumption that either Qit is
excluded from Xit or the less restrictive, but not innocuous, assumption that λt = λ, i.e., the effect
of children on y does not vary with time. Second, the standard difference-in-differences estimator
typically assumes that Qit is uncorrelated with uit in (2). Note that strict exogeneity of Qit in (2) is
not required. The consistency of the difference-in-differences estimator holds under weaker
assumptions, especially if one is willing to maintain that Qit is a time-invariant variable. (See
Moffitt and Wilhelm, 2000, for details.) Under these two sets of assumptions, the difference-in-
differences estimator of β will be consistent.
As noted earlier, the difference-in-differences studies rely on explicit comparisons between
groups that are and are not affected by changes in the EITC. Figure 5 plots trends in the labor
force participation between 1984 and 1996 (from the March CPS, taken from Meyer and
Rosenbaum, 2000) for six groups in the population including households with and without
children that are commonly used to examine the effects of the EITC. It is these trends that the
difference-in-differences studies of labor force participation seek to explain.
It is clear from Figure 5 that labor force participation of three groups commonly used as
“controls” has no discernible trends. Single women with no children and black men, the top two
lines in the figure, have high and unchanging rates of labor force participation. Single women
who dropped out of high school but have no children also have steady (or even declining) rates
of labor force participation. The three groups of women eligible for the EITC all had rising rates
of labor force participation, particularly after 1992. These are all single women with children,
37 See Browning (1992) for a discussion of such models and the effects of children.

38
single women who dropped out of high school and have children, and single women with
children under 6.
Selected EITC studies of the estimated impacts of the EITC on labor force participation and
hours of work are summarized in Table 4. We first discuss papers adopting the difference-in-
differences approach.
Eissa and Liebman (1996) estimate the effects of the 1986 EITC expansion on labor force
participation of single women and, conditional on working, their hours of work. To isolate those
affected by the policy from those who are not, they treat single women with children as being in
the experimental group, and single women without children as being in the control group. They
find that the 1986 tax reform (including the EITC changes) increased labor force participation
among all single women with children by as much as 2.8 percentage points (from a base of 74.2
percent). The effects are much larger (on the order of 6 percentage points) for women with
children and less than a high school education.
Eissa and Hoynes (1998) use a similar difference-in-differences estimator to examine the
EITCs labor market effects on couples, in addition to an alternative quasi-structural approach
discussed below. Recall that the EITC would be expected to have negative labor market effects
for secondary workers. They find modest negative effects of the EITC on married women’s labor
force participation, estimating that the EITC expansions between 1984 and 1996 reduced the
likelihood of labor market participation by around 1.2 percentage points (or 2 percent).
Ellwood (2000) exploits the difference-of-differences approach in which he classifies
parents according to their position in the distribution of predicted wages, comparing women in
the lowest (predicted) wage quartile with those in higher quartiles to distinguish groups that are
likely to be affected by the EITC (the lowest quartile) from those that are not (the higher

39
quartiles). He concludes that it is “perilous to impossible” to decompose the relative impacts of
welfare reform, the strong economy and EITC changes in the 1990s on the labor force
participation patterns of low-skilled workers, but notes that the combination has led to a “truly
unprecedented increase in labor market activity by low-income single parents” (p. 1100).38
To the extent that changes in policies other than the EITC or other “environmental” factors
are coincident with the EITC expansions, there is the potential for bias in difference-in-
differences estimates. Many states, for example, implemented changes in their welfare programs
during the latter part of the 1980s, including reducing the growth in guarantees and the
imposition and tightening of work rules for recipients (see Moffitt, this volume). Given the
AFDC eligibility criteria, these changes are likely to have differentially affected single women
with children relative to those without children. Furthermore, there is potential for the
composition of the treatment and control groups in these studies to have changed over time.39
These concerns are addressed by Hotz, Mullin, and Scholz (2002a), who assess the
employment effects of the EITC changes in the 1990s using data on a sample of families who
received welfare benefits in California during the early part of the 1990s. Their study has four
distinctive differences from previous work. First, their sample is composed of former (or current)
welfare recipients, a more disadvantaged population examined in other papers. Second, they used
administrative data from the welfare, unemployment insurance, and federal tax systems and
38 Neumark and Wascher (2001) examine correlations between income and income-to-needs ratios and state and federal EITC parameters. They find small effects of the federal EITC on earnings but large effects of state EITCs. They emphasize the state-level results, but variation in state EITC policy is somewhat limited in the years spanned by their data, so the discrepancy is puzzling. 39 Ellwood (2000) raises similar concerns (with different language), pointing out that with comparisons of single women with and without children, one cannot disentangle the separate effect of policy changes and everything else going on in the economy. One can only hope to test the overall impact of the combination of policies in a strong economy. He also notes that the temporal pattern of labor force participation of the two groups is often different before the enactment of the EITC, so drawing inferences from differential trends afterwards is troubling. Moreover a large fraction of childless single women were already workers even before EITC expansions, so their employment cannot grow much.

40
focused on four counties in California that were part of a welfare demonstration (see Hotz,
Mullin, and Scholz, 2002b, for a more complete description). The data allow the authors to
account more directly than other studies for potentially confounding changes in local labor
markets and welfare reform. Third, the authors identify the employment effects of the EITC by
comparing families with two or more children to families with one child, since after 1994 the
EITC increased substantially for the former group relative to the latter. They argue that this
approach focuses on groups that are likely to be more similar than studies that compare, for
example, families with and without children.
They find the EITC has large, positive effects on employment of adults from welfare
families in California. Employment rates of families with two or more children increased 6 to 8
percentage points more than the employment rates of one-child families. The implied elasticity
of labor force participation with respect to net income ranges from 0.97 to 1.69 depending on
assumptions used in the underlying elasticity calculations. Most of this range exceeds the next
highest estimate reported in Table 4. Larger elasticity estimates are consistent, however, with the
previously mentioned result for Eissa and Leibman (1996) for women with children and less than
a high school education. The fourth distinctive feature of the Hotz et al. study is that through a
special arrangement with the California Franchise Tax Board, the authors were able to request
grouped tabulations from the federal tax returns filed by the sample members. If the EITC
accounts for the relative employment increase of families with two or more children, they should
be filing tax returns and claiming the EITC at a significantly greater rate than their one-child
counterparts. In fact, they do.
Estimates from the natural experiment (or difference-in-differences) studies described above
are limited in their ability to assess the effects of alternative EITC designs. As can be seen in

41
Table 1, all major expansions in the EITC entailed simultaneous changes EITC phase-in rates,
phase-out rates, and the maximum credit. In Section III, we noted that a simple labor-leisure
model predicts that households in the phase-out region of the credit would reduce their labor
supply in response to an increase in the phase-out rate, all else equal, while the effect of
increases in the phase-in rate on hours of work depend on the relative strength of the substitution
and income effects associated with this change. Determining the direction and magnitude of the
behavioral responses to changes in each of these parameters is useful for assessing the validity of
this model and for assessing the likely impacts of alternative designs of the EITC beyond those
actually implemented.
Effects of the EITC Based with Standard Labor Supply Models
As noted above, several studies have analyzed the effects of the EITC on labor force
participation and hours of work with standard labor supply models, using the fact that the EITC
alters the effective wage or effective tax rates that certain types of individuals and/or households
face.40 The Dickert, Houser, and Scholz (1995); Eissa and Hoynes (1998); and Meyer and
Rosenbaum (2001) are studies based on this approach.41
Dickert, Houser, and Scholz (1995) measure labor force participation elasticities using data
from the 1990 SIPP. They construct a detailed tax and transfer simulation model that reflects
precise estimates of state and federal income taxes, payroll taxes, AFDC, food stamps, and
Supplemental Security Income. The simulation model allows them to characterize the enormous
variation in budget sets that families face in different states. They use an instrumental variables
approach (described below), calculating the after-tax change in incomes that would result from
40 The approach builds on the neoclassical labor supply and labor force participation models. See Pencavel (1986), Killingsworth and Heckman (1986), and Blundell and MaCurdy (1999) for surveys of this work. 41 Also see the simulation studies of Hoffman and Seidman (1990); U.S. General Accounting Office (1993); Holtzblatt, McCubbin, and Gillette (1994); and Browning (1995).

42
taking a half-time (and in some specifications, full-time) job at the predicted wage relative to
being out of the labor market. The intuition underlying the study is that in high-benefit states
(like New York at the time), the after-tax return to work is fairly low since substantial benefits
are clawed back, while in low-benefit states (like Texas at the time), the after-tax return to work
is high since there are few benefits to lose. Thus, if labor market participation decisions are
sensitive to the after-tax returns to work, participation rates should be higher in low-benefit states
than in high-benefit states, all else being equal.
Dickert, Houser, and Scholz find that a 10 percent increase in the after-tax wage results in a
2 percentage point (or 3.5 percent) increase in labor market participation among single parents
(they also jointly estimate a reduced-form equation for the welfare participation decision), which
suggests that EITC-induced changes in the returns to work increase labor market participation.
Their estimates also show that participation of secondary wage earners will fall as a consequence
of the EITC. Their new empirical work on participation, coupled with simulation work on the
effect of the EITC on hours for those already in the labor market suggest the aggregate positive
participation effects of the 1993 EITC expansions likely outweighed the negative hours effects,
resulting in a net increase in aggregate hours of work.
A potential problem with the Dickert, Houser, and Scholz (1995) study is that EITC effects
are inferred from correlations of employment with other aspects of the tax and transfer system.42
Moreover, idiosyncratic state-level factors correlated with family budget sets and labor market
decisions could bias estimates. Hoynes (1997), for example, shows that including state fixed
effects can significantly alter estimates of the effects of AFDC on female headship.
Meyer and Rosenbaum (2001) significantly advance the literature in their analysis of the
42 The data are a cross-section and the EITC is a uniform federal program, so EITC effects are inferred from the cross-state variation in net wages generated by state-level differences in tax and transfer rules.

43
effects of the EITC and other policy changes on the labor force participation of single women.
They develop an econometric model of labor force participation, calculating the probability that
the utility of working exceeds the utility associated with not working. That is, the probability of
working is given by
� �Pr ( , , , , ) ( , , , , )w w w w nw nw nw nwU Y L P X U Y L P X� �� (4)
where U(Yk,Lk,Pk,X) are the indirect utility functions associated with the work (w) and nonwork
(nw) states, Yk is the income the woman receives in the kth state, Lk is her leisure time in
alternative states, Pk denotes her participation in welfare programs (to capture potential
transaction costs and stigma associated with participation in such programs), X denotes
observable characteristics, and εk represent unobserved, stochastic components of tastes. The
influence that the EITC and other programs have on wages and income enters through the
specifications of the incomes associated with the work and nonwork states.
Meyer and Rosenbaum specify Yw and Ynw as functions of parameterizations of the EITC,
federal and state tax rules, and the characteristics of other welfare programs facing women at
different times and in different states, utilizing an exhaustive set of data on the tax structure and
welfare programs. Linearizing U(⋅) with respect to its arguments and using a nonparametric
strategy to calculate expected values of income associated with the work state for women in their
data, they use a probit specification to estimate their labor force participation model.
They find that EITC changes account for roughly 60 percent of the increase in the
employment rate of single mothers from 1984 to 1996 and roughly 31 percent of the increase
from 1992 to 1996. Given the changes in employment rates and the size of the EITC changes
over this period, their results are broadly consistent with the earlier papers, though as we show in
Table 4, their estimated elasticities of labor force participation with respect to net income are the

44
smallest of the range of existing studies (though all estimates are quite close, with the exception
of the larger estimate of Hotz, Mullin, and Scholz, 2002a).
There are at least two notable features of Meyer and Rosenbaum’s work. First, they account
for EITC changes that occurred between 1984 and 1996, making use of time-series variation in
the credit to identify employment effects. Second, they construct an elaborate simulation model
of the tax and transfer system that allows them to net out the influence of changes in other
policies, both over time and across place of residence. Dealing with the influence of other policy
changes is potentially important, especially to the extent that such changes had differential
impacts on households with and without children.
Structural Choice Models of Time Allocation and Program Participation
The nonlinear or kinked nature of the budget set induced by the EITC program, can result in
nonmarginal changes in behavior that complicate efforts to rely on wage and income elasticities
drawn from other econometric studies. This can be seen in Figure 4 for the Type III individuals.
The optimal pre-EITC labor supply choice for a Type III individual would generate labor
earnings that exceed the upper threshold for EITC eligibility. Because of the nonconvexity
introduced with the EITC phase-out range, one could observe individuals reducing their labor
supply and earnings so as to be eligible for a credit. Such nonconvexities in the phase-out region
require one to know more than just the income and substitution effects in order to assess the
response to EITC changes. It requires knowledge of the underlying preferences for work versus
leisure to determine whether such behaviors are likely to occur.
The structural approach explicitly parameterizes the preferences and constraints facing
individuals and then exploits the theory of optimal decision-making to characterize the likelihood
function used to reconcile observed labor supply and program participation behaviors. This

45
approach is exemplified in the work of Hausman (1985) on the effects of income tax structure on
the labor supply and Moffitt (1990) and Keane and Moffitt (1998) in the study of the labor
supply impacts of welfare and other social programs.
Keane and Moffitt (1998) and Keane (1995) (based on the Keane and Moffitt model) use
their model estimates to examine a wide range of policy reforms, including changes to AFDC
and food stamp tax rates, a variety of wage and work subsidies, and changes to the EITC. Their
EITC simulations find that the expansions between 1984 and 1996 increased labor force
participation by 10.7 percentage points, from a base of 65.4 percent. They also find that the
aggregate effect of the EITC expansions was to increase hours of work. This paper is notable as
the only EITC study to recover underlying household preference parameters.
A study by Blundell, Duncan, McCrae, and Meghir (2000) sought to estimate the likely
impact of alternative implementations of an EITC-like tax credit scheme in the United Kingdom
(called the Family Working Tax Credit) before it was actually implemented. This type of
application is one of the most valuable uses for structural estimates. In general, greater
knowledge of the “structure” of individual and household preferences and their choice processes
is required to predict the behavioral responses to complicated, hypothetical policy changes than
is needed to assess the net impacts of straightforward, observed changes in the credit. At the
same time, identification of these structural features of decision-making is inherently more
difficult than estimating net effects of observed expansions.
Estimates of the EITC and Hours of Work
Studies estimating the effects of the EITC on hours of work for those households that are
working find small, negative effects. These studies are summarized in the second panel of Table
4. Liebman (1997a) finds no bunching of taxpayers at the beginning and end of the phase-out

46
range, as might be expected if the EITC significantly affects hours and taxpayers are cognizant
of the discontinuities in implied marginal tax rates generated by the credit. As Liebman notes, it
is not surprising that negative effects on hours for people already in the labor market are small
because the precise relationship between the EITC and hours worked is likely to be poorly
understood by most taxpayers. The majority of EITC recipients pay a third party to prepare their
tax returns, and it is difficult to infer the implicit tax rates embodied in the credit from the look-
up table that accompanies the EITC instructions. This confusion is less likely to mitigate positive
participation effects, since for these to be operative, taxpayers only need to understand that there
is some tax-related bonus to work. Abundant anecdotal evidence indicates that taxpayers have
this understanding (see, for example, DeParle, 1999).
The standard approach to estimating the effects of policies on hours of work is based on the
labor supply equation that takes that following generic form:
* *0 1 2h w Y X u� � � �� � � � � , (5)
given h > 0, where h is the number of hours worked, w* is the effective wage rate, Y* is the
individual’s effective nonlabor income, the Xs are again used to capture observable differences,
and u is an error term. The parameters α1 and α2 in (5) represent the uncompensated wage effect
and income effect, respectively, and 1 2 0h� �� represents the compensated wage, or substitution,
effect, evaluated at some level of hours of work, h0. In the context of estimating the effects of
taxes and other social programs on hours of work, one crucial issue is how to deal with the
potential endogeneity of w* and Y* when estimating α1 and α2. The endogeneity of effective
wages and incomes facing individuals arises because of the nonlinearities in the budget sets in
the presence of taxes and transfer programs that individuals face. Even if before-tax and transfer
wages and before-tax sources of unearned income are assumed to be exogenous (which are

47
controversial assumptions), effective wages and income levels are presumed to be endogenous.
This due to the fact that an individual’s choice of the segment of the budget constraint may
depend upon their tastes and preferences, which are, in part, reflected in their value of u, giving
rise to endogeneity bias in the estimation of α1 and α2. Such bias is likely to be more problematic
when individuals face nonconvex budget sets created, for example, by the phase-out region of
the EITC.
Several econometric strategies have been employed in an attempt to mitigate these biases.
They differ in the sources of variation they use to identify the effects of tax and transfer
programs, the degree to which the estimates can be used to estimate more general sets of
counterfactual regime changes, and the extent to which they rely on maintained assumptions
about unobserved components of preferences and their distributions. The most common strategy
in papers examining the EITC and hours is to use instrumental variables (IV) methods. Eissa and
Hoynes (1998) use the IV strategy to estimate variants of α1 and α2, which they then use to
simulate the effects of changes in the EITC on hours of work. The IV approach also has the
benefit of its relative simplicity and holds the promise of obtaining wage elasticities that can be
used to analyze more general policy changes. At the same time, these methods are vulnerable to
the concerns raised above about reliance on wage and income elasticities to make inferences
about the effects of program changes characterized by nonlinear, and especially nonconvex,
budget sets. Furthermore, the usefulness of these estimates depend on the validity and power of
the instrumental variables themselves, i.e., that the variation in the instrument reflects variation
that is exogenous to the (endogenous) net wages and incomes of individuals.
Summary of Studies of Effects of the EITC on Labor Market Outcomes
We draw four broad conclusions from the empirical work on the EITC and labor force

48
participation and hours. First, based on the evidence from many studies, the EITC positively
affects the labor force participation of single-parent households. Second, in aggregate, the
positive participation effects appear to be fairly substantial. Meyer and Rosenbaum (2001), for
example, suggest that as much as 62 percent of the increase in single mothers’ labor force
participation between 1984 and 1996 could be attributed to the EITC, while as much as 35
percent of the increase from 1992 to 1996 could be attributed to the credit. Labor force
participation elasticities with respect to net-of-tax income reported in Table 4 range from 0.69 to
1.16, and could be as large as 1.7 for former and current welfare recipients. Third, as would be
expected given the tax treatment of secondary workers in two-earner couples, the EITC has a
modest, negative effect on labor force participation for secondary workers in two-parent families.
Fourth, the EITC appears to have a small negative effect on hours worked by those in the labor
force, but some studies (Dickert, Houser, and Scholz, 1995; Keane and Moffitt, 1998; and Meyer
and Rosenbaum, 2001) suggest that the aggregate hours effect of the EITC, once participation
effects are accounted for, is positive.
Labor market issues have received more attention than other EITC-related issues, but more
could usefully be done. First, Hotz, Mullin and Scholz (2002a) find employment elasticities with
respect to EITC changes is significantly higher for welfare recipients than they are for others.
Further work on the EITC and employment, particularly for subpopulations, may be useful.
Second, additional attention could be paid to augmenting the labor market proxies employed in
the studies. Some evidence suggests that state unemployment rates, the variable typically used,
are too blunt, which makes it hard to disentangle business cycle effects from policy changes.
Third, the behavioral responses to the EITC may change over time. This possibility is suggested
by Moffitt (1999), who finds that welfare participation appears to be more sensitive to changes in

49
labor market conditions during the 1990s than was the case in earlier decades. Ellwood (2000)
also emphasizes the fact that the “combination of welfare sticks, EITC carrots, and a remarkably
strong economy had a multiplicative effect that is far greater than any one or two of these
policies would have had on their own” (p. 1084). Work would be valuable that helps
policymakers better anticipate the effects of policy changes, adopted individually and in
packages, in different economic environments.
Estimates of the Effects of the EITC on Other Behavioral Outcomes
Marriage and Family Formation As noted earlier, the EITC can lead to large marriage penalties and bonuses depending on
the relative incomes between potential partners. Once these incentives have been clearly
documented, as is done by Dickert-Conlin and Houser (1998) and Holtzblatt and Rebelein
(1999), it is natural to ask whether they affect behavior.
Three recent papers examine whether the EITC encourages the existence of female-headed
families.43 Dickert-Conlin and Houser (2002) look at correlations between EITC changes and
female headship. They account for the fact that couples affect their EITC through their marital
and labor supply choices, and find little effect of the EITC on marriage decisions. Eissa and
Hoynes (1999) also find modest or nonexistent effects on family formation.
Ellwood (2000) takes a different strategy. Rather than isolating the specific effect of
marriage on tax and transfer payments, he looks at data from the Panel Study of Income
Dynamics (PSID) and focuses on 1,671 marriages that women in the sample entered between
1983 and 1991. He measures penalties and bonuses by income in the last year prior to marriage
and in the first year after marriage to look at whether families would be net winners or losers had
43 Also see Dickert-Conlin (1999) for a more general look at taxes, transfers and separations.

50
the 1996 EITC provisions been in place when they married. Clearly other factors (like
postmarital child-bearing or other changes in income) can affect these comparisons. Ellwood
then looks at patterns of marriage incentives over time across wage and skill groups, and the
corresponding marriage patterns. He finds no evidence that EITC marriage penalties or bonuses
affected marriage.
The evidence on the EITC’s effects on marriage and fertility mirrors the broader evidence
from the literature on transfer programs. Moffitt (1998) surveys studies of the effects of welfare
on marriage and fertility and concludes that “a neutral weighing of the evidence still leads to the
conclusion that welfare has incentive effects on marriage and fertility,” but the effects tend to be
small and cannot explain time-series increases in nonmarital fertility and declines in marriage
rates. Moffitt also notes that results tend to vary significantly based on the methodology used and
other specification differences.
Human Capital Formation44 Until now, we have ignored the potential impacts of the EITC on an important issue related
to the ability of the EITC to alleviate poverty, namely its effect on human capital or skill
development among workers. The argument is sometimes made that prowork programs provide a
double bonus, because they induce people to work and, by going to work, low-skilled individuals
can acquire productive skills that can enhance their future earnings. Drawing from the literature
on human capital investment, the issue is what effect does the EITC have on skill formation and
wage growth among low-skilled populations?
Formal models of human capital investment emphasize that the decision of workers to
invest in skill formation depends on the comparison of the opportunity cost associated with time
44This section draws heavily on Heckman, Lochner, and Cossa (2002).

51
spent acquiring skills with the future returns to wages that result from the acquired human
capital. As noted by Heckman, Lochner, and Cossa (2002), programs that affect the value of
market work, such as the EITC, may affect these costs and returns. The effect of the EITC is
further complicated by the differential impacts it has on effective wage rates. As noted above, the
EITC raises the effective wage rate in the phase-in region, leaves it unchanged in the flat region,
and lowers the effective wage rate in the phase-out region. Thus, whether the opportunity costs
of human capital investments and the returns from such investments are raised or lowered by the
EITC depends critically on which part of the EITC applies and over what time intervals.
Moreover, exactly how programs like the EITC affect skill acquisition and life-cycle wage
growth depends on what model characterizes the human capital accumulation, or production,
process. In particular, if one assumes that work-related skills are largely acquired as a by-product
of work, i.e., via “learning by doing” (LBD), then programs that encourage greater labor force
participation and hours of work will tend to encourage skill acquisition.45 In contrast, if learning,
either via formal schooling or while on the job, is rivalrous with working, as is the case with a
“on the job training” (OJT) model, policies that encourage work may discourage skill
acquisition.46
Using data from the 1980 CPS, Heckman, Lochner, and Cossa (2002) estimate the structural
parameters for hours of work and wage equations profiles for OJT and LBD models of life-cycle
human capital investment and time allocation. Based on these models, the authors simulate the
effects of the presence of an EITC on life-cycle labor supply decisions, human capital
investments, and wage growth. Their simulations imply very different patterns of EITC effects
45 See, for example, Weiss (1972) for an exposition of the formal model of learning-by-doing applied to the human capital investment context. 46 This is true in the human capital models of Becker (1964) and Ben-Porath (1967).

52
on these decisions across the OJT and LBD models of human capital formation, even though the
models do not appreciably differ in their fit of the data. For example, their simulations show that
while the two models yield similar predictions of the effects of the EITC on human capital
formation via its effect on labor market entry by females, they yield different effects on the
intensive labor supply margins. In particular, the EITC has large effects on training in an OJT
model but weak effects on labor supply. It has little effect on skills and larger labor supply
effects within the LBD model they examine.
These provocative findings by Heckman, Lochner, and Cossa suggest the need to devote
attention to the life-cycle implications of EITC changes in order to understand the potential for
the credit to improve the skills, and thus the well-being, of disadvantaged populations in the
United States.
Consumption A central issue when thinking about the EITC and consumption is the degree to which the
credit allows people to smooth the marginal utility of consumption. One would think that the
advance payment option might help people do this. However, in 1998 only 185,027 of
16,118,328 (1.1 percent) of EITC claimants with qualifying children took advantage of this
option.
Barrow and McGranahan (2000) examine whether consumption appears to increase for
EITC-eligible families in months, particularly February, when they are likely to receive the
EITC. The topic is an interesting one, since the models economists typically use to think about
consumption would predict that families would not immediately spend their EITC upon receipt,
but rather would spread EITC-financed consumption over the year (or lifetime). Hence, standard
models would predict no discernible effect. Yet there is some evidence that significant portions

53
of the population are liquidity-constrained, and hence have consumption patterns that track
income receipt very closely.
The authors use monthly data from the Consumer Expenditure Survey of nondurables and
durables from 1982 through 1996. Using regression models of monthly consumption with month
dummies, month dummies interacted with (simulated) EITC eligibility, and family economic and
demographic characteristics, they find that EITC-eligible households spend approximately 9
percent more on durable goods in February, the modal month of EITC refund, than do
households not eligible for the credit. They show that these results are not driven by income
differences or differences in family size between EITC-eligible and EITC-ineligible families.
They also show that the seasonal effects are larger after the 1990 EITC expansions, as would be
expected. The estimated magnitudes suggest that EITC recipients spend roughly one-fifth of the
full amount of their refund in the month of receipt.
Smeeding, Ross-Phillips, and O’Connor (2000) fielded a survey of low-income taxpayers
who used tax preparation services at a neighborhood legal clinic in Chicago and solicited
detailed information about the anticipated and actual uses of the EITC. The study provides
information on how the EITC is used by families, such as purchasing a car, paying tuition,
changing residences, paying bills or purchasing food. A next step in this research program would
be to examine what families would do at the margin with, say, an additional $100 a month
through regular earnings (or welfare) and compare that to the uses to which the lump-sum EITC
is put. The authors suggest that the lumpiness of the EITC might allow people to make
investments that enhance social mobility. Further work examining this conjecture would be
valuable.

54
VI. Assessing Proposed and Potential Modifications to the EITC
Given the central role played by the EITC in the nation’s antipoverty programs, it is not
surprising that a broad range of possible credit modifications have been raised. Like the
historical forces shaping the credit, these ideas tend to push the credit toward improving
behavioral incentives or toward enhancing its antipoverty effectiveness. In this section we
discuss some of these issues.
Marriage Penalties
Proposals regularly address EITC-related marriage penalties. Several things should be kept
in mind when thinking about these. First, the tax system cannot simultaneously be progressive
(have increasing average effective tax rates), treat the family (as opposed to individuals) as the
unit of taxation, and be neutral with respect to marriage. Hence, either penalties for singles or
marriage penalties are inevitable, unless the structure of individual income taxation is
dramatically altered. Second, as noted by Holtzblatt and Rebelein, 62 percent of EITC-related
marriage penalties are borne by couples with incomes above the amount necessary to be eligible
for the EITC. We suspect that policymakers are considerably less concerned about the marriage
penalty that arises for a worker with earnings of $40,000 and his spouse with earnings of $10,000
(if they split and the spouse took the children, she could get a large EITC) than they are about the
family-formation incentives that apply to unemployed or sporadically employed workers with or
without children. Third, an extensive literature has examined the effects of antipoverty programs
on marriage and fertility generally and has found relatively small effects.
Administering the EITC through the Tax System and Other Issues of Credit Design During debates over restructuring the IRS,47 the EITC was sometimes referred to as a “non-
47See, for example, “The New IRS Law,” Washington Post, July 23, 1998, Albert Crenshaw, A6.

55
tax function of the IRS.” The rationale for this sentiment is that tax rules are sufficiently complex
that it is already beyond the IRS’s ability to effectively administer the laws required to accurately
collect taxes. By asking the IRS to administer the EITC, resources are diverted that could help
the IRS better collect taxes.
There is, of course, a clear relationship between all tax expenditures and spending programs
so that any deviation from a comprehensive income tax could be viewed as a situation where the
IRS is being asked to carry out some function other than tax collection to achieve some social
purpose.48 The practical question to pose in optimally configuring the tax system and spending
programs is what is the marginal cost of providing specific incentives through the tax system
relative to the best alternative delivery mechanism. In the case of the EITC, there are strong
arguments in support of running the EITC through the tax code. Because filing thresholds are
fairly low and because of overwithholding, most low-income families with earnings already file
tax returns. Consequently, they are already in the system, so the incremental cost of claiming the
EITC is low. The IRS collects income information from both employers and employees, so it is
straightforward in most circumstances to verify income eligibility. The IRS has little ability to
document living arrangements, however, so a significant number of errors arise in determining
who is able to claim an EITC-qualifying child. New developments with the Federal Case
Registry of Child Support Orders may improve the IRS’s ability to handle this aspect of EITC
eligibility.
Just because a case can be made that an EITC-like subsidy may appropriately be delivered
through the tax code does not mean that the EITC is optimally designed. Liebman (1999)
examines the optimal phase-out rate of the EITC. A more rapid phase-out will reduce the utility
48See Surrey (1973) for an early discussion of the concept of tax expenditures.

56
of some EITC recipients and may cause some taxpayers to leave the labor market. At the same
time, it will reduce the cost of the program, which, if the marginal excess burden of tax
collections is high enough, may lead to an increase in overall welfare given specific social
welfare weights on different income groups. Liebman uses simulation analyses to highlight the
magnitudes of the various behavioral issues in question. Results are naturally sensitive to the
compensated labor supply, the marginal excess burden of taxes, and the characteristics of the
assumed social welfare function. His simulations tend to result in optimal phase-out rates that
bracket the current rates for families with one child and two or more children.
Adjusting Further for Family Size and Tighter Integration with the Tax System In 1998 the child poverty rate for families with three or more children was 28.5 percent,
twice the 11.9 percent rate for children in smaller families. A way to address the higher poverty
rates of families with three or more children is to add a third tier to the federal EITC schedule for
these families, which would result is an EITC schedule similar to the structure of the Wisconsin
state EITC. One specific proposal implemented this idea by increasing the phase-in rate to 45
percent from 40 percent, adding nearly $500 to the maximum EITC available to a taxpayer with
three or more children. The potential drawbacks of the idea are that it costs money and it further
increases incentives for people to have children and, in some circumstances, to become single
parents.
The Minnesota state EITC also may have worthwhile lessons for the federal credit. Recall
that Minnesota adjusts its phase-ins and phase-outs of the state credit to smooth notches that are
generated by features of the federal and state tax and transfer programs. As is clear when plotting
the budget sets facing families with one child and two children, there are unusual notches and
kinks, particularly when the effects of transfer programs are taken into account. It would be

57
straightforward to alter the phase-out rates to smooth marginal tax rates at the income levels
around which families begin to pay positive levels of federal income taxes (in the absence of the
EITC). This would increase headaches for people trying to describe the structure of the credit,
but it would have little practical consequence for people taking the credit since the credit amount
is invariably found from look-up tables in the EITC instructions or by requesting the IRS to
calculate the credit. At the same time, while smoothing the phase-out rates would have clear
esthetic value, it might have very little practical consequence, since it is unlikely that any but the
most sophisticated workers would recognize the link to incremental labor market decisions and
the size of their lump-sum EITC after filing tax returns.
Cherry and Sawicky (2000) and Ellwood and Liebman (2000) go well beyond the
Minnesota model and develop more systemic policy proposals that would, under some options,
integrate the EITC, dependent exemption, and child credit. The Cherry-Sawicky “unified
universal child credit,” for example, would rise for an initial range of earnings, flatten out over
an additional range, and then phase down to a minimum benefit of $1,270 per child, an amount
that equaled the value of the dependent exemption and child credit for a taxpayer in the 28
percent bracket when their proposal was designed. The unified universal child credit would cost
more than $30 billion per year, but the modification would reduce some of the labor market
disincentives and marriage penalties that arise in the current EITC, significantly increase benefits
available to low- and moderate-income families with many children, and provide considerable
additional tax benefits to families with children and incomes between roughly $25,000 and
$50,000.49 Though a complete analysis of this idea is well beyond the scope of this chapter, both
49 Somewhat thorny technical issues would need to be worked out, such as who would receive the unified universal child credit in situations where a noncustodial parent is currently paying child support and receiving the dependent exemption and the custodial parent is receiving the EITC. Integrating the dependent exemption and EITC could result in pressure to rewrite many divorce settlements.

58
papers offer far-reaching ways to improve the tax system.
EITC and TANF Interactions As state TANF programs evolve, clear rules need to be made about what kinds of state-
subsidized activities will trigger EITC eligibility and what activities will not. The polar cases are
easy to identify: TANF payments that are like payments made under AFDC would not qualify as
income for the purposes of the EITC. Wages earned while a single mother works and receives a
TANF grant for child care will be considered income for the EITC. Congress explicitly has
indicated that “work-experience” and “community-service” jobs will not trigger the EITC. But
there is a vast gray area of other TANF-supported activities that need to be clarified. The trade-
offs in clarifying the rules are apparent: making as many people engaged in work-like activities
eligible for the EITC as possible will be more costly than having more restrictive rules, but will
also provide an additional source of support to poor families, and the EITC may help reinforce
the work-expectation message that is at the core of many state TANF programs. Attention might
also be paid to the link between the EITC and TANF-based asset tests.
The Advance Payment Option Only 1.1 percent of EITC recipients with children used the advance payment option in 1998.
Low use of the advance payment option has generated considerable discussion in policy circles,
though we think this attention is somewhat misplaced. Simple calculations suggest that
eschewing the advanced payment option, as currently designed, costs the taxpayer at most
$52.77 (assuming the taxpayer could receive the maximum available advance payment each
month, earns 8 percent interest, and does not receive his or her refund until May). Given that
low-wage workers may change jobs frequently, the transactions costs associated with setting up
advanced payments can be fairly high. This, coupled with the possibility that someone will

59
receive too much in advance payments and have to pay it back at tax time,50 suggests that the
utility cost of failing to take advantage of the advance payment option is probably small.
It is sometimes suggested that greater use of the advance payment option would reinforce
the prowork message of the EITC. Partly for this reason, officials in the United Kingdom
designed their EITC-like program, the Working Families Tax Credit (WFTC), to include
incremental receipt of payments throughout the year. There are significant differences between
the U.S. and U.K. experiences, however.51 The WFTC is paid through the employer,
retrospectively based on earnings, hours worked, and family income during the six-week period
prior to the beginning of the payment period (the previous six months). So, someone could have
a job, become eligible for the WFTC, and then leave the job and still receive the WFTC for the
duration of the six months. Rules are in place to curb efforts to manipulate income to maximize
the WFTC, but there is not yet any evidence of their effectiveness. Other aspects of the British
tax system suggest that less emphasis is placed on compliance (and perhaps that greater emphasis
is placed on minimizing the intrusiveness of tax authorities and associated forms) than occurs in
the United States, which may result in a greater willingness to tolerate overpayments or
underpayments that might arise with the WFTC. The WFTC replaced the Family Credit, which
was also delivered incrementally through the year.
VII. Summary and Conclusions Over the last 25 years, the EITC has become, by a considerable margin, the country’s largest
cash or near-cash program directed at low-income families. Its popularity is fairly easy to
50 Holtzblatt and Liebman (1998) note that taxpayers are less likely to receive too much in EITC advance payments if income is only from wages. Only about one in four EITC claimants has income from only one source during the year, however. Advance payments also lengthen the time between when money is paid out and when the IRS is able to verify eligibility. 51 See Holtzblatt and Liebman (1998) for a more detailed discussion.

60
account for. Unlike safety net programs such as AFDC, TANF, and Food Stamps, the EITC
gives no benefits to those without labor earnings. Thus, it subsidizes the incomes of people who
in some sense are “doing the right thing.” The appeal of this reaches across party lines. In
addition, unlike the safety net programs, the EITC has unambiguously positive labor market
participation incentives. By virtue of the fact that it provides no benefits for the most destitute,
the EITC is not a substitute for the safety net. But its desirable labor market effects (relative to
other safety net programs) and its targeting of the working poor undoubtedly account, at least in
part, for its rapid growth.
Research on the EITC has been a growth industry in the last decade. In our review we have
been struck by the variety of different topics and approaches taken by researchers. We can think
of no major EITC-related topic that has not received at least some attention from serious
scholars, possibly with the exception of the economic incidence of the credit. But that is not to
say that we know everything necessary about the credit. We lack information about the
participation rate of the credit since the mid-1990s. Research on the labor market effects of the
credit have pushed quasi-experimental and IV repeated cross-sectional analyses using the CPS to
their logical limits, but there have not been utility-based structural analyses of the EITC. Nor
have there been any longitudinal analyses of the EITC, which hold considerable promise for
controlling for unobservables in ways that are impossible with the CPS. Research on the EITC
and family structure and fertility is in its infancy. Work initiated by Heckman, Lochner, and
Cossa (2002) also has considerable potential for enhancing understanding of the effects of the
EITC and other policies directed at low-wage labor markets.
Stepping back further from current thrusts of the literature, two potentially promising new
ways for research to develop are apparent. First, Smeeding, Ross-Phillips, and O’Connor (2000)

61
raise an important issue. To what extent and through what channels can the EITC enhance
economic well-being? Are there nonlinearities associated with the EITC, possibly through its
lumpiness, that allow the credit to enhance well-being in a way that differs significantly from
equivalent-sized (in total) payments received throughout the year?
Second, it is easy for researchers to focus on narrow, well-defined questions that lend
themselves to standard (or possibly innovative) methodological tools. Perhaps as a consequence,
however, less attention has been paid to the design of the constellation of public policies that are
or could be directed at low-wage labor markets. Questions along these lines would include: What
are the relative merits of the EITC and employer-based wage subsidies, of the EITC, and of the
minimum wage? Do the answers differ given existing tax and transfer provisions? Can the
broader tax and transfer system be altered or more tightly integrated in welfare-enhancing ways?
The specific research questions that have dominated the EITC agenda are critical stepping stones
for satisfactory answers to these more global issues, but it would be inappropriate as research
evolves to study only the narrower issues at the expense of the broader.

62
Table 1: Earned Income Tax Credit Parameters, 1979-2001 (in nominal dollars)
Year
Phase-in Rt %
Phase-in Range
Max Credit
Phase-out Rte
(%)
Phase-out Range
1975-78 10.0 $0-$4,000 $400 10.0 $4,000 - $8,000 1979-84 10.0 0-5,000 500 12.5 6,000 – 10,000 1985-86 11.0 0-5,000 550 12.22 6,500 – 11,000 1987 14.0
0-6,080
851
10.0
6,920 – 15,432 1988 14.0 0-6,240 874 10.0 9,840 – 18,576 1989 14.0 0-6,500 910 10.0 10,240 – 19,340 1990 14.0 0-6,810 953 10.0 10,730 – 20,264 1991a 16.71
17.32 0-7,140 1,192
1,235 11.93 12.36
11,250 - 21,250 11,250 – 21,250
1992a 17.61 18.42
0-7,520 1,324 1,384
12.57 13.14
11,840 - 22,370 11,840 – 22,370
1993a 18.51 19.52
0-7,750 1,434 1,511
13.21 13.93
12,200 - 23,050 12,200 – 23,050
1994 23.61 30.02
7.653
0-7,750 0-8,245 0-4,000
2,038 2,528
306
15.98 17.68
7.65
11,000 - 23,755 11,000 - 25,296 5,000 - 9,000
1995 34.01 36.02
7.653
0-6,160 0-8,640 0-4,100
2,094 3,110
314
15.98 20.22
7.65
11,290 - 24,396 11,290 - 26,673 5,130 - 9,230
1996 34.01 40.02
7.653
0-6,330 0-8,890 0-4,220
2,152 3,556
323
15.98 21.06
7.65
11,610 - 25,078 11,610 - 28,495 5,280 - 9,500
1997 34.01 40.02
7.653
0-6,500 0-9,140 0-4,340
2,210 3,656
332
15.98 21.06
7.65
11,930 - 25,750 11,930 - 29,290 5,430 - 9,770
1998 34.01 40.02
7.653
0-6,680 0-9,390 0-4,460
2,271 3,756
341
15.98 21.06
7.65
12,260 - 26,473 12,260 - 30,095 5,570 - 10,030
1999 34.01 40.02
7.653
0-6,800 0-9,540 0-4,530
2,312 3,816
347
15.98 21.06
7.65
12,460 - 26,928 12,460 - 30,580 5,670 - 10,200
2000 34.01 40.02
7.653
0-6,920 0-9,720 0-4,610
2,353 3,888
353
15.98 21.06
7.65
12,690 - 27,413 12,690 - 31,152 5,770 - 10,380
2001 34.01 40.02
7.653
0-7,140 0-10,020 0-4,760
2,428 4,008
364
15.98 21.06
7.65
13,090 - 28,281 13,090 - 32,121 5,950 - 10,708
Source: 1998 Green Book, Committee on Ways and Means, U.S. House of Representatives, U.S. Government Printing Office, page 867. 1998 through 2001 parameters come from Publication 596, Internal Revenue Service
a Basic credit only. Does not include supplemental young child or health insurance credits. 1 Taxpayers with one qualifying child. 2 Taxpayers with more than one qualifying child. 3 Childless taxpayers.

63
Table 2: State Earned Income Tax Credits, Tax Year 2001
State (year adopted)
Percentage of Federal Credit
Colorado (1999)
10
District of Columbia
(2000)
25
Kansas (1998)
10
Maryland (1987)a
16 (rising to 20 in 2003)
Massachusetts (1997)
15
Minnesota (1991)
Averages 33%, varies by earningsb
New Jersey (2000)
15 (20% by 2003), limited to families with
incomes below $20,000
New York (1994)
25 (30% by 2003)
Vermont (1988)
32
Refundable Credits
Wisconsin (1989)
4% one child
14% 2 children 43% 3 children
Illinois (2000)
5
Iowa (1990) 6.5
Maine (2000)
5
Oregon (1997)
5
Nonrefundable Credits
Rhode Island (1975)
25.5
Source: Nicholas Johnson, 2001, “A Hand Up: How State Earned Income Tax Credits Help Working Families Escape Poverty in 2001: An Overview,” Center on Budget and Policy Priorities, December, Particularly Table 4. Adoption years are from Dickert-Conlin and Houser (2002), which in turn are from Johnson.
aA Maryland taxpayer may claim a refundable credit or a non-refundable credit (equal to 50 percent of the federal credit), but not both. bMinnesota’s credit for families with children, unlike the other credits shown in the table, is not expressly structured as a percentage of the federal credit. Depending on income levels, the credit may range from 22 percent to 46 percent of the federal credit.

64
Table 3: Maximum Real EITC Credit, Real Spending and Number of Participants
(in 1999 dollars)
Year Real Maximum EITC
Real EITC Spending (millions)
Number of Claimants
(thousands) 1975 1,239 3,871 6,215 1976 1,171 3,792 6,473 1977 1,100 3,098 5,627 1978 1,022 2,678 5,192 1979 1,147 4,709 7,135 1980 1,011 4,015 6,954 1981 916 3,504 6,717 1982 863 3,064 6,395 1983 836 3,002 7,368 1984 802 2,626 6,376 1985 852 3,233 7,432 1986 836 3,054 7,156 1987 1248 4,973 8,738 1988 1231 8,303 11,148 1989 1223 8,861 11,696 1990 1215 9,614 12,542 1991 1511 13,584 13,665 1992 1643 15,470 14,097 1993 1742 17,913 15,117 1994 2842 23,725 19,017 1995 3400 28,374 19,334 1996 3776 30,607 19,464 1997 3795 31,800 19,490 1998 3839 31,959 19,516 1999 3816 32,270 19,419 2000 3762 31,471 19,363
Source: 1998 Green Book, and general IRS Statistics of Income data on individuals available at http://www.irs.ustreas.gov/prod/tax_stats/soi/ind_gss.html. The data reflect claims (allowed through math error processing) and do not reflect subsequent IRS enforcement actions after math error processing

65
Table 4: Summary of Empirical Evidence on the Effects of the EITC on Labor Force Participation and Hours of Work
Study
Data Source and
Population Covered
Years Covered Estimation Method Used and Source of Identification Impact Estimates
Labor Force Participation:
Dickert, Houser and Scholz (1995), “DHS”
SIPP data. Cross-sectional, using state-level variation. Focus on participation effects of single parents and couples. Drop cases with high assets.
1990 calendar year file.
Variation in budget sets is measured by the effects that cross-state variation in tax and transfer rules have on the returns to moving from 0 to 20 (40) hours in the labor market. The responsiveness of LFP to the cross-state variation in budget sets is used to make inferences about EITC expansions.
The OBRA93 expansions would increase labor force participation by 3.3 percentage points for single women from a base of 56.4 percent. This implies the elasticity of labor force participation (LFP) with respect to net income is roughly 0.85, see note 1.
Eissa and Liebman (1996) Repeated cross sections of the CPS. Focus on single women with children.
1985-87 March CPS for the “pre” period, 1989-1991 March CPS for the “post” period
Difference-in-difference. “The difference between the change in labor force participation of single women with children and single women without children is our estimate of the effect of TRA86 on participation.”
TRA86 resulted in a 2.8 percentage point increase in labor force participation from a base of 74.2 percent. This implies the elasticity of LFP with respect to net income is roughly 1.16, see note 2.
Keane and Moffitt (1998) and Keane (1995)
SIPP data. Cross-sectional. The sample is single women with children. Drop cases with high assets.
Fourth wave of the 1994 SIPP.
Estimate a structural model taking detailed account of the tax and transfer system on budget sets. Families make hours decisions moving from 0 to 20 to 40, and participation decisions for food stamps, AFDC and housing programs.
Changes in the EITC between 1984 and 1996 would increase labor force participation rates by 10.7 percentage points, from a base of 65.4 percent. This implies the elasticity of LFP with respect to net income is roughly 0.96, see note 3.
Meyer and Rosenbaum (2001)
Repeated cross sections of the CPS. Focus on single women with children.
1985-1997 March CPS and Merged Outgoing Rotation Group data from 1984-1996.
Cross-state variation in budget sets as measured by the effects that cross-state variation in tax and transfer rules have on after-tax wages, where wages are randomly drawn from empirical distributions and over-time variation in these rules.
$1000 reduction in income taxes if a woman works, increases employment by 2.3 to 2.9 percentage points. These imply elasticities of LFP with respect to net income of 0.69 and 0.70. See footnote 35 of Meyer and Rosenbaum (1999).
Eissa and Hoynes (1998) Repeated cross sections of the CPS. Focus on married couples, with fewer than 12 years of schooling.
1985-1997 March CPS.
Two approaches: difference-in-difference, and intertemporal variation in tax rates caused by tax reforms. The latter is captured by using predicted net of tax wages for everyone in the sample assuming a full-time, full-year job.
The EITC expansions between 1984 and 1996 increased LFP of married men by 0.2 percentage points and reduced the LFP of married women by 1.2 percentage points. The elasticity of LFP w/ respect to net wages is 0.03 for husbands and 0.29 for wives (page 22).
Hotz, Mullin, and Scholz (2002a)
Longitudinal administrative data from the California welfare, unemployment and federal income tax systems
1987-1998 Rely on the phased-in EITC expansions beginning in 1990 that, beginning in 1994, disproportionately benefited families with two or more children relative to one child.
LFP increased by 6 percentage points and EITC claimed by $439 for families with two or more children relative to those for with one child. The elasticity of LFP w/ respect to labor market earnings is between 0.97 and 1.69, depending on what year is used to estimate average LFP and earnings.

66
Table 4: (Continued)
Study
Data Source and
Population Covered
Years Covered Estimation Method Used and Source of Identification Impact Estimates
Hours of Work:
Hoffman and Seidman (1990), U.S. General Accounting Office (1993) and Dickert, Houser and Scholz (1995) – “DHS”
PSID for Hoffman and Seidman, CPS (?) for GAO and SIPP for DHS
1990 Calendar year file for DHS
Each study simulates hours responses using parameters from the negative income tax experiments, and, in the DHS study, parameters from the kinked budget set literature.
DHS simulate labor supply responses to the 1993 EITC expansion (1993-96) of –0.09 to –4.04 percent. These range from 0 to –3.17 percent for husbands, -1.47 to -11.36 percent for wives and -0.53 to -4.02 percent for single women heads. See Note 4.
Eissa and Liebman (1996)
Repeated cross sections of the CPS. Focus on single women with children.
1985-87 March CPS for the “pre” period, 1989-1991 March CPS for the “post” period
Difference-in-difference. Regression of annual hours on characteristics and dummy variables for kids, post-86 and their interaction.
Statistically insignificant effect on hours (the 1986 expansions were associated with an increase of 25.2 hours, with a standard error of 15.2).
Keane and Moffitt (1998) and Keane (1995)
SIPP data. Cross-sectional. The sample is single women with children. Drop cases with high assets.
Fourth wave of the 1994 SIPP.
Estimate a structural model taking detailed account of the tax and transfer system on budget sets. Families make hours decisions moving from 0 to 20 to 40, and participation decisions for food stamps, AFDC and housing programs.
The estimates show a modest increase in aggregate hours worked from the EITC expansions between 1984 and 1996. Mean weekly hours increase to 26.5 from 24.1. These changes are not broken into the contribution of new labor market participants and potential reductions of hours of those already in the labor market.
Eissa and Hoynes (1998)
Repeated cross sections of the CPS. Focus on married couples, with fewer than 12 years of schooling.
1985-1997 March CPS.
Instrumental variables with two sets of instruments. One has EITC parameters and interactions with birth cohort and education. The second uses imputed marginal tax rates for incomes in $5k increments from $0 to $100k.
The EITC expansions between 1984 and 1996 reduced hours of married men by 45 (or 2 percent) and reduced hours of married women between 13 and 93 (or 0.8 to 6 percent). Uncompensated wage elasticities are 0.06 to 0.07 for men and 0.08 to 0.52 for women. Income elasticities for men were –0.03 and for women, -0.04 to –0.41.
Note 1: The paper reports that the EITC increases the probability of working by 3.3 percentage points. Table 3 of the paper shows the mean labor force participation rate of single parents was 56.4 percent. Meyer and Rosenbaum (1999), Appendix Table 1 shows that taxes fell by $732 for single women with children in their sample between 1992 and 1996. Mean wages in DHS (1995) are $6.55. Data from Table 1 of Eissa and Liebman (1996) imply that single women with children worked 1,620 hours (conditional on working). This implies the elasticity of labor force participation with respect to the net-of-tax wage is (3.3/56.4) / (732/[6.55*1620]) = 0.85, as shown in the table. The sample used in DHS differs somewhat from the samples used in Eissa and Liebman, and Meyer and Rosenbaum primarily in that they drop families that would not be eligible for transfer program benefits even if they did not work (because they fail asset tests).
Note 2: The 1986 Tax Reform (TRA86) altered many aspects of the tax system in addition to expanding the EITC. From 1984-

67
86, the pre-period, the maximum EITC was between $500 and $550. From 1988 to 1990, the maximum EITC ranged between $874 and $953. TRA86 also increased the standard deduction for head of households to $4,400 in 1988 from $2,480 in 1986; increased the dependent exemption to $1,950 in 1988 from $1,086 in 1986, and extended the 15 percent bracket for head of household filers. Meyer and Rosenbaum (1999), Appendix Table 1 shows that taxes fell by $492 for single women with children in their sample between 1984 and 1988. Eissa and Liebman report that earnings, conditional on working in their sample were $15,188. This implies the elasticity of labor force participation with respect to the net-of-tax wage is (2.8/74.2) / (492/15188) = 1.16, as shown in the table.
Note 3: Table 5 of Keane (1995), which is based on Keane and Moffitt (1998) shows that increasing the EITC to 40 percent
increased labor force participation rates by 10.7 percentage points from a base of 65.4 percent. In the text, this experiment is characterized as increasing the EITC to its 1996 level from its 1984 level. Meyer and Rosenbaum (1999), Appendix Table 1 shows that taxes fell by $1,443 for single women with children in their sample between 1984 and 1996. Mean wages in Keane and Moffitt (1998) are $5.20. Data from Table 1 of Eissa and Liebman (1996) imply that single women with children worked 1,620 hours (conditional on working). This implies the elasticity of labor force participation with respect to the net-of-tax wage is (10.7/65.4) / (1443/[5.20*1620]) = 0.96, as shown in the table. Like DHS the sample drops families that would not be eligible for transfer program benefits even if they did not work (because they fail asset tests). This elasticity calculation may be biased downward if the Keane and Moffitt model did not take into account other features of TRA86 (see note 2). That would make the implied average change in after-tax income smaller than $1,443, which would increase the elasticity estimate.
Note 4: The high end of the range of these estimates come from the study of Hausman (1981) who reported much larger
elasticities than have been reported elsewhere. If instead, we focus on the mean parameters from the Negative Income Tax Studies and the preferred parameters from the study by Triest (1990), which adopts the Hausman methodology, Dickert, Houser and Scholz (1995) report labor supply responses to the 1993 EITC expansion (1993-96) of –0.54 to –1.17 percent. These range from –0.34 to –1.32 percent for husbands, -2.64 to -3.03 percent for wives and -1.08 to -1.11 percent for single women heads. See Table 2 of Dickert, Houser and Scholz (1995). Triest (1990) finds uncompensated wage elasticities of around 0.05 for men and 0.25 for women, and his estimates of virtual income elasticities are 0.0 for men and –0.15 for women.

68
Figure 1. The Earned Income Tax Creditfor a Family with Two or More Children in 1979 and 2001
0
1,000
2,000
3,000
4,000
0 5,000 10,000 15,000 20,000 25,000 30,000 35,000
Earnings (current dollars)
Cre
dit A
mou
nt (c
urre
nt d
olla
rs)
2001
1979
(…$3,816)2
(…$500)2
(40.0)1
(21.06)3
(12.5)3(10.0)1
Notes: 1 Subsidy rate. 2 Maximum benefit for two or more children. 3 Benefit reduction (implicit tax) rate.

69
Note: Calculations only reflect the effects of the state and federal tax system and do not include the effects of transfer programs. See Feenberg and Coutts (1993) for details of the NBER’s TAXSIM model used for these calculations.
Figure 2b: Taxes and Marginal Rates, Family of 4, Illinois, 1984 (in 1998 $)
-4000
-2000
0
2000
4000
6000
8000
10000
0 3922 7844 11766 15688 19610 23532 27454 31376 35298
Dollars
Dol
lars
-30
-20
-10
0
10
20
30
40
50
60
MTR
s (p
erce
nt)
Total Tax Payments Effective MTRs
Figure 2a: Taxes and Marginal Rates, Family of 4, Illinois, 1998
-4000
-2000
0
2000
4000
6000
8000
10000
0 2500 5000 7500 10000 12500 15000 17500 20000 22500 25000 27500 30000 32500 35000
Dollars
Dol
lars
-30-20-100102030405060
MTR
s (p
erce
nt)
Total Tax Payments Effective MTRs

70
Figure 3: Distribution of Total EITC Returns and EITC Payments of Families with Children, by AGI, 1999
0
5
10
15
20
25
30
35
0-5000 5000-10000 10000-15000 15000-20000 20000-25000 25000+
AGI Class
Perc
enta
ge o
f Tot
al
Percentage of Total EITC Returns Filed Percentage of Total EITC Amounts Claimed
Source: http://www.irs.gov/taxstats/display/0,,i1%3D40%26genericId%3D16882,00.html, (99INDTR.EXE, posted 1-28-02), “Individual Income Tax Returns, 1999” and authors’ calculations.

71
Figure 4: Effects of the EITC on Labor Force Participation and Hours of Work
Leisure �Hours of Work ←
Dis
posa
ble
Inco
me
Y
1IIU
0
0IIU
1IU
0IU
e
dc
a
b
1IIIU
0IIIU
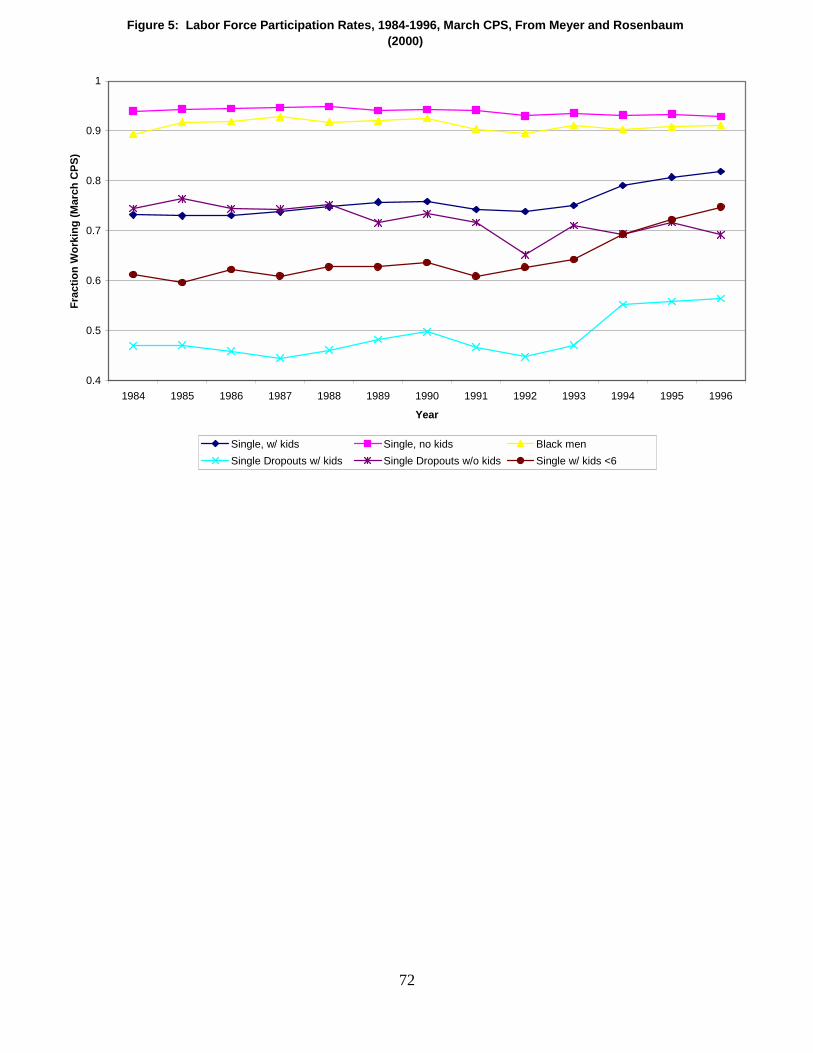
72
Figure 5: Labor Force Participation Rates, 1984-1996, March CPS, From Meyer and Rosenbaum (2000)
0.4
0.5
0.6
0.7
0.8
0.9
1
1984 1985 1986 1987 1988 1989 1990 1991 1992 1993 1994 1995 1996
Year
Frac
tion
Wor
king
(Mar
ch C
PS)
Single, w/ kids Single, no kids Black menSingle Dropouts w/ kids Single Dropouts w/o kids Single w/ kids <6

73
References
Allingham, M. and Agar Sandmo, 1972, “Income Tax Evasion: A Theoretical Analysis,” Journal of Public Economics, 1:3/4, 323-338
Alm, James and Leslie A. Whittington, 1995, “Does the Income Tax Affect Marital Decision?” National Tax Journal, 48(4), 565-572
Andreoni, James, 1992, “IRS as Loan Shark: Tax Compliance with Borrowing Constraints,” Journal of Public Economics, 49(3), 35-46
Angrist, Joshua and Alan Krueger, 1999. “Empirical Strategies in Labor Economics,” in Handbook of Labor Economics, O. Ashenfelter and D. Card, eds., Vol. 3A, 1999.
Barrow, Lisa and Leslie McGranahan, 2000, “The Effects of the Earned Income Tax Credit on the Seasonality of Household Expenditures,” National Tax Journal, Volume LIII, No. 4, Part 2, December, 1211-1243
Becker, Gary, 1964, Human Capital, New York: Columbia University Press
Ben Porath, Yoram, 1967, “The Production of Human Capital and Life-Cycle Earnings,” Journal of Political Economy, 75(4), 352-365
Bishop, John and Robert Haveman, 1978, “Targeted Employment Subsidies: Issue of Structure and Design,” Institute for Research on Poverty, Special Report #24
Blumenthal, Marsha, Brian Erard and Chih-Chin Ho, 1999, “Participation and Compliance with the Earned Income Tax Credit,” mimeo
Blundell, Richard and Thomas MaCurdy, 1999, “Labor Supply: A Review of Alternative Approaches,” in Handbook of Labor Economics, O. Ashenfelter and D. Card, eds., Vol. 3A, 1999, 1560-1695.
Blundell, Richard, Alan Duncan, Julian McCrae and Costas Meghir, 2000, “The Labor Market Impact of the Working Families Tax Credit in the UK,” Fiscal Studies, 21, 65-74
Browning, Edgar, 1995, “Effects of the Earned Income Tax Credit on Income and Welfare,” National Tax Journal, XLVIII, 23-43.
Browning, Martin, 1992, “Children and Economic Household Behavior,” Journal of Economic Literature, 30(3), pp. 1434-75
Bull, Nicholas, Janet Holtzblatt, James R. Nunns and Robert Rebelein, 1999, “Defining and Measuring Marriage Penalties and Bonuses,” OTA Paper 82-R, U.S. Treasury Department

74
Burkhauser, Richard V., Kenneth A. Couch and Andrew Glenn, 1996, “Public Policies for the Working Poor: The Earned Income Tax Credit Versus Minimum Wage Legislation,” Research in Labor Economics, S. Polachek (ed.), JAI Press, 65-109
Cherry, Robert and Max B. Sawicky, 2000, “Giving Tax Credit Where Credit is Due,” Economic Policy Institute Briefing Paper
Council of Economic Advisers, 1998, “Good News for Low Income Families: Expansions in the Earned Income Tax Credit and the Minimum Wage,” Washington, D.C., December
Council of Economic Advisers, 2000, Economic Report of the President, Washington, D.C., February
DeParle, Jason, 1999, “Once a Forlorn Avenue, Tax Preparers Now Flourish,” New York Times, 3/21, p. 1
Dickert, Stacy, Scott Houser and John Karl Scholz, 1995, “The Earned Income Tax Credit and Transfer Programs: A Study of Labor Market and Program Participation,” Tax Policy and the Economy, James M. Poterba (ed.), National Bureau of Economic Research and the MIT Press, 9, 1-50
Dickert-Conlin, Stacy and Amitabh Chandra, 1999, “Taxes and the Timing of Births,” Journal of Political Economy, 107(1), 161-177
Dickert-Conlin, Stacy and Scott Houser, 1998, “Taxes and transfers: A new look at the marriage penalty,” National Tax Journal, 51(2), 175-217.
Dickert-Conlin, Stacy, 1999, “Taxes and transfers: their effects on the decision to end a marriage,” Journal of Public Economics, 73, pp. 217-240.
Dickert-Conlin, Stacy and Scott Houser, 2002, “EITC and Marriage,” National Tax Journal, Volume LV, No. 1, March, 25-39
Eissa, Nada and Hilary Williamson Hoynes, 1998, “The Earned Income Tax Credit and the Labor Supply of Married Couples,” NBER Working Paper #6856.
Eissa, Nada and Hilary Williamson Hoynes, 1999, “Good News for Low Income Families? Tax-Transfer Schemes and Marriage,” mimeo, University of California, Berkeley.
Eissa, Nada and Jeffrey B. Liebman, 1996, “Labor Supply Response to the Earned Income Tax Credit, Quarterly Journal of Economics, May, 605-637
Ellwood, David T., 2000, “The Impact of the Earned Income Tax Credit and Social Policy Reforms on Work, Marriage, and Living Arrangements,” National Tax Journal, Volume LIII, No. 4, Part 2, December, 1063-1105

75
Ellwood, David T. and Jeffrey B. Liebman, 2000, “The Middle Class Parent Penalty: Child Benefits in the U.S. Tax Code,” mimeo, John F. Kennedy School of Government, Harvard University, May
Feenberg, Daniel and Harvey Rosen, 1987, “The Marriage Tax is Down But Not Out,” National Tax Journal, December, 567-575
Feenberg, Daniel Richard, and Elizabeth Coutts, 1993, “An Introduction to the TAXSIM Model,” Journal of Policy Analysis and Management 12(1), Winter, 189-194 and http://www.nber.org/taxsim
Hausman, Jerry, 1985, “Taxes and Labor Supply,” in Handbook of Public Economics, A. Auerbach and M. Feldstein, eds.
Haveman, Robert, 1996, “Reducing Poverty while Increasing Employment: A Primer on Alternative Strategies, and a Blueprint,” OECD Economic Studies, 26, 7-42
Heckman, James J., Lance Lochner, and Ricardo Cossa, 2002, “Learning-by-Doing Vs. On-the-Job Training: Using Variation Induced by the EITC to Distinguish Between Models of Skill Formation,” NBER Working Paper #9083, July
Hill, Carolyn J., V. Joseph Hotz, Charles H. Mullin, and John Karl Scholz, 1999, “EITC Eligibility, Participation and Compliance Rates for AFDC Households: Evidence from the California Caseload,” final report for the State of California, University of California, Los Angeles, April
Hoffman, Saul D. and Laurence S. Seidman, 1990, The Earned Income Tax Credit: Antipoverty Effectiveness and Labor Market Effects, W.E. Upjohn Institute for Employment Research
Holtzblatt, Janet, 1991, “Administering Refundable Tax Credits: Lessons from the EITC Experience,” Proceedings of the Eighty-Fourth Annual Conference on Taxation, National Tax Association 180-186
Holtzblatt, Janet and Janet McCubbin and Robert Gillette, 1994, “Promoting Work Through the EITC,” National Tax Journal, September, 47(3), 591-607
Holtzblatt, Janet and Jeffrey B. Liebman, 1998, “The EITC Abroad: Implications of the British Working Families Tax Credit for Pay-As-You-Earn Administration of the EITC,” National Tax Journal, September
Holtzblatt, Janet and Robert Rebelein, 1999, “Measuring the Effect of the EITC on Marriage Penalties and Bonuses,” mimeo, Treasury Department, November
Hotz, V. Joseph, Charles H. Mullin and John Karl Scholz, 2002a, “The Earned Income Tax Credit and Labor Market Participation of Families on Welfare,” mimeo, UCLA, Vanderbilt and University of Wisconsin – Madison, March

76
Hotz, V. Joseph, Charles H. Mullin and John Karl Scholz, 2002b, “Welfare, Employment, and Income: Evidence on the Effects of Benefit Reductions from California,” American Economic Review Papers and Proceedings, May, 380-384
Hoynes, Hilary, 1997, “Does Welfare Play and Role in Female Headship Decision?” Journal of Public Economics, 65(2), 89-117
Internal Revenue Service, 1996, “Federal Tax Compliance Research: Individual Income Tax Gap Estimates for 1985, 1988, and 1992,” Publication 1415 (Rev. 4-96), Washington, D.C.
Internal Revenue Service, 1999, “Individual Income Tax Returns, 1997” http://www.irs.ustreas.gov/prod/tax_stats/soi/ind_gss.html, (97INDTR.EXE, 97in04ag.xls, posted 12-28-99)
Internal Revenue Service, 2002a, “Participation in the Earned Income Tax Credit Program for Tax Year 1996,” January 31, Washington, D.C.
Internal Revenue Service, 2002b, “Compliance Estimates for Earned Income Tax Credit Claimed on 1999 Returns,” February 28, Washington, D.C.
Jappelli, Tullio, 1990, “Who is Credit Constrained in the U.S. Economy?” Quarterly Journal of Economics, 105(1), 219-234
Jappelli, Tullio, Jorn-Steffen Pischke, and Nicholas S. Souleles, 1998, “Testing for Liquidity Constraints in Euler Equations with Complementary Data Sources,” Review of Economics and Statistics, 80(2), 251-262
Johnson, Nicholas, 2001, “A Hand Up: How State Earned Income Tax Credits Help Working Poor Families Escape Poverty in 2001,” Center on Budget and Policy Priorities
Keane, Michael P., 1995, “A New Idea for Welfare Reform,” Federal Reserve Bank of Minneapolis Quarterly Review, 19(2), Spring, 2-28
Keane, Michael and Robert Moffitt, 1998, “A Structural Model of Multiple Welfare Program Participation and Labor Supply,” International Economic Review, 39(3), 553-589.
Killingsworth, M. and J. Heckman, 1986, “Labor Supply of Women,” in Ashenfelter and Layard (eds.) Handbook of Labor Economics, Vol. 1, 1986.
Killingsworth, Mark, 2002, “Wage Rate Subsidies,” this volume
Liebman, Jeffrey, 1997a, “The Impact of the Earned Income Tax Credit on Incentives and Income Distribution,” Tax Policy and the Economy, 83-119
Liebman, Jeffrey B., 1997b, “Noncompliance and the Earned Income Tax Credit: Taxpayer Error or Taxpayer Fraud?” mimeo, August 23

77
Liebman, Jeffrey B., 1999, “The Optimal Design of the Earned Income Tax Credit,” mimeo, Kennedy School of Government
Liebman, Jeffrey B., 2000, “Who Are the Ineligible EITC Recipients?” National Tax Journal, Volume LIII, No. 4, Part 2, December, 1165-1185
McCubbin, Janet, 2000, “EITC NonCompliance: The Determinants of the Misreporting of Children,” National Tax Journal, Volume LIII, No. 4, Part 2, December, 1135-1164
Meyer, Bruce D., 1995, “Natural and Quasi-Experiments in Economics,” Journal of Business and Economic Statistics, 13(2), 151-161.
Meyer, Bruce D. and Dan T. Rosenbaum, 1999a, “Welfare, the Earned Income Tax Credit, and the Labor Supply of Single Mothers,” NBER Working Paper 7363, September
Meyer, Bruce D. and Dan T. Rosenbaum, 2000, “Making Single Mothers Work: Recent Tax and Welfare Policy and Its Effects,” National Tax Journal, Volume LIII, No. 4, Part 2, December, 1027-1061
Meyer, Bruce D. and Dan T. Rosenbaum, 2001, “Welfare, the Earned Income Tax Credit, and the Labor Supply of Single Mothers,” Quarterly Journal of Economics, CXVI(3), August, 1063-1114
Moffitt, Robert, 1990, “The Econometrics of Kinked Budget Constraints,” Journal of Economic Perspectives, 4(2), Spring, 119-139.
Moffitt, Robert A., 1998, “The Effect of Welfare on Marriage and Fertility,” in Welfare, the Family and Reproductive Behavior, R. Moffitt (ed.), National Academy Press, 50-97
Moffitt, Robert A., 1999, “The Effect of Pre-PRWORA Waivers on AFDC Caseloads and
Female Earnings, Income, and Labor Force Behavior,” manuscript, Johns Hopkins University, May
Moffitt, Robert A., 2002, “The Temporary Assistance for Needy Families Program,” this volume
Moffitt, Robert and Mark Wilhelm, 2000, "Taxation and the Labor Supply Decisions of the Affluent," in Does Atlas Shrug? The Economic Consequences of Taxing the Rich, edited by Joel Slemrod, Harvard University Press
Neumark, David and William Wascher, 2001, “Using the EITC to Help Poor Families: New Evidence and a Comparison with the Minimum Wage,” National Tax Journal, Volume LIV, No. 2, June, 281-317
Pencavel, John, 1986, “Labor Supply of Men: A Survey,” in The Handbook of Labor Economics, Vol. 1, 1986.
Phillips, Katherin Ross, 2001, “Who Knows About the Earned Income Tax Credit?” New Federalism: National Survey of American Families, The Urban Institute, B-27, January

78
Romich, Jennifer and Thomas Weisner, 2000, “How Families View and Use the EITC: Advance Payment Versus Lump Sum Delivery,” National Tax Journal, Volume LIII, No. 4, Part 2, December, 1245-1264
Scholz, John Karl, 1994, “The Earned Income Tax Credit: Participation, Compliance, and Anti-poverty Effectiveness,” National Tax Journal, March, 59-81
Scholz, John Karl, 1996, “In-Work Benefits in the United States: The Earned Income Tax Credit,” Economic Journal, Vol. 106, January, 156-169
Scholz, John Karl, 1997, “Testimony for the House Ways and Means Committee,” May 8
Scholz, John Karl and Kara Levine, 2001, “The Evolution of Income Support Policy in Recent Decades,” in Understanding Poverty, S. Danziger and R. Haveman (eds), Harvard University Press and Russell Sage Foundation, 193-228
Smeeding, Timothy M., Katherine Ross-Phillips, and Michael O’Connor, 2000, “The EITC: Expectation, Knowledge, Use and Economic and Social Mobility” National Tax Journal, Volume LIII, No. 4, Part 2, December, 1187-1209
Souleles, Nicholas S., 1999, “The Response of Household Consumption to Income Tax Refunds,” American Economic Review, September, 947-958
Steuerle, C. Eugene, 1991, “The ‘Superterranean’ Economy,” Tax Notes, May 6, 647
Surrey, Stanley, 1973, Pathways to Tax Reform: The Concept of Tax Expenditures, Harvard University Press
Thaler, Richard H., 1994, “Psychology and Savings Policies,” American Economic Review Papers and Proceedings, 186-192
U.S. Congressional Budget Office, 1997, “For Better or Worse: Marriage and the Federal Income Tax,” June, Washington, D.C.
U.S. General Accounting Office, 1993, “Earned Income Tax Credit: Design and Administration Could be Improved,” GAO/GGD-93-145, Washington, D.C.
U.S. General Accounting Office, 1998, “Earned Income Tax Credit: IRS’ Tax Year 1994 Compliance Study and Recent Efforts to Reduce NonCompliance,” GAO/GGD-98-150, Washington, D.C.
U.S. General Accounting Office, 2000, “Financial Audit: IRS’ Fiscal Year 1999 Financial Statements,” GAO/AIMD-00-76, Washington, D.C.

79
Ventry, Dennis, 2000, “The Collusion of Tax and Welfare Politics: The Political History of the Earned Income Tax Credit 1969-1999,” National Tax Journal, Volume LIII, No. 4, Part 2, December, 983-1026
Weiss, Yoram, 1972, “One the Optimal Lifetime Pattern of Labour Supply,” Economic Journal, 82(328), 1293-1315.
Whittington, Leslie A., James Alm, and H. Elizabeth Peters, 1990, “Fertility and the Personal Exemption: Implicit Pronatalist Policy in the United States, American Economic Review, 80(3), June 1990: 545-556.