Technology's Edge: The Educational Benefits of Computer ... · Technology's Edge: The Educational...
62
NBER WORKING PAPER SERIES TECHNOLOGY'S EDGE: THE EDUCATIONAL BENEFITS OF COMPUTER-AIDED INSTRUCTION Lisa Barrow Lisa Markman Cecilia E. Rouse Working Paper 14240 http://www.nber.org/papers/w14240 NATIONAL BUREAU OF ECONOMIC RESEARCH 1050 Massachusetts Avenue Cambridge, MA 02138 August 2008 We thank the many dedicated principals, teachers, and staff of the school districts that participated in this project as well as Gadi Barlevy, Thomas Cook, Jonas Fisher, Jean Grossman, Brandi Jeffs, Alan Krueger, Lisa Krueger, Sean Reardon, Jesse Rothstein, Diane Whitmore Schanzenbach, Pei Zhu, and seminar participants at Columbia University, Duke University, the Federal Reserve Bank of Chicago, McMaster University, Queens University, and the University of Notre Dame for helpful conversations and comments. Elizabeth Debraggio, Benjamin Kaplan, Katherine Meckel, Kyung-Hong Park, Ana Rocca, and Nathan Wozny provided expert research assistance. Funding for this project was generously provided by the Education Research Section at Princeton University. Any views expressed in this paper do not necessarily reflect those of the Federal Reserve Bank of Chicago or the Federal Reserve System. Any errors are ours. The views expressed herein are those of the author(s) and do not necessarily reflect the views of the National Bureau of Economic Research. NBER working papers are circulated for discussion and comment purposes. They have not been peer- reviewed or been subject to the review by the NBER Board of Directors that accompanies official NBER publications. © 2008 by Lisa Barrow, Lisa Markman, and Cecilia E. Rouse. All rights reserved. Short sections of text, not to exceed two paragraphs, may be quoted without explicit permission provided that full credit, including © notice, is given to the source.
Transcript of Technology's Edge: The Educational Benefits of Computer ... · Technology's Edge: The Educational...

NBER WORKING PAPER SERIES
TECHNOLOGY'S EDGE:THE EDUCATIONAL BENEFITS OF COMPUTER-AIDED INSTRUCTION
Lisa BarrowLisa Markman
Cecilia E. Rouse
Working Paper 14240http://www.nber.org/papers/w14240
NATIONAL BUREAU OF ECONOMIC RESEARCH1050 Massachusetts Avenue
Cambridge, MA 02138August 2008
We thank the many dedicated principals, teachers, and staff of the school districts that participatedin this project as well as Gadi Barlevy, Thomas Cook, Jonas Fisher, Jean Grossman, Brandi Jeffs,Alan Krueger, Lisa Krueger, Sean Reardon, Jesse Rothstein, Diane Whitmore Schanzenbach, Pei Zhu,and seminar participants at Columbia University, Duke University, the Federal Reserve Bank of Chicago,McMaster University, Queens University, and the University of Notre Dame for helpful conversationsand comments. Elizabeth Debraggio, Benjamin Kaplan, Katherine Meckel, Kyung-Hong Park, AnaRocca, and Nathan Wozny provided expert research assistance. Funding for this project was generouslyprovided by the Education Research Section at Princeton University. Any views expressed in this paperdo not necessarily reflect those of the Federal Reserve Bank of Chicago or the Federal Reserve System.Any errors are ours. The views expressed herein are those of the author(s) and do not necessarily reflectthe views of the National Bureau of Economic Research.
NBER working papers are circulated for discussion and comment purposes. They have not been peer-reviewed or been subject to the review by the NBER Board of Directors that accompanies officialNBER publications.
© 2008 by Lisa Barrow, Lisa Markman, and Cecilia E. Rouse. All rights reserved. Short sections oftext, not to exceed two paragraphs, may be quoted without explicit permission provided that full credit,including © notice, is given to the source.

Technology's Edge: The Educational Benefits of Computer-Aided InstructionLisa Barrow, Lisa Markman, and Cecilia E. RouseNBER Working Paper No. 14240August 2008JEL No. I2,J0
ABSTRACT
We present results from a randomized study of a well-defined use of computers in schools: a popularinstructional computer program for pre-algebra and algebra. We assess the program using a test designedto target pre-algebra and algebra skills. Students randomly assigned to computer-aided instructionscore 0.17 of a standard deviation higher on pre-algebra/algebra tests than students randomly assignedto traditional instruction. We hypothesize that the effectiveness arises from increased individualizedinstruction as the effects appear larger for students in larger classes and in classes with high studentabsentee rates.
Lisa BarrowEconomic ResearchFederal Reserve Bank of Chicago230 South LaSalle StreetChicago, IL [email protected]
Lisa MarkmanA-17-H-1 Firestone LibraryPrinceton UniversityPrinceton, NJ [email protected]
Cecilia E. RouseIndustrial Relations SectionFirestone LibraryPrinceton UniversityPrinceton, NJ 08544-1013and [email protected]

1 Table 422 of the Digest of Education Statistics: 2006.
I. INTRODUCTION
Mathematical achievement is arguably critical both to individuals and to the future of the
U.S. economy. For example, research by Grogger (1996) and Murnane, Willet, and Levy (1995)
suggests that math skills may account for a large portion of overall wage inequality including the
African-American-white wage gap. And yet, in spite of recent progress, levels of mathematics
proficiency remain dramatically low (U.S. Dept. of Education, 2006 – National Assessment of
Educational Progress (NAEP) report). Compounding the problem of poor mathematics performance
is the fact that many school districts report difficulty recruiting and retaining teachers, particularly
in the fields of math and science, where schools must compete with (non-education) private sector
salaries (Murnane and Steele 2007). While there is mixed evidence on the importance of teacher
qualifications on student achievement in many subjects, the students of more qualified math teachers
appear to perform better (See, e.g., Braswell et al. 2001, Boyd et al 2007).
In response, policymakers, parents, and schools are actively seeking creative and effective
approaches to improving students’ math skills. And, not surprisingly, many school districts are
turning to advances in computer technology. By 2003 nearly all public schools had access to the
internet, and the number of public school students per instructional computer with internet access
had fallen from 12.1 in 1998 to 4.4.1 Despite this trend, research on the success of computer
technology in the classroom has yielded mixed evidence at best. Many studies have focused on the
impact of subsidies for schools to invest in computer technology. For example, Angrist and Lavy
(2002) show a decrease in math achievement among 8th graders after the introduction of a computer
adoption program in Israeli schools. Goolsbee and Guryan (2006) study the impact of the E-rate –
a program subsidizing school investment in the internet – and conclude that while it has substantially

2
2 Kirkpatrick and Cuban (1998) define three uses of computers in instruction: computer-assisted instruction (CAI), computer-managed instruction (CMI), and computer-enhanced instruction(CEI). CAI provides drill exercises and tutorials. CMI is more elaborate in diagnosing areas inwhich students need more instruction, guiding students in their own learning, and recording progressfor the teacher. CEI uses the internet or other computer programs, such as graphics or word-processing, to enhance lessons and projects directed by the teacher. The type of computerizedinstruction we study is best characterized as computer-aided instruction, although it also containselements of computer-managed instruction. We use the terms computer-aided instruction andcomputerized instruction interchangeably.
increased internet investment, it has not had any significant impact on student achievement. In
contrast, Machin, McNally, and Silva (2007) find that a government program encouraging
investment in information and computer technology in schools in the United Kingdom led to
improved performance in English and possibly science, but not in math in primary schools. While
it is important to understand whether and how public subsidies are used and whether they achieve
their intended goals, because the use of computers by the schools in these studies is either unknown
or vaguely defined, they do not provide direct evidence on the effectiveness of computer technology
as an input in the education production function.
Other literature has studied the impact of computer technology on student achievement more
directly.2 A relatively recent study of the NELS88 data showed that multimedia and calculating aids
had a strong positive correlation with math achievement, while having little to no effect in any other
subject (Wang, Wang, and Ye 2002). In contrast, Wenglinsky (1998) finds that, on average,
computer use in math instruction is negatively related to student math achievement in the 8th grade.
A potential problem with the existing literature is that few studies use a randomized controlled study
design or employ a credible strategy for controlling for factors such as individual teacher effects and
student ability, which might be correlated with both the use of computers in the classroom and

3
3 In an oft-cited, and somewhat controversial, review of the literature, Cuban (2001)concludes, “When it comes to higher teacher and student productivity and a transformation ofteaching and learning … there is little ambiguity. Both must be tagged as failures. Computers havebeen oversold and underused, at least for now.” (p. 179). Others argue for a more nuanced view ofthe literature that computers can be effective in certain situations, such as when used by teacherswith skill and experience in using computers themselves (see, e.g., Brooks (2000)).
student outcomes.3 For example, given that computer technology may be used either to help poorly
performing students or to enhance the learning of high achievers, selection bias could generate either
upward or downward biased estimates of the average impact of computer technology on student
achievement in poorly designed studies.
Three notable exceptions include a randomized evaluation of computer-assisted instruction
(CAI) conducted in the late 1970s by the Educational Testing Service and the Los Angeles Unified
School District that consisted of drill and practice sessions in mathematics, reading, and language
arts (Ragosta et al., 1982); which found educationally large effects in math and reading. More
recently, using a randomized study design, Banerjee et al. (2005) conclude that computer-assisted
mathematics instruction boosted the math scores of fourth-grade students in Vadodara, India. In
contrast, after randomly assigning students to be trained using a computer program known as Fast
ForWord, which is designed to improve language and reading skills, Rouse and Krueger (2004)
conclude that while use of the computer program may have improved some aspects of students’
language skills, such gains did not appear to translate into a broader measure of language acquisition
or into actual reading skills. Overall, one can conclude that this literature is also mixed, although
there may be more support for the effectiveness of computer technology in math instruction than in
reading. Notably, however, few studies offer evidence on why the technology may help or hinder
student achievement and the most recent evidence for math may not apply to U.S. students.
In this paper we present results from a new randomized study in three urban school districts

4
in the U.S. of a well-defined use of computers in schools: a popular instructional computer program
designed to improve pre-algebra and algebra skills. Not only do we test for an average effect of the
computerized instruction, but an important contribution of our paper is to attempt to understand why
CAI might improve achievement by looking for evidence consistent with some of the common
hypotheses. We find that students randomly assigned to classes using the computer lab score at least
0.17 of a standard deviation higher on a test of pre-algebra and algebra achievement designed to
reflect the curriculum in the districts relative to students assigned to traditional classrooms. The
estimated effect rises to 0.25 of a standard deviation when we estimate the effect for students who
actually use the computer-aided instruction.
In addition, we test for heterogeneity in treatment effects by a student’s baseline math
achievement and attendance record in the prior year, as well as by the size of the student’s class, the
classroom-level attendance rate in the prior year, and the math achievement heterogeneity of the
class. We find the effects appear larger for students in larger classes – especially those with a high
level of student heterogeneity in math achievement – and those in classes where students have poor
attendance records. These results provide some evidence for the hypothesis that an advantage of
CAI is increased individualized instruction. While quite suggestive, we caution that our results
represent the findings from just one study, and therefore may not extend to all forms of
computerized instruction nor to other districts.
In the next section we discuss why and in which circumstances CAI may be more effective
than traditional instruction. Section III presents the empirical model, research design, and data.
Section IV presents the results; Section V evaluates the cost effectiveness of CAI; and Section VI
concludes.

5
4 Other forms of self-paced instruction may offer a similar educational advantage. However,a very small, older, literature suggests that computerized self-paced instruction is more effectivethan other self-paced instruction. See, e.g., Enochs, Handley, and Wollenberg (1986) and Morriset al. (1978) for randomized studies involving college-age students.
II. WHY MIGHT CAI BE MORE EFFECTIVE THAN TRADITIONAL INSTRUCTION?
A key question is why CAI may be more effective than traditional classroom teaching, on
average. Some classroom research suggests computers can offer highly individualized instruction
and allow students to learn at their own pace (e.g. Lepper and Gurtner 1989, Means and Olson 1995,
Heath and Ravits 2001). While we do not have a direct test, we hypothesize that if CAI allows for
more individualized instruction, then it may be more beneficial for struggling students who cannot
keep up with the pace of the lectures in traditional classrooms or for more advanced students who
could progress faster at their own pace.4 Further, we might expect CAI to be more effective for
students with poorer rates of attendance. In a traditional classroom, students missing class will miss
all of the material covered that day. In contrast, the computer always picks up where the student left
off the last time she was in class. Additionally, in classes where many students have poor
attendance records or in classes with more variation in student ability, we might expect a bigger
effect of CAI as teachers may struggle to find the appropriate level at which to pitch lectures.
Finally, one might think that the individualized instruction provided by CAI avoids some of the
disruption effects of having peers with poor attendance rates or being in larger classes as modeled
by Lazear (2001).
More formally, we can follow Brown and Saks (1984) and think of the teacher as allocating
class time to different types of instruction. In the traditional classroom, the teacher divides class time
between group instruction time, TG, and individual instruction time, Ti, such that,

6
where is the total class time available. Thus, total instruction time for student i equals T
As long as other students in the class receive some individual instruction time, the total instruction
time for student i is strictly less than the total class time available.
In the CAI classroom, the teacher also allocates class time between group and individual
instruction, but computer-aided instruction effectively increases the productivity of individual
instruction time. Namely, while the teacher spends time working with student j, student i can be
working on the computer and receiving additional instruction. In contrast to traditional instruction,
student i can receive an additional minute of CAI time (Ci) without reducing the total amount of
instruction time available to student j. Total instruction time for student i equals
Let student achievement, Si, be a function of instruction time and individual characteristics,
Zi, so that
T T TG ii
+ ≤∑ , (1)
T T TG i+ ≤ . (2)
T T C TG i i+ + ≤ (3)
S f T T C Zi G i i i= ( , , , ), (4)

7
and Since student i’s achievement in the CAI classroom will bef f f1 2 30 0 0≥ ≥ ≥, , .and f 3 0≥ ,
greater than or equal to student i’s achievement in the traditional classroom for any given allocation
of Ti and TG, i.e.,
Note that the relative advantage of computerized instruction will depend on the suitability of the
curriculum for the students in question, which will affect the magnitude of f3.
Suppose further that the teacher maximizes her utility by allocating each student the same
amount of individual instruction time. For a class of N students,
Thus, for a given time allocation to group instruction, TG, Ti decreases as class size increases. In the
CAI class assume that a student spends time learning through CAI during the time that the teacher
is working with other students. In this case, so the potential gain in total( ) ( )CN
NT Ti G≤
−−
1
instruction time for student i of moving from a traditional class to a CAI class is increasing in class
size N.
Similarly, one might assume instead that some teacher time is non-productive, related to the
teacher needing to deal with individual student behavioral problems. Assuming that student j’s
disruptive behavior reduces group instruction time and/or individual instruction time, but does not
also disrupt student i’s ability to work on the computer, the gain in total instruction time for student
i of moving from a traditional class with a disruptive student to a CAI class with a disruptive student
( ) ( )f T T C Z f T T Zi G i i i G i, , , , , , .≥ 0 (5)
( )T
T TNi
G≤−
. (6)

8
is greater than the gain from changing classroom types in a class with no disruptive students.
III. EVALUATING COMPUTER-AIDED INSTRUCTION (CAI)
A. The Empirical Model
The primary research question we examine is whether mathematics instruction is more
effective when delivered via the computer or using traditional (“chalk and talk”) methods. In
designing the study, we were concerned about two sources of bias that might arise using
observational data in which we simply compared the outcomes of students taught using CAI to those
taught using more traditional methods. The first is that principals and/or teachers may choose to put
students they believed would particularly benefit from computerized instruction into the labs. This
bias would overstate the effect of CAI relative to traditional instruction.
A second source of bias is that more (or less) motivated teachers may be more willing to try
computerized instruction than their less (or more) motivated peers who would prefer to continue
teaching using traditional methods. Thus, a key concern with the existing literature on the
effectiveness of CAI is that the students taught by teachers willing to teach using the computerized
instruction would have outperformed their classmates who were taught by other teachers, regardless
of whether or not the students had been in the computer lab. That is, previous researchers may have
confounded a teacher effect with the effectiveness of the computer program.
To control for both types of selection bias, we implemented a within-school random
assignment design at the classroom level. We randomly assigned classrooms of students (in which
the classroom is the group of students taught by a particular teacher during a particular class period
9
5 Note that randomly assigning students to be taught in the computer lab or not answers aslightly different question: whether being taught in the computer lab – regardless of how classes aretypically formed within schools – would generate improvement relative to traditional instruction.Our approach comes much closer to the policy question faced by school principals andsuperintendents, which is whether instruction for a particular class should occur in the computer labor in a traditional classroom. We also note that it would be a logistical nightmare to randomlyassign students and teachers to classes at the middle or high school level irrespective of their otherclassroom scheduling needs. That said, the districts in which we conducted this study all usecomputer software to assign students to classes and they claim this assignment is basically random,as discussed in footnote 11.
6 As described below, in most cases the randomization pool is the class period (within aparticular school within a particular district).
in a particular school) to be taught in the computer lab or using “chalk and talk.”5 Because classes
(with the assigned teacher) were randomly assigned, on average the observed – and unobserved –
characteristics of the students and teachers assigned to the computer lab should be identical to those
that were not.
Our first set of empirical models that take advantage of the randomization generate estimates
of the intent-to-treat effect of using computerized instruction. In these models, the test scores of
students in classes randomly assigned to the computer lab are compared to the test scores of students
in classes randomly assigned to the control group, whether or not the students remained in their
original class assignments. To estimate the intent-to-treat effect, we estimate ordinary least squares
(OLS) regressions of the following model:
Yikjs = " + Xi$ + (Rikjs + Djs + gikjs (7)
where Yikjs represents student i with teacher k in period j in school s’s score on one of the follow-up
tests, Rikjs indicates whether the student was assigned to a class that was randomly assigned to a
computer lab, Xi represents a vector of student characteristics (including, in most specifications, the
student’s baseline test scores), Djs is the randomization pool6, gikjs is a random error term, and ", $,

10
7 We cluster our standard errors to account for the fact that the randomization occurred at theclassroom level. In addition, we have estimated our models using data aggregated to the classroomlevel with similar results.
and ( represent coefficients to be estimated. The coefficient ( represents the “intent to treat” effect
and estimates the effect of assigning students to be taught using CAI on the outcome in question.7
Because we randomly select classrooms, our research strategy should generate estimates of
the intent-to-treat effect that are not affected by potential self-selection of teachers into the lab.
However, this is only strictly true in large samples and so one might also be concerned that – by
chance – the more (or less) motivated teachers ended up in the computer lab. If more motivated
teachers ended up being selected to teach in the computer lab, then OLS estimates of the effect of
CAI on student outcomes will be biased upwards. One could control for this bias by comparing the
achievement of students with teachers who teach both in and out of the lab. That is, one can control
for a teacher fixed effect. Indeed, in their meta analysis of the research, Kulik and Kulik (1991)
concluded that studies in which the same teacher taught both the computer-aided class and the
comparison class, the differences in achievement were much lower than when the two types of
classes had different teachers, which is consistent with teacher selection bias.
At the same time, this result – that the effect of CAI is lower in the presence of teacher fixed
effects – would also obtain if there are spillovers in teaching techniques such that teachers import
lessons learned from the lab to their traditional classes. In this case, the spillover will attenuate the
estimated impact of computerized instruction. In our study some of the participating teachers taught
both in a computer lab and using traditional methods, while others taught exclusively in the lab or

11
8 An issue that can arise in studies of this kind is that the teachers and associated staff areunfamiliar with the intervention and therefore not properly trained to use it effectively. All threedistricts had been using this CAI program on a small scale before our study began (Districts 2 and3 for at least one year before our study, and District 1 for nine years), and therefore some of theteachers had already been trained and were familiar with the program. Further, all CAI teachersreceived training and support from both the company and district support staff throughout the study.
9 Unfortunately, if we find that the estimated impact of CAI is smaller when we control forfixed effects than when we do not, we will not be able to distinguish whether this is due to moremotivated teachers being selected to teach in the lab or to the existence of spillovers from the CAIinstruction to traditional instruction. Obviously, if we find that the impact is larger in the presenceof teacher fixed effects, we might conclude that, at a minimum, the less motivated teachers wereassigned to the lab – by chance – and that this effect was not outweighed by any potential spillovers.
exclusively out of the lab.8 This variation allows us to control for the quality of the teacher (by
including a teacher fixed effect) and to compare results with and without the teacher fixed effects.9
A potential problem with the intent-to-treat estimation is that school staff may “contaminate”
the experiment by assigning students from the control group (or from outside of the study) to a CAI
lab class. Alternatively, they may assign students originally in a computerized class to a
traditionally-taught class. While throughout the study we emphasized the importance of maintaining
the original student assignments and the principals and teachers indicated that they understood this
importance, some contamination did occur. While the intent-to-treat effect represents the gains that
a policymaker can realistically expect to observe with the program (since one cannot fully control
whether students initially assigned to a class in the lab actually remain in that class), it does not
necessarily represent the effect of the program for those who actually complete it.
Therefore, we also implement instrumental variables (IV) models in which we use whether
the student was in a class randomly assigned to a computer lab as an instrumental variable for actual
participation. The random assignment is correlated with actual participation in a computer lab, but
uncorrelated with the error term in the outcome equation (since this was determined randomly). In

12
10 Strictly speaking, we also investigate whether assignment to the treatment groupdifferentially affects students with different characteristics at the individual level as well.
this case, the second-stage (outcome) equation is represented by models such as,
Yikjs = "N + Xi$N + *CAIikjs + DNjs + gNikjs (8)
where CAIikjs indicates whether the student completed at least one lesson in a computer lab, *
indicates the effect of being taught through computerized instruction on student outcomes, and the
other variables and coefficients are as before. Through the use of instrumental variables one can
generate a consistent estimate of the effect of computerized instruction on student outcomes (the
effect of the “treatment-on-the-treated.”
Finally, we investigate the mechanism by which computerized instruction may improve
achievement by estimating models such as,
Yikjs = "N + (NRikjs + 2(Rikjs×Ckjs) + 8Ckjs + Xi$N + DNjs + gNikjs (9)
where Ckjs reflects a classroom “characteristic” – such as the average attendance of the students in
the prior year, the class size, or the heterogeneity in mathematics achievement. As such, the
coefficient on the interaction between the classroom characteristic and having been randomly
assigned to a class in the computer lab (2) indicates whether assignment to computerized instruction
differentially impacts achievement of students in different types of classroom environments.10
B. Computer-Aided Instruction
We study the effectiveness of computer-aided instruction by focusing on a group of
computer programs known as I Can Learn© (or “Interactive Computer Aided Natural Learning”)
distributed by JRL Enterprises. The system is comprised of both a software and hardware computer

13
package that is designed to deliver instruction through technology on a one-on-one basis to every
student. The curricula is designed to meet the National Council of Teachers of Mathematics
(NCTM) standards as well as each individual district’s course objects for pre-algebra and/or algebra.
In addition to the interactive teaching system, the software package also includes a classroom
management tool for educators and the company provides on-site support for administrators and
teachers.
The CAI program allows students to study math concepts while advancing at their own pace,
enabling them to spend the necessary time on each subject lesson. Each lesson has five independent
parts – a pre-test, a review (of prerequisites needed for the lesson), the lesson, a cumulative review,
and comprehensive tests. Students that do not pass the comprehensive tests are made to repeat the
lesson until they receive a certain degree of mastery. Each student’s performance is recorded in a
grade book and teachers can monitor students’ progress through a series of reports. The teacher’s
role in this environment is to provide targeted help to students when they need additional assistance.
Further, the computer program covers many administrative aspects such as lesson planning, grading,
and homework assignment so teachers can spend more time on individual instruction with struggling
students. Previous quasi-experimental studies of the effectiveness of this group of computer
programs have yielded mixed results (see, e.g. Brooks 2000, Kerstyn 2001, Kirby 1995, and Kirby
2004).
C. The Research Design
1. The Sites
We conducted the study in three large urban school districts–one in the northeast, one in the

14
11 The schools were given the option of eliminating particular teachers and/or classes fromthe study before the randomization. The extent to which the schools exercised this option varied.
12 That said, the schools claimed that the process by which they assigned students wasbasically random. We have assessed this claim by comparing the standard deviation of baseline testscores within the observed classes with the mean standard deviation one would obtain if studentswere assigned to classes randomly (within a particular level). Consistent with the schools’ claims,we found that the observed variation in baseline “ability” within classes was similar to that whichwould obtain if students were randomly assigned. Similarly, the spread of baseline test scores wasmuch larger than what one would have expected if students were strictly “tracked.”
midwest, and one in the south – each of which had a superintendent or technology director interested
in evaluating the CAI program already in use in their district. The districts have slightly different
demographics, but suffer similar problems in the areas of underachievement and teacher recruitment.
As shown in Appendix Table 1, all three districts have a high proportion of minority students.
District 1 has a student enrollment of roughly 68,000 students: 94% of whom are African American
and 1% of whom are Hispanic. District 2 serves just over 22,000 students: 40% of whom are
African American and 54% of whom are Hispanic. District 3 serves approximately 97,000 students:
59% of whom are African American and 18% of whom are Hispanic.
2. Implementation
The participating schools provided us with their schedule of pre-algebra and algebra classes
near the beginning of the academic year.11 We then randomly selected the treatment classes (taught
using CAI) and the control classes (taught traditionally). However, officials in the schools were not
informed of the outcome of our randomization until they had finished assigning students to classes
to protect against our random assignment influencing their class assignment decisions.12 Once
students were assigned to classes, we informed the schools which classes should use CAI and which

15
13 Typically there was only one or two computer labs in each school (one school had threelabs) such that there were more math classes than labs available in any one period.
should be taught using a traditional method.
We conducted the study during the 2004-2005 school year in eight high schools and two
middle schools in District 1; and during the 2003-2004 school year in four high schools in District
2 and in three high schools in District 3. As shown in Appendix Table 2, the demographic
characteristics of students in the schools in our study in District 1 had a slightly higher percentage
of African American students (97%) compared to other “relevant” schools in the district; the schools
studied in District 2 were roughly similar to those in other schools in the district; and the schools
in District 3 had a larger percentage of African American students (93%) and a smaller percentage
of Hispanic students (1.2%) compared to the district average of relevant schools. In most cases, the
students in the classes within the schools that participated in the study were representative of the
students in their schools (with the exception that in District 1 the average percentage of students who
were African American in the study was smaller than that in their schools (88% vs. 97%)).
The study originally included a total of 17 schools, 152 classes, 61 teachers, and 3,541
students (see Appendix Table 3). These 152 classes were grouped into 60 “randomization pools,”
which represent the groups of classes from which we randomly selected candidates for the treatment
and control groups. These pools usually represent a class period within a school, although in a few
cases, there were not enough classes from which to randomly pick one to go into the lab; for these
we combined classes from two periods.13 Due to mobility, our maximum analysis sample – which
is limited to students with follow-up test scores using our main outcome (that on a specially
designed algebra test, see below) – is comprised of 17 schools, 146 classes, 59 teachers, and 60
16
14 When we further limit the sample to students with baseline test scores on our mainoutcome we have 17 schools, 142 classes, 57 teachers, and 60 randomization pools, as shown inAppendix Table 3.
15 Note that we did not administer the Terra Nova algebra test, a common nationally-normedmathematics test, because many of the district officials were concerned that it does not containsufficient items related to pre-algebra and lower-level algebra.
randomization pools.14
D. Data
1. Academic Outcomes
We assess the impact of CAI on student achievement using test instruments. Since we
needed an exam that was closely aligned with the material in the mathematics courses,15 we
contracted with the Northwest Evaluation Association (NWEA) – an organization independent of
the CAI developer – to design a customized 30-item paper and pencil, multiple choice exam
targeting specific pre-algebra and algebra skills outlined in each district’s course objectives (which
should also have been reflected in the CAI curriculum, as previously noted). Identical exams were
created for Districts 2 and 3. Slightly different exams were created for District 1 to match the
district’s standards; however, the exams in District 1 were designed to match the exams used in the
other two districts to allow for pooled analysis.
We observe post-test scores for 1,873 students across all three districts (1,166 in District 1;
477 in District 2; and 230 in District 3). However, in some analyses we also control for the student’s
pre-test score. Thus, in the sample that includes both pre- and post-NWEA tests we have 1,605
students (993 in District 1; 412 in District 2; and 200 in District 3). Further, we convert the baseline
and follow-up test scores to standard deviation units using the standard deviation of the baseline test

17
16 We standardize using the standard deviation of the baseline test score for all studentsacross the three districts which is 9.18. We have also used “national” standard deviations whichrange from 16.7 for 8th grade students to 17.4 for grades 10 and higher. Not surprisingly, this cutsthe estimated effect sizes by roughly one-half. We choose to present the effects using the standarddeviation within the study for two reasons: first, we have also estimated the effects using “growthnorm” gains – the effect of CAI on the expected one-year growth in test scores (this norming takesinto account that initially low-scoring students typically make larger yearly gains than initiallyhigher-scoring students). Translated, these estimates are more similar to the effect sizes using thedistrict standard deviation than the national standard deviation, reflecting that our sample of studentsare by-and-large initially low-achieving. As such, the study standard deviation better reflects thepopulation in question. In addition, we only have district (or study) standard deviations for someof the outcomes making the results more consistently presented across outcomes when we use thedistrict or study standard deviation. The results using both the growth-norms and national standarddeviation normalized scores are available on request.
17 Before we standardize the test scores, the standard deviation of the baseline statewide testin District 1 was 23.3; that in District 2 was 31.7; and that in District 3 was 39.1. For District 1 westandardize the 8th grade follow-up test score using the standard deviation of the 8th grade test forthe study’s 9th graders because the pre- and post tests are not the same test. The standard deviationof the 9th graders’ 8th grade test is 44.7.
score.16
We also assess the impact of CAI using the statewide tests administered by each state. In
District 1, we only have post-treatment state test data for the students in the 8th grade, so we use the
district-administered Iowa Test of Basic Skills (ITBS) from the 7th grade as the pre-test. At the time
of our study, students in Districts 2 and 3 were tested in mathematics on statewide tests in 4th, 8th,
and 10th grades. Since the students in the study in these districts were primarily in 9th grade, we use
the 8th grade statewide test as the pre-test and the 10th grade test as the post-test. The mean of the
(standardized) baseline statewide test in District 1 is 9.2; that in District 2 is 6.7; and that in District
3 is 16.7. Again, the test scores were standardized to have a baseline standard deviation of one
within each district.17
In addition, pre-algebra students in District 1 took mini-math exams – benchmark pre-

18
18 Although we were able to obtain state test scores for students who changed schools withineach district, sample sizes drop dramatically because there is at least one year between the pre-testand post-test measurements.
19 In one of the districts we were able to identify individual test items that were related to pre-algebra and algebra. Not surprisingly, our estimates were quite noisy given that there were very fewtest items on which to measure the students’ performance.
algebra exams – throughout the semester. These tests were intended for use by the teacher and
district to track students’ progress. The initial benchmark test has a mean of 18.7 and a standard
deviation of 5.7. We standardize the initial benchmark test to have a standard deviation of one and
also standardized the 2nd and 3rd quarter benchmark tests using the initial test score standard
deviation.
Because we cannot standardize the state tests across the districts, we analyze these data
separately by district. The sample size of students in District 1 with both pre- and post-tests is 454;
that in District 2 is 341; and that in District 3 is 199.18 Further, the sample size for the benchmark
tests in District 1 is about 230. We emphasize that while the state tests have the advantage of being
high-stakes and therefore of great importance to the districts, as little as 10% of the state exams in
mathematics contain test items related to pre-algebra and/or algebra. As such, they may have low
power to detect effects of a pre-algebra/algebra intervention.19
Despite the fact that only a fraction of the state tests focuses on pre-algebra and algebra, the
three test assessments are reasonably highly correlated. For example, the correlation between the
baseline NWEA test and the state math tests range from 0.30 (in District 1) to 0.73 (in District 2).
Further, in District 1 the correlation between the baseline algebra test and the baseline benchmark
test is 0.55 and that between the state math test and the baseline benchmark pre-algebra test is 0.62.
Thus, while two of our three assessments are not based on nationally normed exams, they

19
20 For comparison, Figlio and Rouse (2006) report that in a subset of Florida districts thecorrelation between student performance on a nationally-normed test (the NRT) and the FCATcurriculum-based assessments (known as the Sunshine State Standards (FCAT-SSS) examinations)is approximately 0.8.
nonetheless appear to be correlated with the high-stakes state tests.20
2. Other Data
The statistical office in each district also provided us with administrative data on students.
The data included student identifiers and limited characteristics (such as the student’s sex and
race/ethnicity). In two of the three districts we also obtained data on the number of days the students
attended school in the study year and the preceding year. In addition, we gauge each student’s
engagement with the program through tracking data that comes with the computerized program.
These data allow us to determine which students ever trained in the computer lab which is important
for the analysis estimating the effect of the treatment-on-the-treated.
IV. RESULTS
A. Descriptive Statistics
The first order of business is to determine if assignment to the computer lab appears random.
Table 1 shows the mean of student characteristics by whether the student’s class was assigned to the
CAI lab or was assigned to receive traditional instruction. The top panel uses the full sample of
students who were randomly assigned at the beginning of the academic year. We see that the
proportion of female, African American, and Hispanic students are quite similar using the full
sample. Further, the baseline test scores are identical.

20
21 We note, however, that these differences in race and ethnicity arise in only one district(District 2).
However, there is significant mobility among students in the districts such that we were
unable to post-test all of the students. A major concern is that the attrition between the beginning
and end of the study was uneven between the treatment group and the control group thereby
introducing statistical bias into the analysis. Therefore, in the bottom panel we compare the
observable characteristics of the students in the treatment and control groups using the sample of
students for whom we also have both the baseline and follow-up data on the NWEA test. Again,
there is no difference in the baseline pre-algebra/algebra test score, however there are small
differences in the percentage of students who are African American and Hispanic that are
statistically significant at the 6% level.21 As a result, in most specifications we control for the sex,
race, and ethnicity of the student.
B. Overall Intent-to-Treat and Treatment-on-the-Treated Estimates
Table 2a presents the OLS estimates of the intent-to-treat effects of CAI represented by
equation (7), as well as an instrumental variables (IV) estimate of the effect of treatment-on-the-
treated using the NWEA test as an outcome. Column (1) presents the straightforward mean
difference in the post-test between students learning algebra using CAI and those learning in a
traditional classroom, adjusted only for dummy variables representing the randomization pool. The
standard errors reported allow for within-classroom correlation. We estimate that, on average,
students in CAI scored 0.17 of a standard deviation higher on the post-test than did those in a
traditional classroom, and this difference is statistically significant at the 5% level. When we add

21
22 Further, when we regress whether the student is missing the baseline test score on thedemographic characteristics for the estimation sample, none of the characteristics significantly differbetween those with and without baseline test scores. We have also assessed the importance of anyimbalance between the treatment and control groups using propensity score re-weighting with verysimilar results.
controls for the sex and race/ethnicity of the student, in column (2), the random assignment effect
does not change.
In column (3) we present the same specification as that in column (1) but restrict the sample
to students who also had a pre-test. The basic effect of CAI is slightly higher – 21% of a standard
deviation – among the subset of students with baseline test scores, although the estimate is within
a standard error of that in column (1).22 Note that the coefficient estimate falls slightly when we
include the baseline test score (columns (4) and (5)), although this difference is not statistically
different from that in column (3). Thus, we estimate that the effect of being placed in a CAI
classroom relative to a traditional classroom is an educationally and statistically significant 0.17 of
a standard deviation. Interpreting this effect differently, when we use the growth-normed test
scores, we find that students assigned to a CAI classroom achieve 27% of a grade-level more than
their peers at the end of the semester.
To the extent that students assigned to classrooms to be taught using traditional methods
spent time in the lab and that students assigned to the lab did not receive their algebra instruction
there (i.e., contamination occurred), the intent-to-treat estimates may be too small. Table 3 shows
the number of lessons students were expected to complete given the type of instruction; the
percentage of students completing no lessons, more than 10 lessons, and more than 20 lessons in the
CAI; the number of lessons the student actually completed; and the number of lessons completed
as a fraction of the CAI course expectations by whether the student was assigned to the treatment

22
23 We have used alternative definitions of students receiving treatment, such as whether thestudent completed at least 5 lessons in the lab and whether the student completed at least 10 lessonsin the lab. The results presented are robust to these alternative definitions.
group or the control group.
Note, first, that there is no difference in the number of CAI lessons that students would have
been expected to complete based on the level of their math class and the school’s schedule.
However, there is evidence of some, although not extensive, contamination. For example, 84% of
students assigned to the lab completed at least 10 lessons in the lab and 16% of those assigned to
classes to be taught using traditional instruction completed at least 10 lessons in the lab as well.
Similarly, while treatment students completed an average of 33 lessons using CAI, the control group
students completed an average of 5.8 lessons. And, while the treatment students appear to have
completed about 64% of the lessons they would have been expected to complete using CAI, the
control students also completed 10%.
We address this contamination by using IV to estimate equation (8), the results of which are
in column (6) of Table 2a. In this specification we identify students who were “treated” as those
who completed at least one lesson in the computer lab and instrument for this indicator with the
random assignment of the student’s class.23 This strategy provides a consistent estimate of the effect
of treatment-on-the-treated. We estimate that students who actually receive instruction using CAI
score 0.25 of a standard deviation higher than those who received instruction in a traditional
classroom, and the difference is statistically significant.
As noted above, although we have nearly 60 teachers who participated in the analysis, we
also sought to understand whether these impacts result because we, by chance, selected more
motivated teachers to teach in the lab. Thus, we exploit the fact that just over one-half of the

23
24 Part of the reason for the larger estimated coefficients in Table 2b derive from the fact thatthe intent-to-treat effect of CAI is larger when we limit the sample to the subset of teachers whotaught both in- and out- of the lab (i.e., those observations from which the fixed effects analysis isidentified). When we conduct the analysis on this sub-sample of teachers and do not include teacherfixed effects the intent-to-treat effect (similar to that in column (5) in Table 2a) is 0.27 and the IVestimate (similar to that in column (6) in Table 2a) is 0.43.
teachers taught both in and out of the computer lab and include teacher fixed effects in the analysis.
These results are presented in Table 2b, which is otherwise identical in layout to Table 2a. The
within-teacher coefficient estimates are uniformly greater than those without teacher fixed effects.
Thus, we estimate that, controlling for (time invariant) teacher quality, the effect of being assigned
to a computer lab increases student math achievement. The intent-to-treat effect is nearly 30% of
a standard deviation (columns (4) and (5)); when we adjust for non-compliance using IV, the effect
of CAI increases to 40% of a standard deviation. These effects are educationally large and
statistically significant, and (translated) suggest that students who actually completed lessons in the
lab gained roughly 50% of a year more than those taught in a traditional classroom.24
Because the NWEA test is not nationally recognized, we sought to determine whether there
were similar effects of CAI on student math achievement using other math test instruments.
Unfortunately, these other instruments are not standardized across the districts so we present the
results separately by district. Table 4a shows the intent-to-treat effect of CAI using four outcomes
for District 1. The first (column (1)) is the pre-algebra and algebra test developed by NWEA that
was also used as the outcome in Tables 2a and 2b; the second and third are the second and third
quarter benchmark tests conducted by the district (columns (2) and (3)); and the final outcome
(column (4)) is the statewide math test. We present the results in two panels: the top panel uses the
maximum available sample for each outcome and the lower panel constrains the sample to be

24
constant across them.
Since the NWEA test and the benchmark tests were based on the curricula the students were
learning in both the CAI and traditionally-taught classes, we expect larger impacts on these
outcomes. In contrast, the statewide tests are more comprehensive and therefore examine a wider
range of mathematical concepts (such as geometry, measurement, and probability and statistics).
While one would anticipate that greater achievement in algebra would have spillovers to other areas
in math, we would, in general, anticipate smaller impacts on these tests. We do note, however, that
the statewide tests were “high stakes” for the students and teachers as the accountability systems in
each state were based on the results, whereas the others were not.
In District 1, when we allow for the maximum possible sample, the intent-to-treat effect
using the NWEA pre-algebra/algebra test is approximately 0.22 of a standard deviation. We see a
larger gain of nearly 0.4 of a standard deviation using the 2nd quarter benchmark test and a gain of
0.6 of a standard deviation using the 3rd quarter benchmark test. Importantly, we also detect an
effect of 0.26 on the state mathematics test. All of these gains are educationally large and
statistically significant at the 5% level. Further, the coefficient estimates in the bottom panel suggest
that the gains are not simply driven by changes in the sample size across the specification as they
are even larger.
Analogous results for Districts 2 and 3 are presented in Table 4b (note that benchmark tests
were not administered in these districts). Columns (1) and (3) show the effect of CAI using the
NWEA test; those in columns (2) and (4) report the effect using the statewide test for each of the
districts. In District 2 we detect an effect of 0.2 of a standard deviation using the algebra test with
a standard error of 0.13; the effect is much smaller on the state test – less than 10% of a standard

25
25 While the magnitude of the intent-to-treat effect is largest in District 1, the impact is notstatistically distinguishable from that in District 2. Further, we note that the negative effect inDistrict 3 is driven by the results from only one randomization pool. If we exclude this pool fromthe analysis the point estimate in column (3) of the bottom panel of Table 4 rises to 24 percent ofa standard deviation and that in column (4) rises to 15 percent of a standard deviation. Theseestimates are not statistically different from those estimated in Districts 1 and 2. The subsequentresults are qualitatively similar with or without this one randomization pool in District 3.
deviation – and not statistically different from zero. That said, these results are not unexpected
given that most of the state math test is not geared towards pre-algebra and algebra. Note that the
results do not appear to depend on whether the sample is restricted to be the same in both
specifications. In contrast, we estimate a negative intent-to-treat effect of CAI on student
achievement in District 3 using both the NWEA test and the state math test, although neither
coefficient estimate is statistically different from zero (in fact the standard errors are much larger
than the coefficient estimates).
Despite some differences across districts, overall we conclude that assignment to a CAI class
increases student achievement on multiple measures of pre-algebra and algebra achievement, with
the largest impacts in Districts 1 and 2.25 In the rest of the paper, we focus on the NWEA test as an
outcome both because it was designed to be pooled across the districts and because it reflects the
material taught in the traditional and computer-aided classes.
How large are these impacts? We find that assignment to a CAI classroom increases the
NWEA test scores by between 0.17F and 0.28F, depending on whether or not one controls for time-
invariant teacher characteristics. Hill et al. (2007) generate some benchmarks with which to
compare estimated effect sizes. They calculate that the average estimated effect size among studies
conducted at the middle school and high school level is about 0.25F, which is at the upper end of
the estimated impact we observed. Another way to interpret the magnitude of our results is to use

26
26 We also tested whether the effectiveness of CAI differs by sex and by race/ethnicity of thestudent and found no systematic differences. We also tested for differences by the absolute(baseline) math achievement quartile of the students (defined by the national distribution) and foundsuggestive evidence that this program is most effective for students with the weakest backgroundsin math, although the differences across quartiles are not always statistically significant. The resultsare available from the authors on request.
27 Each column in each panel represents a separate regression.
growth-normed (NWEA) test scores for which we estimate that students assigned to a CAI
classroom achieve 27%-34% of a grade-level more than their peers at the end of the semester. The
effect for those who actually completed lessons in the lab are even larger: 0.25F-42F, or 39% - 49%
of a grade-level more than those taught in a traditional classroom. For math the average annual gain
in effect size from 8th to 9th grade using nationally-normed tests is about 0.22F (Hill et al., 2007).
If we normalize the NWEA test by its reported national standard deviation, our estimated effect size
ranges from 0.09F to 0.22F, or 41%-100% of the average 8th to 9th grade gain. These estimates are
also 10%-31% of the National Assessment of Educational Progress (NAEP) math gaps by
race/ethnicity (which are 0.86F for the Black-white gap in mathematics for 8th graders in the 2007
NAEP and 0.72F for the Hispanic-white gap).
C. Empirical Evidence on Why CAI is More Effective
The discussion in Section II suggested that CAI may be more effective for some students
than others and for classes where individualized instruction may be particularly advantageous. In
the following tables, we look for patterns of impacts that are consistent with this interpretation.26
In Table 5 we estimate whether the effect of CAI is different for pre-algebra versus algebra or for
students of different ability as measured by baseline (NWEA) test scores.27 Each column of the
27
28 Test score quartiles for all specifications are defined within class. All specificationsadditionally control for student demographic characteristics as described above and indicators forthe randomization pool. The top panel also includes the baseline test score while the bottom panelincludes, instead, indicators for the baseline test score quartile. We also include main effects for thelevel of math class in the top panel.
29 In the analysis sample, 30 percent of District 1 students are in pre-algebra, 53 percent ofDistrict 2 students are in pre-algebra, and 9 percent of District 3 students are in pre-algebra.
table represents estimates of the effect of CAI for a different subset of the analysis sample. We
present estimates for the three districts combined (column (1)), Districts 1 and 2 combined (column
(2)), and Districts 1, 2, and 3 separately in columns (3), (4), and (5), respectively. The top panel
estimates differential effects by pre-algebra and algebra and the bottom panel estimates the CAI
effect by student ability as measured by the baseline test score quartile.28
Our sample contains students in pre-algebra and algebra classes in all three districts –
roughly 23% of whom are in pre-algebra classes.29 Pooling all three districts we estimate that the
effect of CAI for pre-algebra students is significantly larger than the effect for algebra students (the
p-value of the difference between the two effects equals 0.001). Pre-algebra students in CAI score
0.48 standard deviations higher than pre-algebra students in traditional classes while algebra
students in CAI score less than 1 percent of a standard deviation higher and the effect is not
statistically different from zero. Note, however, that the effect of CAI for algebra students is being
driven toward zero by the negative effect of CAI for algebra students in Districts 2 and 3. That said,
even in District 1 we find evidence that CAI has a larger effect among pre-algebra students than
algebra students. In District 1 we estimate that CAI pre-algebra students score 0.44 standard
deviations higher than traditionally taught pre-algebra students while CAI algebra students score
only 0.13 standard deviations higher than traditionally taught algebra students. For each district the

28
30 Statistically, we can reject that the effectiveness of CAI for algebra students is the samein District 2 or 3 as in District 1. The effectiveness of CAI for pre-algebra students in District 2 isvery similar to and not statistically different from that in District 1, and although the estimated CAIeffect for pre-algebra students in District 3 is larger than in District 1, we also cannot reject that theyare the same.
p-value for the test that the pre-algebra effect of CAI equals the algebra effect of CAI is less than
0.07.30 Thus, this CAI treatment appears more effective for pre-algebra students than for algebra
students.
In the bottom panel we allow the effect of CAI to differ by relative prior student math
achievement defined within class. Suppose that traditional classroom teachers always teach pre-
algebra and algebra at the pace that is appropriate for the highest ability students in the class. In this
case, we might expect to see that high ability students do equally well in CAI and traditional
classrooms, while those with lower math ability do better in CAI because they can take more time
to cover each lesson and therefore learn the material better (even if they do not cover as many
lessons). Alternatively, if traditional classroom teachers always teach pre-algebra and algebra at the
pace that is appropriate for the lowest ability students, then high ability students may do better in
CAI because they can cover more material than what is covered in a traditional classroom. To test
this possibility we interact the student’s baseline test quartile within the classroom with random
assignment to CAI. We find suggestive evidence (based on the magnitudes of the coefficients) that
traditional classroom teachers teach to the best students in the class as CAI appears least effective
for those in the top quartile of the test score distribution. However, we can only statistically detect
differences between the top quartile and the 3rd quartile when we pool all three districts (column (1)),
or between the top quartile and the 2nd and 3rd quartiles in District 3, at the 5% level of significance.

29
31 The correlation between a student’s attendance record during the current year and the prioryear is 0.58. Further, we have looked at the impact of being assigned to CAI on attendance, but theresults are quite imprecise. The reason is that with high mobility and data from only two districts,the sample sizes are quite small.
32 For each student we calculate the average attendance rate of her classmates usingattendance data from the prior year, excluding her own attendance rate from the calculation.
Table 6a tests for different CAI effects by attendance characteristics of individual students
based on attendance data from the prior academic year. If students who are frequently absent are
not caught-up to the rest of the class, they may become lost during group instruction and need more
individualized instruction. Given that the computer picks up where the student left off, students with
spotty attendance records may particularly benefit from its use. As the use of CAI may also
influence a student’s attendance record, we proxy for a student’s likelihood of being absent with his
or her attendance record from the prior year.31 As noted earlier, we only have data on student
attendance for Districts 2 and 3. While the pooled data suggest that CAI is more effective for
students with worse attendance rates, we cannot reject that there are no differences at standard levels
of significance. We find some statistically significant differences by attendance quartile using
District 3 alone, but the pattern of results are not fully consistent with the hypothesis that the
individualized instruction of CAI mitigates the negative effects of poor attendance rates.
Table 6b presents estimates allowing the effect of CAI to differ with the average attendance
rate of the students in the classroom.32 Clearly if the same students were always absent, a high level
of absenteeism would mean a lower effective class size. However, if absenteeism is distributed
among a significant portion of the students, then it would be quite difficult for the instructor to
appropriately target the level of group instruction. In this case we would expect to see that CAI is
more effective in classes composed of students who are frequently absent. And, indeed, we estimate

30
in Districts 2 and 3 – both pooled and individually – a larger CAI effect for classrooms with lower
average attendance rates. For students in a classroom with average attendance rates, the CAI effect
is less than 6 percent of a standard deviation and not statistically different from zero. In contrast, the
CAI effect for students in a classroom with attendance rates one standard deviation below the mean
is 0.35 of a standard deviation (p-value equals 0.08).
Next, we examine whether CAI is more effective for larger classes. Again, we expect that
in larger classes it would be difficult for the teacher to design group lessons that are appropriate for
all students and she would, by definition, have less time available for individualized instruction with
each student. Hence, CAI has the potential to have a larger impact on student achievement. We
measure class size based on the initial class assignment rosters used for random assignment; thus,
class size is available for all three districts. The average class sizes in these districts range from 24
to 29 students. Pooling all three districts, we find that the CAI effect is larger for larger classrooms
(see Table 7); unfortunately this marginal effect is not statistically significant at standard levels (p-
value equals 0.20). However, pooling only Districts 1 and 2 we find that the CAI effect is about
twice as large and statistically significant at the 10% level (the p-value is 0.057). Based on this
estimate, for a classroom of 25 students the effect of CAI is 0.21 of a standard deviation (p-value
< 0.001). For a class of 15 students there is no difference between CAI and traditional instruction
(0.01 of a standard deviation with a p-value of 0.95). Class size effects are also positive for District
1 (p-value = 0.07) and District 2 (p-value = 0.80) individually. The coefficient estimate is very small
and negative with a large standard error in District 3. We cautiously conclude there is some
evidence CAI is more effective in larger classes, consistent with the hypothesis that the main benefit
of CAI is the individualization of instruction.

31
33 The results are robust to small changes in the definition of a large class. For example, theresult is similar if we define large classes as those with more than 20 students (the 35th percentilebased on classrooms), but they are not similar at the (roughly) 65th percentile (more than 26students). We also obtain qualitatively similar results when we define class size as a continuousvariable.
Finally, we examine whether CAI effects are larger in classrooms with greater heterogeneity
in terms of baseline math achievement, since greater variation in students’ math achievement would
also make it more difficult for teachers trying to design group lessons. Specifically, we allow the
CAI effect to depend on the baseline test score standard deviation for the class. The top panel of
Table 8 presents overall results. While the estimate of the coefficient on the interaction term for
District 1 is negative, those for Districts 2 and 3 individually, are positive, which is consistent with
the idea that the benefit of CAI is through individualized instruction. However, regardless of the
sample, none of the coefficients on the interaction between CAI and baseline standard deviation are
statistically significant.
One potential explanation for the results only being weakly supportive of the importance of
individualized instruction is that heterogeneity, in-and-of itself, may not hinder effective teaching.
Rather, in certain circumstances – such as in small classrooms – heterogeneity in student ability may
be quite manageable in a traditional classroom. In this case, the relative advantage of CAI (and
hence more individualized instruction) may only become apparent in large, heterogenous classes.
To test this hypothesis, in the second panel of Table 8 we add a third level interaction – that between
CAI, the baseline standard deviation in student test scores, and an indicator for whether the class is
“large” (defined as more than 24 students).33 We now find there is a relative advantage to being
assigned to CAI for large and heterogeneous classes, although the point estimate is only statistically
significant in Districts 2 and 3. This evidence is consistent with the hypothesis that CAI benefits

32
34 Information on the cost of a CAI lab comes from one of the districts in our study.
35 The company estimates the annual cost per pupil at just over $100, which we think is toolow in practice. We can only get close to this per-pupil estimate if we assume the lab would serve400 students per year over a seven year period and that the district would not pay for training,support, and maintenance costs after the initial three years.
primarily accrue through increased individualization of instruction.
V. COST-BENEFIT SIMULATION
Of course, the gains from computerized instruction do not come for free as the computer labs
required for CAI are costly and are dedicated to CAI. In our example, a 30-seat lab costs $100,000
with an additional $150,000 for pre-algebra, algebra, and classroom management software, and
roughly $17,000 per year for training, support, and maintenance of the lab.34 According to the
company’s website a lab lasts 7-10 years – meaning a CAI lab may cost nearly $53,000 per year.35
Given that providing instruction through CAI may serve as a substitute for reducing class
sizes, one way to evaluate its cost effectiveness is to compare its cost to the compensation cost of
hiring additional teachers to reduce class size. Using pre-algebra/algebra test scores measured in
national standard deviation units we find that a student in a class of 25 pupils using CAI in our
largest district (District 1) scores 10 percent of a standard deviation higher than a student in a
similarly-sized traditional classroom. Since the gains from CAI are larger for larger classes, the
benefit of CAI equals zero when the average class size is reduced to 14 students. We can therefore
compare the per-pupil cost of CAI to the cost of reducing class sizes to 14 students.
We begin by deriving an estimate of the total cost of reducing class size using all of the

33
36 We only report estimates using the analysis sample in District 1 because we have a goodunderstanding of the typical number of periods in each school; we would have to make moreassumptions if we used our entire analysis sample from all three districts. That said, the estimatedannual cost per pupil of CAI would be about $276 using the entire analysis sample and the estimatedcost of reducing class size to 14 students would be about $205.
37 The cost of reducing class size in this simulation is much lower than other estimates of thecost of class size reduction for elementary schools – as in Tennessee STAR (e.g., nearly $5,000 perpupil in Schanzenbach 2006). This is primarily because when class sizes are reduced at theelementary school level, it is for all subjects, not just algebra and pre-algebra.
schools in District 1 that are in our analysis sample.36 The average class size for all District 1 classes
represented in the study is 23.1. Although District 1 has eight periods per day, by contract teachers
do not teach every period. The typical teacher in our sample teaches six periods. As a result, the
district would have to hire about eight more pre-algebra and algebra teachers to reduce the average
class size to 14. Using an estimate of the starting salary for teachers in District 1, adjusted to reflect
“total compensation,” we estimate that the cost of class size reduction for all pre-algebra and algebra
classes would be $198 per pupil per year.37 (See the Simulation Appendix and Appendix Table 5
for details.)
The key determinants of whether CAI is more cost effective than class size reduction are the
average number of students per class in the lab and the number of periods in the day a lab can be
used. If the district implements CAI and keeps the average class size in the lab at 23.1 students, the
annual per pupil cost is about $283. Per pupil costs of CAI are lowest when the lab can be used
every period of the day and each class has 30 pupils in it. If 30 students were assigned to classes
in the lab, the per pupil cost decreases to about $218, which is only a bit higher than the estimated
cost of class size reduction.
For individual schools in District 1 with larger average class sizes, our estimates of the cost

34
of implementing CAI are less than our compensation cost estimates of reducing class size. For
example, School A has an average class size of 33.2. In this case, cutting the average class size by
more than half costs roughly $290 per pupil compared to $218 per pupil to implement CAI,
decreasing class size to 30 pupils.
In general, our calculations suggest that the costs of reducing pre-algebra and algebra classes
to 14 students and adopting CAI are comparable. However, we suspect that our estimates of the cost
of class size reduction are more severely underestimated compared to those for CAI. The reason
is that they only reflect increased costs in terms of teacher compensation, while there would likely
be additional costs (such as recruiting costs and capital expenditures) that have not been taken into
account. As a result, CAI may be the more cost-effective solution for school districts to raise
mathematics achievement. Furthermore, in urban and rural districts that have difficulty hiring
highly qualified mathematics teachers, CAI may be much easier to implement than a reduction in
class size.
VI. CONCLUSION
Our results suggest that CAI may increase student achievement in pre-algebra and algebra
by at least 0.17 of a standard deviation, on average, with somewhat larger effects for students in
larger classes. Put differently, students learning pre-algebra and algebra through CAI are 27% of
a school year ahead of their classmates in traditional classrooms after one year. In interpreting these
results, one must keep in mind that the outcomes were measured relatively soon after the
intervention ended and we do not know how long they would “last.” At the same time, it is not clear
how one might measure such longer run outcomes, particularly since mathematics is not necessarily
35
cumulative at the secondary school level, students in the control group may go on to use CAI, and
all of the students may have been involved in other enrichment programs. In addition, this
represents only one use of computers for teaching pre-algebra and algebra and not all CAI hardware
and software may be equally effective. Further, we cannot know whether the impacts observed here
would also extend to other districts.
That said, this study suggests that CAI has the potential to significantly enhance student
mathematics achievement in middle and high school, that the gains are comparable to those achieved
with class size reduction, and that the costs are likely somewhat lower than the full cost of reducing
the average class size for all pre-algebra and algebra classes. At the very least, our results suggest
that CAI deserves additional rigorous evaluation and policy attention, particularly since it may be
much easier for schools and districts to implement than other interventions.

36
References
Angrist, Joshua and Victor Lavy. “New Evidence on Classroom Computers and Pupil Learning,”The Economic Journal, 112, no. 482, October 2002, pp. 735-765.
Banerjee, Abhijit, Shawn Cole, Esther Duflo, and Leigh Linden. “Remedying Education: Evidencefrom Two Randomized Experiments in India,” Quarterly Journal of Economics, 122, no. 3(August 2007): 1235-1264.
Boyd, Donald, Daniel Goldhaber, Hamilton Lankford, and James Wyckoff. “The Effect ofCertification and Preparation on Teacher Quality” in The Future of Children, vol. 17 no. 1(Spring 2007): 45-68.
Braswell, James S., Anthony D. Lutkus, Wendy S. Grigg, et al. The Nation’s Report Card:Mathematics 2000. (Washington, D.C.: National Center for Education Statistics), August2001.
Brooks, Cormell. “Evaluation of Jefferson Parish Technology Grant I CAN Learn Algebra I,”submitted to Elton Lagasse, Superintendent, Jefferson Parish Public Schools. September,2000.
Brown, Byron W. and Daniel H. Saks. "The Microeconomics of Schooling: How Does theAllocation of Time Affect Learning and What Does It Reveal about Teacher Preferences?"Unpublished manuscript, March 1984.
Cuban, Larry. Oversold and Underused: Computers in the Classroom. (Cambridge, MA: HarvardUniversity Press, 2001).
Enochs, J.R., H.M. Handley, and J.P. Wollenberg. “Relating Learning Style, Reading Vocabulary,Reading Comprehension, and Aptitude for Learning to Achievement in the Self-Paced andComputer-Assisted Instructional Modes.” Journal of Experimental Education, 54, no. 3(Spring 1986): 135-139.
Figlio, David and Cecilia Elena Rouse. “Do Accountability and Voucher Threats Improve Low-performing Schools?.” Journal of Public Economics 90, nos. 1-2 (January 2006): 239-255.
Goolsbee, Austan and Jonathan Guryan. “The Impact of Internet Subsidies in Public Schools,” TheReview of Economics and Statistics, 88 no. 2 (May 2006): 336-347.
Grogger, Jeffrey. “Does School Quality Explain the Recent Black/White Wage Trend?” Journalof Labor Economics, 14, no. 2 (April 1996): 231-253.
Heath, Marilyn and Ravitz, Jason. “Teaching and Learning Computing: What Teachers Say.”Presented at ED-MEDIA 2001 World Conference on Educational Multimedia, Hypermedia

37
and Telecommunications, 2001.
Hill, Carolyn J., Howard S. Bloom, Alison Rebeck Black, and Mark W. Lipsey. “EmpiricalBenchmarks for In terpre t ing Effect Sizes in Research.” 2007.http://www.mdrc.org/publications/459/abstract.html.
Kerstyn, Christine. “Evaluation of the I Can Learn Mathematics Classroom: First Year ofImplementation (2000-2001 School Year)” Hillsborough County Public Schools mimeo,2001.
Kirby, Peggy C., “I Can Learn Algebra I” Pilot Project Evaluation Report II, submitted to JRLEnterprises, December 1995.
Kirby, Peggy, C., “Comparison of I CAN Learn® and Traditionally-Taught 8th Grade StudentPerformance on the Georgia Criterion-Referenced Competency Test.” Unpublishedmanuscript, November 2004.
Kirkpatrick, Heather and Larry Cuban. “Computers Make Kids Smarter – Right?” Technos 7(2)(Summer 1998): 26-31.
Kulik, Chen-Lin C. and James A. Kulik. “Effectiveness of Computer Based Instruction: An UpdatedAnalysis.” Computers in Human Behavior, 7 no. 1-2 (1991): 75-94.
Lazear, Edward P. “Educational Production.” Quarterly Journal of Economics. 116, no. 3 (August2001): 777-803.
Lepper, Mark, R. and Jean-Luc Gutner. “Children and Computers: Approaching the Twenty-FirstCentury.” American Psychologist, 44, no. 2 (February 1989): 170-78.
Machin, Stephen, Sandra McNally, and Olmo Silva. “New Technology in Schools: Is There aPayoff?” Economic Journal, 117, no. 522 (July 2007): 1145-1167.
Means, Barbara. and Olson, Kerry. “Technology’s Role in Education Reform.” Menlo Park, CA:SRI International. (1995)
Morris, Edward K., Colleen F. Surber, and Sidney W. Bijou. “Self-Pacing Versus Instructor-Pacing: Achievement, Evaluations, and Retention.” Journal of Educational Psychology.70(2) (April 1978): 224-230.
Murnane, Richard J. and Jennifer L. Steele. “What is the Problem? The Challenge of ProvidingEffective Teachers for All Children,” The Future of Children, vol. 17, no. 1 (Spring 2007):15-43.
Murnane, Richard J., John B. Willet, and Frank Levy. “The Growing Importance of Cognitive

38
Skills in Wage Determination.” Review of Economics and Statistics 77, no. 2 (May 1995):251-266.
Ragosta, M. et al. “Computer-Assisted Instruction and Compensatory Education: The ETS/LAUSDStudy Final Report, Project Report 19.” Princeton, NJ: Educational Testing Service, 1982.
Rouse, Cecilia Elena, Alan B. Krueger, with Lisa Markman. “Putting Computerized Instruction tothe Test: A Randomized Evaluation of a ‘Scientifically-based’ Reading Program.”Economics of Education Review 23, no. 4 (August 2004): 323-338.
Schanzenbach, Diane Whitmore. What Have Researchers Learned from Project STAR? HarrisSchool Working Paper Series 06.06. (August 2006)
Snyder, Thomas D., Alexandra G. Tan, and Charlene M. Hoffman. Digest of Education Statistics:2005. (Washington, DC: National Center for Education Statistics, 2006).
U.S. Department of Education. “The Nation’s Report Card. Mathematics 2005” Washington, D.C.2006.
Wang, Xiaoping, Tingyu Wang, and Renmin Ye. “Usage of Instructional Materials in High Schools:analyses of NELS Data.” Presented at Annual Meeting of American Educational ResearchAssociation. 2002.
Wenglinsky, Harold. “Does it Compute? The Relationship Between Educational Technology andStudent Achievement in Mathematics.” Princeton, NJ: Policy Information Center, ResearchDivision, Educational Testing Service. (ERIC Document Reproduction Service No.ED425191) 1998.

39
38 As noted in the text, we only present results using the analysis sample in District 1 becausewe have specifics about the structure of the school day. Using the entire analysis sample wouldrequire more assumptions.
SIMULATION APPENDIX
In this appendix we present more detailed information on the cost calculations for CAI and
class size reduction using information for all pre-algebra and algebra classes for two schools in
District 1. We also present the same calculations for all District 1 pre-algebra and algebra classes
in the analysis sample.38 The top panel of the Simulation Appendix Table 1 presents cost estimates
for implementing CAI while the bottom panel presents cost estimates for reducing the class size to
14 students. The cost estimates vary because of differences across the schools in the average class
size.
The first three columns are identical in each panel and represent the total number of pre-
algebra and algebra classes, the total number of students, and the average class size, respectively.
Column (4) lists the number of periods the lab is in use (top panel) or the teacher is teaching (bottom
panel). For CAI, we assume that the average class size is equal to the observed average class size
or a maximum of 30 students (column (5) in the top panel). For class size reduction, we assume that
classes are reduced to 14 students. Column (5) in the bottom panel equals the total number of new
classes required to generate an average class size of 14. Column (6) then presents the number of labs
the school (district) needs to put all algebra and pre-algebra classes in CAI (top panel) or the number
of additional teachers needed to reduce pre-algebra and algebra class size to 14 assuming that the
new teachers teach for six of the eight periods in the day. Finally, we assume the lab involves a fixed
cost of $250,000 for hardware and software, $50,000 for three years of support, training, and
maintenance, and that the lab is good for seven years. For the compensation cost of each teacher we

40
39 Most of schools in District 1 operate on a block schedule; however, classes could beorganized either in four blocks for one semester or eight periods over one year. For simplicity weassume classes are organized into eight periods over one year for all schools.
use the salary of a new teacher in district 1 with zero years of experience and further assume that
salary is 70% of the total compensation cost.
For a large school in our sample (School A), the cost of CAI is $218 per pupil compared to
$290 per pupil to reduce class size to 14 students. For a smaller school in our sample (School B),
the cost per pupil is roughly $245 for CAI compared to $239 for class size reduction. The final row
in each panel presents cost estimates using information for all pre-algebra and algebra classes in
District 1 that are represented in the analysis sample.39 In this case, our per pupil cost of CAI is
nearly $283 compared to a per pupil cost of reducing class size that is $198.
When we consider the analysis sample for all three districts, we assume that teachers
typically teach six out of a total of eight class periods during the day in all three districts and that
teacher salaries are the same as in District 1. Thus, since the average class size for all classes in the
analysis sample (23.7) is quite similar to the average for District 1 classes (23.1), the estimates of
the cost of CAI and the cost of class size reduction are quite similar to the estimates for District 1
– $276 per pupil for CAI and $205 per pupil for class size reduction. This is likely an over-estimate
for CAI and an under estimate for class size reduction. For some of the schools in Districts 2 and
3, it appears that teachers may actually teach fewer than six classes per day and some schools may
actually have more than eight periods during the day. Also, teacher salaries may be somewhat higher
in District 2 than in Districts 1 and 3.

41
Simulation Appendix Table 1:Cost Comparisons
The cost of CAI
School
Numberof
classes
Totalnumber ofstudents
Classsize Periods
CAI classsize
CAI labsneeded
Annualcost per
labCost perstudent
(1) (2) (3) (4) (5) (6) (7) (8)
School A 22 730 33.2 8 30.0 3.0 $52,381 $218
School B 12 321 26.8 8 26.8 1.5 $52,381 $245
District 1 analysis sample 75 1736 23.1 8 23.1 9.4 $52,381 $283
The cost of reducing class size to 14 students
School
Numberof
classes
Totalnumber of students
Classsize Periods
New totalmath
classes
Newteachersrequired
Salary +benefits
per teacherCost perstudent
(1) (2) (3) (4) (5) (6) (7) (8)
School A 22 730 33.2 6 52.1 5.0 $42,143 $290
School B 12 321 26.8 6 22.9 1.8 $42,143 $239
District 1 analysis sample 75 1736 23.1 6 124.0 8.2 $42,143 $198
Notes: The information on number of classes and number of students for schools A and B apply to all algebra and pre-algebra classes inthe school while the information on the number of classes and students for the analysis sample only applies to classes that are represented

42
in our analysis sample for District 1. The number of CAI labs needed equals the total number of students divided by the number of studentseach lab serves each day. We assume that the computer lab can be used for the number of periods specified in column (4) of the top paneland that each CAI class is equal to average class size with a maximum of 30 students (column 5). We assume the cost of the lab equals$250,000 in fixed costs plus $50,000 every 3 years for training, support, and maintenance and that the lab will be good for 7 years. Newtotal math classes in column (5) of the bottom panel equals the number of math classes needed for an average class size of 14 students.Assuming each teacher teaches the number of periods in column (4), column (6) represents the number of new teachers needed to reduceclass size to 14 students. Salary is based on the salary schedule for teachers in district 1 with no experience. We assume that salary equals70% of total compensation costs.

43
Table 1: Randomization of Treatment and Control Using Full and Analysis Samples
Random Assignment
TraditionalInstruction
Computer-AssistedInstruction
p-value ofdifference N
Full Sample
Baseline algebra test score 24.7 24.8 0.470 2301
Female (%) 47.6 46.6 0.637 3009
African American (%) 81.8 81.4 0.561 3009
Hispanic (%) 14.3 15.1 0.193 3009
Class size 25.4 25.8 0.571 3541
Analysis Sample
Baseline algebra test score 24.8 24.9 0.289 1605
Female (%) 52.1 48.0 0.152 1510
African American (%) 84.1 82.1 0.048 1510
Hispanic (%) 12.1 13.5 0.062 1510
Class size 25.8 26.3 0.404 1605
Notes: All test scores are scaled scores converted to standard deviation units. The test for a differencein mean characteristic by random assignment is based on a regression of the characteristic on anindicator for random assignment and randomization pool fixed effects allowing for correlation instandard errors at the classroom level. We report the p-value for the t-test that the coefficient on therandom assignment indicator equals zero. The “analysis sample” is composed of those students forwhom we observe both pre- and post-test scores for the (NWEA) algebra test.

44
Table 2a: Ordinary Least Squares and Instrumental Variable Estimates of the Effect of Computer-Assisted Instruction (CAI) on Algebra Achievement
(without Teacher Fixed Effects)
OLS IV
(1) (2) (3) (4) (5) (6)
CAI 0.174(0.076)
0.173(0.074)
0.214(0.076)
0.173(0.059)
0.173(0.058)
0.252(0.086)
Baseline algebra testscore
0.502(0.035)
0.494(0.033)
0.493(0.034)
Female 0.082(0.044)
0.091(0.041)
0.082(0.041)
African American -0.672(0.180)
-0.526(0.136)
-0.523(0.137)
Hispanic -0.541(0.212)
-0.405(0.158)
-0.389(0.158)
Observations 1873 1873 1605 1605 1605 1605
Notes: Each column represents a separate regression. Test scores are scaled scores converted tostandard deviation units. Each regression also controls for the randomization pool as well as anindicator equal to one if sex is missing and an indicator equal to 1 if race/ethnicity is missing forregressions including demographic information. For the IV estimates of the effect of treatment-on-the-treated we define treatment as completing at least one lesson in computerized algebra instruction.We report standard errors that allow for correlation within classroom in parentheses.

45
Table 2b: Ordinary Least Squares and Instrumental Variable Estimates of the Effect of Computer-Assisted Instruction (CAI) on Algebra Achievement
(with Teacher Fixed Effects)
OLS IV
(1) (2) (3) (4) (5) (6)
CAI 0.373(0.071)
0.367(0.067)
0.423(0.074)
0.282(0.053)
0.282(0.053)
0.416(0.079)
Baseline algebra testscore
0.485(0.035)
0.478(0.034)
0.469(0.034)
Female 0.109(0.041)
0.120(0.041)
0.108(0.041)
African American -0.618(0.155)
-0.471(0.128)
-0.464(0.132)
Hispanic -0.498(0.186)
-0.368(0.153)
-0.339(0.152)
Observations 1873 1873 1605 1605 1605 1605
Notes: Each column represents a separate regression. Test scores are scaled scores converted tostandard deviation units. Each regression also controls for the randomization pool, an indicator equalto one if sex is missing, an indicator equal to 1 if race/ethnicity is missing for regressions includingdemographic information, and teacher fixed effects. For the IV estimates of the effect of treatment-on-the-treated we define treatment as completing at least one lesson in computerized algebrainstruction. We report standard errors that allow for correlation within classroom in the parentheses.The p-values of the F-tests on the statistical significance of the teacher effects equal zero for allspecifications.

46
Table 3: Amount of Time in the Computer Lab by the Random Assignment of the Student’s Class
Random Assignment
TraditionalInstruction CAI
Number of lessons students are expectedto complete based on the course level
52.7(14.3)
55.4(15.2)
Percent of students completing no lessonsin CAI
79.4(40.5)
9.3(29.0)
Percent of students completing more than10 lessons in CAI
15.8(36.5)
84.2(36.5)
Percent of students completing more than20 lessons in CAI
11.1(31.4)
72.0(44.9)
Number of lessons completed in CAI 5.8(15.5)
33.0(23.9)
Number of CAI lessons completed as apercent of course expectations
10.4(28.2)
64.2(50.3)
Number of observations 795 810
Notes: District 1 has 62 school days in the study while classes in Districts 2 and 3 generally have 180days in the study. One exception is that a few classes in District 3 meet on only half of the schooldays.
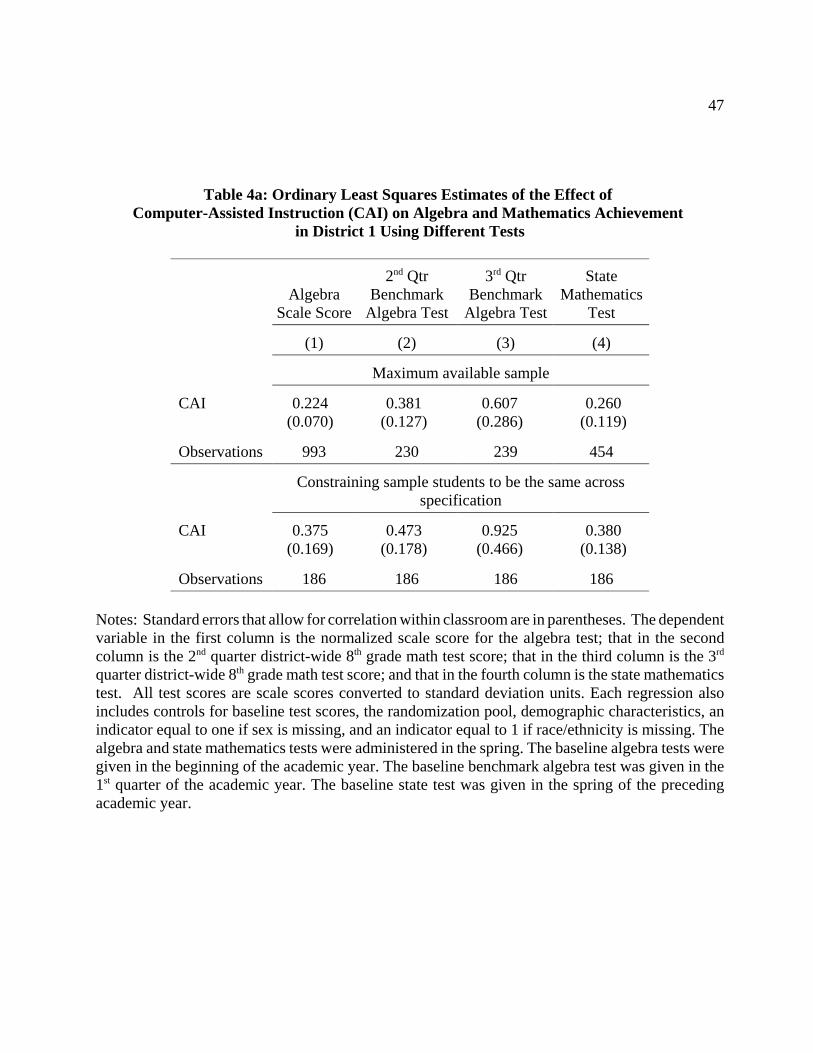
47
Table 4a: Ordinary Least Squares Estimates of the Effect of Computer-Assisted Instruction (CAI) on Algebra and Mathematics Achievement
in District 1 Using Different Tests
AlgebraScale Score
2nd QtrBenchmark
Algebra Test
3rd QtrBenchmark
Algebra Test
StateMathematics
Test
(1) (2) (3) (4)
Maximum available sample
CAI 0.224(0.070)
0.381(0.127)
0.607(0.286)
0.260(0.119)
Observations 993 230 239 454
Constraining sample students to be the same acrossspecification
CAI 0.375(0.169)
0.473(0.178)
0.925(0.466)
0.380(0.138)
Observations 186 186 186 186
Notes: Standard errors that allow for correlation within classroom are in parentheses. The dependentvariable in the first column is the normalized scale score for the algebra test; that in the secondcolumn is the 2nd quarter district-wide 8th grade math test score; that in the third column is the 3rd
quarter district-wide 8th grade math test score; and that in the fourth column is the state mathematicstest. All test scores are scale scores converted to standard deviation units. Each regression alsoincludes controls for baseline test scores, the randomization pool, demographic characteristics, anindicator equal to one if sex is missing, and an indicator equal to 1 if race/ethnicity is missing. Thealgebra and state mathematics tests were administered in the spring. The baseline algebra tests weregiven in the beginning of the academic year. The baseline benchmark algebra test was given in the1st quarter of the academic year. The baseline state test was given in the spring of the precedingacademic year.

48
Table 4b: Ordinary Least Squares Estimates of the Effect of Computer-Assisted Instruction (CAI) on Algebra and Mathematics Achievement
in Districts 2 and 3 Using Different Tests
District 2 District 3
AlgebraScale Score
StateMathematics
TestAlgebra
Scale Score
StateMathematics
Test
(1) (2) (3) (4)
Maximum sample available
CAI 0.201(0.131)
0.089(0.094)
-0.124(0.122)
-0.062(0.118)
Observations 412 341 200 199
Constraining sample students to be the same acrossspecification within school district
CAI 0.401(0.171)
0.082(0.112)
0.031(0.183)
-0.202(0.109)
Observations 229 229 107 107
Notes: Standard errors that allow for correlation within classroom are in parentheses. The dependentvariable in the first and third columns is the normalized scale score for the algebra test; those in thesecond and fourth column are the respective state mathematics test. All test scores are scale scoresconverted to standard deviation units. Each regression also includes controls for baseline test scores,the randomization pool, demographic characteristics, an indicator equal to one if sex is missing, andan indicator equal to 1 if race/ethnicity is missing. The algebra tests were administered in the spring.The baseline algebra tests were given in the beginning of the fall. For District 2 the state mathematicstest was administered in the spring of the students’ 10th grade year. For District 3 the statemathematics test was administered in the fall of the students’ 10th grade year. For both districts, thebaseline state tests were given in the fall of the students’ 8th grade year.

49
Table 5: Differential Intent-to-Treat Effects of the Computerized Instruction on Pre-Algebra and Algebra Achievement by Class Type and Baseline Test Score Quartile
All 3 Districts Districts 1 and 2 District 1 District 2 District 3
(1) (2) (3) (4) (5)
CAI effect for Algebra 0.008(0.059)
0.072(0.064)
0.131(0.064)
-0.307(0.218)
-0.231(0.101)
CAI effect for Pre-Algebra 0.481(0.119)
0.452(0.121)
0.440(0.156)
0.514(0.188)
1.363(0.691)
CAI effect for bottom baseline testscore quartile
0.218(0.092)
0.300(0.096)
0.317(0.097)
0.248(0.239)
-0.274(0.261)
CAI effect for 2nd baseline testscore quartile
0.220(0.102)
0.231(0.112)
0.111(0.121)
0.475(0.244)
0.190(0.206)
CAI effect for 3rd baseline testscore quartile
0.311(0.106)
0.329(0.114)
0.289(0.135)
0.480(0.202)
0.243(0.292)
CAI effect for top quartile 0.055(0.123)
0.178(0.131)
0.208(0.122)
0.142(0.318)
-0.882(0.267)
Number of observations 1605 1405 993 412 200Notes: Each column of each panel represents a separate regression. All test scores are scale scores converted to standard deviation units.Regressions in the top panel include baseline test scores. Each regression also controls for the randomization pool, demographiccharacteristics, an indicator equal to one if sex is missing, and an indicator equal to 1 if race/ethnicity is missing. Baseline test scorequartiles are defined within class. We report standard errors that allow for correlation within classroom in the parentheses.

50
Table 6a: Differential Intent-to-Treat Effects of the Computerized Instruction on Pre-Algebra and Algebra Achievement
by Individual Attendance Rates
Districts 2 and 3 District 2 District 3
(1) (2) (3)
CAI effect for bottombaseline attendance quartile
0.440(0.288)
0.113(0.396)
0.799(0.353)
CAI effect for 2nd baselineattendance quartile
-0.221(0.208)
-0.137(0.329)
-0.579(0.267)
CAI effect for 3rd baselineattendance quartile
-0.051(0.175)
-0.053(0.256)
-0.068(0.293)
CAI effect for top baselineattendance quartile
-0.020(0.198)
-0.120(0.313)
0.146(0.256)
Number of observations 372 221 151
Notes: Each column and panel represents a separate regression. Test scores are scaled scores converted to standard deviation units. Eachregression also controls for the randomization pool, the baseline test scores, demographic characteristics, an indicator equal to one if sexis missing, and an indicator equal to 1 if race/ethnicity is missing. We report standard errors that allow for correlation within classroomin the parentheses. Each student’s attendance rate is calculated as the percent of enrolled days that the student is in attendance. Attendancequartiles are calculated within district.

51
Table 6b: Differential Intent-to-Treat Effects of the Computerized Instruction on Pre-Algebra and Algebra Achievement
by Class Characteristic: Attendance
District 2 andDistrict 3 District 2 District 3
CAI 2.135(1.019)
2.266(1.223)
2.814(1.974)
CAI × Average classattendance
-0.025(0.012)
-0.025(0.014)
-0.034(0.022)
Mean (std. deviation) ofclass attendance rate
83.287(11.803)
82.513(13.605)
84.695(7.307)
Number of observations 564 364 200
Notes: See notes for Table 6a. Average class attendance is based on individual student attendancedata for the year preceding the year of the experiment. The specifications also include a main effectfor average class attendance.

52
Table 7: Differential Intent-to-Treat Effects of the Computerized Instruction on Pre-Algebra and Algebra Achievement by Class Size
All 3 Districts Districts 1 and 2 District 1 District 2 District 3
(1) (2) (3) (4) (5)
CAI -0.126(0.211)
-0.317(0.248)
-0.320(0.247)
-0.035(0.922)
-0.033(0.694)
CAI × Class size 0.012(0.008)
0.021(0.010)
0.021(0.011)
0.011(0.042)
-0.004(0.022)
Mean class size (standard deviation)
26.015(6.615)
25.640(6.119)
26.428(6.321)
23.740(5.135)
28.650(8.976)
Number of observations 1605 1405 993 412 200
Notes: Each column represents a separate regression. Test scores are scaled scores converted to standard deviation units. Each regressionalso controls for the randomization pool, the baseline test scores, demographic characteristics, an indicator equal to one if sex is missing,an indicator equal to 1 if race/ethnicity is missing, and a main effect of average class size. We report standard errors that allow forcorrelation within classroom in the parentheses.
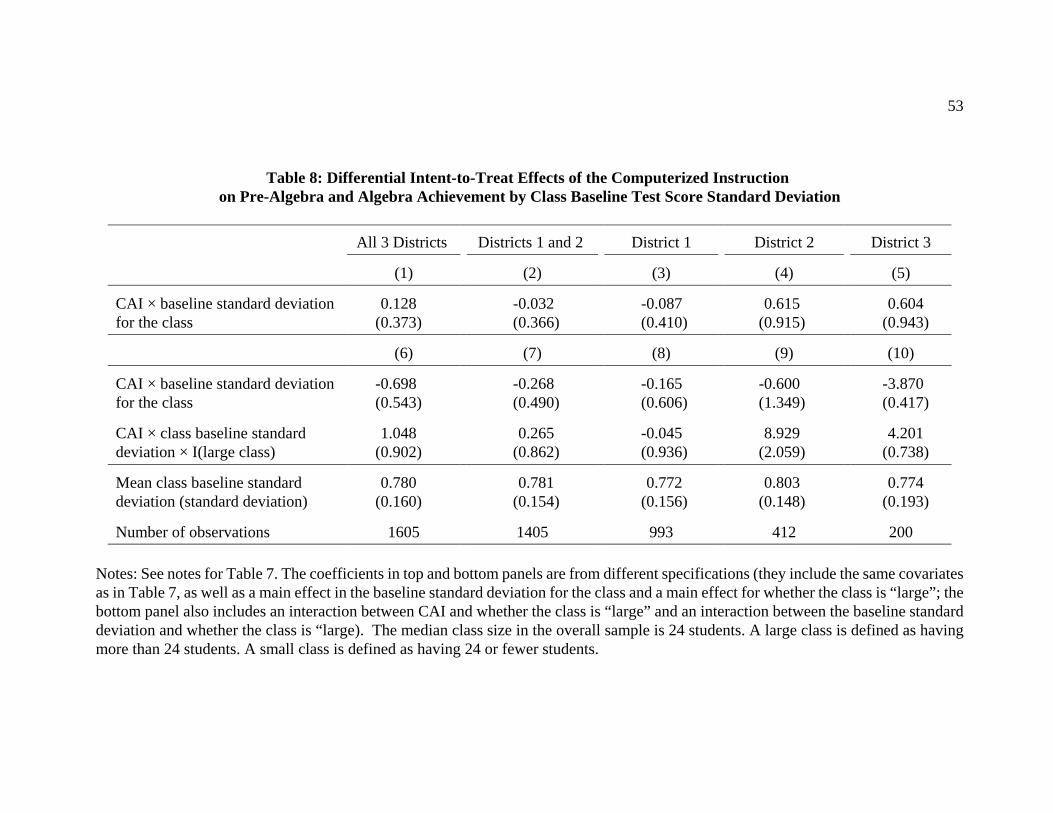
53
Table 8: Differential Intent-to-Treat Effects of the Computerized Instruction on Pre-Algebra and Algebra Achievement by Class Baseline Test Score Standard Deviation
All 3 Districts Districts 1 and 2 District 1 District 2 District 3
(1) (2) (3) (4) (5)
CAI × baseline standard deviation for the class
0.128(0.373)
-0.032(0.366)
-0.087(0.410)
0.615(0.915)
0.604(0.943)
(6) (7) (8) (9) (10)
CAI × baseline standard deviation for the class
-0.698(0.543)
-0.268(0.490)
-0.165(0.606)
-0.600(1.349)
-3.870(0.417)
CAI × class baseline standarddeviation × I(large class)
1.048(0.902)
0.265(0.862)
-0.045(0.936)
8.929(2.059)
4.201(0.738)
Mean class baseline standarddeviation (standard deviation)
0.780(0.160)
0.781(0.154)
0.772(0.156)
0.803(0.148)
0.774(0.193)
Number of observations 1605 1405 993 412 200
Notes: See notes for Table 7. The coefficients in top and bottom panels are from different specifications (they include the same covariatesas in Table 7, as well as a main effect in the baseline standard deviation for the class and a main effect for whether the class is “large”; thebottom panel also includes an interaction between CAI and whether the class is “large” and an interaction between the baseline standarddeviation and whether the class is “large). The median class size in the overall sample is 24 students. A large class is defined as havingmore than 24 students. A small class is defined as having 24 or fewer students.

54
Appendix Table 1: Districts in Study Compared to National Average
United States100 Largest
Districts3 DistrictsCombined District 1 District 2 District 3
Average # of students in adistrict (all grades)
112,807 63,000 ~68,000 ~22,000 ~97,000
% Female 48.8 49.4 49.7 48.8 49.3% African American 28.1 69.5 93.6 40.3 59.4% Hispanic 34.1 16.2 1.1 54.3 18.0% Native American 0.6 0.5 0.1 0.1 0.9% Asian 7.1 3.1 1.9 0.8 4.4
Source: Authors’ calculations based on the National Center for Education Statistics Common Core of Data (CCD), 2003-2004 school year,100 largest districts by total enrollment. Percentages are based only on schools reporting. (Data on sex are missing for Knox County,Memphis City, Nashville-Davidson County, Philadelphia City, Portland, and Shelby County School Districts. Data on race and ethnicityare missing for Memphis City, Nashville-Davidson County, and Shelby County School Districts.) Demographic characteristics for the threedistricts combined are enrollment-weighted averages of the individual district means.

55
Appendix Table 2: Schools and Students in Study Compared to the Overall District Averages
District 1 District 2 District 3
RelevantSchools
Schoolsin Study
Studentsin Study
RelevantSchools
Schoolsin Study
Studentsin Study
RelevantSchools
Schoolsin Study
Studentsin Study
Number of students 29,603 8,148 993 5,270 4,476 412 27,572 3,540 200
Students per school 604 815 99 659 1119 103 484 1180 67
Grade 8 (%) 19.3 16.8 40.5 2.3 0.0 0.0 1.4 0.0 3.5
Grade 9 (%) 18.0 18.3 47.1 38.0 40.0 52.7 35.6 40.0 91.5
Grade 10 (%) 15.1 17.8 9.9 22.0 23.2 31.8 23.3 25.1 3.0
Female (%) 50.5 49.0 47.2 48.4 48.2 46.6 49.9 47.6 47.5
African American (%) 94.2 97.2 87.9 43.6 42.0 47.1 61.1 92.5 94.0
Hispanic (%) 1.0 0.8 0.8 50.1 51.2 44.7 15.2 1.2 0.5
White (%) 2.6 0.4 0.1 5.5 5.9 6.6 18.3 4.0 1.5
Asian (%) 2.2 1.6 1.8 0.7 0.8 0.5 4.5 1.9 3.0
Missing demographicdata (%)
9.4 0.2 0.5
Source: Authors’ calculations based on the National Center for Education Statistics. Common Core of Data, 2003-2004 school year. Thereare 49 “relevant” schools in District 1, 8 in District 2, and 57 in District 3. Relevant schools in District 1 are defined as schools in the CCDwith a level of middle school, high school, or other; relevant schools in District 2 and District 3 have a level of high school or other. Wedrop middle schools in District 1 for which the highest grade offered is less than grade 8. There are 10 schools in the study in District 1,four schools in District 2, and three schools in District 3. Characteristics on the students in the study come from data made available tothe authors by the school districts.

56
Appendix Table 3: Numbers of Schools, Classes, Teachers, Students and Randomization Pools
Combined District 1 District 2 District 3
Full Sample
Number of schools 17 10 4 3
Number of classes 152 82 46 24
Number of teachers 61 39 15 7
Number of students 3541 1870 1062 609
Number of randomization pools 60 31 19 10
Analysis Sample
Number of schools 17 10 4 3
Number of classes 142 75 44 23
Number of teachers 57 36 14 7
Number of students 1605 993 412 200
Number of randomization pools 60 31 19 10

57
Appendix Table 4a: Randomization of Treatment and Control (Using Full Sample)
Random Assignment
TraditionalInstruction
ComputerizedInstruction
p-value ofdifference
District 1
Baseline algebra test score 24.7 24.8 0.271
Baseline state test score 9.2 9.2 0.990
Baseline district test score 3.0 3.7 0.107
Female 51.9 47.5 0.129
African American 98.4 97.5 0.260
Hispanic 0.7 0.8 0.810
Class size 25.4 25.4 0.528
District 2
Baseline algebra test score 24.7 24.7 0.814
Baseline state test score 6.6 6.7 0.558
Female 43.5 45.3 0.561
African American 49.0 48.0 0.566
Hispanic 43.9 46.3 0.204
Class size 23.9 24.8 0.369
District 3
Baseline algebra test score 25.0 25.0 0.952
Baseline state test score 16.7 16.7 0.992
Female 43.7 47.6 0.482
African American 93.1 95.1 0.126
Hispanic 0.7 0.8 0.792

58
Class size 29.9 28.7 0.547
Notes: All test scores are scaled scores converted to standard deviation units. The test for a differencein mean characteristic by random assignment is based on a regression of the characteristic on anindicator for random assignment and randomization pool fixed effects allowing for correlation instandard errors at the classroom level. We report the p-value for the t-test that the coefficient on therandom assignment indicator equals zero. For District 1: baseline algebra test scores are availablefor 711 treatment students and 634 controls; baseline state test scores are available for 474 treatmentstudents and 387 controls; baseline district test scores are available for 110 treatment students and147 controls; and demographic data are available for 831 treatment students and 689 controls. ForDistrict 2: baseline algebra test scores are available for 281 treatment students and 351 controls;baseline state test scores are available for 243 treatment students and 348 controls; and demographicdata are available for 397 treatment students and 556 controls. For District 3: baseline algebra testscores are available for 165 treatment students and 159 controls; baseline state test scores areavailable for 151 treatment students and 172 controls; and demographic data are available for 249treatment students and 287 controls.

59
Appendix Table 4b: Assessing Random Assignment with the Analysis Sample
Random Assignment
TraditionalInstruction
ComputerizedInstruction
p-value ofdifference
District 1
Baseline algebra test score 24.7 24.8 0.452
Baseline state test score 9.3 9.4 0.860
Baseline district test score 3.1 3.9 0.029
Female 55.5 49.1 0.096
African American 97.8 96.3 0.187
Hispanic 0.9 0.9 0.988
Class size 26.0 26.8 0.315
District 2
Baseline algebra test score 24.8 25.0 0.274
Baseline state test score 6.7 6.9 0.129
Female 47.8 45.3 0.634
African American 49.5 44.4 0.061
Hispanic 42.6 47.4 0.054
Class size 23.3 24.3 0.353
District 3
Baseline algebra test score 25.2 25.0 0.320
Baseline state test score 17.0 16.8 0.084
Female 46.8 48.7 0.808
African American 93.7 95.2 0.290
Hispanic 0.0 1.1 0.161
Class size 29.4 27.9 0.462

60
Notes: The “analysis sample” is composed of those students for whom we observe both pre- and post-test scores for the (NWEA) algebra test. All test scores are scaled scores converted to standarddeviation units. The test for a difference in mean characteristic by random assignment is based ona regression of the characteristic on an indicator for random assignment and randomization pool fixedeffects allowing for correlation in standard errors at the classroom level. We report the p-value forthe t-test that the coefficient on the random assignment indicator equals zero. For District 1: baselinealgebra test scores are available for 527 treatment students and 466 controls; baseline state test scoresare available for 298 treatment students and 270 controls; baseline district test scores are availablefor 85 treatment students and 117 controls; and demographic data are available for 476 treatmentstudents and 424 controls. For District 2: baseline algebra test scores are available for 183 treatmentstudents and 229 controls; baseline state test scores are available for 116 treatment students and 162controls; and demographic data are available for 182 treatment students and 229 controls. For District3: baseline algebra test scores are available for 100 treatment students and 100 controls; baseline statetest scores are available for 61 treatment students and 61 controls; and demographic data are availablefor 100 treatment students and 99 controls.