TCEQ-Modeling and Effects Review Applicability (MERA)€¦ · · 2018-03-12While this document...
22
TCEQ – (APDG 5874v5, Revised 03/18) Modeling and Effects Review Applicability Page i Air Permit Reviewer Reference Guide APDG 5874 Modeling and Effects Review Applicability (MERA) Air Permits Division Texas Commission on Environmental Quality March 2018
Transcript of TCEQ-Modeling and Effects Review Applicability (MERA)€¦ · · 2018-03-12While this document...

TCEQ – (APDG 5874v5, Revised 03/18) Modeling and Effects Review Applicability Page i
Air Permit Reviewer Reference Guide
APDG 5874
Modeling and Effects Review Applicability
(MERA)
Air Permits Division Texas Commission on Environmental Quality
March 2018

TCEQ – (APDG 5874v5, Revised 03/18) Modeling and Effects Review Applicability Page ii
Table of Contents
Introduction ..................................................................................................................... 1
Summary of Significant Changes .................................................................................... 2
How to Determine the Scope of Modeling and Effects Review for Air Permits ................ 3
Step 0: Applicability and Procedures .......................................................................... 3
Step 1: No Net Increase ............................................................................................. 5
Step 2: De Minimis Increase ....................................................................................... 5
Step 3: 10% of ESL Evaluation ................................................................................... 6
Step 4: Project-wide Modeling .................................................................................... 8
Step 5: MSS Evaluation .............................................................................................. 9
Step 6: Ratio Test ..................................................................................................... 10
Step 7: Site-wide Modeling. ...................................................................................... 10
Step 8: Documentation ............................................................................................. 10
Appendix A: Glossary ................................................................................................... 11
Appendix B: Toxicology Emissions Screening List ....................................................... 13
Appendix C: Screening Tables ..................................................................................... 14
Appendix D: Toxicology Effects Evaluation Procedure................................................. 19
Appendix E: MERA Flowchart ...................................................................................... 20

TCEQ – (APDG 5874v5, Revised 03/18) Modeling and Effects Review Applicability Page 1 of 20
Introduction
The Texas Commission on Environmental Quality (TCEQ) regulates air quality in the state of Texas through the Texas Clean Air Act (TCAA), located in Chapter 382 of the Texas Health and Safety Code and rules, including those in Title 30 Texas Administrative Code (TAC) Chapter 116.
The TCEQ staff conducts a preconstruction technical review during the air permitting process. This review ensures that the operation of a proposed facility will comply with all the rules of the TCEQ and intent of the TCAA, and not cause or contribute to a condition of air pollution. A review of an air permit application involves an assessment of human health and welfare effects related to emissions from production and planned maintenance, startup, and shutdown (MSS) activities.
The human health and welfare effects are evaluated for applications with new and/or modified sources of air contaminants, as well as in permitting actions involving retrospective reviews or previously unevaluated emissions. Contaminants for which state air quality standards or National Ambient Air Quality Standards (NAAQS) exist are evaluated using a comparison between predicted concentrations and the standards. The evaluation procedures for these contaminants are covered in detail in the TCEQ Air Quality Modeling Guidelines – APDG 6232. If there are no state or national ambient air quality standards for a contaminant, it is evaluated through the TCEQ’s Modeling and Effects Review Applicability (MERA) process. During the course of the MERA process, the scope of air dispersion modeling and effects review is determined.
While this document provides a general process and defines minimum considerations for agency staff’s air quality impacts analysis, this document is not regulatory and does not limit the permit reviewer’s ability to require the applicant to provide additional information. In addition, the permit reviewer and Air Permits Division (APD) management have the discretion to perform an effects review outside of the MERA process.
The MERA process begins with Step 0, which informs the user of the general procedures and practices to be followed throughout the MERA process. Steps 1 through 7 detail the criteria used to evaluate the health effects of an air contaminant. The initial steps in the MERA process are designed to be simple and conservative. As one progresses through the process, the steps require more detail and result in a more refined (less conservative) analysis. Site-wide air dispersion modeling is conducted at Step 7; and those results are evaluated using the Toxicology Effects Evaluation Procedure in Appendix D. If a contaminant, evaluated on a chemical species by chemical species basis, meets the criteria of a step, the review of human health and welfare effects is complete. A chemical species is said to “fall out” of the MERA process at this step, and the MERA document will direct the user to Step 8 to document the evaluation. If a contaminant does not meet the criteria of a step, the document will direct the user to the appropriate next step. It is acceptable to skip steps in the MERA process and proceed directly to more detailed steps.
This document replaces Modeling and Effects Review Applicability, APDG 5874, July 2009.

TCEQ – (APDG 5874v5, Revised 03/18) Modeling and Effects Review Applicability Page 2 of 20
Summary of Significant Changes
Revision Date Description of Changes
February 2018 Improve ease of use and clarity, removed infrequently used steps, and revised multi-point equation in previous Step 5. Chemical species for which there is not an ESL may be exempted from a MERA evaluation.
July 2009 Provided additional clarity pertaining to unevaluated and MSS emissions and added Appendix D, Toxicology Effects Evaluation Procedure.
August 2008 Updated requirements for APWL Constituents, added criteria for planned MSS and unevaluated emissions and added the term “permit-wide,” established magnitude and frequency criteria for planned MSS emissions.
October 2001 Removed special interest constituents, and replaced with Air Pollutant Watch List, corrected multi-point equation in Step 5, and added information about single property line designations.
August 1998 Updated flowchart, added requirements for constituents of special interest, and added effects evaluation procedures and updated the format.
July 1993 Original MERA Guidance Document

TCEQ – (APDG 5874v5, Revised 03/18) Modeling and Effects Review Applicability Page 3 of 20
How to Determine the Scope of Modeling and Effects Review for Air Permits
Step 0: Applicability and Procedures MERA Evaluation Applicability
A MERA evaluation must be conducted for all chemical species whose short-term or long-term allowable emission rate will increase from any emission point number (EPN) through the project. The change in an allowable emission rate is calculated as the difference between the proposed maximum allowable emission rate and the currently permitted maximum allowable emission rate. Throughout the remainder of this document “allowable emission rates” will be referred to as “emission rates” or “emissions.”
The following are exempt from a MERA evaluation:
• All chemical species for which there is a state air quality standard or NAAQS, other than particulate matter species that have an Effects Screening Level (ESL) published by the TCEQ Toxicology Division. The ESL database will reference the NAAQS in place of an ESL if a MERA evaluation is not required for a particulate matter species.
• The “Air Quality Modeling Guidelines” document (APDG 6232) provides the process for evaluating chemical species for which there is a state air quality standard or NAAQS.
• Facilities and chemical species listed on the Toxicology Emissions Screening List (see Appendix B).
• Chemical species for which there is not a current ESL listed in the Toxicity Factor Database, accessed through the Texas Air Monitoring Information System (TAMIS) database via the Toxicology ESL summary and detail reports. While no effects review is required, such chemical species must satisfy the BACT and other requirements. In addition, the permit reviewer and APD management have the discretion to perform an effects review outside of the MERA process. This exemption does not apply to chemical species being authorized under chemical flexibility permit provisions.
General Procedures
The following applies to the health effects review described in the MERA process, unless otherwise specified:
• The MERA evaluation must be conducted for each chemical species individually (except in cases where the Toxicology Division has developed an ESL for a blend such as gasoline), and must include all EPNs in the project with an increasing allowable emission rate of that chemical species.
• A short-term impacts evaluation must be conducted for all chemical species with an increase in short-term emissions.
• A long-term impacts evaluation must be conducted for chemical species with an increase in long-term emissions under the following conditions:
o for all chemical species with a long-term ESL that is less than 10 percent of the short-term ESL or;
o if a chemical species does not have an assigned short-term ESL, but does have an assigned long-term ESL; or

TCEQ – (APDG 5874v5, Revised 03/18) Modeling and Effects Review Applicability Page 4 of 20
o if previous impacts were approved based on a limited frequency of exceedances.
For other cases, a long-term impacts is not required unless requested by the permit reviewer.
• The input of a screening model is an emission rate in mass per unit of time and the output is a maximum 1-hr ground level concentration (GLCmax), in units of micrograms per cubic meter (µg/m3). Therefore, if a long-term impacts evaluation is necessary and screen modeling is used, an annual GLCmax must be calculated by multiplying:
o an annual unit impact multiplier, and o an emission rate representative of the annual emission increase associated with the
1-hr GLCmax.
For SCREEN3, the annual unit impact multiplier is determined by multiplying the hourly unit impact multiplier by 0.08, which is an annual conversion factor that accounts for the variation in meteorological conditions throughout the year. For AERSCREEN the annual unit impact multiplier is determined by multiplying the hourly unit impact multiplier by the annual conversion factor 0.1. An annual conversion factor is not needed if a refined model that can calculate an annual GLCmax is used.
To determine the emission rate representative of the annual emissions increase, convert the ton-per-year increase in emissions to a pound-per-hour rate using 8760 hours per year and 2000 pounds per ton.
As an example, an emission source has an hourly unit impact multiplier of 100 µg/m3, generated using SCREEN3, and an annual emission rate of 40 tpy. The annual emission rate is converted to an hourly rate as shown below:
40 tpy x 2000 lb/ton / 8760 hours/year = 9.134 lb/hr
The maximum 1-hr ground level concentration is multiplied by 0.08 to yield an annual unit impact multiplier:
100 µg/m3 x 0.08 = 8 µg/m3
The annual GLCmax is then calculated by multiplying that annual unit impact multiplier and that emission rate representative of the annual emissions:
8 µg/m3 x 9.134 pph = 73.1 µg/m3
• ESLs should be determined from the Toxicity Factor Database, accessed through the TAMIS database. Instructions for using the database can be found on the Toxicology Division’s website. If a chemical species does not have an assigned ESL, it may be exempted from a MERA effects evaluation, unless an evaluation is requested by the permit reviewer. However, for certain chemical species, such as chemicals to be approved under chemical flexibility permit provisions or proprietary mixtures, a new ESL may be requested from the Toxicology Division. In addition, a default ESL of 2 µg/m3 may be used for a species with an unknown ESL.
• Unless otherwise stated, each step in the MERA evaluation must include all emissions associated with the project, including:
o MSS emissions that will be authorized under Permits By Rule (PBRs).
o Emissions from PBRs and Standard Permits (SPs) that are being consolidated by incorporation into the permit.

TCEQ – (APDG 5874v5, Revised 03/18) Modeling and Effects Review Applicability Page 5 of 20
• Chemical species on the Air Pollutant Watch List (APWL) are subject to the requirements detailed in the “Permit Application Guidance for Companies Located in an Air Pollutant Watch List Area” guidance document, and must also be evaluated using the MERA. Also, a case-by-case analysis not relying on the steps of the MERA may be required for any specific situation as deemed appropriate by the permit reviewer and APD management.
• A retrospective MERA evaluation may be required for corrections in representations or emission calculations.This determination will be made on a case-by-case basis.
• All refined modeling should be conducted in accordance with direction from APD staff and the “Air Quality Modeling Guidelines” document (APDG 6232). A pre-modeling meeting or teleconference with the applicant, permit reviewer and modeling team is recommended before refined modeling is performed.
Step 1: No Net Increase
• Sum the proposed emission increases and decreases from each EPN to determine the net change in emissions.
Step 1: Is the net change in emissions less than or equal to zero? If “Yes” → Conduct a qualitative analysis to determine if the project will result in an
increase in the GLCmax at the property line. The qualitative analysis should include factors affecting the GLCmax such as distance from the property line and the type of source (point, area, or volume). Submit the analysis as requested by the permit reviewer.
Does the qualitative analysis indicate that the GLCmax will increase?
If “No” → The MERA is complete. Proceed to Step 8 for documentation. If “Yes” → Step 2.
If “No” → Step 2.
Step 2: De Minimis Increase
• Sum the short-term emission increases from each EPN to obtain the total short-term project increase. Do not include emission rate decreases from any EPN.
o Include any unevaluated emissions such as emissions from PBRs, SPs, or any other authorization.
o If MSS and production emissions occur simultaneously, add the MSS and production emissions into one emission rate. Otherwise, calculate separate rates.
Step 2: Is the long-term ESL ≥ 10 % of the short-term ESL? AND
Are total short-term project increases less than the appropriate de minimis levels below? If MSS and production emissions occur simultaneously, evaluate the combined emission rates against the production de minimis levels. Otherwise, evaluate MSS and production emissions separately against their respective de minimis levels.

TCEQ – (APDG 5874v5, Revised 03/18) Modeling and Effects Review Applicability Page 6 of 20
Short-term ESL
(μg/m3) Production Emissions
Increase (lb/hr) MSS Emissions Increase
(lb/hr) 2 ≤ ESL < 500 ≤ 0.04 ≤ 0.1
500 ≤ ESL < 3500 ≤ 0.1 3500 ≤ ESL ≤ 0.4 ≤0.4
If “Yes” → The MERA is complete. Proceed to Step 8 for documentation. If “No” → Step 3.
Step 3: 10% of ESL Evaluation
• Evaluate emission increases in this step. Do not include emission decreases.
• For each EPN (EPNi), obtain the unit impact multiplier (Xi), using either the Screening Tables found in Appendix C or an approved EPA model.
• Use the following equation to conservatively predict impacts from the project:
𝐺𝐺𝐺𝐺𝐺𝐺𝑚𝑚𝑚𝑚𝑚𝑚 = �(𝑋𝑋𝑖𝑖 ∗ ER𝑖𝑖)𝑛𝑛
𝑖𝑖=1
where:
GLCmax = The maximum off-property ground level concentration for the appropriate averaging time of the chemical species emitted from all emission points in the impacts evaluation, in µg/m3.
Xi = The unit impact multiplier obtained from the Screening Tables in Appendix C or an approved EPA Model for EPN i, in µg/m3 per lb/hr.
ERi = The project emission rate increase of the chemical species being evaluated, from EPNi in lb/hr.
n = The total number of emission points.
Step 3: Is the following inequality true? 𝑮𝑮𝑮𝑮𝑮𝑮𝒎𝒎𝒎𝒎𝒎𝒎 ≤ 𝟎𝟎.𝟏𝟏 ∗ 𝑬𝑬𝑬𝑬𝑮𝑮
where:
ESL = The effects screening level for the appropriate averaging time, in µg/m3 for the chemical species being evaluated.
If “Yes” → Step 8. The MERA is complete. If “No” → Step 4.

TCEQ – (APDG 5874v5, Revised 03/18) Modeling and Effects Review Applicability Page 7 of 20
Example:
EPN Emission Rate Increase (lb/hr)
ESL (µg/m3)
Distance (feet)
Height (feet)
X Value (µg/m3 / lb/hr)
1 3 20,000 1000 10 252 2 10 20,000 4000 20 50
�(𝑋𝑋𝑖𝑖 ∗ 𝐸𝐸𝐸𝐸𝑖𝑖)𝑛𝑛
𝑖𝑖=1
≤ 0.1 ∗ 𝐸𝐸𝐸𝐸𝐺𝐺
(𝑋𝑋1 ∗ 𝐸𝐸𝐸𝐸1) + (𝑋𝑋2 ∗ 𝐸𝐸𝐸𝐸2) ≤ 0.1 ∗ 𝐸𝐸𝐸𝐸𝐺𝐺
�252µ𝑔𝑔
𝑚𝑚3�𝑙𝑙𝑙𝑙
ℎ𝑟𝑟�∗ 3
𝑙𝑙𝑙𝑙ℎ𝑟𝑟� + �50
µ𝑔𝑔𝑚𝑚3�
𝑙𝑙𝑙𝑙ℎ𝑟𝑟�
∗ 10𝑙𝑙𝑙𝑙ℎ𝑟𝑟� ≤ 0.1 ∗ 20,000
µ𝑔𝑔𝑚𝑚3
756µ𝑔𝑔𝑚𝑚3 + 500
µ𝑔𝑔𝑚𝑚3 ≤ 2,000
µ𝑔𝑔𝑚𝑚3
1,256 µ𝑔𝑔𝑚𝑚3 ≤ 2,000
µ𝑔𝑔𝑚𝑚3
In this example, the chemical species evaluated falls out at Step 3 because the increase in total ground level concentration is less than 10% of the ESL.

TCEQ – (APDG 5874v5, Revised 03/18) Modeling and Effects Review Applicability Page 8 of 20
Step 4: Project-wide Modeling
• Model the MSS and production emissions for the project. Determine a GLCmax for production emissions and a GLCmax for MSS emissions.
• Model the MSS and production emissions for the project combined with all new and increased emissions since the most recent sitewide modeling. Determine a GLCmax for production emissions and a GLCmax for MSS emissions.
• Do not include emission decreases.
• Historical modeling records may be used to determine GLCmax values for this step.
Step 4: Will the following thresholds be met at the location of the GLCmax?
Planned MSS Only Production Only GLCmax ≤50% ESL for the project and all new and increased planned MSS emissions since
the most recent site-wide modeling
AND
GLCmax ≤25% ESL for the project
GLCmax ≤25% ESL for the project and all new and increased production emissions since the
most recent site-wide modeling
AND
GLCmax ≤10% ESL for the project
If “Yes” for both Production and Planned MSS → Step 8. The MERA is complete.
If “Yes” for Production and “No” for Planned MSS → The MERA is complete for production emissions. MSS emission must be evaluated in Step 5.
If “No” for Production → Step 6.

TCEQ – (APDG 5874v5, Revised 03/18) Modeling and Effects Review Applicability Page 9 of 20
Step 5: MSS Evaluation
Step 5A: Is the chemical species one of the following?
• Acrolein
• Acrylonitrile
• Benzene
• Bromine
• 1,3-butadiene
• Carbon disulfide
• Chlorine
• Chloroform
• Epichlorohydrin
• Fluorine
• Formaldehyde
• Hydrochloric acid (HC)
• Hydrofluoric acid (HF)
• Hydrazine
• Mercaptans
• Methyl bromide
• Methylenediphenyl diisocyanate (MDI)
• Phosgene
• Phosphine
• Styrene (odor)
• Toluene diisocyanate (TDI)
• Any chemical species with a short-term ESL < 2 µg/m3
If “Yes” → Step 6. If “No” → Step 5B.
Step 5B: Will the planned MSS emissions meet all of the following thresholds for the corresponding column as shown below?
Ground Level Concentration (µg/m3) Exceedances per Year (λ) GLCmax ≥ 1 × ESL λ ≤ 24
GLCmax ≥ 2 × ESL λ ≤ 12
GLCmax ≥ 4 × ESL λ ≤ 6
GLCmax ≥ 10 × ESL λ = 1
GLCmax > 20 × ESL λ = 0
If “Yes” → The MERA is complete for the MSS emissions. If “No” → Step 6.

TCEQ – (APDG 5874v5, Revised 03/18) Modeling and Effects Review Applicability Page 10 of 20
Step 6: Ratio Test
• Sum the emission increases from the project to obtain the total project increase, including planned MSS and production increases. Do not include any emission decreases.
• Sum the currently authorized emissions and all previously unevaluated emission from all emission points on the site, along with the new and increased emissions from the project to obtain the proposed site-wide emissions.
Step 6: Is the following inequality true?
𝐺𝐺𝐺𝐺𝐺𝐺𝑚𝑚𝑚𝑚𝑚𝑚
𝐸𝐸𝐸𝐸𝐺𝐺≤𝐸𝐸𝐸𝐸𝑃𝑃𝐸𝐸𝐸𝐸𝑆𝑆
where: GLCmax = The maximum ground level concentration for the appropriate averaging time,
in µg/m3. ESL = The effects screening level for the appropriate averaging time, in µg/m3. ERP = The project increase, in lb/hr or tpy. ERS = The proposed site-wide emissions, in lb/hr or tpy.
If “No” → Step 7. If “Yes” → Step 8. The MERA is complete.
Step 7: Site-wide Modeling.
• Conduct site-wide modeling in accordance with ADMT guidance; or
• Update site-wide modeling from a recently approved project to include the project increase and any previously unevaluated emissions; or
• Submit monitoring data per ADMT guidance and demonstrate that the monitoring data are representative of near worst-case impacts and should be used instead of site-wide modeling. Contact the permit reviewer to arrange a meeting to discuss currently available monitoring data or to receive guidance for, and approval of, a strategy to collect monitoring data.
• Site-wide modeling applies to emissions from all emission points on properties identified in single property-line designations between multiple owners.
TCEQ staff will evaluate the modeling analysis to determine if it is appropriate to proceed to Step 8.
Step 8: Documentation
• Document the MERA evaluation and provide all supporting information. The appropriate TCEQ staff will review and evaluate the impacts analysis.

TCEQ – (APDG 5874v5, Revised 03/18) Modeling and Effects Review Applicability Page 11 of 20
Appendix A: Glossary
Please note that there are often differences in term usage and term definitions between the state and federal regulatory agencies. However, when conducting a MERA evaluation with this document, please refer to the following definitions.
air contaminant—Particulate matter, radioactive materials, dust fumes, gas, mist, smoke, vapor, or odor, including any combination of those items, produced by processes other than natural (Texas Health and Safety Code (THSC) §382.003).
air dispersion model—A model of the dispersion and transport of contaminants in the atmosphere, used to estimate the ground level concentration resulting from the emission of a contaminant, as further described in the “Air Quality Modeling Guidelines” document (APDG 6232).
air pollution—The presence in the atmosphere of one or more air contaminants in such concentration and of such duration that are or tend to be injurious to or to adversely affect human health or welfare, animal life, vegetation, or property, or interfere with the normal use and enjoyment of animal life, vegetation, or property (THSC §382.003).
ambient air—The portion of the atmosphere, external to buildings, to which the general public has access (30 Texas Administrative Code (TAC) § 101.1). For purposes of the MERA, ambient air is all air outside the property line.
Air Pollutant Watch List (APWL)—A list of geographic areas for which ambient air quality monitoring data indicates persistent, elevated concentrations of toxic air contaminants. The list and its accompanying programs aim to reduce emissions of APWL contaminants by engaging stakeholders, notifying the public, and requiring additional scrutiny for air permit applications that propose increases of an APWL contaminant in an APWL area. This list was established and is maintained by the TCEQ in compliance with the Texas Health and Safety Code, Title 5, Subtitle C, Chapter 382. authorization—A mechanism to allow the release of emissions of constituents into ambient air. Typical authorizations are PBRs, SPs, and case-by-case NSR Permits.
chemical species—An individual air contaminant with a specific effects screening level. criteria pollutant—A pollutant for which a NAAQS has been defined.
Emission Point Number (EPN)—A unique identifier for a point of emission release into the ambient air.
Effects Screening Level (ESL)—Screening levels used in TCEQ’s air permitting process to evaluate the predicted impacts of air dispersion modeling. They are used to evaluate the potential for effects to occur as a result of exposure to concentrations of contaminants in the air. ESLs are based on data concerning health effects, the potential for odors to be a nuisance, and effects on vegetation. They are not ambient air standards. If predicted airborne levels of a constituent do not exceed the screening level, adverse health or welfare effects are not expected. If predicted ambient levels of constituents in air exceed the screening levels, it does not necessarily indicate a problem but rather triggers a review in more depth.
facility—A discrete or identifiable structure, device, item, equipment, or enclosure that constitutes or contains a stationary source, including appurtenances other than emission control equipment. A mine, quarry, well test, or road is not considered to be a facility (THSC §382.003 and 30 TAC §116.10).

TCEQ – (APDG 5874v5, Revised 03/18) Modeling and Effects Review Applicability Page 12 of 20
Ground Level Concentration (GLC)—The ground level concentration of a constituent in micrograms per cubic meter (µg/m3) as predicted by modeling or measured by monitoring.
GLCmax—Maximum off-property ground level concentration for the appropriate averaging time of the chemical species emitted from all emission points in the impacts evaluation, in µg/m3.
GLCni— Maximum non-industrial off-property ground level concentration for the appropriate averaging time of the chemical species emitted from all emission points in the impacts evaluation, in µg/m3.
long-term—An annual averaging period. National Ambient Air Quality Standards (NAAQS)—Levels of air quality to protect the public health and welfare (40 Code of Federal Regulations (CFR) §50.2). Primary standards are set to protect public health, including the health of “sensitive” populations such as asthmatics, children, and the elderly from the effects of “criteria air pollutants” and certain non-criteria pollutants. Secondary standards are set to protect public welfare, including protection against decreased visibility, damage to animals, crops, vegetation, and buildings.
non-industrial receptor—A receptor type such as residential, recreational, commercial, business, agricultural, or a school, hospital, day-care center, or church. In addition, receptors in un-zoned or undeveloped areas are considered non-industrial. A receptor is a location where the public could be exposed to an air constituent in the ambient air.
refined modeling—An air dispersion model with refined input parameters including hourly meteorological data, multiple facilities, and facility locations. Ground level concentrations are determined across a receptor grid and are more representative of actual concentrations than those obtained from screen modeling. screen modeling—A simple air dispersion model with limited input parameters that yields a conservative estimate of the ground level concentration for a single facility as a function of distance from the facility.
short term—A one-hour averaging period. site—The total of all stationary sources located on one or more contiguous or adjacent properties, which are under common control of the same person (or persons under common control) (30 TAC § 122.10).
site-wide modeling—Modeling (refined or screening) of emissions from all emission points and areas on a contiguous property or at a site. Site-wide modeling includes all sources authorized under 30 TAC Chapters 106 and 116. Note that de minimis emissions under 30 TAC § 116.119 are not included for site-wide modeling demonstrations.
source—A point of origin of air contaminants, whether privately or publicly owned or operated (30 TAC § 116.10).
unit impact multiplier—An EPN specific factor derived by running a dispersion model with a unit emission rate of 1.0 lb/hr or 1.0 g/sec. The unit impact multiplier can be multiplied by the emission rate to determine the ground level concentration resulting from those emissions.

TCEQ – (APDG 5874v5, Revised 03/18) Modeling and Effects Review Applicability Page 13 of 20
Appendix B: Toxicology Emissions Screening List
Emissions from the following facilities have been reviewed for health effects and are not expected to cause adverse health effects. These do not require additional review through the MERA process.
• Odor and particulate emissions from agricultural, food processing, or animal feeding or handling facilities.
• Emissions of particulates from abrasive blast cleaning provided they do not contain any of the following:
o asbestos;
o metals and metal compounds with an ESL of less than 50 µg/m3 that are in a concentration of greater than 2.0%; or
o crystalline silica at greater than or equal to 1 percent (weight) of the total particulate weight.
• Emissions of particulate matter, except for metals, metal compounds, silica, from controlled surface coating operations. Controlled surface coating operations are those that capture and abate particulate matter with a water wash or dry filter system (at least 98% removal efficiency) and vent through an elevated stack with no obstruction to vertical flow.
• Emissions of particulate matter from rock crushers, concrete batch plants and soil stabilization plants.
• Emissions from boilers, engines, or other combustion units fueled only by pipeline-quality natural gas as well as emissions from the combustion of natural gas in control devices.
• Emissions from flares, heaters, thermal oxidizers, and other combustion devices burning gases only from onshore crude oil and natural gas processing plants, with the exception of emissions from glycol dehydrators and amine units.
• Emissions of volatile organic compounds from emergency diesel engines.
• Emissions of freons that have ESLs greater than 15,000 µg/m3 from any facility.
• Emissions of the following gases, which have been classified as simple asphyxiates, from any facility.
o argon
o carbon dioxide
o ethane
o helium o hydrogen
o methane
o neon
o nitrogen
o propane
o propylene
TCEQ – (APDG 5874v5, Revised 03/18) Modeling and Effects Review Applicability Page 14 of 20
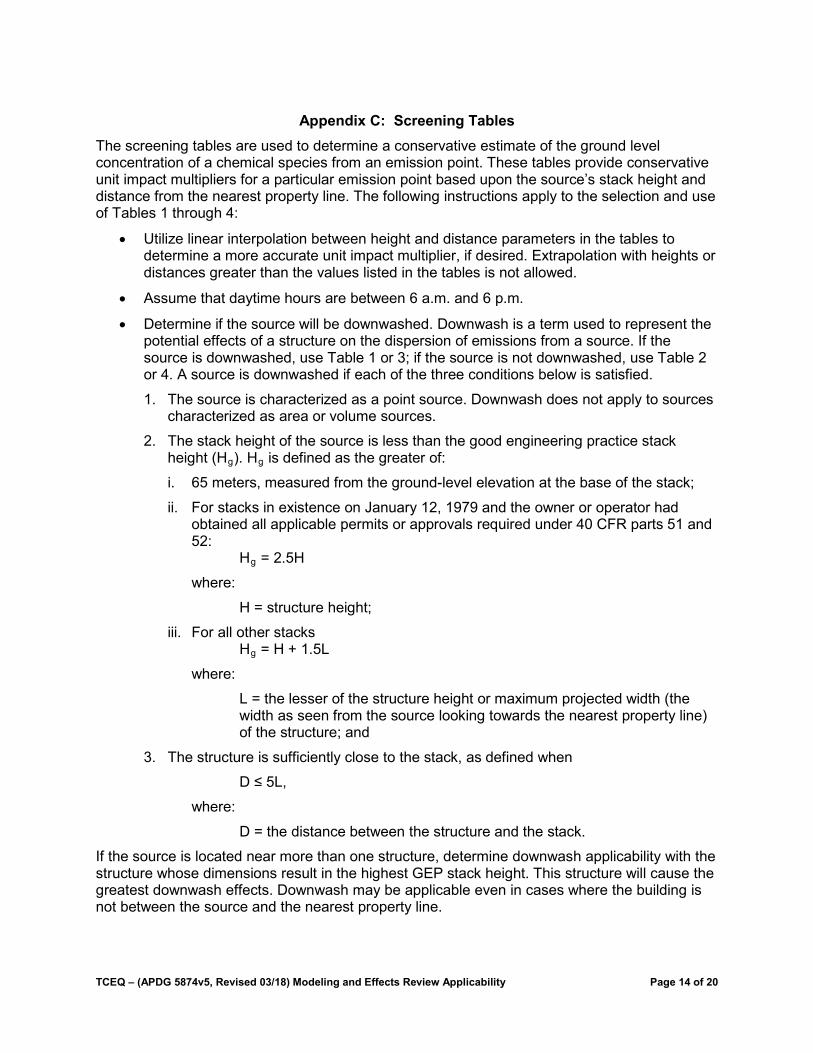
Appendix C: Screening Tables The screening tables are used to determine a conservative estimate of the ground level concentration of a chemical species from an emission point. These tables provide conservative unit impact multipliers for a particular emission point based upon the source’s stack height and distance from the nearest property line. The following instructions apply to the selection and use of Tables 1 through 4:
• Utilize linear interpolation between height and distance parameters in the tables to determine a more accurate unit impact multiplier, if desired. Extrapolation with heights or distances greater than the values listed in the tables is not allowed.
• Assume that daytime hours are between 6 a.m. and 6 p.m.
• Determine if the source will be downwashed. Downwash is a term used to represent the potential effects of a structure on the dispersion of emissions from a source. If the source is downwashed, use Table 1 or 3; if the source is not downwashed, use Table 2 or 4. A source is downwashed if each of the three conditions below is satisfied.
1. The source is characterized as a point source. Downwash does not apply to sources characterized as area or volume sources.
2. The stack height of the source is less than the good engineering practice stack height (Hg). Hg is defined as the greater of:
i. 65 meters, measured from the ground-level elevation at the base of the stack;
ii. For stacks in existence on January 12, 1979 and the owner or operator had obtained all applicable permits or approvals required under 40 CFR parts 51 and 52:
Hg = 2.5H
where:
H = structure height;
iii. For all other stacks Hg = H + 1.5L
where:
L = the lesser of the structure height or maximum projected width (the width as seen from the source looking towards the nearest property line) of the structure; and
3. The structure is sufficiently close to the stack, as defined when
D ≤ 5L,
where:
D = the distance between the structure and the stack.
If the source is located near more than one structure, determine downwash applicability with the structure whose dimensions result in the highest GEP stack height. This structure will cause the greatest downwash effects. Downwash may be applicable even in cases where the building is not between the source and the nearest property line.

TCEQ – (APDG 5874v5, Revised 03/18) Modeling and Effects Review Applicability Page 15 of 20
Table 1. Downwash for All Hours (µg/m3 per 1 lb/hr)
Distance from the Property
Line (feet)
Stack Height (feet)
3 10 20 30 40 50 60 70 80 90 100 110 120 130 140 150 160 170 180 190 200 50 2965 2363 2260 1005 596 362 251 185 141 112 90 75 63 54 46 40 35 31 28 25 23 100 2024 1719 1003 708 596 362 251 185 141 112 90 75 63 54 46 40 35 31 28 25 23 150 1338 1195 822 708 596 342 251 185 141 112 90 75 63 54 46 40 35 31 28 25 23 200 950 873 708 708 559 342 218 185 141 112 90 75 63 54 46 40 35 31 28 25 23 250 800 743 617 617 512 321 213 149 112 112 90 75 63 54 46 40 35 31 28 25 23 300 720 670 550 550 454 300 205 145 107 80 75 75 63 54 46 40 35 31 28 25 23 400 593 557 460 460 354 246 184 133 100 77 61 48 46 46 46 40 35 31 28 25 23 500 502 473 397 397 292 203 151 118 92 72 58 47 38 32 31 31 31 31 28 25 23 600 430 408 350 350 248 173 129 101 81 67 54 44 37 31 26 22 19 17 14 13 11 700 373 357 313 313 216 151 112 88 71 59 50 41 35 29 25 22 19 16 14 13 11 800 330 315 282 282 192 134 100 78 63 52 44 38 33 28 24 21 18 16 14 12 11 900 293 280 255 255 173 121 90 70 57 47 40 34 30 26 23 20 17 15 14 12 11
1000 262 252 233 233 157 110 82 64 52 43 36 31 27 24 21 19 17 15 13 12 11 1500 172 167 157 157 107 77 58 45 36 30 25 22 19 17 15 12 12 11 9.9 9.3 8.7 2000 122 120 117 117 80 58 44 35 28 23 20 17 15 13 11 10 9.2 8.4 7.8 7.3 6.8 2500 93 92 90 90 64 47 36 28 23 19 16 14 12 11 9.4 8.4 7.6 6.9 6.4 6 5.6 3000 75 73 72 72 52 39 30 24 20 16 14 12 10 9 8 7.1 6.4 5.8 5.5 5.1 4.8 4000 50 50 50 50 37 29 23 18 15 13 11 9.1 7.9 7 6.2 5.5 5 4.5 4.2 4 3.7 5000 37 37 37 37 29 23 18 15 12 10 8.7 7.5 6.5 5.7 5.1 4.5 4.1 3.7 3.4 3.2 3

TCEQ – (APDG 5874v5, Revised 03/18) Modeling and Effects Review Applicability Page 16 of 20
Table 2. No Downwash for All Hours (µg/m3 per 1 lb/hr)
Distance from the Property
Line (feet)
Stack Height (feet)
3 10 20 30 40 50 60 70 80 90 100 110 120 130 140 150 160 170 180 190 200 50 23773 2787 725 323 175 107 72 51 38 30 24 19 16 13 11 9.8 8.5 7.5 6.6 5.9 5.2 100 19785 2233 697 323 175 107 72 51 38 30 24 19 16 13 11 9.8 8.5 7.5 6.6 5.9 5.2 150 12608 1942 550 310 175 107 72 51 38 30 24 19 16 13 11 9.8 8.5 7.5 6.6 5.9 5.2 200 8458 1942 482 275 166 107 72 51 38 30 24 19 16 13 11 9.8 8.5 7.5 6.6 5.9 5.2 250 6040 1837 482 243 155 100 72 51 38 30 24 19 16 13 11 9.8 8.5 7.5 6.6 5.9 5.2 300 4531 1837 453 243 132 96 67 48 38 30 24 19 16 13 11 9.8 8.5 7.5 6.6 5.9 5.2 400 2838 1613 448 203 128 76 60 46 35 30 24 19 16 13 11 9.8 8.8 7.5 6.6 5.9 5.2 500 1958 1322 422 195 114 76 49 40 33 27 21 17 16 13 11 9.8 8.5 7.5 6.6 5.9 5.2 600 1440 1075 417 188 105 70 49 36 28 24 20 17 14 12 11 9.8 8.5 7.5 6.6 5.9 5.2 700 1110 885 417 188 105 64 48 36 27 21 18 16 14 12 9.9 8.7 7.9 7.5 6.6 5.9 5.2 800 888 738 402 180 100 64 44 36 27 21 17 14 13 11 9.8 8.5 7.4 6.6 6.1 5.6 5.2 900 728 625 377 170 95 64 43 33 27 21 17 14 12 10 9.3 8.3 7.3 6.5 5.7 5.2 4.8
1000 610 535 348 170 95 62 43 30 25 21 17 14 11 9.7 8.6 7.8 7 6.3 5.7 5 4.6 1500 308 287 228 157 83 52 36 29 22 17 17 14 11 9.6 8.3 7.1 6.1 5.5 5 4.6 4.2 2000 188 182 157 123 79 45 32 23 20 16 13 11 8.9 8.2 7.4 6.8 6.1 5.5 4.9 4.4 3.9 2500 130 127 113 97 68 44 27 21 16 14 12 10 8.8 7.3 6.2 5.7 5.3 4.9 4.6 4.2 3.9 3000 98 95 88 77 57 40 27 19 15 12 11 10 8.3 7.2 6.2 5.3 4.4 4.2 3.9 3.7 3.5 4000 62 62 58 53 42 31 23 17 12 10 8.4 7.4 6.7 6.1 5.5 4.9 4.4 3.8 3.4 2.9 2.6 5000 45 43 42 38 32 25 19 15 11 8.3 7.2 6.2 5.4 5 4.6 4.2 3.8 3.5 3.2 2.8 2.6

TCEQ – (APDG 5874v5, Revised 03/18) Modeling and Effects Review Applicability Page 17 of 20
Table 3. Downwash for Daytime (µg/m3 per 1 lb/hr)
Distance from the Property
Line (feet)
Stack Height (feet)
3 10 20 30 40 50 60 70 80 90 100 110 120 130 140 150 160 170 180 190 200 50 2965 2363 2260 1005 565 362 251 185 141 112 90 75 63 54 46 40 35 31 28 25 23 100 2024 1719 1003 565 565 362 251 185 141 112 90 75 63 54 46 40 35 31 28 25 23 150 1338 1195 822 353 320 251 251 185 141 112 90 75 63 54 46 40 35 31 28 25 23 200 950 873 665 352 300 201 185 185 141 112 90 75 63 54 46 40 35 31 28 25 23 250 700 655 532 335 275 189 135 112 112 112 90 75 63 54 46 40 35 31 28 25 23 300 563 532 437 312 247 176 129 97 76 75 75 75 63 54 46 40 35 31 28 25 23 400 392 373 322 263 195 147 116 90 71 57 48 46 46 46 46 40 35 31 28 25 23 500 290 280 247 220 160 122 97 80 65 54 45 38 32 31 31 31 31 31 28 25 23 600 225 218 197 183 134 104 84 69 58 50 42 36 31 27 23 20 18 16 14 13 11 700 185 180 165 155 115 91 73 61 52 44 39 33 29 25 22 20 17 16 14 13 11 800 152 148 138 133 100 80 65 54 46 40 35 31 28 24 21 19 17 15 14 12 11 900 128 125 117 117 88 71 58 49 42 36 32 28 25 23 20 18 16 15 13 12 11
1000 110 108 102 102 77 63 53 44 38 33 29 26 23 21 19 17 16 14 13 12 11 1500 58 58 57 57 47 40 34 30 26 23 20 18 16 15 14 12 11 11 9.9 9.3 8.7 2000 37 37 37 37 31 27 24 21 19 17 15 14 13 12 11 9.7 9 8.3 7.8 7.3 6.8 2500 27 27 27 27 23 20 19 17 15 14 12 11 10 9.4 8.6 8 7.4 6.9 6.4 6 5.6 3000 20 20 20 20 18 16 15 14 12 11 10 9.3 8.6 7.9 7.3 6.7 6.3 5.8 5.5 5.1 4.8 4000 13 13 13 13 12 11 10 9.4 8.7 8 7.4 6.8 6.3 5.9 5.5 5.1 4.8 4.5 4.2 4 3.7 5000 9.3 9.3 9.3 9.3 8.6 8 7.5 7 6.5 6.1 5.7 5.3 4.9 4.6 4.3 4.1 3.8 3.6 3.4 3.2 3

TCEQ – (APDG 5874v5, Revised 03/18) Modeling and Effects Review Applicability Page 18 of 20
Table 4. No Downwash for Daytime (µg/m3 per 1 lb/hr)
Distance from the Property
Line (feet)
Stack Height (feet)
3 10 20 30 40 50 60 70 80 90 100 110 120 130 140 150 160 170 180 190 200 50 18738 2787 725 323 175 107 72 51 38 30 24 19 16 13 11 9.8 8.5 7.5 6.6 5.9 5.2 100 7657 1902 697 323 175 107 72 51 38 30 24 19 16 13 11 9.8 8.5 7.5 6.6 5.9 5.2 150 3983 1542 550 310 175 107 72 51 38 30 24 19 16 13 11 9.8 8.5 7.5 6.6 5.9 5.2 200 2445 1542 478 275 166 107 72 51 38 30 24 19 16 13 11 9.8 8.5 7.5 6.6 5.9 5.2 250 1662 1215 453 217 155 100 72 51 38 30 24 19 16 13 11 9.8 8.5 7.5 6.6 5.9 5.2 300 1207 962 453 212 132 96 67 48 38 30 24 19 16 13 11 9.8 8.5 7.5 6.6 5.9 5.2 400 727 633 402 195 116 75 60 46 35 30 24 19 16 13 11 9.8 8.5 7.5 6.6 5.9 5.2 500 488 445 327 195 105 73 49 40 33 27 21 17 16 13 11 9.8 8.5 7.5 6.6 5.9 5.2 600 353 330 263 182 105 68 49 36 28 24 20 17 14 12 11 9.8 8.5 7.5 6.6 5.9 5.2 700 268 255 215 162 105 64 48 36 27 21 18 16 14 12 9.9 8.7 7.9 7.5 6.6 5.9 5.2 800 212 203 177 142 100 64 44 36 27 21 17 14 13 11 9.8 8.5 7.4 6.6 6.1 5.6 5.2 900 172 167 148 123 92 64 43 33 27 21 17 14 12 10 9.3 8.3 7.3 6.5 5.7 5.2 4.8
1000 142 138 127 108 84 62 43 30 25 21 17 14 11 9.7 8.6 7.8 7.0 6.3 5.7 5.0 4.6 1500 70 70 67 62 53 45 36 29 22 17 17 14 11 9.6 8.3 7.1 6.1 5.5 5.0 4.6 4.2 2000 43 43 42 40 36 31 27 23 20 16 13 11 8.9 8.2 7.4 6.8 6.1 5.5 4.9 4.4 3.9 2500 30 28 28 28 25 23 21 19 16 14 12 10 8.8 7.3 6.2 5.7 5.3 4.9 4.6 4.2 3.9 3000 22 22 22 20 19 18 16 15 13 12 11 10 8.3 7.2 6.2 5.3 4.4 4.2 3.9 3.7 3.5 4000 14 14 13 13 12 12 11 10 9.4 8.7 8.0 7.4 6.7 6.1 5.5 4.9 4.4 3.8 3.4 2.9 2.6 5000 9.5 9.5 9.3 9.3 8.9 8.4 7.9 7.5 7.1 6.6 6.2 5.8 5.4 5.0 4.6 4.2 3.8 3.5 3.2 2.8 2.6
TCEQ – (APDG 5874v5, Revised 03/18) Modeling and Effects Review Applicability Page 19 of 20
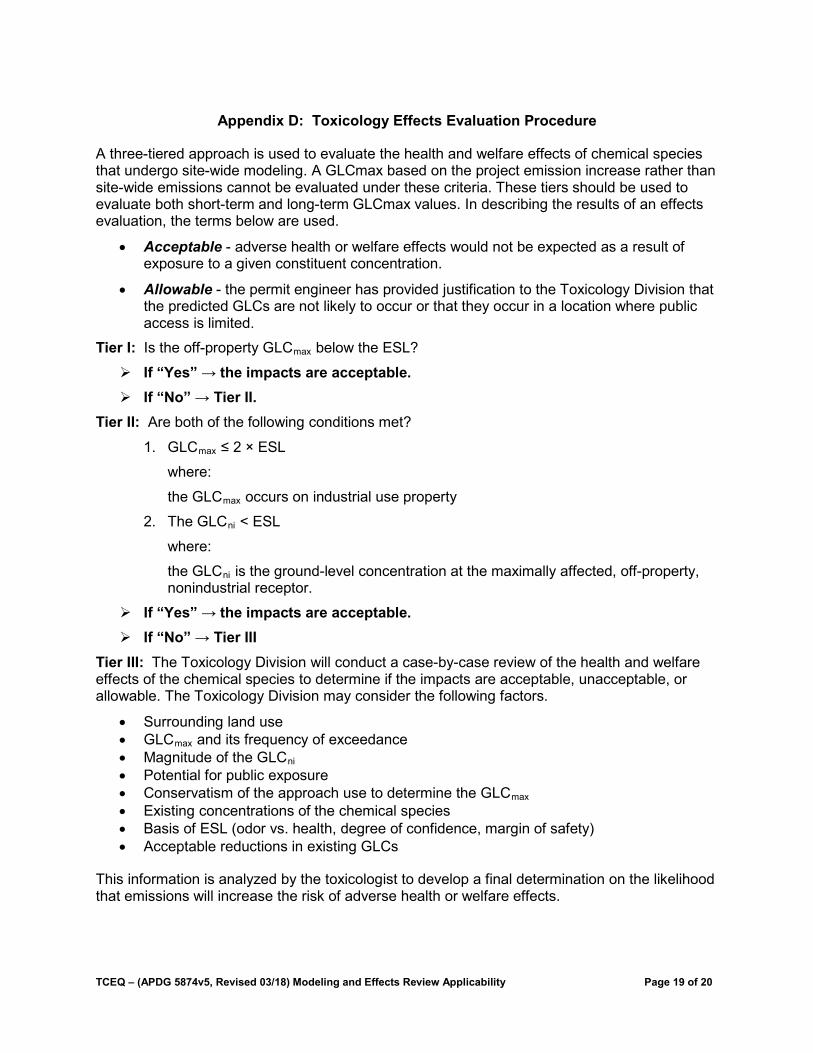
Appendix D: Toxicology Effects Evaluation Procedure
A three-tiered approach is used to evaluate the health and welfare effects of chemical species that undergo site-wide modeling. A GLCmax based on the project emission increase rather than site-wide emissions cannot be evaluated under these criteria. These tiers should be used to evaluate both short-term and long-term GLCmax values. In describing the results of an effects evaluation, the terms below are used.
• Acceptable - adverse health or welfare effects would not be expected as a result of exposure to a given constituent concentration.
• Allowable - the permit engineer has provided justification to the Toxicology Division that the predicted GLCs are not likely to occur or that they occur in a location where public access is limited.
Tier I: Is the off-property GLCmax below the ESL?
If “Yes” → the impacts are acceptable. If “No” → Tier II.
Tier II: Are both of the following conditions met?
1. GLCmax ≤ 2 × ESL
where:
the GLCmax occurs on industrial use property
2. The GLCni < ESL
where:
the GLCni is the ground-level concentration at the maximally affected, off-property, nonindustrial receptor.
If “Yes” → the impacts are acceptable. If “No” → Tier III
Tier III: The Toxicology Division will conduct a case-by-case review of the health and welfare effects of the chemical species to determine if the impacts are acceptable, unacceptable, or allowable. The Toxicology Division may consider the following factors.
• Surrounding land use • GLCmax and its frequency of exceedance • Magnitude of the GLCni • Potential for public exposure • Conservatism of the approach use to determine the GLCmax • Existing concentrations of the chemical species • Basis of ESL (odor vs. health, degree of confidence, margin of safety) • Acceptable reductions in existing GLCs
This information is analyzed by the toxicologist to develop a final determination on the likelihood that emissions will increase the risk of adverse health or welfare effects.

TCEQ – (APDG 5874v5, Revised 03/18) Modeling and Effects Review Applicability Page 20 of 20
Appendix E: MERA Flowchart
2LT ESL > 10% of ST ESL?
ANDST emis ≤ de minimis
levels?
StartStep 0
Applicability & Procedures
3GLCmax ≤ 10% ESL?
No
5AChemical species
on list?
5BMSS GLCmax & λ ≤
Thresholds?
No
6Meet Ratio
Test?
No
Step 4
EndStep 8
Documentation
Yes
Yes
Results reviewed by TCEQ Staff
4Prod GLCmax ≤ Thresholds?
4MSS GLCmax ≤ Thresholds?
Yes
No
Yes
If results are allowableor acceptable
No
No
Yes
NoYes
1Net emis ≤ 0?
No
Yes
Yes
Key emis: emissions incr: increase LT: long-term prod: production ST: short-term
This flowchart is a summary of the MERA and is not intended to be a substitute for this guidance.
7Site-wide Modeling