Supplementary Materials for -...
21
Originally posted 17 September 2015; revised 25 September 2015 www.sciencemag.org/content/349/6254/1351/suppl/DC1 Supplementary Materials for RNA-Seq of single prostate CTCs implicates noncanonical Wnt signaling in antiandrogen resistance David T. Miyamoto, Yu Zheng, Ben S. Wittner, Richard J. Lee, Huili Zhu, Katherine T. Broderick, Rushil Desai, Douglas B. Fox, Brian W. Brannigan, Julie Trautwein, Kshitij S. Arora, Niyati Desai, Douglas M. Dahl, Lecia V. Sequist, Matthew R. Smith, Ravi Kapur, Chin-Lee Wu, Toshi Shioda, Sridhar Ramaswamy, David T. Ting, Mehmet Toner, Shyamala Maheswaran,* Daniel A. Haber* *Corresponding author. E-mail: [email protected] (D.H.); [email protected] (S.M.) Published 18 September 2015, Science 349, 1351 (2015) DOI: 10.1126/science.aab0917 This PDF file includes Materials and Methods Figs. S1 to S8 Tables S1 and S2 References Other Supplementary Material for this manuscript includes the following: (available at www.sciencemag.org/content/349/6254/1351/suppl/DC1) Table S3. Genes differentially expressed between CTCs and primary prostate tumors. Table S4. Data sets used in the differential gene expression and pathway analyses comparing metastatic and primary prostate tumors (see Figs. 2C and S5). Table S5. Androgen receptor mutation analysis in prostate CTCs, primary tumors, and prostate cancer cell lines. Table S6. Androgen receptor splice variant analysis in prostate CTCs and primary tumors. Table S7. Pathway signatures used for metagene analyses in this study (see Fig. 3A). Correction (25 September 2015): References were renumbered after the file was posted. The renumbering affected the supplementary reference citations, the list of references, and Table S7. The originally posted version can be seen here.
-
Upload
nguyenhuong -
Category
Documents
-
view
232 -
download
0
Transcript of Supplementary Materials for -...

Originally posted 17 September 2015; revised 25 September 2015
www.sciencemag.org/content/349/6254/1351/suppl/DC1
Supplementary Materials for
RNA-Seq of single prostate CTCs implicates noncanonical Wnt signaling in antiandrogen resistance
David T. Miyamoto, Yu Zheng, Ben S. Wittner, Richard J. Lee, Huili Zhu, Katherine T.
Broderick, Rushil Desai, Douglas B. Fox, Brian W. Brannigan, Julie Trautwein, Kshitij S. Arora, Niyati Desai, Douglas M. Dahl, Lecia V. Sequist, Matthew R. Smith, Ravi Kapur,
Chin-Lee Wu, Toshi Shioda, Sridhar Ramaswamy, David T. Ting, Mehmet Toner, Shyamala Maheswaran,* Daniel A. Haber*
*Corresponding author. E-mail: [email protected] (D.H.); [email protected] (S.M.)
Published 18 September 2015, Science 349, 1351 (2015) DOI: 10.1126/science.aab0917
This PDF file includes
Materials and Methods Figs. S1 to S8 Tables S1 and S2 References
Other Supplementary Material for this manuscript includes the following: (available at www.sciencemag.org/content/349/6254/1351/suppl/DC1)
Table S3. Genes differentially expressed between CTCs and primary prostate tumors.
Table S4. Data sets used in the differential gene expression and pathway analyses comparing metastatic and primary prostate tumors (see Figs. 2C and S5).
Table S5. Androgen receptor mutation analysis in prostate CTCs, primary tumors, and prostate cancer cell lines.
Table S6. Androgen receptor splice variant analysis in prostate CTCs and primary tumors.
Table S7. Pathway signatures used for metagene analyses in this study (see Fig. 3A).
Correction (25 September 2015): References were renumbered after the file was posted. The renumbering affected the supplementary reference citations, the list of references, and Table S7. The originally posted version can be seen here.
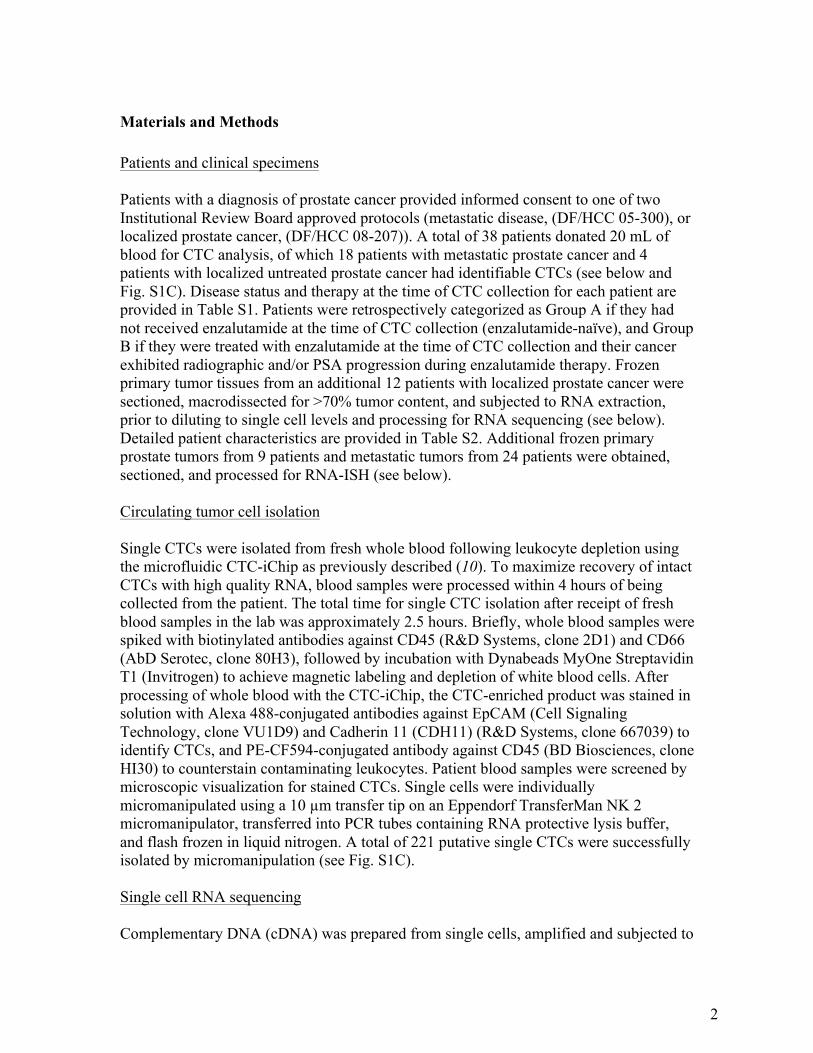
Materials and Methods Patients and clinical specimens Patients with a diagnosis of prostate cancer provided informed consent to one of two Institutional Review Board approved protocols (metastatic disease, (DF/HCC 05-300), or localized prostate cancer, (DF/HCC 08-207)). A total of 38 patients donated 20 mL of blood for CTC analysis, of which 18 patients with metastatic prostate cancer and 4 patients with localized untreated prostate cancer had identifiable CTCs (see below and Fig. S1C). Disease status and therapy at the time of CTC collection for each patient are provided in Table S1. Patients were retrospectively categorized as Group A if they had not received enzalutamide at the time of CTC collection (enzalutamide-naïve), and Group B if they were treated with enzalutamide at the time of CTC collection and their cancer exhibited radiographic and/or PSA progression during enzalutamide therapy. Frozen primary tumor tissues from an additional 12 patients with localized prostate cancer were sectioned, macrodissected for >70% tumor content, and subjected to RNA extraction, prior to diluting to single cell levels and processing for RNA sequencing (see below). Detailed patient characteristics are provided in Table S2. Additional frozen primary prostate tumors from 9 patients and metastatic tumors from 24 patients were obtained, sectioned, and processed for RNA-ISH (see below). Circulating tumor cell isolation Single CTCs were isolated from fresh whole blood following leukocyte depletion using the microfluidic CTC-iChip as previously described (10). To maximize recovery of intact CTCs with high quality RNA, blood samples were processed within 4 hours of being collected from the patient. The total time for single CTC isolation after receipt of fresh blood samples in the lab was approximately 2.5 hours. Briefly, whole blood samples were spiked with biotinylated antibodies against CD45 (R&D Systems, clone 2D1) and CD66 (AbD Serotec, clone 80H3), followed by incubation with Dynabeads MyOne Streptavidin T1 (Invitrogen) to achieve magnetic labeling and depletion of white blood cells. After processing of whole blood with the CTC-iChip, the CTC-enriched product was stained in solution with Alexa 488-conjugated antibodies against EpCAM (Cell Signaling Technology, clone VU1D9) and Cadherin 11 (CDH11) (R&D Systems, clone 667039) to identify CTCs, and PE-CF594-conjugated antibody against CD45 (BD Biosciences, clone HI30) to counterstain contaminating leukocytes. Patient blood samples were screened by microscopic visualization for stained CTCs. Single cells were individually micromanipulated using a 10 µm transfer tip on an Eppendorf TransferMan NK 2 micromanipulator, transferred into PCR tubes containing RNA protective lysis buffer, and flash frozen in liquid nitrogen. A total of 221 putative single CTCs were successfully isolated by micromanipulation (see Fig. S1C). Single cell RNA sequencing Complementary DNA (cDNA) was prepared from single cells, amplified and subjected to
2

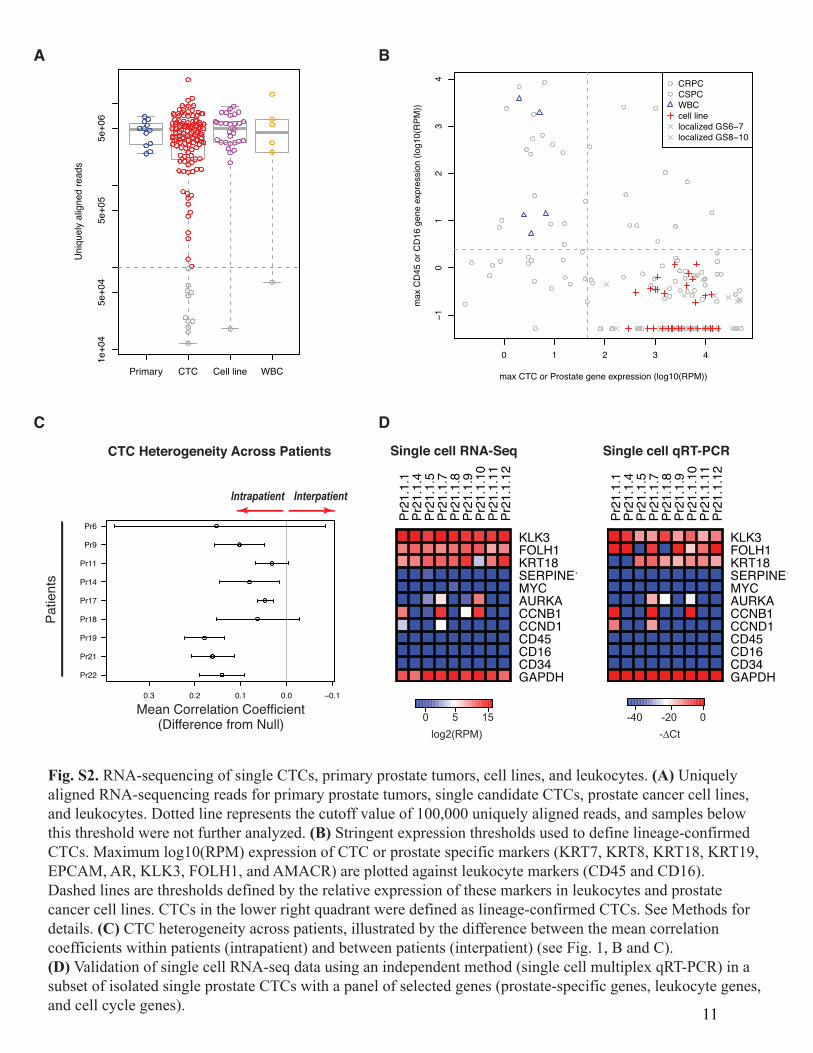
library construction for transcriptome analysis using the ABI SOLiD platform, following published protocols (31), with slight modifications as previously described (9). Only cells passing quality control qPCR for GAPDH and beta-actin were subjected to library construction, followed by sequencing on the ABI 5500XL. RNA sequencing and digital gene expression profiling yielded an average of 4 to 5 million uniquely aligned reads per sample (Fig. S2A). Of the 133 single prostate CTCs that were successfully subjected to next generation RNA sequencing, 122 (92%) had greater than 100,000 aligned reads (Fig. S2A). Bioinformatic analyses RNA sequences from single cells, patient-derived leukocytes, and primary tumor samples were aligned to the known human transcriptome (hg19) using TopHat (33). Determination of Reads-Per-Million (RPM) and log10(RPM) were performed as previously described (8). The reads from dbGaP dataset phs000443.v1.p1 (34) were processed the same way with the exception that, since these samples were run on an Illumina GAII rather than a SOLiD sequencer, we first subjected the reads to the program trimmomatic’s ILLUMINACLIP TruSeq2-SE.fa function to remove the adapter and other Illumina-specific sequences from the read. Unsupervised clustering analysis was performed using agglomerative hierarchical clustering with average linkage (Fig. 1A). For independent validation of the quality of our single cell RNA-seq data, we confirmed the expression of a panel of genes in a subset of isolated single prostate CTCs using an independent methodology, single cell multiplex qRT-PCR (Fluidigm Biomark), as previously described (10) (Fig. S2D). In addition, we compared a list of genes that were highly upregulated in primary tumors in our RNA-seq data set with the expression profiles of these same genes in a previously published RNA-seq data set that included primary and metastatic prostate tumors (dbGaP dataset phs000443.v1.p1) (34) (Fig. S3). This analysis showed that genes that were highly expressed in primary tumors compared to CTCs in our data set were also highly expressed in primary tumors compared to metastases in the previously published data set. Thresholding to select lineage-confirmed CTCs Stringent expression thresholds were used to define lineage-confirmed CTCs, in order to exclude specimens containing contaminating leukocytes and ensure analysis of bonafide prostate CTCs (Fig. S2B). For each specimen we let its y-value be the maximum of its log10(RPM) for CD45 and CD16 (leukocyte markers) and let its x-value be the maximum of its log10(RPM) for KRT7, KRT8, KRT18, KRT19, EPCAM, AR, KLK3 (PSA), FOLH1 (PSMA) and AMACR (prostate-specific and epithelial markers). We defined an x-threshold as the midpoint between the maximum x-value of the white blood cells and the minimum x-value of the prostate cell lines. We defined a y-threshold as the midpoint between the minimum y-value of the white blood cells and the maximum y-value of the prostate cancer cell lines. We designated a candidate CTC as lineage-confirmed if its x-value was greater than the x-threshold and its y-value was less than the y-threshold.
3

Heterogeneity To compare heterogeneity within and between subsets of specimens, we used means of correlation coefficients and jackknife estimates as follows. Determine the 2000 genes with the highest variance in log10(RPM) values across all specimens. Let iv denote the log10(RPM) values for those 2000 genes for the ith specimen and let ),( jic denote the Pearson correlation coefficient between iv and jv . Given T , a subset of the set of pairs of specimens, we let
))),((atanh(mean),(
jicMTjiT∈
= .
Let Ts be the jackknife estimator of the standard deviation of TM , where the jackknife is with respect to specimens (not pairs of specimens). We then call )tanh( TM the “mean correlation coefficient” and define its 95% confidence interval to be
))975.0(tanh( 1−Φ± TT sM , where Φ is the cumulative distribution function of the standard normal distribution. Given two subsets of the set of pairs of specimens, T and U , to compute a p-value for the null hypothesis that the mean of TM is the same as the mean of UM , we let
( )( )22/12 UTUT ssMMp +−Φ−= . To consider whether there’s a significant difference between the heterogeneity in cell lines and CTCs, we let T be ),( ji such that ji > and specimens i and j are cells from the same cell line and let U be ),( ji such that ji > and specimens i and j are CTCs from the same patient. To consider whether there’s a significant difference between the within-patient heterogeneity and the between-patient heterogeneity, we let T be ),( ji such that ji > and specimens i and j are CTCs from the same patient and we let U be
),( ji such that ji > and specimens i and j are CTCs from different patients. Differential gene expression Supervised differential gene expression was performed for the datasets shown in Fig. S5 and Table S4. For each RNA-seq dataset, we first filtered out genes for which the 0.9 quantile of RPM values was less than 10. For each microarray dataset, we first filtered out genes for which the 0.9 quantile of unlogged expression units per million was less than 10. A t-test assuming equal variance in the two classes was then performed for each gene on the log10(RPM) values for the RNA-seq datasets and on the GEO-provided expression values for the microarray datasets. The resulting p-values were used to create False Discover Rate (FDR) estimates by the Benjamini-Hochberg (BH) method. A gene was considered differentially expressed if its FDR estimate was less than 0.1 and its fold-change was greater than 2. Gene set enrichment Enrichment of signaling pathways in the differentially expressed genes was determined by performing a hypergeometric test for gene sets in the Pathway Interaction Database (PID) (15). When considering multiple gene sets, the resulting p-values were used to estimate FDR by BH. When determining pathways differentially expressed in CTCs versus primary tumors but not in metastatic tumors (Fig. 2C and 2D), to be conservative
4

in pathways we identified as uniquely enriched in CTCs, we used an FDR threshold of 0.1 for the CTC versus primary tumors comparison and 0.25 for the metastatic versus primary tumors comparisons. GSEA version gsea2-2.0.14 was run first on the PID gene sets from version 4.0 of MSigDB (35) to generate hypotheses (Fig. 3B, upper panel) and later on specific gene sets to test hypotheses (Fig. 3B, lower panels and Fig. 4D). For right panels of Fig. 4D, we considered samples in GEO GSE52169 to be resistant and GR-high if their title began with “Res - top 50th percentile of GR expressers” or “Res - top 75th percentile of GR expressers.” Those whose title began with “Res - Low GR” we considered to be resistant and GR-low. Androgen receptor (AR) splice variants To look for evidence of the AR splice variants discussed in Egan et al. (1), we consulted Lu and Luo (17) for genomic locations of the cryptic exons. We then added the splice variants found in Figure 3 of Egan et al. (1) to the transcriptome we had used for aligning and re-aligned. We then submitted the resulting new alignments to cufflinks (33) to quantify the different AR splice variants. We found that the 3’-biased nature of our reads caused cufflinks to output very wrong interpretations since cufflinks interprets a lack of reads in a location as evidence against any splice variant that should have reads at that location. So, we decided to only look for positive evidence of AR splice variants. We counted reads spanning exons 4 and 8 or spanning exons 8 and 9 (see Figure 1 of Lu and Luo (17) as evidence of ARv567es (AR-V12). We normalized these counts by the total number of reads that spanned exons in that specimen. We counted reads aligning to cryptic exon CE3 to be evidence of AR-V7 and reads aligning to cryptic exons CE4 or CE1 to be evidence of AR-V1, AR-V3 or AR-V4. These counts of alignments to cryptic exons were normalized by the total number of aligned reads for that specimen. KLK3 splice variants To look for evidence of KLK3 splice variants we added the splice variants found in Figure 6 of Kurlender et al. (23) to the transcriptome we had used for aligning and then re-aligned. We counted reads overlapping the introns in that figure as evidence of the splice variants that contain sequence from those introns as indicated in the figure (after noting that the second variant labeled NA in the figure has since been named NM_001030047 and the third variant labeled NA in the figure has since been named NM_001030048). These counts of alignments to introns were normalized by the total number of uniquely aligned reads for that specimen. AR mutations To look in our single-cell RNA sequencing data for evidence of known prostate-related mutations in the AR, we downloaded the Androgen Receptor Gene Mutations Database (16) as available at http://androgendb.mcgill.ca on June 12, 2014. We filtered the database as follows. We kept only those entries with the word “Prostate” in the “Phenotype” column. We knew that our alignment had yielded no insertions or deletions in the AR, so we kept only those entries for which the “Mutation type” column was “Substitut.”. We then kept only those entries for which the “To nucleotide” column was
5
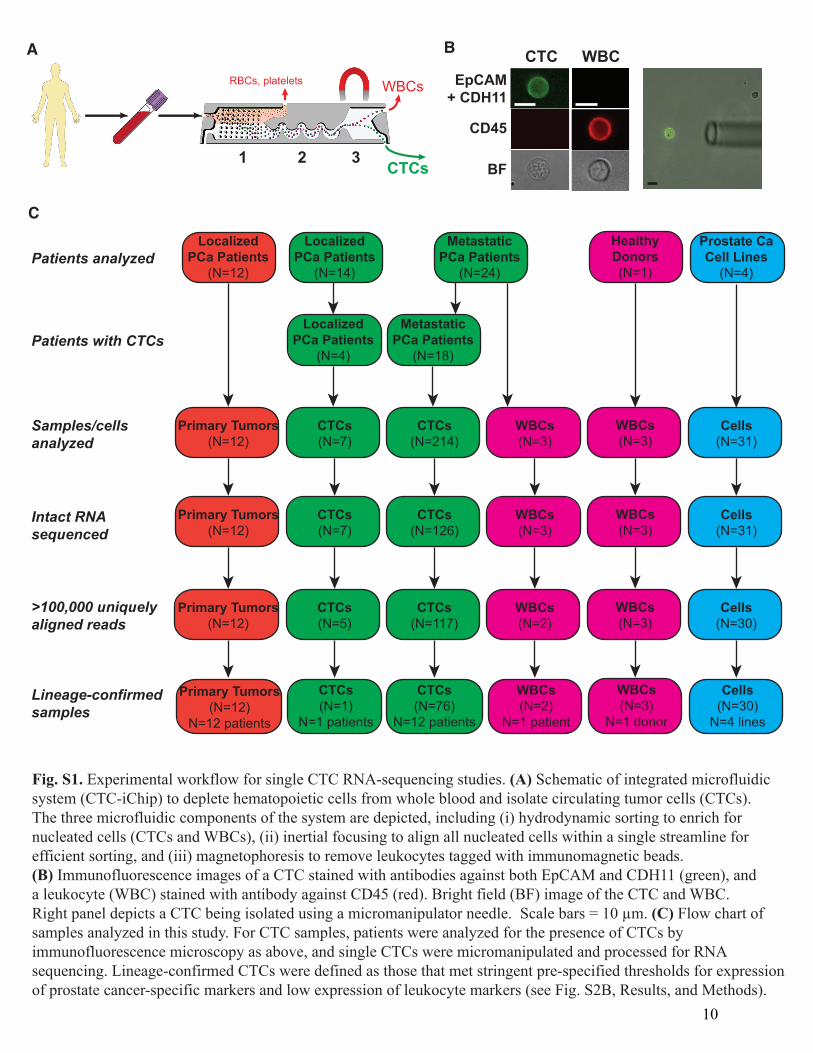
“>A”, “>C”, “>G”, or “>T” and for which the “nucleotide position” field was present. We also fixed the record with accession number 568 to have “nucleotide position” equal to 2688 and “From nucleotide” set to “2688G”. We then removed records that had the same “nucleotide position” as previous records. Finally, we added the F876L mutation (19, 20) (which in NM_000044.2 (the version of AR used in the database) is at amino acid 877 and is a T -> C substitution at nucleotide 3744). For each mutation in the database and each single-cell specimen, we counted how many reads aligned to the position, how many were wild-type, and how many were the “To nucleotide” from the database. In order to determine which mutations were statistically significant, we needed an estimate of the error rate of our sequencing procedure. Since the AR is on the X chromosome and we are only considering single cells, we expected the reads at a particular location to be almost all wild-type or almost all not wild-type. Indeed, we found this to be the case. Only two location/specimen pairs had a percentage of wild-type reads between 10% and 85%. The 3068 other location/specimen pairs had a percentage of wild-type reads less than 10% or greater then 85%. We assumed, therefore, that the location/specimen pairs with percentage of wild-type reads greater than 85% were, in fact, wild-type and that any non-wild-type read was an error. This gave us an error rate estimate of 0.0012. For each location/specimen pair, we then did a one-sided binomial test with alternative hypothesis being that the probability of getting the substitution listed in the database is greater than 0.0012. We adjusted all the resulting p-values for multiple hypothesis testing using the Holms method. We concluded there was a mutation at those location/specimen pairs for which the adjusted p-value was less than 0.05 and the percentage of reads that matched the mutation in the database was greater than 90%. Metagene computation If we let mxxx ,,, 21 … be the log10(RPM) values of the UP genes of a signature and let
nyyy ,,, 21 … be the log10(RPM) values of the DOWN genes of that signature, we define the metagene to be )/()( 2121 nmyyyxxx nm +−−−−+++ …… . The UP and DOWN genes of the signatures for which we computed metagenes are given in Table S7. P-values for Group A vs. Group B The “CTC” p-values were computed by a two-sided t-test with Welch approximation to the degrees of freedom applied to the log10(RPM) values of Group A specimens versus those of Group B specimens. The “patient” p-values were determined by fitting the mixed effects model
jiiiji bIe ,10, εββ +++= , where jie , is the log10(RPM) value of the jth specimen from the ith patient, iI is 0 if the
ith patient is in Group A and 1 otherwise, ),0(~ 2bi Nb σ and ),0(~ 2
, σε Nji . The “patient” p-value was defined as the two-sided p-value for the null hypothesis 01 =β as determined by the lme function of the R package nlme.
6

P-values for KLK3 splice variants in primary tumors vs. CTCs For each sample, we summed the counts described in the “KLK3 splice variants” paragraph above and then normalized the sum by the total number of uniquely aligned reads. “CTC” p-values and “patient” p-values were then computed as in the “P-values for Group A vs. Group B” paragraph above. RNA In-Situ Hybridization (RNA-ISH) RNA-ISH in prostate tumor tissues RNA in situ Hybridization (RNA-ISH) was performed using the Affymetrix ViewRNA ISH Tissue Assay Kit (2-plex). Briefly, paraffin-embedded tissue blocks were freshly cut and frozen at -80°C until staining. Upon removal from the freezer, slides were baked for 1 hr at 60°C. Slides were treated with Histo-Clear to remove paraffin. Tissue sections were pretreated in pretreatment buffer solution for 10 min at 95°C and digested with protease for 10 min, before being fixed at RT in 5% formaldehyde. Target probe sets were applied and hybridized to the tissue by incubating for 2 hr at 40°C. Type 1 WNT5A (VA1-12202) was used at 1:50, and Type 6 probes KRT8, KRT18, and KLK3 (when used) (VA6-11560, VA6-11561, VA6-13505) pooled each at 1:200. Signal was amplified through the sequential hybridization of PreAmplifier and Amplifer QT mixes to the target probe set. Target mRNA molecules were detected by applying Type 6 Label Probe with Fast Blue substrate and Type 1 Label Probe with Fast Red substrate. Tissue was counterstained with Gill’s Hematoxylin for 10 sec at RT. DAPI (Invitrogen, D3571; 3.0 µg/ml) staining was performed for 1 min. Slides were imaged on the Aperio microscopy system within 1 week of staining to maintain a digital pathology archive of specimens. RNA-ISH in circulating tumor cells Isolated CTCs were centrifuged onto poly-L-lysine coated glass slides (Sigma Life Sciences, P0425) for 5 minutes at 800 rpm using Shandon EZ Megafunnels (A78710001). Slides were dried for 10 minutes, fixed with 4% PFA for 10 minutes and washed with 1xPBS for 10 minutes before dehydration and storage in 100% ethanol at -20 degrees Celsius until staining procedure. ViewRNA ISH Cell Assay Kit (Affymetrix, Santa Clara, CA) was used to stain CTC slides. Cells were permeabilized using Detergent Solution QC for 5 minutes at room temperature (RT). RNA was unmasked using Protease QS (1:2000 dilution) for 10 minutes at RT. Type 1 probes for WNT5A (VA1-12202), WNT7B (VA1-16571) and Type 6 probes for KRT8 (VA6-11560), KRT18 (VA6-11561), KRT19 (VA6-10947), KLK3 (VA6-63528), FOLH1 (VA6-11578), EPCAM (VA6-13003) were hybridized to target mRNA for 3 hours at 40°C. Signal amplification was achieved through sequential hybridization of Pre-Amplifier molecules, Amplifier molecules, and fluorescently conjugated Label Probe oligonucleotides. Cells were stained with DAPI (Invitrogen, D3571; 5 µg/ml) for 1 min at RT. Slides were then scanned on the BioView automated fluorescent imaging platform for quantification and analysis.
7

Cell line experiments Prostate cancer cell lines (LNCaP, VCaP, PC3, DU145) were obtained from ATCC after authentication by short tandem repeat profiling, and maintained as recommended. Drug treatment experiments were performed using 1-10 µM enzalutamide (Selleckchem), 1 nM R1881 (Perkin-Elmer), or dimethyl sulfoxide (DMSO). Sequenced LNCaP cells labeled LNCaP.R or LNCaP.D were cultured for 3 days in medium containing 10% charcoal-stripped FBS (Invitrogen), and treated with R1881 or DMSO as a vehicle control for 24 hours. The enzalutamide-resistant cell line LN_EnzR was generated by prolonged (4 months) in vitro selection in the presence of 1 µM enzalutamide. Non-canonical Wnt ligands (WNT4, WNT5A, WNT7B, and WNT11) were overexpressed in LNCaP cells using lentiviral constructs. WNT4, WNT5a, WNT7b, WNT11 plasmids were purchased from Addgene (36, 37) (35873, 35874, 35878, 35885), and cloned into pLX301 (Addgene 25895) through Gateway Cloning (Life Technologies). pLX301-Wnt plasmids together with packaging plasmids were transfected into 293T cells using Lipofectamine 2000 (Life Technologies). Lentivirus was collected 48 and 72 hours later. LNCaP cells were infected with lentivirus in the presence of 8mg/ml polybrene overnight. Stable cell pools were selected in growth medium containing 2 mg/mL puromycin for 1 week. siRNA Knockdown experiments of endogenous WNT5A and WNT7B gene expression in cells were performed using siRNA. ON‑TARGETplus siRNAs against WNT5A, WNT7B, and control siRNAs were purchased from GE Dharmacon. Western blots Wnt5a (C27E8) antibodies were purchased from Cell Signaling. Antibodies against Wnt7b (ab155313) and Wnt11 (ab96730) were purchased from Abcam. Antibodies against GAPDH (MAB374) were acquired from Millipore. Goat anti-rabbit or anti-mouse antibodies conjugated to IRDye 800CW were used as secondary antibodies (Cell Signaling) and detected by Li-cor Odyssey CLX Infrared Imaging System. Primers and quantitative real-time PCR Total RNA was extracted using RNeasy Micro Kit (Qiagen). 1µg of RNA was used to generate cDNA using superscript III First Strand synthesis system (Life Technologies). Reactions were amplified and analyzed in triplicate using the ABI 7500 Real-Time PCR System. The following primers are listed in the below table:
8

Cell growth and colony formation assay For proliferation assays, subconfluent cells were plated in triplicate for each time point at a density of 2,000 cells per well of 96-well plates 24 hours after siRNA transfection. The fold increase in cell number was measured by the CellTiter-Glo Luminescent Cell Viability Assay (Promega). For colony formation assays, cells were plated in triplicate at a density of 10,000 cells per well of 12-well plates in the presence of 1µM, 3µM or 10µM Enzalutamide (Selleckchem), and grown for 21 days before fixing and staining with crystal violet (Sigma-Aldrich). Fresh medium containing enzalutamide was changed twice a week.
WNT4_F TCTGACAACATCGCCTACG WNT4_R CGTCTTTACCTCACAGGAGC WNT5A_F ATTCTTGGTGGTCGCTAGGTA WNT5A_R CGCCTTCTCCGATGTACTGC WNT7B_F TTTCTCTGCTTTGGCGTCC WNT7B_R TACTGGCACTCGTTGATGC WNT11_F AGCCAATAAACTGATGCGTC WNT11_R ACAGGTATCGGGTCTTGAG GAPDH_F GGTCTCCTCTGACTTCAACA GAPDH_R GTGAGGGTCTCTCTCTTCCT
9
Patients with CTCs
Samples/cellsanalyzed
Intact RNAsequenced
>100,000 uniquelyaligned reads
Lineage-confirmedsamples
Patients analyzedLocalized
PCa Patients(N=12)
Primary Tumors(N=12)
Primary Tumors(N=12)
Primary Tumors(N=12)
Primary Tumors(N=12)
N=12 patients
LocalizedPCa Patients
(N=14)
CTCs(N=7)
CTCs(N=7)
CTCs(N=5)
CTCs(N=1)
N=1 patients
LocalizedPCa Patients
(N=4)
MetastaticPCa Patients
(N=24)
CTCs(N=214)
CTCs(N=126)
CTCs(N=117)
CTCs(N=76)
N=12 patients
MetastaticPCa Patients
(N=18)
WBCs(N=3)
WBCs(N=3)
WBCs(N=2)
WBCs(N=2)
N=1 patient
HealthyDonors(N=1)
WBCs(N=3)
WBCs(N=3)
WBCs(N=3)
WBCs(N=3)
N=1 donor
Prostate CaCell Lines
(N=4)
Cells(N=31)
Cells(N=31)
Cells(N=30)
Cells(N=30)
N=4 lines
C
A CTC WBCEpCAM
+ CDH11
BF
CD45
B
WBCsRBCs, platelets
CTCs1 2 3
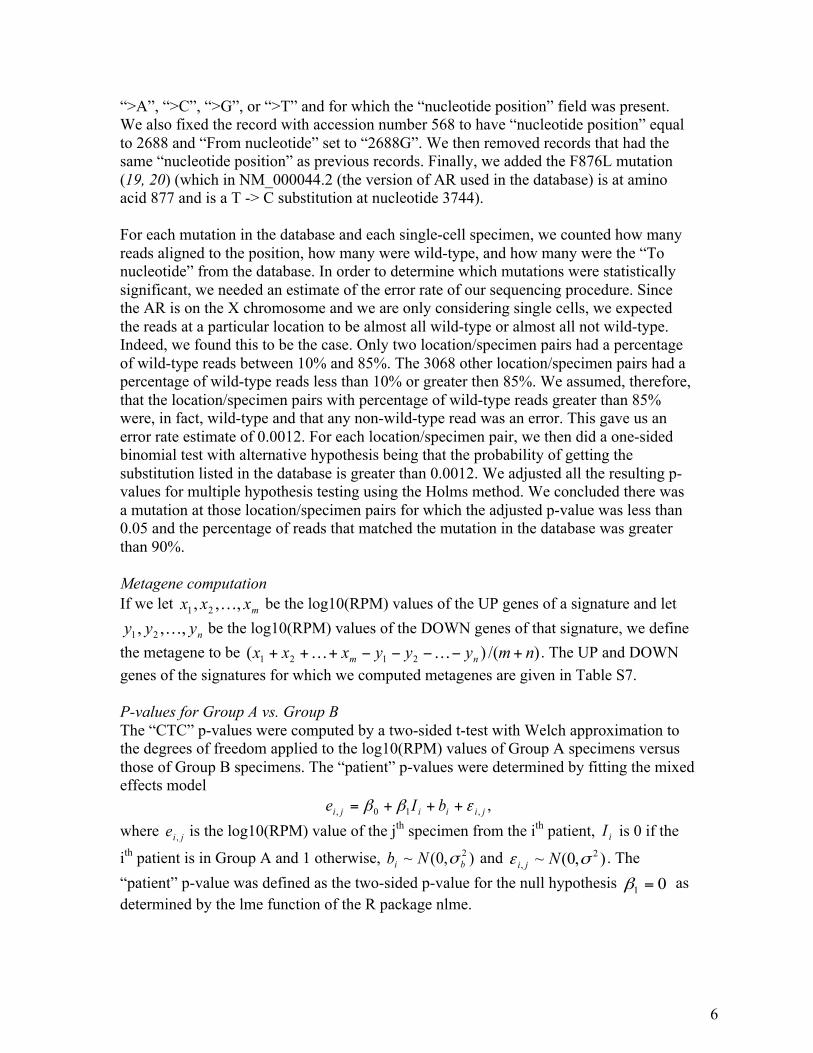
Fig. S1. Experimental workflow for single CTC RNA-sequencing studies. (A) Schematic of integrated microfluidicsystem (CTC-iChip) to deplete hematopoietic cells from whole blood and isolate circulating tumor cells (CTCs).The three microfluidic components of the system are depicted, including (i) hydrodynamic sorting to enrich fornucleated cells (CTCs and WBCs), (ii) inertial focusing to align all nucleated cells within a single streamline for efficient sorting, and (iii) magnetophoresis to remove leukocytes tagged with immunomagnetic beads.(B) Immunofluorescence images of a CTC stained with antibodies against both EpCAM and CDH11 (green), anda leukocyte (WBC) stained with antibody against CD45 (red). Bright field (BF) image of the CTC and WBC.Right panel depicts a CTC being isolated using a micromanipulator needle. Scale bars = 10 µm. (C) Flow chart ofsamples analyzed in this study. For CTC samples, patients were analyzed for the presence of CTCs byimmunofluorescence microscopy as above, and single CTCs were micromanipulated and processed for RNAsequencing. Lineage-confirmed CTCs were defined as those that met stringent pre-specified thresholds for expressionof prostate cancer-specific markers and low expression of leukocyte markers (see Fig. S2B, Results, and Methods).
10
0 1 2 3 4
10
12
34
max CTC or Prostate gene expression (log10(RPM))
max
CD
45 o
r CD
16 g
ene
expr
essi
on (l
og10
(RPM
))
CRPCCSPCWBCcell linelocalized GS6 7localized GS8 10
A B
Primary CTC Cell line WBC
1e+0
45e
+04
5e+0
55e
+06
Uni
quel
y al
igne
d re
ads
Mean Correlation Coefficient0.3 0.2 0.1 0.0 0.1
Mean(within patient) mean(between patients) correlation coefficient
Pr22
Pr21
Pr19
Pr18
Pr17
Pr14
Pr11
Pr9
Pr6
CTC Heterogeneity Across Patients
Intrapatient Interpatient
Patie
nts
(Difference from Null)
C DPr
21.1
.1Pr
21.1
.4Pr
21.1
.5Pr
21.1
.7Pr
21.1
.8Pr
21.1
.9Pr
21.1
.10
Pr21
.1.1
1Pr
21.1
.12
KLK3FOLH1KRT18SERPINE1MYCAURKACCNB1CCND1CD45CD16CD34GAPDH
Pr21
.1.1
Pr21
.1.4
Pr21
.1.5
Pr21
.1.7
Pr21
.1.8
Pr21
.1.9
Pr21
.1.1
0Pr
21.1
.11
Pr21
.1.1
2
KLK3FOLH1KRT18SERPINE1MYCAURKACCNB1CCND1CD45CD16CD34GAPDH
Single cell RNA-Seq Single cell qRT-PCR
log2(RPM)0
-∆Ct0-20-405 15
Fig. S2. RNA-sequencing of single CTCs, primary prostate tumors, cell lines, and leukocytes. (A) Uniquelyaligned RNA-sequencing reads for primary prostate tumors, single candidate CTCs, prostate cancer cell lines,and leukocytes. Dotted line represents the cutoff value of 100,000 uniquely aligned reads, and samples belowthis threshold were not further analyzed. (B) Stringent expression thresholds used to define lineage-confirmedCTCs. Maximum log10(RPM) expression of CTC or prostate specific markers (KRT7, KRT8, KRT18, KRT19,EPCAM, AR, KLK3, FOLH1, and AMACR) are plotted against leukocyte markers (CD45 and CD16).Dashed lines are thresholds defined by the relative expression of these markers in leukocytes and prostatecancer cell lines. CTCs in the lower right quadrant were defined as lineage-confirmed CTCs. See Methods fordetails. (C) CTC heterogeneity across patients, illustrated by the difference between the mean correlationcoefficients within patients (intrapatient) and between patients (interpatient) (see Fig. 1, B and C).(D) Validation of single cell RNA-seq data using an independent method (single cell multiplex qRT-PCR) in asubset of isolated single prostate CTCs with a panel of selected genes (prostate-specific genes, leukocyte genes,and cell cycle genes). 11
CARD16RNASE1
ALPLPOPDC2
LRP4SLA
MFAP4TYROBPWFDC2
KCTD12HOXB5
NRKRGS1
FBLN1C1S
C3ACTA2MSMBPCP4NPY
TPM2MYH11AEBP1
A2MA2M AS1
KRT13ACTG2
DESADAM6
ENGMGP
Pr14
.2.2
Pr14
.2.3
Pr14
.2.4
Pr14
.2.5
Pr14
.2.6
Pr9.
1.1
Pr21
.1.5
Pr21
.1.6
Pr14
.1.1
Pr14
.3.1
Pr10
.2.2
Pr15
.1.1
Pr18
.2.3
Pr11
.2.2
Pr3.
1.1
Pr9.
3.6
Pr9.
3.7
Pr14
.3.4
Pr14
.3.5
PriTu
m9
PriTu
m7
PriTu
m8
PriTu
m5
PriTu
m6
PriTu
m12
PriTu
m10
PriTu
m11
PriTu
m3
PriTu
m4
PriTu
m1
PriTu
m2
Pr11
.1.1
Pr11
.4.4
Pr18
.2.2
Pr17
.2.1
Pr11
.3.3
Pr17
.2.2
Pr11
.3.1
Pr11
.3.2
DU
145.
4PC
3.5
PC3.
2PC
3.1
PC3.
3PC
3.4
DU
145.
2D
U14
5.3
DU
145.
1D
U14
5.5
VCaP
.3VC
aP.5
VCaP
.2VC
aP.1
VCaP
.4LN
CaP
.2LN
CaP
.R.1
LNC
aP.1
LNC
aP.5
LNC
aP.3
LNC
aP.4
LNC
aP.R
.5LN
CaP
.R.4
LNC
aP.R
.2LN
CaP
.R.3
LNC
aP.D
.4LN
CaP
.D.3
LNC
aP.D
.2LN
CaP
.D.1
LNC
aP.D
.5Pr
14.2
.1Pr
18.2
.1Pr
6.1.
2Pr
22.1
.11
Pr6.
1.1
Pr22
.1.6
Pr22
.1.5
Pr22
.1.2
Pr22
.1.4
Pr22
.1.1
2Pr
22.1
.10
Pr22
.1.9
Pr22
.1.7
Pr22
.1.8
Pr21
.1.9
Pr21
.1.1
0Pr
21.1
.7Pr
21.1
.11
Pr21
.1.1
2Pr
21.1
.1Pr
21.1
.2Pr
21.1
.8Pr
21.1
.3Pr
21.1
.4Pr
20.1
.1Pr
6.1.
5Pr
9.3.
1Pr
9.1.
6Pr
9.1.
3Pr
9.1.
4Pr
9.1.
2Pr
9.3.
8Pr
14.3
.6Pr
17.1
.1Pr
17.1
.2Pr
18.1
.8Pr
18.1
.4Pr
18.1
.7Pr
18.1
.1Pr
18.1
.5Pr
18.1
.6Pr
19.1
.2Pr
19.1
.3Pr
19.1
.4Pr
19.1
.5Pr
11.4
.2Pr
11.4
.3Pr
11.4
.1Pr
11.4
.5Pr
11.4
.6
10 0 10Median polished log2(RPM)
Prim. Tumors Cell LinesCTCsCTCs CTCs
CARD16RNASE1ALPLPOPDC2LRP4SLAMFAP4TYROBPWFDC2KCTD12HOXB5NRKRGS1FBLN1C1SC3ACTA2MSMBPCP4NPYTPM2MYH11AEBP1A2MA2M AS1KRT13ACTG2DESADAM6ENGMGP
5508
71 lo
caliz
ed_p
ca55
0872
loca
lized
_pca
5508
73 lo
caliz
ed_p
ca55
0874
loca
lized
_pca
5508
75 lo
caliz
ed_p
ca55
0876
loca
lized
_pca
5508
77 lo
caliz
ed_p
ca55
0878
loca
lized
_pca
5508
79 lo
caliz
ed_p
ca55
0880
loca
lized
_pca
5508
81 lo
caliz
ed_p
ca55
0882
loca
lized
_pca
5508
83 lo
caliz
ed_p
ca55
0884
loca
lized
_pca
5508
85 lo
caliz
ed_p
ca55
0886
loca
lized
_pca
5508
87 lo
caliz
ed_p
ca55
0888
loca
lized
_pca
5508
89 lo
caliz
ed_p
ca55
0890
loca
lized
_pca
5508
91 lo
caliz
ed_p
ca55
0892
loca
lized
_pca
5508
93 lo
caliz
ed_p
ca55
0894
loca
lized
_pca
5508
95 lo
caliz
ed_p
ca55
0896
loca
lized
_pca
5508
97 lo
caliz
ed_p
ca55
0914
loca
lized
_pca
5509
15 lo
caliz
ed_p
ca55
0916
loca
lized
_pca
5509
17 lo
caliz
ed_p
ca55
0925
loca
lized
_pca
5509
26 lo
caliz
ed_p
ca55
0927
loca
lized
_pca
5509
28 lo
caliz
ed_p
ca55
0929
loca
lized
_pca
5509
30 lo
caliz
ed_p
ca55
0931
loca
lized
_pca
5509
32 lo
caliz
ed_p
ca55
0933
loca
lized
_pca
5509
34 lo
caliz
ed_p
ca55
0935
loca
lized
_pca
5509
36 lo
caliz
ed_p
ca55
0937
loca
lized
_pca
5509
38 lo
caliz
ed_p
ca55
0939
loca
lized
_pca
5509
40 lo
caliz
ed_p
ca55
0898
met
asta
tic_p
ca55
0899
met
asta
tic_p
ca55
0900
met
asta
tic_p
ca55
0901
met
asta
tic_p
ca55
0903
met
asta
tic_p
ca55
0905
met
asta
tic_p
ca55
0906
met
asta
tic_p
ca55
0907
met
asta
tic_p
ca55
0908
met
asta
tic_p
ca55
0909
met
asta
tic_p
ca55
0910
met
asta
tic_p
ca55
0911
met
asta
tic_p
ca55
0912
met
asta
tic_p
ca
localized_pca metastatic_pca
0 2 4
log10(RPM + 1)
CARD16RNASE1ALPLPOPDC2LRP4SLAMFAP4TYROBPWFDC2KCTD12HOXB5NRKRGS1FBLN1C1SC3ACTA2MSMBPCP4NPYTPM2MYH11AEBP1A2MA2M AS1KRT13ACTG2DESADAM6ENGMGP
5508
97 lo
caliz
ed_p
ca55
0914
loca
lized
_pca
5509
15 lo
caliz
ed_p
ca55
0916
loca
lized
_pca
5509
17 lo
caliz
ed_p
ca55
0925
loca
lized
_pca
5509
26 lo
caliz
ed_p
ca55
0927
loca
lized
_pca
5509
28 lo
caliz
ed_p
ca55
0929
loca
lized
_pca
5509
30 lo
caliz
ed_p
ca55
0931
loca
lized
_pca
5509
32 lo
caliz
ed_p
ca55
0933
loca
lized
_pca
5509
34 lo
caliz
ed_p
ca55
0935
loca
lized
_pca
5509
36 lo
caliz
ed_p
ca55
0937
loca
lized
_pca
5509
38 lo
caliz
ed_p
ca55
0939
loca
lized
_pca
5509
40 lo
caliz
ed_p
ca55
0898
met
asta
tic_p
ca55
0899
met
asta
tic_p
ca55
0900
met
asta
tic_p
ca55
0901
met
asta
tic_p
ca55
0903
met
asta
tic_p
ca55
0905
met
asta
tic_p
ca55
0906
met
asta
tic_p
ca55
0907
met
asta
tic_p
ca55
0908
met
asta
tic_p
ca55
0909
met
asta
tic_p
ca55
0910
met
asta
tic_p
ca55
0911
met
asta
tic_p
ca55
0912
met
asta
tic_p
ca
localized_pca metastatic_pca
2 4
log10(RPM + 1)
Prim. Tumors Metastases
Prensner et al. data set
CARD16RNASE1ALPLPOPDC2LRP4SLAMFAP4TYROBPWFDC2KCTD12HOXB5NRKRGS1FBLN1C1SC3ACTA2MSMBPCP4NPYTPM2MYH11AEBP1A2MA2M AS1KRT13ACTG2DESADAM6ENGMGP
5509
11 m
etas
tatic
_pca
5509
12 m
etas
tatic
_pca
metastatic_pca
Data from Fig. 1A
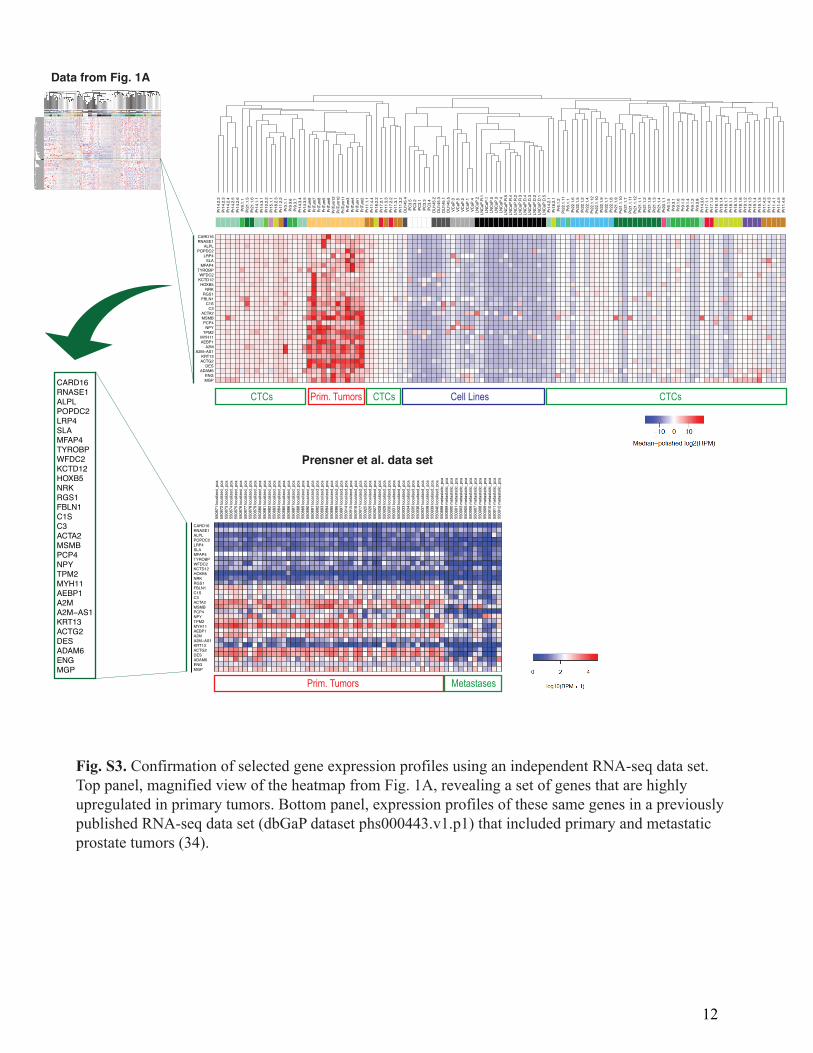
Fig. S3. Confirmation of selected gene expression profiles using an independent RNA-seq data set.Top panel, magnified view of the heatmap from Fig. 1A, revealing a set of genes that are highlyupregulated in primary tumors. Bottom panel, expression profiles of these same genes in a previouslypublished RNA-seq data set (dbGaP dataset phs000443.v1.p1) that included primary and metastaticprostate tumors (34).
12
type:
CRPC
CSPC
localized GS6−7
localized GS8−10
Up.in:
CTC
primary
Up.
in
PriTu
m9
PriTu
m5
PriTu
m6
PriTu
m7
PriTu
m8
PriTu
m12
PriTu
m10
PriTu
m11
PriTu
m4
PriTu
m1
PriTu
m2
PriTu
m3
Pr9.
1.1
Pr14
.1.1
Pr21
.1.5
Pr21
.1.6
Pr14
.3.1
Pr15
.1.1
Pr18
.2.3
Pr11
.2.2
Pr9.
3.6
Pr9.
3.7
Pr10
.2.2
Pr14
.3.4
Pr11
.3.2
Pr17
.2.1
Pr11
.3.3
Pr17
.2.2
Pr11
.3.1
Pr11
.1.1
Pr3.
1.1
Pr19
.1.5
Pr19
.1.2
Pr19
.1.4
Pr14
.2.2
Pr14
.2.3
Pr14
.2.4
Pr14
.2.5
Pr14
.2.6
Pr11
.4.1
Pr11
.4.5
Pr11
.4.6
Pr11
.4.4
Pr11
.4.2
Pr11
.4.3
Pr6.
1.2
Pr22
.1.1
1Pr
6.1.
1Pr
22.1
.7Pr
22.1
.8Pr
22.1
.9Pr
22.1
.10
Pr22
.1.2
Pr22
.1.4
Pr22
.1.6
Pr22
.1.5
Pr18
.2.2
Pr14
.3.5
Pr14
.3.6
Pr21
.1.9
Pr21
.1.1
0Pr
21.1
.2Pr
21.1
.3Pr
21.1
.4Pr
21.1
.11
Pr21
.1.1
2Pr
21.1
.1Pr
21.1
.8Pr
21.1
.7Pr
9.1.
6Pr
22.1
.12
Pr20
.1.1
Pr18
.1.8
Pr14
.2.1
Pr18
.2.1
Pr6.
1.5
Pr18
.1.4
Pr18
.1.1
Pr19
.1.3
Pr18
.1.5
Pr18
.1.7
Pr18
.1.6
Pr17
.1.1
Pr17
.1.2
Pr9.
1.4
Pr9.
3.1
Pr9.
1.2
Pr9.
1.3
Pr9.
3.8
type
0 2 4log10(RPM)
A
B
9 171510 11 1463 2118 222019P value (Group A vs. B)
1˚ tumorsCTCs By Patient
AR signatureAR gene
ARv567es (AR V12)AR V7
AR V1, V3, or V4T3744C (F876L)A3747G (T877A)G3245A (E709E)
GR signatureGR gene
nc WNT signaturenc WNT gene
RAC1 geneRHOA gene
CDC42 geneKLK3 exon 5
KLK3 intron 1KLK3 intron 3
KLK3 intron 4aKLK3 intron 4b
0.82 0.70.065 0.260.870.470.98
0.830.650.92
0.350.67
0.590.92
0.0041 0.040.881e 060.00460.0097
0.890.00190.0390.039
0.110.220.320.0850.00061
0.30.250.350.120.005
CTC patient
0.0 0.5 1.0scaled expression
0.0 0.5 1.0scaled expression
0.0 0.5 1.0scaled expression
MutatedWT
Insufficient reads
KLK3 mRNAAF335477, AF335478AJ310938, AJ310937AJ512346NM_001030047
Group A Group B
nc WNT signatureGR signatureAR signature
nc WNT geneRAC1 geneRHOA gene
CDC42 geneGR geneAR geneAR V12AR V7
AR V 1,3,4F876L
A3747GG3245A
0.00410.350.82
0.040.590.7
0.881e 060.00460.0097
0.890.00190.0390.039
0.67 0.920.065 0.260.870.470.98
0.830.650.92
CTC patient
0.0 0.5 1.0scaled expression
0.0 0.5 1.0scaled expression
0.0 0.5 1.0scaled expression
MutatedWT
Insufficient reads
CTC patient0.11 0.30.22 0.250.32 0.350.085 0.120.00061 0.005
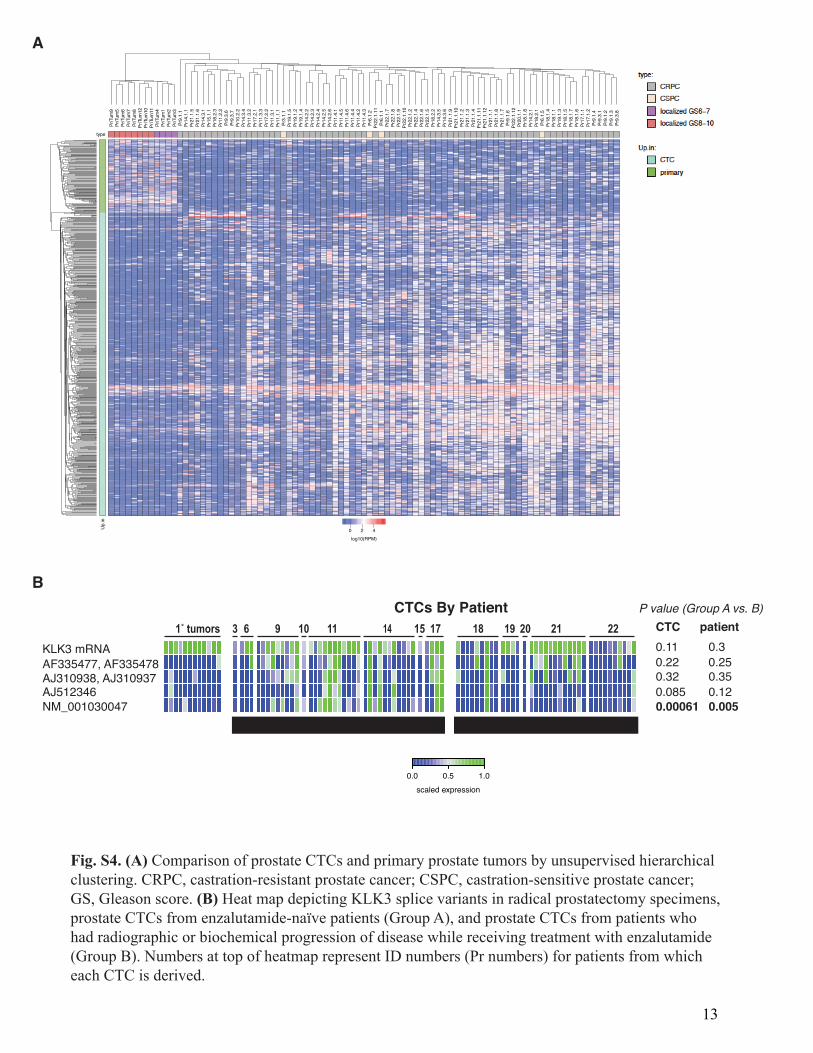
Fig. S4. (A) Comparison of prostate CTCs and primary prostate tumors by unsupervised hierarchicalclustering. CRPC, castration-resistant prostate cancer; CSPC, castration-sensitive prostate cancer;GS, Gleason score. (B) Heat map depicting KLK3 splice variants in radical prostatectomy specimens,prostate CTCs from enzalutamide-naïve patients (Group A), and prostate CTCs from patients whohad radiographic or biochemical progression of disease while receiving treatment with enzalutamide(Group B). Numbers at top of heatmap represent ID numbers (Pr numbers) for patients from whicheach CTC is derived.
13

Fig. S5. Heatmap showing PID pathways enriched in prostate CTCs compared to primary tumors inthe current study (Miyamoto), and PID pathways enriched in metastatic tumors compared to primary tumorsin seven other datasets (see Table S4 and Methods).
PID AR NONGENOMIC PATHWAYPID ARF 3PATHWAY
PID ECADHERIN NASCENTAJ PATHWAYPID ECADHERIN STABILIZATION PATHWAY
PID EPHA2 FWDPATHWAYPID ERBB1 DOWNSTREAM PATHWAY
PID HDAC CLASSI PATHWAYPID HDAC CLASSII PATHWAY
PID IL2 PI3KPATHWAYPID IL3 PATHWAY
PID LIS1PATHWAYPID MET PATHWAY
PID NECTIN PATHWAYPID NOTCH PATHWAY
PID PI3KCIAKTPATHWAYPID RANBP2PATHWAYPID REG GR PATHWAY
PID RET PATHWAYPID SMAD2 3NUCLEARPATHWAY
PID SMAD2 3PATHWAYPID TGFBRPATHWAY
PID P53REGULATIONPATHWAYPID A6B1 A6B4 INTEGRIN PATHWAY
PID AR PATHWAYPID CMYB PATHWAY
PID ERBB1 INTERNALIZATION PATHWAYPID IGF1 PATHWAY
PID INSULIN GLUCOSE PATHWAYPID MTOR 4PATHWAYPID NFAT 3PATHWAY
PID PDGFRBPATHWAYPID PI3KPLCTRKPATHWAY
PID VEGFR1 2 PATHWAYPID HIF1 TFPATHWAY
PID FOXOPATHWAYPID BETACATENIN NUC PATHWAY
PID ILK PATHWAYPID MYC ACTIVPATHWAYPID AURORA B PATHWAY
PID INTEGRIN A4B1 PATHWAYPID ATM PATHWAY
PID EPHA FWDPATHWAYPID RHOA REG PATHWAY
PID HNF3BPATHWAYPID FANCONI PATHWAY
PID BCR 5PATHWAYPID CD8TCRPATHWAY
PID EPHRINBREVPATHWAYPID ER NONGENOMIC PATHWAY
PID FCER1PATHWAYPID HNF3APATHWAY
PID INSULIN PATHWAYPID INTEGRIN2 PATHWAY
PID KITPATHWAYPID NEPHRIN NEPH1 PATHWAY
PID P38ALPHABETAPATHWAYPID REELINPATHWAY
PID SYNDECAN 2 PATHWAYPID TCR PATHWAY
PID TCRRASPATHWAYPID TOLL ENDOGENOUS PATHWAY
PID UPA UPAR PATHWAYPID HIF1APATHWAY
PID VEGFR1 PATHWAYPID CDC42 REG PATHWAY
PID HIF2PATHWAYPID RB 1PATHWAYPID ATR PATHWAYPID FRA PATHWAY
PID INTEGRIN A9B1 PATHWAYPID INTEGRIN5 PATHWAY
PID P53DOWNSTREAMPATHWAYPID SYNDECAN 4 PATHWAYPID SYNDECAN 1 PATHWAY
PID AVB3 INTEGRIN PATHWAYPID INTEGRIN1 PATHWAYPID INTEGRIN3 PATHWAY
PID P73PATHWAYPID AURORA A PATHWAY
PID PLK1 PATHWAYPID E2F PATHWAY
PID FOXM1PATHWAY
Miya
mot
o
Cai
Cha
ndra
nG
rass
oLa
Tulip
pePo
isso
nPr
ensn
erTa
ylor
Upin
CTC Up in Met
14
Group B Group A
Core
Enr
ichm
ent
A
DGR expression in CTCs
10
12
Group AGroup B
High (N = 25)Low (N = 52)
NR
3C1
Expr
essi
on (l
og10
(rpm
))
B C
S
T
Primary prostate tumors
Red: WNT5ABlue: KRT8/18, KLK3
Prostate cancer ncWNT expression (RNA-ISH)
Localized tumor (stromal cells) (N = 9 pts)
WNT5A: 0/416 cells (<0.2%) WNT7B: 2/459 cells (0.5%)
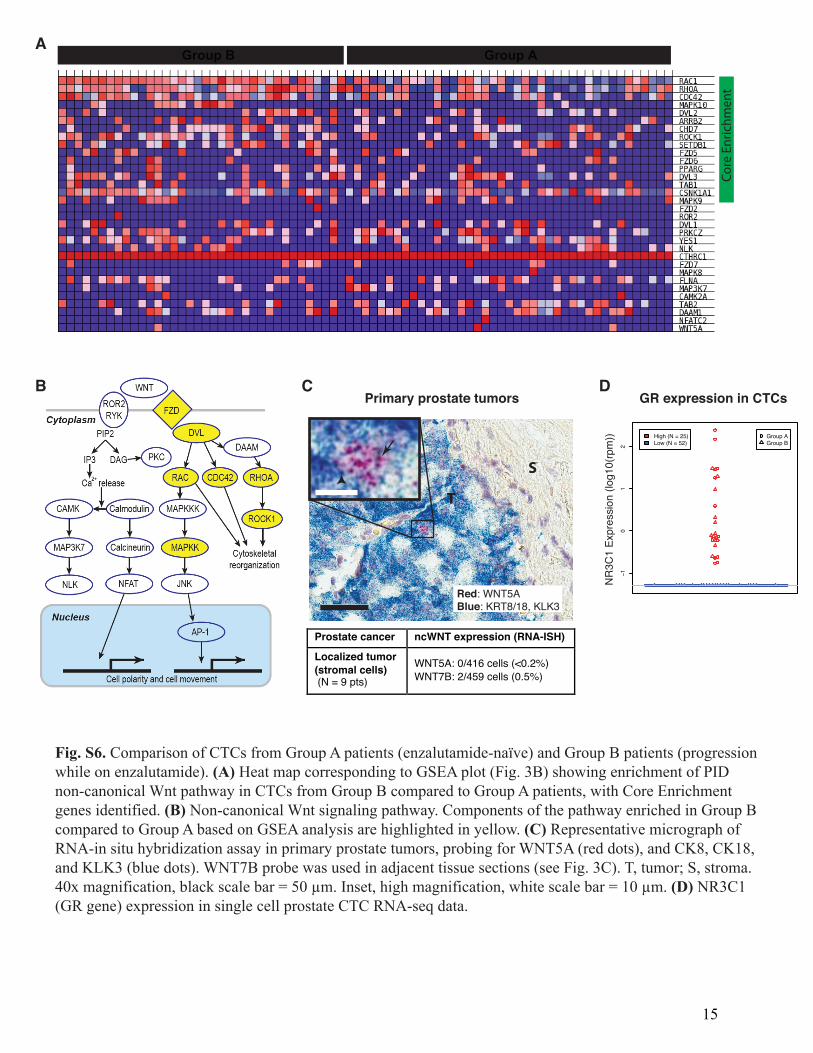
Fig. S6. Comparison of CTCs from Group A patients (enzalutamide-naïve) and Group B patients (progressionwhile on enzalutamide). (A) Heat map corresponding to GSEA plot (Fig. 3B) showing enrichment of PIDnon-canonical Wnt pathway in CTCs from Group B compared to Group A patients, with Core Enrichmentgenes identified. (B) Non-canonical Wnt signaling pathway. Components of the pathway enriched in Group Bcompared to Group A based on GSEA analysis are highlighted in yellow. (C) Representative micrograph ofRNA-in situ hybridization assay in primary prostate tumors, probing for WNT5A (red dots), and CK8, CK18,and KLK3 (blue dots). WNT7B probe was used in adjacent tissue sections (see Fig. 3C). T, tumor; S, stroma.40x magnification, black scale bar = 50 µm. Inset, high magnification, white scale bar = 10 µm. (D) NR3C1(GR gene) expression in single cell prostate CTC RNA-seq data.
15
A B
D
E
WNT overexpression in LNCaP cells WNT overexpression in LNCaP cells
WNT5A suppression in LNCaP cells
Enzalutamide resistant LNCaP-derived cell line
E nzalutamide 1μMEnzalutamide 3μMEnzalutamide10μM
C WNT overexpression in LNCaP cells
0
50
100
150
200
250
300
350
0
50
100
150
ColonyNumber
Ctrl
Wnt5a
Wnt4
Wnt7b
Wnt11
0
0.4
0.8
1.2
0
0.4
0.8
1.2
LNCaP-siCtrl
LNCaP-siWNT5A
LN_EnzR-siCtrl
LN_EnzR-siWNT5A20
0
25
15
10
5
LNCaP
LNCaP 1µM Enz
LNCaP 10µM Enz
LN_EnzR
LN_EnzR 1µM Enz
LN_EnzR 10µM Enz
WNT5A WNT7B
Rel
ativ
e m
RN
A
WNT5Ad1 d4 d7 d10
Cel
l gro
wth
Col
ony
num
ber
Rel
ativ
e m
RN
A
WNT5A
WNT7B
WNT11
GAPDH
LNC
aP
LN_W
NT4
LN_W
NT5
A
LN_W
NT7
B
LN_W
NT1
1
F WNT5A suppression in enzalutamide-resistant LNCaP cells
Rel
ativ
e m
RN
A
Ctrl
WN
T4W
NT5
AW
NT7
BW
NT1
1
Ctrl
WN
T4W
NT5
AW
NT7
BW
NT1
1
Ctrl
WN
T4W
NT5
AW
NT7
BW
NT1
1
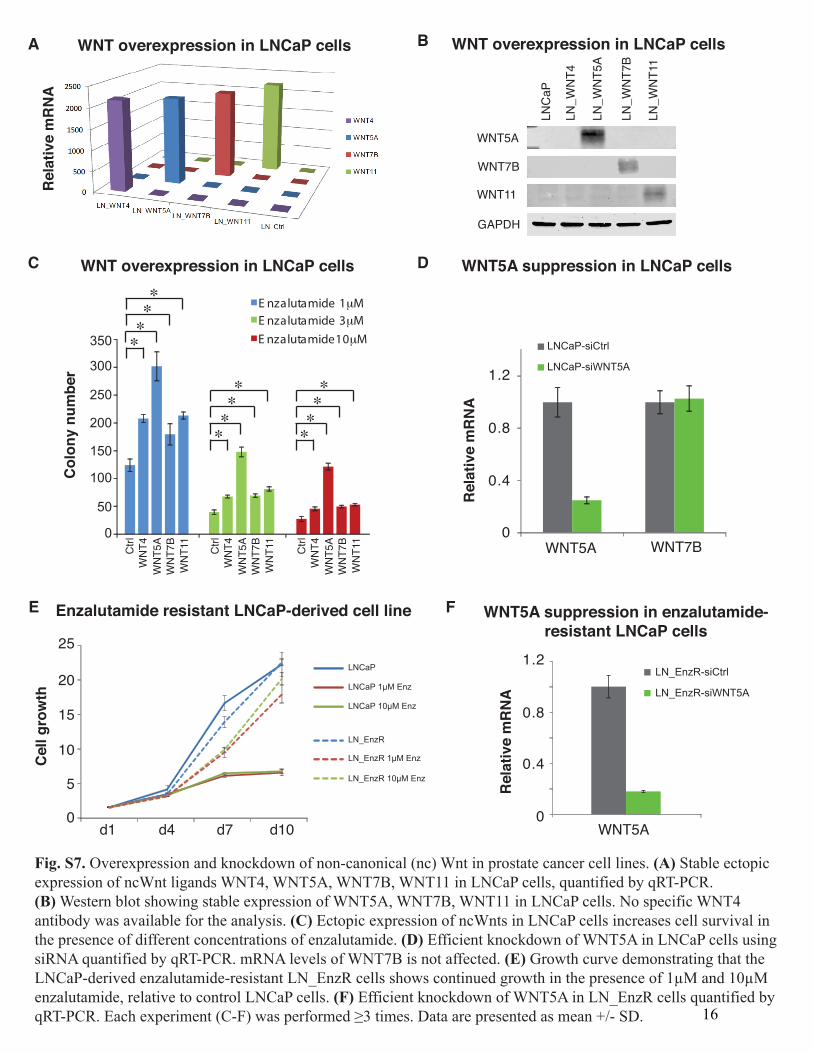
Fig. S7. Overexpression and knockdown of non-canonical (nc) Wnt in prostate cancer cell lines. (A) Stable ectopicexpression of ncWnt ligands WNT4, WNT5A, WNT7B, WNT11 in LNCaP cells, quantified by qRT-PCR.(B) Western blot showing stable expression of WNT5A, WNT7B, WNT11 in LNCaP cells. No specific WNT4antibody was available for the analysis. (C) Ectopic expression of ncWnts in LNCaP cells increases cell survival inthe presence of different concentrations of enzalutamide. (D) Efficient knockdown of WNT5A in LNCaP cells usingsiRNA quantified by qRT-PCR. mRNA levels of WNT7B is not affected. (E) Growth curve demonstrating that theLNCaP-derived enzalutamide-resistant LN_EnzR cells shows continued growth in the presence of 1µM and 10µMenzalutamide, relative to control LNCaP cells. (F) Efficient knockdown of WNT5A in LN_EnzR cells quantified byqRT-PCR. Each experiment (C-F) was performed ≥3 times. Data are presented as mean +/- SD. 16
A B
100
1020
3040 High (N = 12)
Low (N = 4)ControlResistant
GR Expression in Xenografts
NR
3C1
Exp
ress
ion
(ILM
N_2
3893
47)
ConA ResLowGR ResHighGR
LREX Control
Core
Enr
ichm
ent
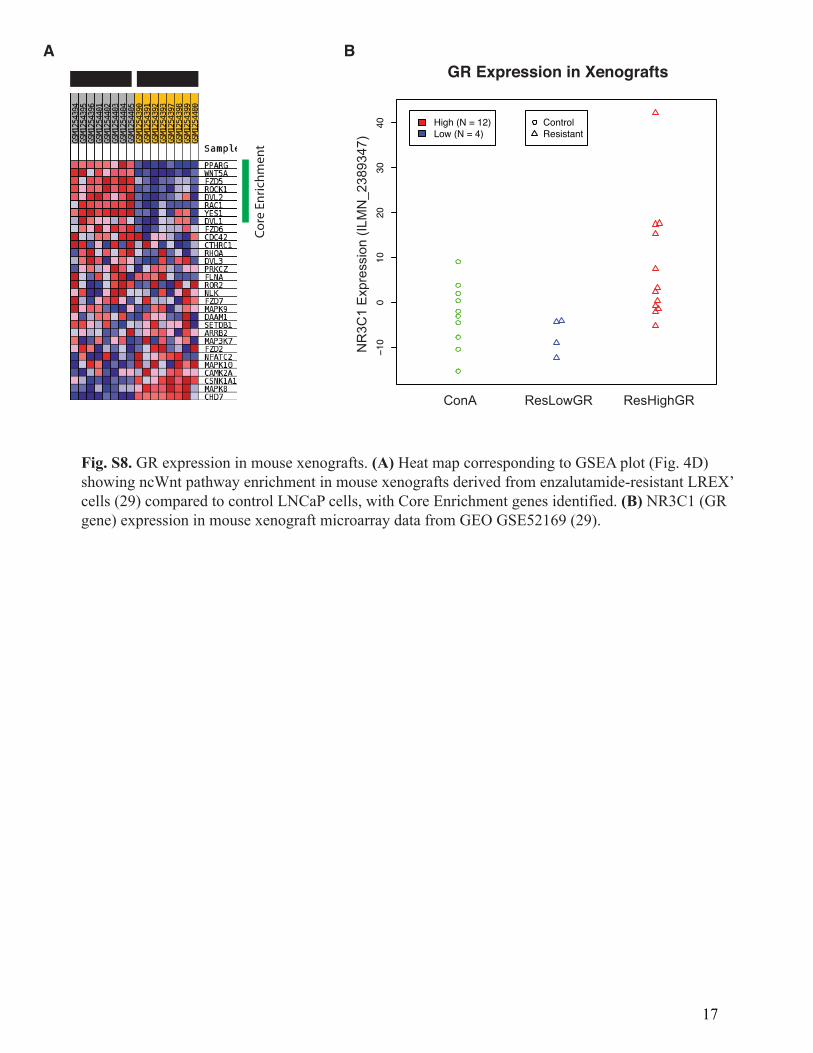
Fig. S8. GR expression in mouse xenografts. (A) Heat map corresponding to GSEA plot (Fig. 4D)showing ncWnt pathway enrichment in mouse xenografts derived from enzalutamide-resistant LREX’cells (29) compared to control LNCaP cells, with Core Enrichment genes identified. (B) NR3C1 (GRgene) expression in mouse xenograft microarray data from GEO GSE52169 (29).
17

Patient StageDisease status at time of CTC collection
PSA (ng/mL)
No. cells picked
No. cells sequenced
No. lineage-confirmed CTCs Group Response to enzalutamide Prior Treatments
Pr1 loc. CSPC, pre-treatment 10.0 1 1 0 - - nonePr2 loc. CSPC, pre-treatment 6.8 2 2 0 - - nonePr3 loc. CSPC, pre-treatment 8.5 2 2 1 A enzalutamide-naïve nonePr4 loc. CSPC, pre-treatment 10.1 2 2 0 - - nonePr5 met. CSPC, pre-treatment 144.1 4 3 0 - - nonePr6 met. CSPC, pre-treatment 207.8 9 5 3 A enzalutamide-naïve nonePr7 met. CSPC, pre-treatment 34.7 3 2 0 - - nonePr8 met. CSPC, pre-treatment 7.3 5 5 0 - - nonePr9 met. CRPC, on abiraterone 93.9 32 17 9 A enzalutamide-naïve ADTPr10 met. CRPC, on abiraterone 445.5 8 6 1 A enzalutamide-naïve ADT, doc, caboPr11 met. CRPC, on abiraterone 1504.0 27 15 11 A enzalutamide-naïve ADT, bic, metformin, keto, cabo, docPr12 met. CRPC, on abiraterone 0.2 3 2 0 - - ADTPr13 met. CRPC, on abiraterone 0.2 2 2 0 - - ADTPr14 met. CRPC, on abiraterone 365.6 20 13 11 A enzalutamide-naïve ADTPr15 met. CRPC, on docetaxel 43.0 4 2 1 A enzalutamide-naïve ADT, abiPr16 met. CRPC, on Phase I drug† 87.7 8 6 0 - - ADT, metformin, keto, doc, abi, cabazPr17 met. CRPC, on cabazitaxel 384.9 7 4 4 A enzalutamide-naïve ADT, doc, abiPr18 met. CRPC, on enzalutamide 311.3 27 13 9 B Rad. progression ADT, sipT, metformin, cabo, docPr19 met. CRPC, on enzalutamide 349.4 9 5 4 B Rad. and PSA progression ADT, abi, docPr20 met. CRPC, on enzalutamide 94.0 4 2 1 B Rad. and PSA progression ADT, doc, abiPr21 met. CRPC, on enzalutamide* 4573.0 18 12 12 B PSA progression ADT, doc, abi, cabazPr22 met. CRPC, on enzalutamide 219.1 24 12 10 B Rad. and PSA progression ADT, abi
Total: 221 133 77
Legend: ADT, androgen deprivation therapy; abi, abiraterone; bic, bicalutamide; cabaz, cabazitaxel; cabo, cabozantinib; CRPC, castration-resistant prostate cancer; CSPC, castration-sensitive prostate cancer; doc, docetaxel; ket, ketoconazole; loc., localized; met., metastatic; PSA, serum prostate-specific antigen at time of CTC collection; Rad., radiographic; sipT, sipuleucel-T; †E7050 and E7080; *started enzalutamide on the day of the CTC blood draw.
Table S1 | Patient CTC Samples
18
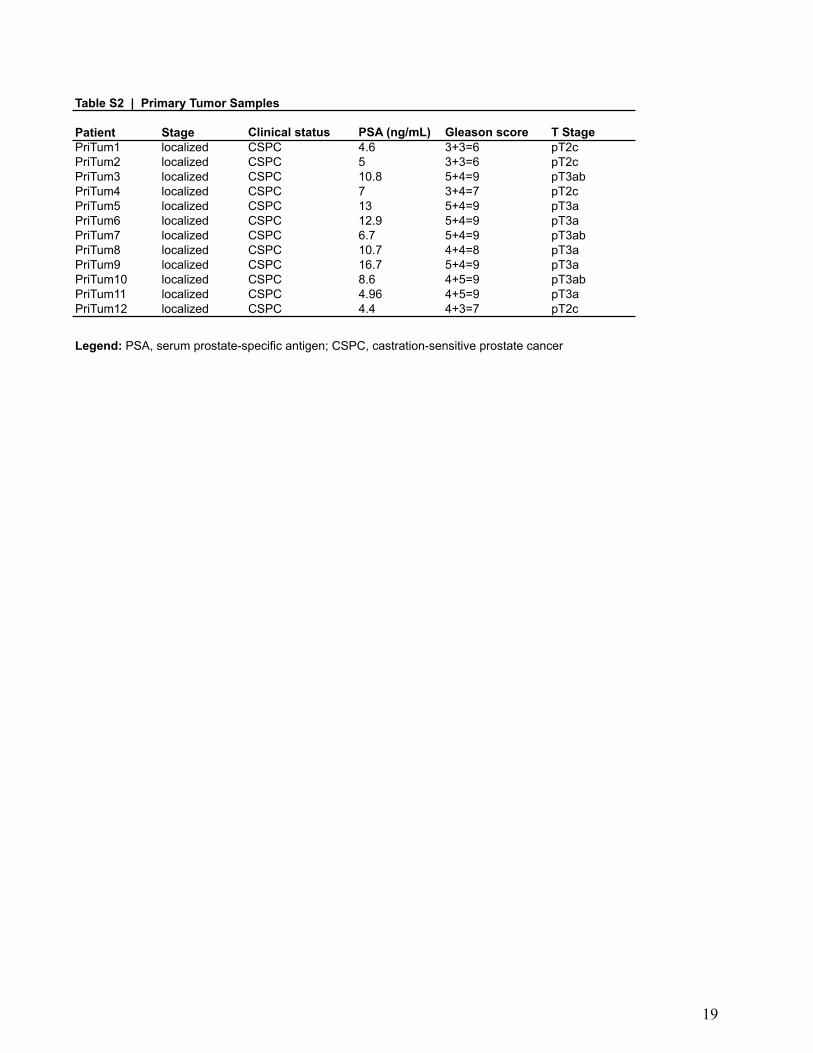
Patient Stage Clinical status PSA (ng/mL) Gleason score T StagePriTum1 localized CSPC 4.6 3+3=6 pT2cPriTum2 localized CSPC 5 3+3=6 pT2cPriTum3 localized CSPC 10.8 5+4=9 pT3abPriTum4 localized CSPC 7 3+4=7 pT2cPriTum5 localized CSPC 13 5+4=9 pT3aPriTum6 localized CSPC 12.9 5+4=9 pT3aPriTum7 localized CSPC 6.7 5+4=9 pT3abPriTum8 localized CSPC 10.7 4+4=8 pT3aPriTum9 localized CSPC 16.7 5+4=9 pT3aPriTum10 localized CSPC 8.6 4+5=9 pT3abPriTum11 localized CSPC 4.96 4+5=9 pT3aPriTum12 localized CSPC 4.4 4+3=7 pT2c
Table S2 | Primary Tumor Samples
Legend: PSA, serum prostate-specific antigen; CSPC, castration-sensitive prostate cancer
19

Supplementary Excel Tables Table S3. Genes differentially expressed between CTCs and primary prostate tumors. “Up in CTC” tab – 711 genes enriched in CTCs. “Up in Primary” tab – 173 genes enriched in primary tumors. Table S4. Data sets used in the differential gene expression and pathway analyses comparing metastatic and primary prostate tumors (see Figs. 2C and S5). Table S5. Androgen receptor mutation analysis in prostate CTCs, primary tumors, and prostate cancer cell lines. Table S6. Androgen receptor splice variant analysis in prostate CTCs and primary tumors. Table S7. Pathway signatures used for metagene analyses in this study (see Fig. 3A).
20

Supplementary References
32. H. Hieronymus, J. Lamb, K. N. Ross, X. P. Peng, C. Clement, A. Rodina, M. Nieto, J. Du, K. Stegmaier, S. M. Raj, K. N. Maloney, J. Clardy, W. C. Hahn, G. Chiosis, T. R. Golub, Gene expression signature-based chemical genomic prediction identifies a novel class of HSP90 pathway modulators. Cancer Cell 10, 321–330 (2006).
33. C. Trapnell, A. Roberts, L. Goff, G. Pertea, D. Kim, D. R. Kelley, H. Pimentel, S. L. Salzberg, J. L. Rinn, L. Pachter, Differential gene and transcript expression analysis of RNA-seq experiments with TopHat and Cufflinks. Nat. Protoc. 7, 562–578 (2012).
34. J. R. Prensner, M. K. Iyer, O. A. Balbin, S. M. Dhanasekaran, Q. Cao, J. C. Brenner, B. Laxman, I. A. Asangani, C. S. Grasso, H. D. Kominsky, X. Cao, X. Jing, X. Wang, J. Siddiqui, J. T. Wei, D. Robinson, H. K. Iyer, N. Palanisamy, C. A. Maher, A. M. Chinnaiyan, Transcriptome sequencing across a prostate cancer cohort identifies PCAT-1, an unannotated lincRNA implicated in disease progression. Nat. Biotechnol. 29, 742–749 (2011).
35. A. Subramanian, P. Tamayo, V. K. Mootha, S. Mukherjee, B. L. Ebert, M. A. Gillette, A. Paulovich, S. L. Pomeroy, T. R. Golub, E. S. Lander, J. P. Mesirov, Gene set enrichment analysis: A knowledge-based approach for interpreting genome-wide expression profiles. Proc. Natl. Acad. Sci. U.S.A. 102, 15545–15550 (2005).
36. R. Najdi, K. Proffitt, S. Sprowl, S. Kaur, J. Yu, T. M. Covey, D. M. Virshup, M. L. Waterman, A uniform human Wnt expression library reveals a shared secretory pathway and unique signaling activities. Differentiation 84, 203–213 (2012).
37. X. Yang, J. S. Boehm, X. Yang, K. Salehi-Ashtiani, T. Hao, Y. Shen, R. Lubonja, S. R. Thomas, O. Alkan, T. Bhimdi, T. M. Green, C. M. Johannessen, S. J. Silver, C. Nguyen, R. R. Murray, H. Hieronymus, D. Balcha, C. Fan, C. Lin, L. Ghamsari, M. Vidal, W. C. Hahn, D. E. Hill, D. E. Root, A public genome-scale lentiviral expression library of human ORFs. Nat. Methods 8, 659–661 (2011).
21