Supplementary Materials for -...
45
www.sciencemag.org/content/344/6181/310/suppl/DC1 Supplementary Materials for The STAT3-Binding Long Noncoding RNA lnc-DC Controls Human Dendritic Cell Differentiation Pin Wang, Yiquan Xue, Yanmei Han, Li Lin, Cong Wu, Sheng Xu, Zhengping Jiang, Junfang Xu, Qiuyan Liu, Xuetao Cao* *Corresponding author. E-mail: [email protected] Published 18 April 2014, Science 344, 310 (2014) DOI: 10.1126/science.1251456 This PDF file includes: Materials and Methods Figs. S1 to S24 Table S1 Full Reference List
Transcript of Supplementary Materials for -...
www.sciencemag.org/content/344/6181/310/suppl/DC1
Supplementary Materials for
The STAT3-Binding Long Noncoding RNA lnc-DC Controls Human
Dendritic Cell Differentiation
Pin Wang, Yiquan Xue, Yanmei Han, Li Lin, Cong Wu, Sheng Xu, Zhengping Jiang,
Junfang Xu, Qiuyan Liu, Xuetao Cao*
*Corresponding author. E-mail: [email protected]
Published 18 April 2014, Science 344, 310 (2014)
DOI: 10.1126/science.1251456
This PDF file includes:
Materials and Methods
Figs. S1 to S24
Table S1
Full Reference List

2
Materials and Methods Cell isolation and culture
In vitro differentiation of human monocytes into Mo-DC was performed as
described with brief modification (29). Human peripheral blood mononuclear cells
(PBMCs) were isolated from buffy coats from Blood Center of Shanghai Changhai
hospital (Shanghai, China) through Ficoll-Hypaque (Mediatech Cellgro) density gradient
centrifugation. All human blood samples were collected with the informed consent of
healthy donors and the experiments were approved by the Ethics Committee of the
Second Military Medical University, Shanghai, China. Monocytes were purified from
PBMCs using anti-CD14 microbeads (Miltenyi Biotech) and then cultured at 37°C in 24-
well plates (5× 10⁵ cells per well) in 1 mL of RPMI-1640 Medium (PAA) with 10%
(vol/vol) FCS (PAA) containing 100 ng/mL human GM-CSF and 20 ng/mL human IL-4
(R&D Systems,Minneapolis, MN). Half medium was replaced by fresh medium with
GM-CSF and IL-4 at day 3 and day 5. Mo-DC were matured by 300ng/ml LPS (0111:B4,
Sigma) on day 5 and harvested on day 7 or the indicated time.
Human monocyte-derived macrophages (Mo-MΦ) were obtained from monocytes
cultured in RPMI-1640 medium with 10% (vol/vol) FCS containing 20 ng/mL human M-
CSF (R&D Systems).
Other human primary immune cell subsets were sorted by MoFlo (DACO
Cytomatix, Denmark) from PMBCs.
HEK293T and THP1 cell line were from American Type Culture Collection
(Manassas, VA) and cultured as required.
Mouse bone marrow-derived DCs were generated as following: BM cells were
purified from mouse BM and cultured in RPMI-1640 medium with 10% (vol/vol) FCS
containing 200 ng/ml mouse Flt3L (PeproTech, London, UK) for 7 days at 1×10⁶/ml in
24-well plates unless otherwise noted.
HTA 2.0 transcriptome microarray assay
Total RNA was isolated with Trizol from cells at indicated time point in the process
of Mo-DC development from human peripheral monocytes in GM-CSF/IL-4 culture.
RNAs from three donors with equal amount were pooled together to get each time point
sample. Biotinylated cDNA were prepared according to the standard Affymetrix protocol
3
from 250 ng total RNA by using Ambion® WT Expression Kit. Following labeling, 5.5
ug of cDNA were hybridized for 16 hr at 45℃ on GeneChip Human Transcriptome
Array 2.0 in Hybridization Oven 645. GeneChips were washed and stained in the
Affymetrix Fluidics Station 450. GeneChips were scanned by using Affymetrix®
GeneChip Command Console (AGCC) which installed in GeneChip® Scanner 3000 7G.
The data were analyzed with Robust Multichip Analysis (RMA) algorithm using
Affymetrix default analysis settings and global scaling as normalization method. Values
presented are log2 RMA signal intensity.
For transcriptome assay once lnc-DC knockdown, monocytes were transfected with
lnc-DC RNAi lentivirus or the control lentivirus at MOI=100 then cultured in GM-
CSF/IL-4 medium for 7 days. RNA were collected and subjected to similar HTA 2.0
microarray detection.
For transcriptome assay with STAT3 inhibition, monocytes were cultured in GM-
CSF/IL-4 medium supplemented with STAT3 inhibitor S3I-201 (200µM) or equal
volume DMSO for 7 days. RNA components were subjected to similar HTA 2.0
microarray assay.
Heat maps representing differentially regulated genes were generated using Cluster
3.0.
These microarray data had been deposited on GEO public database under the
accession number GSE54143.
RNA-seq detection and analysis
Total RNA was isolated with Trizol from monocytes and Mo-DC (day 7). RNAs
from three donors with equal amount were pooled together to get monocytes and Mo-DC
samples. Illumina TruSeq RNA Sample Prep Kit (Cat#FC-122-1001) was used with 1 ug
of total RNA for the construction of sequencing libraries. RNA libraries were prepared
for sequencing using standard Illumina protocols. At the data processing step, basecalls
were performed using CASAVA and sequenced reads were trimmed for adaptor
sequence, and masked for low-complexity or low-quality sequence. Reads Per Kilobase
of exon per Megabase of library size (RPKM) were calculated using a protocol from
Chepelev et al., Nucleic Acids Research, 2009. In short, exons from all isoforms of a
gene were merged to create one meta-transcript. The number of reads falling in the exons

4
of this meta-transcript were counted and normalized by the size of the meta-transcript and
by the size of the library.
These RNA-seq data had been deposited on GEO public database under the
accession number GSE54401.
Quantitative real time PCR (RT-PCR) assay
SYBR RT-PCR kit (Takara) and LightCycler (Roche) were used for quantitative
RT-PCR analysis as described (30). Data were normalized to β-actin expression or to IgG
control. Primer sequences are available upon request.
Flow cytometric analysis
Cells were stained using indicated Abs with the Cytofix/Cytoperm kit (eBioscience)
according to the manufacturer’s instructions (31). Flow cytometry analysis was carried
out on FACSVerse flow cytometry (BD Biosciences). Fluorescent Abs were from R&D
Systems.
Plasmid constructions
Recombinant vectors encoding human STAT3 (NM_139276.2), Jak2
(NM_004972.3) or PU.1 (NM_001080547.1; GenBank accession numbers in
parentheses) and mutants thereof were constructed by PCR-based amplification from
cDNA of human PBMCs and then subcloned into the pcDNA3.1 eukaryotic expression
vector (Invitrogen) as described (30). STAT3 luciferase reporter plasmid was constructed
by inserting STAT3 response elements (5′- TGC TTC CCG AAC GTT GCT TCC CGA
ACG TTG CTT CCC GAA CGT TGC TTC CGA ACG T -3′) before the luciferase
sequence of pGL-basic (Promega). Luciferase reporter plasmid for NF-κB had been
described previously (32). lnc-DC expression vector was constructed by PCR-based
amplification from cDNA of human PBMC and then subcloned into pCDF1 cDNA
Cloning and Expression Lentivectors (System Biosciences). All constructs were
confirmed by DNA sequencing.
Knockdown and Overexpression
The target sequences of lnc-DC, shared by both transcript variants, were 5′- GAG
TTA TCT TAA GGA TCA T -3′ for RNAi-1 and 5′- GGA GTT CCT TGA CTA GG -3′
for RNAi-2 (bolded and underlined in the following lnc-DC sequences); the scrambled
control sequence was 5′- TTC TCC GAA CGT GTC ACG T-3′. And these sequences
5
were clone into lentivirual shRNA expression vector pSIF-H1. For overexpression assay,
lnc-DC variant-1 sequence cloned into lentivirual expression vector pCDF1. Then
lentiviruses were generated with Lentivector Expression Systems (System Biosciences).
Transduction efficiency (MOI=100) was determined by GFP expression to be over 80%
and knockdown efficiency was measured by qPCR to be about 70% down.
>human lnc-DC variant-1 transcript (GenBank accession number: KJ020271)
GTGTTTTTCCAAAGCCTTCCAACAGCAACATGAAGTTGGCAGCCTTCCTC
CTCCTGTGATCCTCATCATCTTCAGCCTAGAGGTACAAGAGCTTCAGGCTGCA
GGAGACCGGCTTGGTACCTGCGTCGAGCTCTGCACAGGTGACTGGGACTGCA
ACCCCGGAGACCACTGTGTCAGCAATGGGTGTGGCCATGAGTGTGTTGCAGG
GTAAGGACAGATGAAGAGTTATCTTAAGGATCATCTTTCCCTAAGATCGTCAT
CCCTTCCTGGAGTTCCTATCTTCCAAGATGTGACTGTCTGGAGTTCCTTGACTA
GGAAGATGGATGAAAACAGCAAGCCTGTGGATGGAGACTACAGGGGATATG
GGAGGCAGGGAAGAGGGGTTGTTTCTTTTAATAAATCATCATTGTTAAAAGC
>human lnc-DC variant-2 transcript (GenBank accession number: KJ020272)
AAGAAAAATGTAGAACTGACTTCTTAATCAAGGGCTGTTCTCCCTAGCAT
CTGTCCCAAAAGTACGGTGGTTTTCAGCACATCCGTTCTTCCATAGGTACCTG
CGTCGAGCTCTGCACAGGTGACTGGGACTGCAACCCCGGAGACCACTGTGTC
AGCAATGGGTGTGGCCATGAGTGTGTTGCAGGGTAAGGACAGATGAAGAGTT
ATCTTAAGGATCATCTTTCCCTAAGATCGTCATCCCTTCCTGGAGTTCCTATCT
TCCAAGATGTGACTGTCTGGAGTTCCTTGACTAGGAAGATGGATGAAAACAG
CAAGCCTGTGGATGGAGACTACAGGGGATATGGGAGGCAGGGAAGAGGGGT
TGTTTCTTTTAATAAATCATCATTGTTAAAAGC
Mouse lnc-DC ortholog (Gene symbol 1100001G20Rik) knockdown was also
mediated through lentivirus shRNA system from Lift Technology. Target sequence of
RNAi-1 was 5′-CAG TCA CAT CTG TAC TAC AAA -3′ and targeting sequence of
RNAi-2 was 5′- GAG GAA CAA TGT GTC AGT ATT -3′ (both were bolded and
underlined in the following sequences).
>mouse linc-DC ortholog 1100001G20Rik
TTGCTGCCTAGCTCAGTGGGTGAAGAGGTTTAAATTCTGGCAGCTCTTGG
CCCTGCTGCGTATTGGCTAACATCCTTCAGCAGCAGCATGAAGCTAGGAGCC
6
TTCCTTCTGTTGGTGTCCCTCATCACCCTCAGCCTAGAGGTACAGGAGCTGCA
GGCTGCAGTGAGACCTCTGCAGCTTTTAGGCACCTGTGCTGAGCTCTGCCGTG
GTGACTGGGACTGTGGGCCAGAGGAACAATGTGTCAGTATTGGATGCAGTCAC
ATCTGTACTACAAACTAAAAACAGCTTCTACCTGGAAAAAAAAATGTGTCTGT
TTGGAGCTCTGTGACCAAGAAAACAGTTGAAAATGGAGGCCATGTATGGAGA
TTACAAGCAGCACAGTGGAGTGGGACAAGGAGTTGTTTCTTTTAATAAATCA
TTAATGTAAAAGTCTCAACAAAAAAAAAAAAAAA
Cytokine detection
Human IL-2, IL-10, IL-12p70 and IFN-γ in supernatants were measured with
ELISA kits (R&D Systems).
Cell nucleus/cytoplasm fraction isolation
For cytoplasmic fraction, cells were washed with ice-cold PBS for two times then
lysed in 0.1% NP40 ice-cold PBS with protease inhibitor cocktail (Calbiochem, La Jolla,
CA) and Ribonucleoside Vanadyl Complex (10mM) (New England BioLabs), and after
short centrifugation, the supernatant was collected as cytoplasmic fraction and the
remainder with additional washing were considered as nuclear pellets.
Immunoblot and immunoprecipitation (IP/RIP)
Cells were lysed with cell lysis buffer (Cell Signaling Technology) supplemented
with protease inhibitor cocktail (Calbiochem, La Jolla, CA). Protein concentrations of the
extracts were measured by bicinchoninic acid assay (Pierce). Forty micrograms of the
protein was used for immunoprecipitation or was loaded per lane, subjected to SDS-
PAGE, transferred onto nitrocellulose membranes, and then blotted. For
immunoprecipitation (RIP) assay and RNA pull-down assay (33), SUPERase•In™ RNase
Inhibitor (1000U/ml, Ambion) and protease inhibitor were added into cell lysis buffer,
and Ribonucleoside Vanadyl Complex (10mM, New England BioLabs) was added into
washing buffer. Abs specific to human STAT1, phosphrilated-STAT1(Y701), STAT3,
phosphrilated-STAT3(Y705), STAT5 and HRP-coupled secondary Abs were from Cell
Signaling Technology (Beverly, MA), SHP1 Ab was from Santa Cruz Biotechnology
(Santa Cruz, CA), and phosphrilated-STAT5 and β-actin Abs were from Bioworld
Technology (St. Louis, MO).
RNA pull-down assay
7
In vitro, biotin-labeled RNAs were transcribed with the Biotin RNA Labeling Mix
(Roche) and T7 RNA polymerase (Promega), treated with RNase-free DNase I
(Promega) and purified with RNeasy Mini Kit (QIAGEN). 3 µg of biotinylated RNA in
RNA structure buffer (10 mM Tris pH 7, 0.1 M KCl, 10 mM MgCl2) was heated to 95°C
for 2 min, put on ice for 3 min, and then left at room temperature (RT) for 30 min to
allow proper secondary structure formation. Folded RNA was then mixed with human
Mo-DC cytoplasm extract (containing 1 mg proteins) in 500 µl RIP buffer and then
incubated at RT for one hour. 50 µl washed Streptavidin agarose beads (Invitrogen) were
added to each binding reaction and further incubated at RT for another one hour. Beads
were washed briefly with RIP buffer for five times and boiled in SDS buffer. Then the
retrieved proteins were detected by Western blot or resolved in gradient gel
electrophoresis followed by mass spectrometry (MS) identification.
Northern blot assay and rapid amplification of cloned cDNA ends (RACE)
Total RNA extracted from human mature DC was subjected to Northern Blot assay
(Ambion, Austin, TX) and RACR PCR (Ambion, Austin, TX) according to
manufacturer’s specifications. Biotin-labeled blots were detected with the
Chemiluminescent Nucleic Acid Detection Module (Thermo).
Chromatin immunoprecipitation combined with quantitative PCR (ChIP-
qPCR) or sequencing (ChIP-seq) and chromatin accessibility analysis
ChIP analyses were performed on chromatin extracts from monocytes, Mo-DC (day
7) and other indicated cells according to manufacturer’s standard protocol (Beyotime
Institute of Biotechnology) with the following antibodies: RNA Polymerase II (Pol II),
acetyl-Histone H3 (Lys27), trimethyl-Histone H3 (Lys4), and PU.1 (Cell Signaling
Technology). A standard curve was generated for each primer pair testing 5 fold dilutions
of input samples. Fold enrichment was quantified using quantitative RT-PCR and
calculated as a percentage of Input chromatin (% Inp). For ChIP-seq experiments,
sequence reads were mapped to the current human reference sequence (GRCh37/hg19)
with Bowtiewith default parameters, and clonal reads were removed from further
analysis. ChIPseeqer (Giannopoulou and Elemento, 2011) was used for peak detection,
annotation, comparison between different lists of peaks, pathway analysis, and peak
8
clustering. Data in wig format were viewed in UCSC custom track. ChIP-seq data were
deposited in the GEO database with accession number GSE43036.
For chromatin accessibility analysis (DNase I sensitivity assays), nucleus of
monocytes, Mo-DCs (day 7) or other indicated cells were treated with DNase I (0.1U/µl,
Promega) at 37℃ for 30 min stopped by adding EDTA (50mM). Genome DNA were
extracted and subjected to Quantitative RT-PCR assay. Fold change for lnc-DC gene loci
are concluded using 2ΔCt with respect to monocytes that are set to a value of 1 and fold
change for CD300E gene are concluded using 2ΔCt with respect to Mo-DC that are set to a
value of 1. Primer sequences are available upon request.
Assay of luciferase reporter gene expression
HEK293T cells were transfected with a mixture of the appropriate luciferase
reporter plasmid as indicated, pRL-TK-renilla-luciferase plasmid and the appropriate
additional constructs. The total amount of transfected DNA plasmids were made equal by
the addition of empty control vector. After 24 hours, cells were collected. Luciferase
activity was measured using Dual-Luciferase Reporter Assay System according to the
manufacturer’s instructions (Promega). Data were normalized for transfection efficiency
by the division of firefly luciferase activity with that of renilla luciferase (32).
RNA fluorescence in situ hybridization (FISH) and immunofluorescence
microscopy
To detect lnc-DC RNA, cells were rinsed briefly in PBS and then fixed in 3.6%
formaldehyde plus 10% acetic acid in PBS (pH 7.4) for 15 min at room temperature.
Cells were permeabilized in PBS containing 0.2%–0.5% Triton X-100 and 5 mM vanadyl
ribonucleoside complex (10mM) (New England BioLabs) on ice for 5 min, washed in
PBS 3× 10 min and rinsed once in 2× SSC buffer. Hybridization was carried out using
DNA probe sets (Biosearch Technologies) in a moist chamber at 37℃ for 12–16 hours
according to the protocol for adherent mammalian cell lines from Biosearch
Technologies. For co-localization studies, after RNA-FISH, cells were again fixed for 5
min in 2% formaldehyde, and subjected to immunofluorescence. Imaging were
performed as described (32). Cells were observed with a Leica TCS SP2 confocal laser
microscopy.
Mixed lymphocyte reactions (MLR)
9
CD4+ T lymphocytes were purified from PBMCs using anti-CD4 microbeads
(Miltenyi Biotech). For allogeneic DC-T cell MLR assay, T cells (1× 10⁵) were cultured
with allogeneic Mo-DC pretreated as described at 10:1 or 50:1 ratio, and 5 days later
proliferation was assessed by measuring CD4+ T cell number with CountBright™
absolute counting beads (Invitrogen) using flow cytometry, and the supernatants were
used for detection of activated T cell related cytokines IFN-γ and IL-2 by ELISA.
Bioinformatics analysis
Examination of ALU element in the sequence of lnc-DC was performed on
bioinformatics website (http://www.repeatmasker.org/cgi-bin/WEBRepeatMasker).
Microarray data of human periphery immune cell subsets were downloaded from
Gene Expression Omnibus (GEO) (http://www.ncbi.nlm.nih.gov/geo/) under accession
number GSE28490 (34). Raw data were analyzed with MAS5 in Expression Console and
then logarithmic transformed. The probe sets used in the cluster map of fig S3 were as
following: 229566_at for lnc-DC; 201743_at for CD14; 206398_s_at for CD19;
210895_s_at for CD86; 215332_s_at for CD8B; 204440_at for CD83; 206120_at for
CD33; 209795_at for CD69; 206337_at for CCR7; 210164_at for GZMB; 202859_x_at
for IL8; 214032_at for ZAP70; 205456_at for CD3E; 221491_x_at for HLA-DR;
205786_s_at for CD11B; 210184_at for CD11C; 205987_at for CD1C.
Normalized probe-level expression data of human monocyte/DC subsets from blood
and skin were downloaded from GEO Series Matrix Files under accession number
GSE35457 (23) and probe set for lnc-DC was ILMN_3200140, HEATR6 was
ILMN_1791106, CA4 was ILMN_1695157.
In vivo DC development in BM-reconstituted mice
Lin- BM cells were purified from CD45.2+ or CD45.1+ mouse BM cells using
MACS Lineage Cell Depletion Kit (Miltenyi Biotech) according to the manufacture’s
instruction and then cultured with lnc-DC RNAi lentivirus or its control lentivirus at
MOI=100 for 6 hour. After washed with PBS for three times, CD45.1+ Lin- BM cells
with lnc-DC RNAi lentivirus and CD45.2 cells with control lentivirus, or vice versa, were
mixed at a ratio of 1:1 and then transferred via caudal vein into lethally X ray- irradiated
mice. 3 weeks after reconstitution, these bone marrow chimeric mice were euthanized,

10
spleens were extracted and the ratio of CD45.1+ / CD45.2+ cDC were analyzed with flow
cytometry in spleen.
Nanospray liquid chromatography–tandem mass spectrometry (MS)
Biotinylated lnc-DC or antisense RNA in vitro transcribed with T7 RNA polymerase
(Promega) were incubated with human Mo-DC cytoplasm extract, targeted by
streptavidin agarose beads (Invitrogen), and washed with 1 ml RIP buffer (150 mM KCl,
25 mM Tris pH 7.4, 0.5 mM DTT, 0.5% NP40, 1 mM PMSF and protease Inhibitor
(Roche Complete Protease Inhibitor Cocktail Tablets)) 4× 10 min, and associated
proteins were resolved in gradient gel electrophoresis (35). Different bands were cutout.
Proteins were eluted and digested. Digests were analyzed by nano-ultra-performance
liquid chromatography–electrospray ionization tandem mass spectrometry (MS). Data
from liquid chromatography–tandem mass spectrometry (MS) were processed through
the use of ProteinLynx Global Serverversion 2.4 (PLGS 2.4); the resulting peak lists were
used for searching the NCBI protein database with the Mascot search engine.
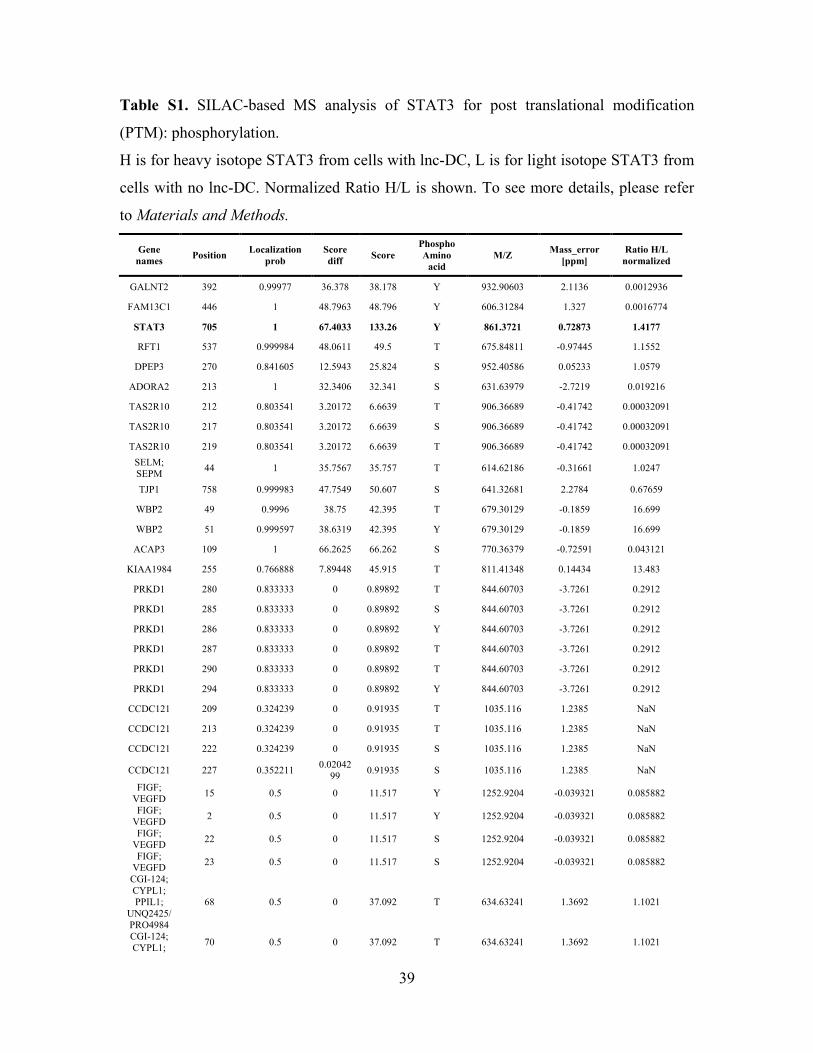
SILAC-based MS analysis of STAT3 post translational modification
Basically, it was carried out according to manufacturer’s protocol (Pierce® SILAC
Protein Quantitation Kits, Thermo SCIENTIFIC) with a few modifications. HEK293T
cells were grown in light isotope-containing medium (293T-L) or in heavy isotope-
containing medium (293T-H) for 20 days. Then these cells were co-transfected with
STAT3-Flag and JAK2 expression vectors along with lnc-DC expression vector for
293T-H or the control vector pCDF1 for 293T-L. 36 hours later, cells were lysed and
Flag-tagged STAT3 were immunoprecipitated with Flag-specific antibody from 293T-L
and 293T-H. These STAT3-H and STAT3-L protein samples were mixed and, after
stringently washing, were subjected to PAGE gel electrophoresis. STAT3 band were cut
and analyzed with MS for post translational modification. Phosphorylated peptides and
phosphorylation sites were identified and quantified for the ratio of H/L. So, in the result
(fig. S20 and Table S1), H is for STAT3 with lnc-DC and L is for STAT3 with no lnc-DC.
In vitro assay of STAT3 dephosphorylation
Phosphorylated human STAT3 were immunoprecipitated with anti-Flag gel beads
(Sigma) from HEK293T lysates after 24 hours cotransfection with STAT3 and Jak2
expression vectors. After stringently washing, immunoprecipitated STAT3 was incubated
11
with recombined human SHP1 (R&D Systems) according to manufactures instruction in
the present of indicated RNA or not.
Statistical analysis
The statistical significance of comparisons between two groups was determined with
Student’s t-test. P values of less than 0.05 were considered statistically significant.
Pearson correlation analysis was performed with GraphPad Prism 5.
12
Supplementary Figures:
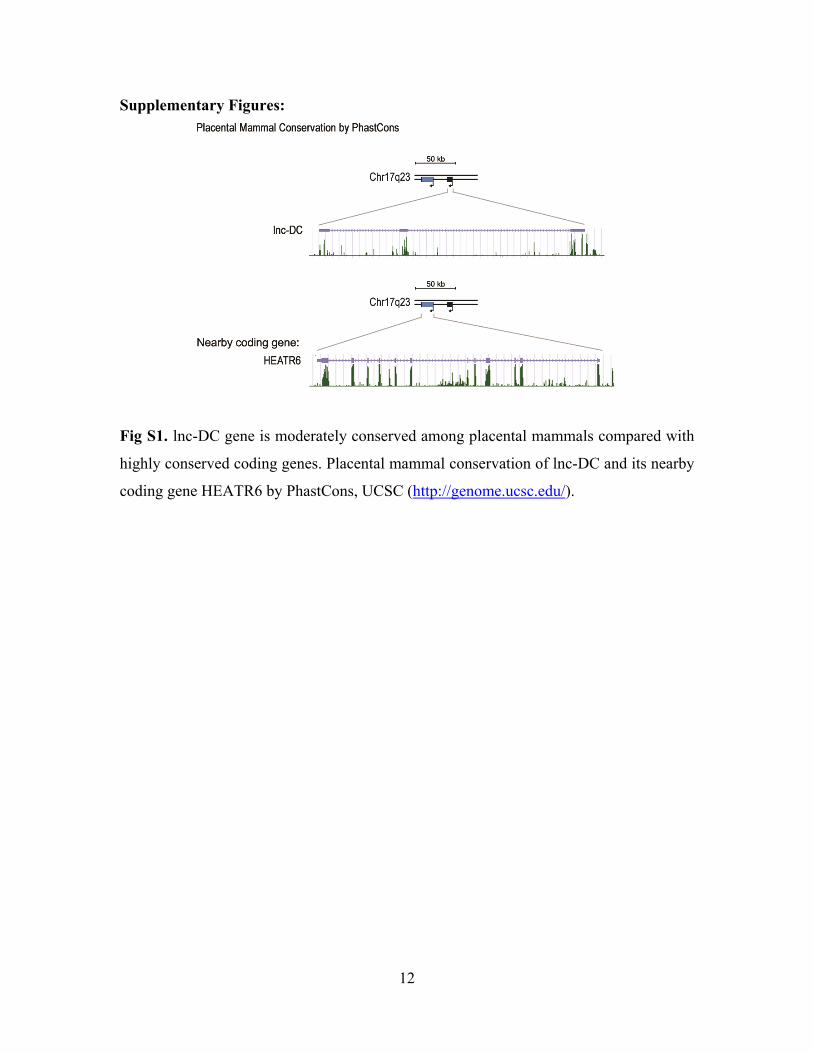
Fig S1. lnc-DC gene is moderately conserved among placental mammals compared with
highly conserved coding genes. Placental mammal conservation of lnc-DC and its nearby
coding gene HEATR6 by PhastCons, UCSC (http://genome.ucsc.edu/).

13
Fig S2. lnc-DC expression data from ENCODE RNA-seq project (24). Data are shown as
reads density around lnc-DC gene loci from UCSC gnome browser. H1-hESC, human
embryonic stem cells; LHCN-M2, skeletal myoblast cell line; CD14 cells, monocytes;
CD20 cells, B cells; CD34 cells, mobilized hematopoietic progenitor cells in human
periphery blood.
14
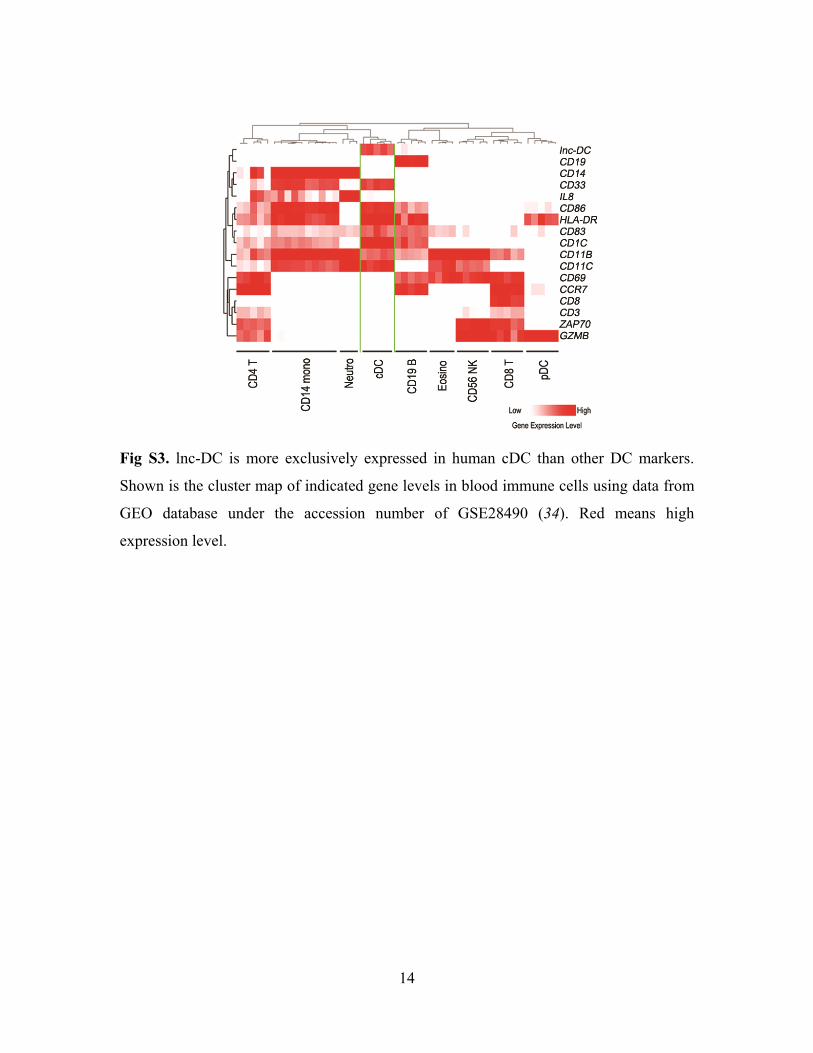
Fig S3. lnc-DC is more exclusively expressed in human cDC than other DC markers.
Shown is the cluster map of indicated gene levels in blood immune cells using data from
GEO database under the accession number of GSE28490 (34). Red means high
expression level.
15
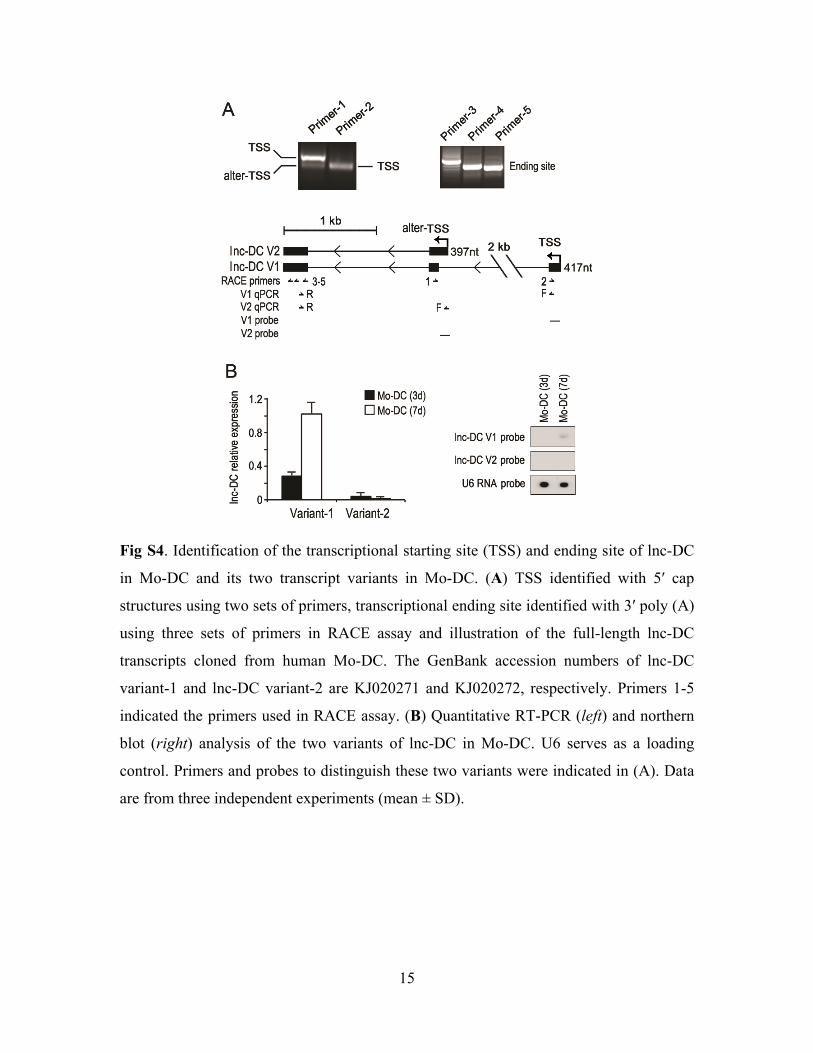
Fig S4. Identification of the transcriptional starting site (TSS) and ending site of lnc-DC
in Mo-DC and its two transcript variants in Mo-DC. (A) TSS identified with 5′ cap
structures using two sets of primers, transcriptional ending site identified with 3′ poly (A)
using three sets of primers in RACE assay and illustration of the full-length lnc-DC
transcripts cloned from human Mo-DC. The GenBank accession numbers of lnc-DC
variant-1 and lnc-DC variant-2 are KJ020271 and KJ020272, respectively. Primers 1-5
indicated the primers used in RACE assay. (B) Quantitative RT-PCR (left) and northern
blot (right) analysis of the two variants of lnc-DC in Mo-DC. U6 serves as a loading
control. Primers and probes to distinguish these two variants were indicated in (A). Data
are from three independent experiments (mean ± SD).

16
Fig S5. lnc-DC RNA has poly A tail and 5’ cap structure and has no coding capability.
(A) Left: lnc-DC is examined in RT-PCR assay with polyA+ RNA fraction and polyA-
RNA fraction from Mo-DC. Right: total RNA from Mo-DC were treated whit Calf
Intestine Alkaline Phosphatase (CIP) to remove free 5’-P then treated with Tobacco Acid
Pyrophosphatase (TAP) to remove the cap structure and then a RNA adapter
oligonucleotide was ligated to the RNA population using T4 RNA ligase (FistChoice
RLM-RACE Kit, Ambion). Finally RT-PCR with gene specific primers was used to
detect lnc-DC. (B) Full-length lnc-DC was cloned into the eukaryotic expression vector
pcDNA3.1 with N-terminal start codon ATG and C-terminal Flag tag in all three coding
patterns and these plasmids subsequently transfected into HEK293T cells separately.
After 48 hours, immunoblotting was used to detect the Flag-tagged protein. HDAC11
with Flag tag severs as a positive control. Data are representative of three independent
experiments. Bioinformatics analysis also confirmed lnc-DC had no coding capability
(36) (http://cpc.cbi.pku.edu.cn/programs/run_cpc.jsp).

17
Fig S6. H3K4me3 and H3K27ac modifications and chromatin accessibility of lnc-DC
gene remain at low levels during the differentiation and activation of Mo-MΦ. Nine
regions (capital letters A-I) across lnc-DC gene locus were analyzed in ChIP-qPCR
analyses for H3K4me3 and H3K27ac histone modification in human monocytes, Mo-MΦ
(day 5) and LPS-activated Mo-MΦ (300ng/ml, 24 hours). Values derived from three
independent experiments were normalized by background signals (IgG) and presented as
percentage of Input chromatin (% Inp). And chromatin accessibility or DNase I
sensitivity was revealed by DNA sequence integrality (Ct values in quantitative RT-PCR)
after DNase I treatment of chromatin. Changed fold were concluded using 2ΔCt with
respect to monocytes set to a value of 1. Statistical significance is calculated with respect
to monocytes. *P < 0.05 and **P < 0.01 (Student’s t-test). Data are from three
independent experiments (mean ± SD).

18

19
Fig S7. DNase I hypersensitivity (DNase I HS) data (A) and histone modification data (B)
on lnc-DC gene loci from ENCODE project (37, 38). Data are shown as reads density
mapping on lnc-DC gene loci from UCSC gnome browser. H1-hESC, human embryonic
stem cells; LHCN-M2, skeletal myoblast cell line; CD14 cells, monocytes; CD20 cells, B
cells; CD34 cells, mobilized hematopoietic progenitor cells.

20
Fig S8. lnc-DC knockdown leads to markedly changes on genome expression profile.
Shown is the cluster heat map of 664 coding genes with significantly altered expression
when lnc-DC was knockdown (log 2 fold >1,P <0.05) in cells after 7 days’ DC culture.
21
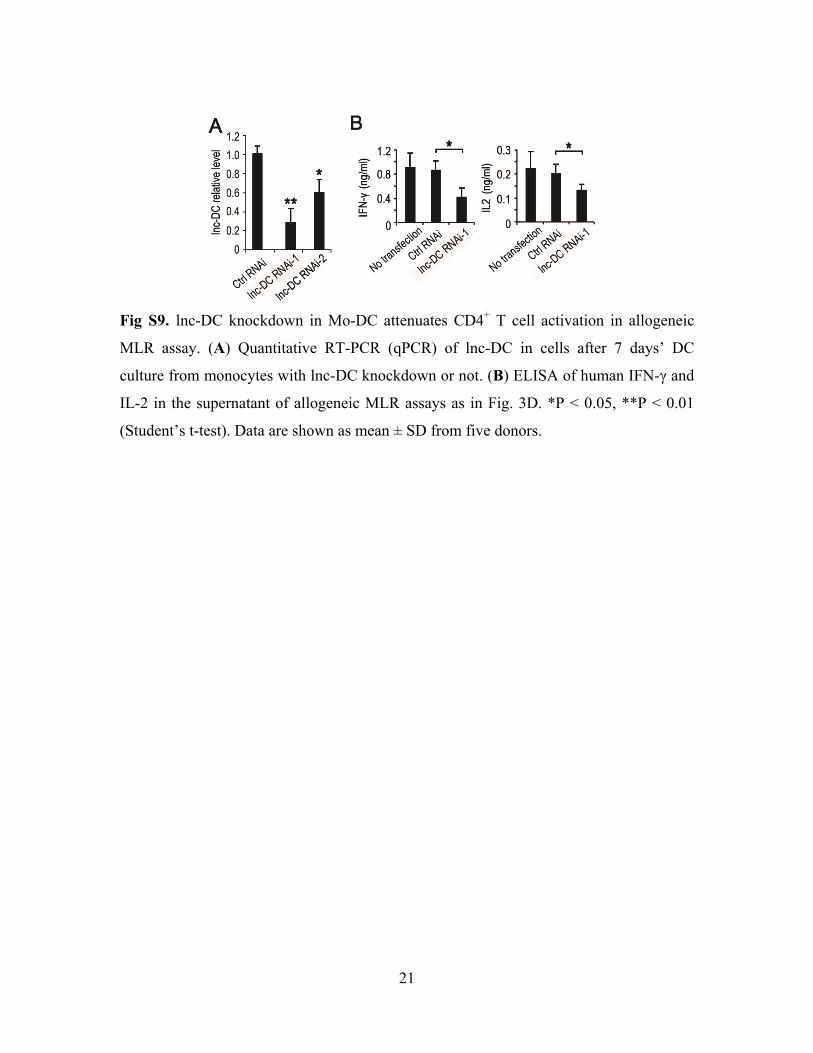
Fig S9. lnc-DC knockdown in Mo-DC attenuates CD4+ T cell activation in allogeneic
MLR assay. (A) Quantitative RT-PCR (qPCR) of lnc-DC in cells after 7 days’ DC
culture from monocytes with lnc-DC knockdown or not. (B) ELISA of human IFN-γ and
IL-2 in the supernatant of allogeneic MLR assays as in Fig. 3D. *P < 0.05, **P < 0.01
(Student’s t-test). Data are shown as mean ± SD from five donors.
22
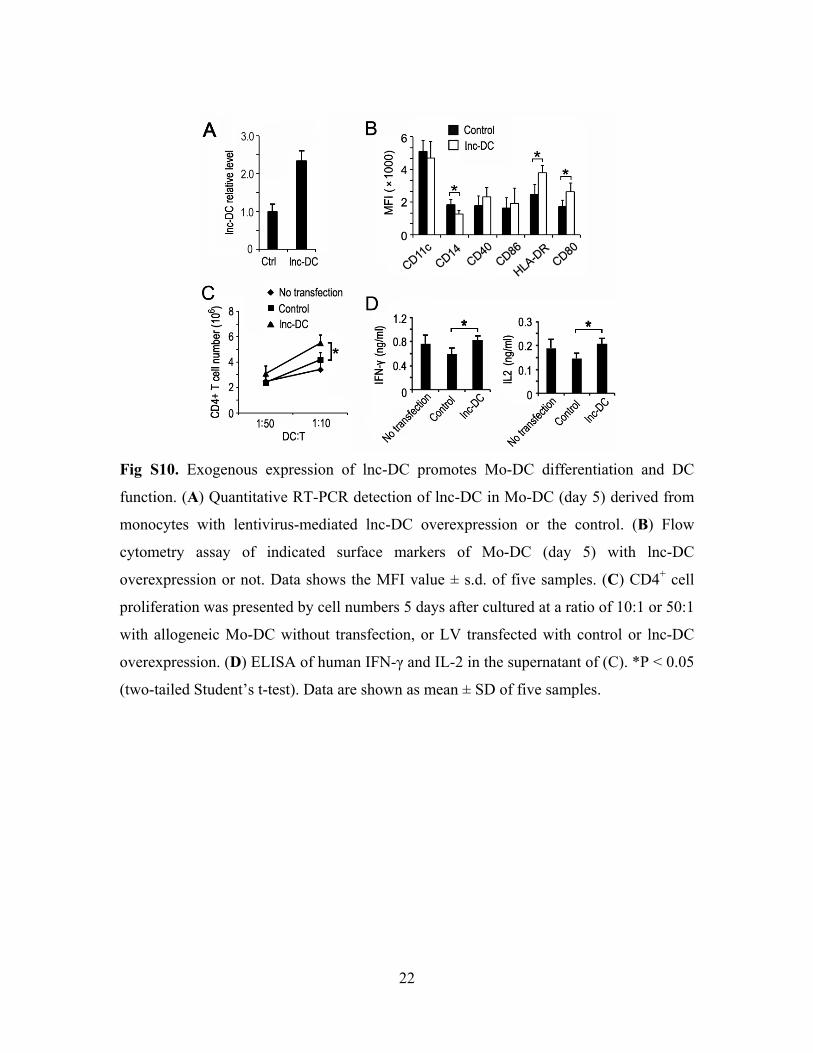
Fig S10. Exogenous expression of lnc-DC promotes Mo-DC differentiation and DC
function. (A) Quantitative RT-PCR detection of lnc-DC in Mo-DC (day 5) derived from
monocytes with lentivirus-mediated lnc-DC overexpression or the control. (B) Flow
cytometry assay of indicated surface markers of Mo-DC (day 5) with lnc-DC
overexpression or not. Data shows the MFI value ± s.d. of five samples. (C) CD4+ cell
proliferation was presented by cell numbers 5 days after cultured at a ratio of 10:1 or 50:1
with allogeneic Mo-DC without transfection, or LV transfected with control or lnc-DC
overexpression. (D) ELISA of human IFN-γ and IL-2 in the supernatant of (C). *P < 0.05
(two-tailed Student’s t-test). Data are shown as mean ± SD of five samples.
23
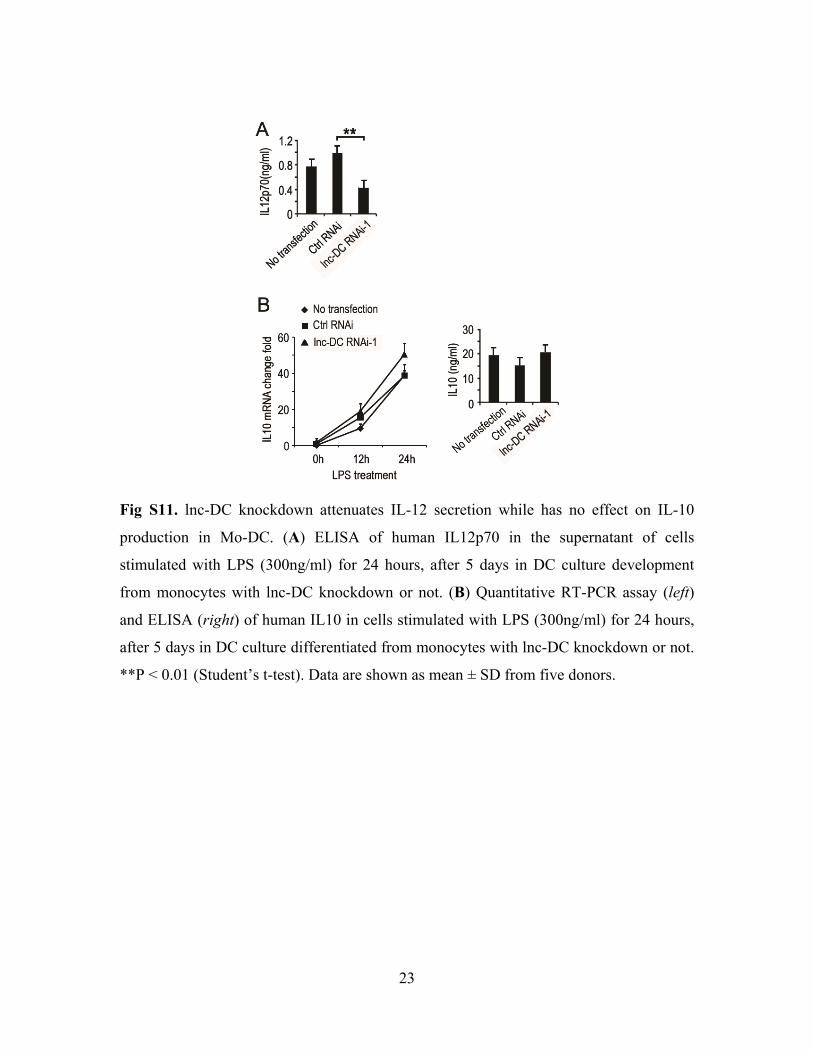
Fig S11. lnc-DC knockdown attenuates IL-12 secretion while has no effect on IL-10
production in Mo-DC. (A) ELISA of human IL12p70 in the supernatant of cells
stimulated with LPS (300ng/ml) for 24 hours, after 5 days in DC culture development
from monocytes with lnc-DC knockdown or not. (B) Quantitative RT-PCR assay (left)
and ELISA (right) of human IL10 in cells stimulated with LPS (300ng/ml) for 24 hours,
after 5 days in DC culture differentiated from monocytes with lnc-DC knockdown or not.
**P < 0.01 (Student’s t-test). Data are shown as mean ± SD from five donors.

24
Fig S12. lnc-DC knockdown has no effect on human DC apoptosis. (A) Flow cytometry
of Mo-DC (day 7) transfected with lnc-DC RNAi at day 3 or not and then analyzed for
apoptosis. (B) Immunoblot detection of apoptosis-related proteins in DCs transfected
with lnc-DC RNAi at day 3 or not, then stimulated with LPS (300ng/ml) at day 5 for
indicated time. Data are representative of three independent experiments.

25
Fig S13. Knockdown of lnc-DC ortholog in mouse bone marrow cells impairs Flt3L-
triggered STAT3 phosphorylation and mouse DC development in vitro and in vivo. (A)
qPCR detection of lnc-DC ortholog in bone marrow cells transfected with lentivirus
RNAi-1, RNAi-2, or control lentivirus at MOI=100 for 5 days. (B) Flow cytometry of
mouse bone marrow cells transfected with lnc-DC RNAi lentivirus or the control
lentivirus cultured for 5 days culture in vitro with mouse Flt3L (200ng/ml) and then
analyzed for the expression of CD11c and CD11b. Data are representative of three
independent experiments. Data are representative of three independent experiments. (C)
Lin- BM cells from CD45.1 or CD45.2 mice were transduced with lnc-DC RNAi
lentivirus or the control lentivirus separately, and then mixed at 1:1 ratio and i.v.
transferred into lethally irradiated mice. 3 weeks after reconstitution, splenocytes of these
BM chimeric mice were analyzed for CD11c+ MHC-II+ DC by flow cytometry. Data are
representative for 6 transfers. (D) Immunoblot detection of pSTAT3 in mouse BM cells
in Flt3L culture for 5 days with lentivirus-mediated mouse lnc-DC ortholog RNAi or its

26
control. Data are representative of three independent experiments. Data are representative
of three independent experiments.
27
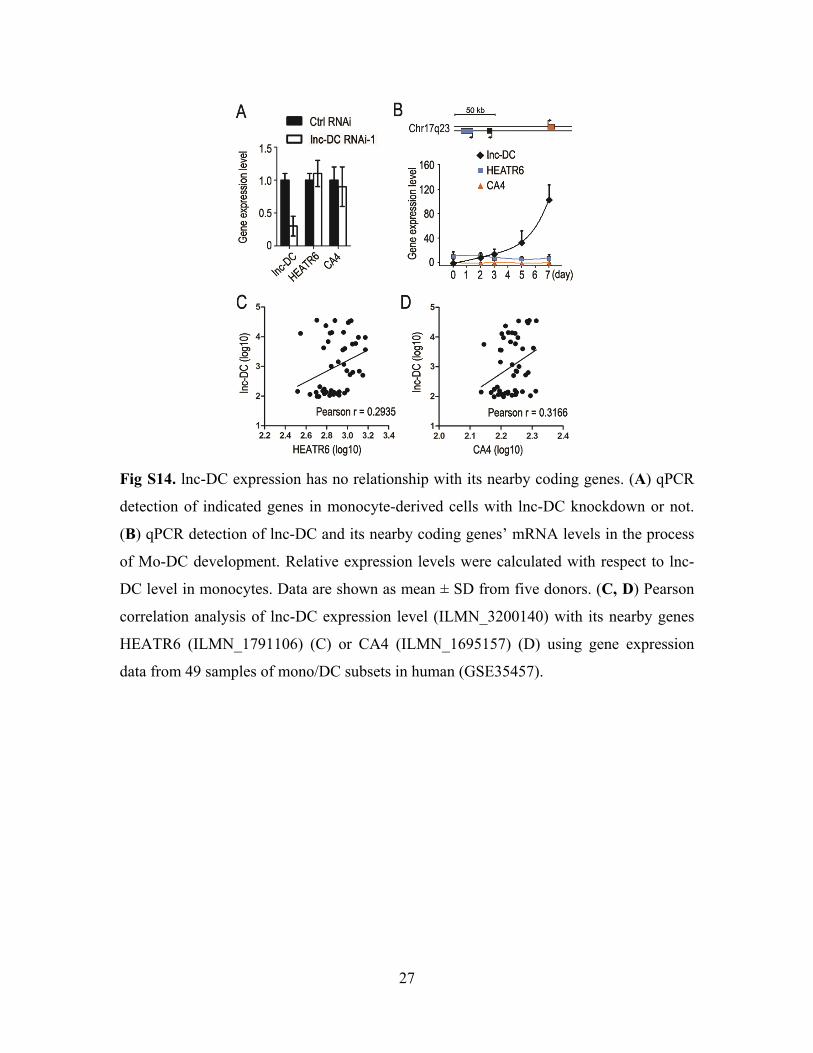
Fig S14. lnc-DC expression has no relationship with its nearby coding genes. (A) qPCR
detection of indicated genes in monocyte-derived cells with lnc-DC knockdown or not.
(B) qPCR detection of lnc-DC and its nearby coding genes’ mRNA levels in the process
of Mo-DC development. Relative expression levels were calculated with respect to lnc-
DC level in monocytes. Data are shown as mean ± SD from five donors. (C, D) Pearson
correlation analysis of lnc-DC expression level (ILMN_3200140) with its nearby genes
HEATR6 (ILMN_1791106) (C) or CA4 (ILMN_1695157) (D) using gene expression
data from 49 samples of mono/DC subsets in human (GSE35457).
28
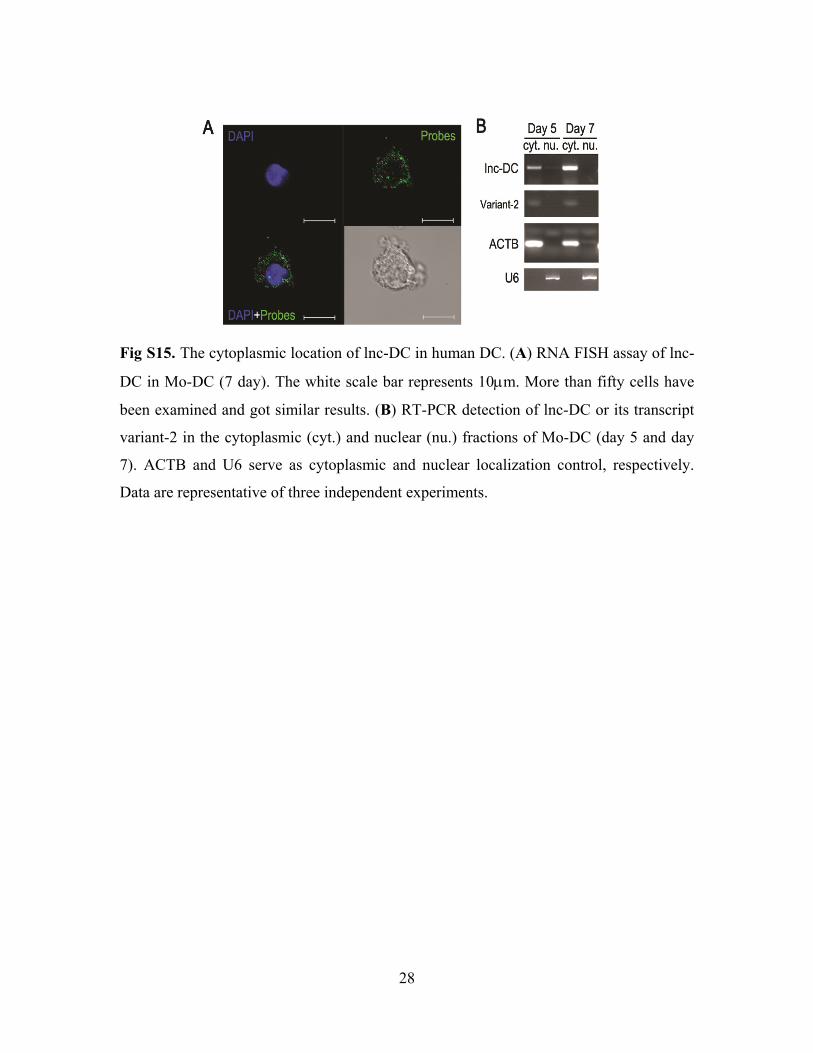
Fig S15. The cytoplasmic location of lnc-DC in human DC. (A) RNA FISH assay of lnc-
DC in Mo-DC (7 day). The white scale bar represents 10µm. More than fifty cells have
been examined and got similar results. (B) RT-PCR detection of lnc-DC or its transcript
variant-2 in the cytoplasmic (cyt.) and nuclear (nu.) fractions of Mo-DC (day 5 and day
7). ACTB and U6 serve as cytoplasmic and nuclear localization control, respectively.
Data are representative of three independent experiments.

29
Fig S16. lnc-DC dose not associate with AGO2 protein. Quantitative RT-PCR detection
of lnc-DC and SOCS1 mRNA in the immunoprecipitation by IgG or AGO2 specific
antibody from human Mo-DC lysates. SOCS1 mRNA, a validated target of miR-155,
serves as a positive control. Data are presented with respect to IgG that is set to a value of
1. **P < 0.01 (Student’s t-test). Data are shown as mean ± SD from three donors.

30
Fig S17. 3′-end structure of lnc-DC may be responsible for its interaction with STAT3.
(A) Immunoblot detection of STAT3 pull-downed by antisense, sense or truncated lnc-
DC from Mo-DC cytoplasmic lysates. Data are representative of three independent
experiments. (B) 3′-end segment of lnc-DC (265~417nt) is predicted to have a stable
stem-loop structure. Prediction of lnc-DC structure of a 265~417nt region and its
antisense sequence control based on minimum free energy (MFE) and partition function
(26). Color scale indicates the confidence for the prediction for each base with shades of
red indicating strong confidence. (http://rna.tbi.univie.ac.at/)
31
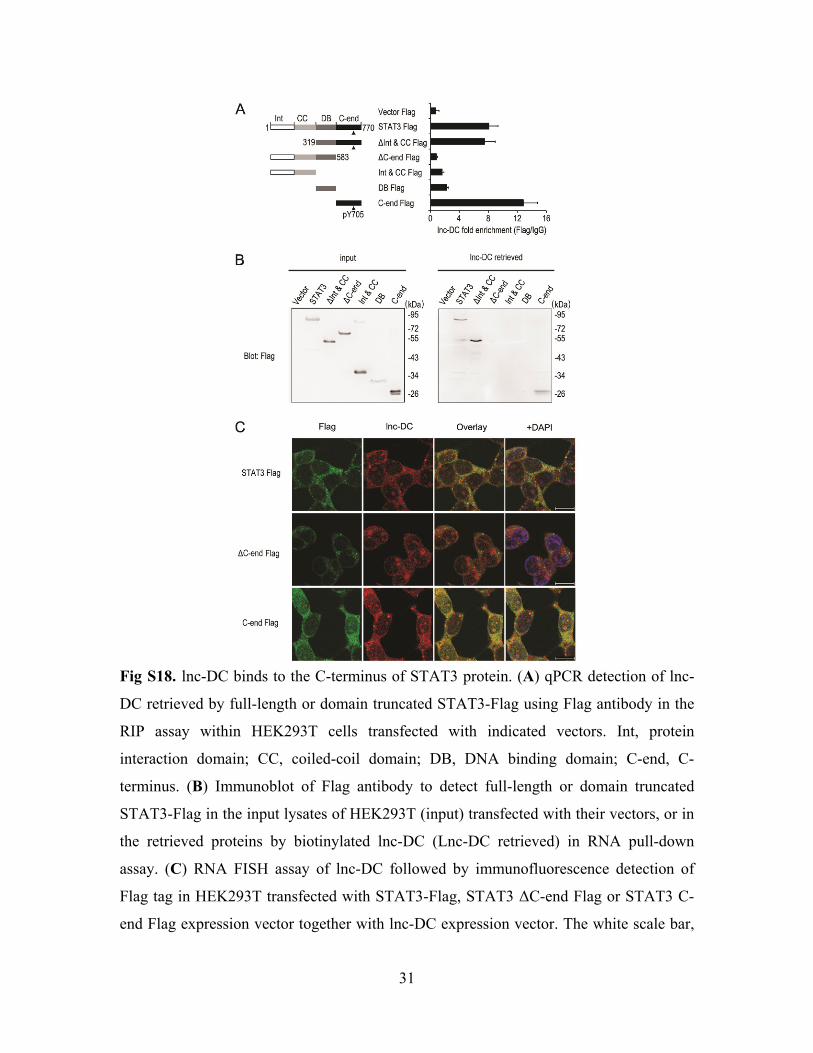
Fig S18. lnc-DC binds to the C-terminus of STAT3 protein. (A) qPCR detection of lnc-
DC retrieved by full-length or domain truncated STAT3-Flag using Flag antibody in the
RIP assay within HEK293T cells transfected with indicated vectors. Int, protein
interaction domain; CC, coiled-coil domain; DB, DNA binding domain; C-end, C-
terminus. (B) Immunoblot of Flag antibody to detect full-length or domain truncated
STAT3-Flag in the input lysates of HEK293T (input) transfected with their vectors, or in
the retrieved proteins by biotinylated lnc-DC (Lnc-DC retrieved) in RNA pull-down
assay. (C) RNA FISH assay of lnc-DC followed by immunofluorescence detection of
Flag tag in HEK293T transfected with STAT3-Flag, STAT3 ΔC-end Flag or STAT3 C-
end Flag expression vector together with lnc-DC expression vector. The white scale bar,

32
10µm. Int, protein interaction domain; CC, coiled-coil domain; DB, DNA binding
domain; C-end, C-terminal domain. Data are representative of three independent
experiments. Data are representative of three independent experiments or are shown as
mean ± SD from three experiments.

33
Fig S19. lnc-DC promotes STAT3 signaling. (A) Immunofluorescence detection of
STAT3 nuclear translocation in Mo-DC, 3 days after transfection with lnc-DC RNAi or
control RNAi. Scale bar, 10µm. (B) Luciferase activity in lysates of HEK293T cells
transfected with STAT3 response elements luciferase reporter plasmid (STAT3 RE luc)
or NF-κB luciferase reporter plasmid (NF-κB luc), together with increasing
concentrations (wedge) of lnc-DC expression vector, after 24 hours stimulation with
rhIL-6 (50ng/ml), Data are normalized by renilla luciferase activity and presented with
respect to no lnc-DC samples. NF-κB luciferase reporter serves as a negative control. (C)
Immunoblot detection of pSTAT3 in THP-1 transfected with lnc-DC or its 3’ segment
expression vector, or the control vector for 24 hours. **P < 0.01 (two-tailed Student’s t-
test). Data are representative of three independent experiments (B, mean ± SD from 6
samples).

34
Fig S20. Phosphorylation analysis of STAT3 with (H) or without (L) lnc-DC through
SILAC-assisted MS reveals that Y705 phosphorylation is enhanced by lnc-DC. The
peptides detected by MS are indicated above the graphs.
YCRPESQEHPEADPGSAAPY(ph)IK peptide (ph, phosphorylation) is near the C
terminus of STAT3 protein. The lysine residue at position 705 was identified in its
phosphorylation form in both the heavy isotope peptide (H) and the light isotope peptide
(L) (upper). The observed ion ratio is roughly 1.32 (H/L, lnc-DC vs. no lnc-DC).
Peptides without phosphorylation covering Y705 were also identified in both heavy
isotope (H) and light isotope (L) form (down). The observed ion ratio is roughly 0.89
(H/L, lnc-DC vs. no lnc-DC). These data suggest Y705 phosphorylation of STAT3 is
enhanced by lnc-DC.

35
Fig S21. STAT3 target genes are affected by lnc-DC knockdown and STAT3 inhibition.
Heat map representation of the mean fold change in gene expression, as determined by
transcriptome analysis of monocyte-derived cells with lentivirus mediated lnc-DC
knockdown or STAT3 inhibition (S3I-201) after 7 days DC culture (n=2).

36
Fig S22. Inhibition of STAT3 signaling impairs Mo-DC differentiation, resembling the
effect of lnc-DC knockdown. (A) Flow cytometry of Mo-DC pretreated with DMSO,
S3I-201 (200µM) or Stattic (10µM) and then stimulated with LPS (300ng/ml) for 12
hours. (B) Supernatant ELISA of indicated human cytokines in Mo-DC treated as in (A).
(C) ELISA of human IFN-γ and IL-2 in the supernatant of allogeneic MLR assays using
DCs pretreated as in (A). (D) CD4+ T cell proliferation was presented by cell numbers in
the 5-day allogeneic MLR as in (C). *P < 0.05 and **P < 0.01 (Student’s t-test). Data are
shown as mean ± SD from three donors (B-D) or are representative of three independent
experiments (A).
37
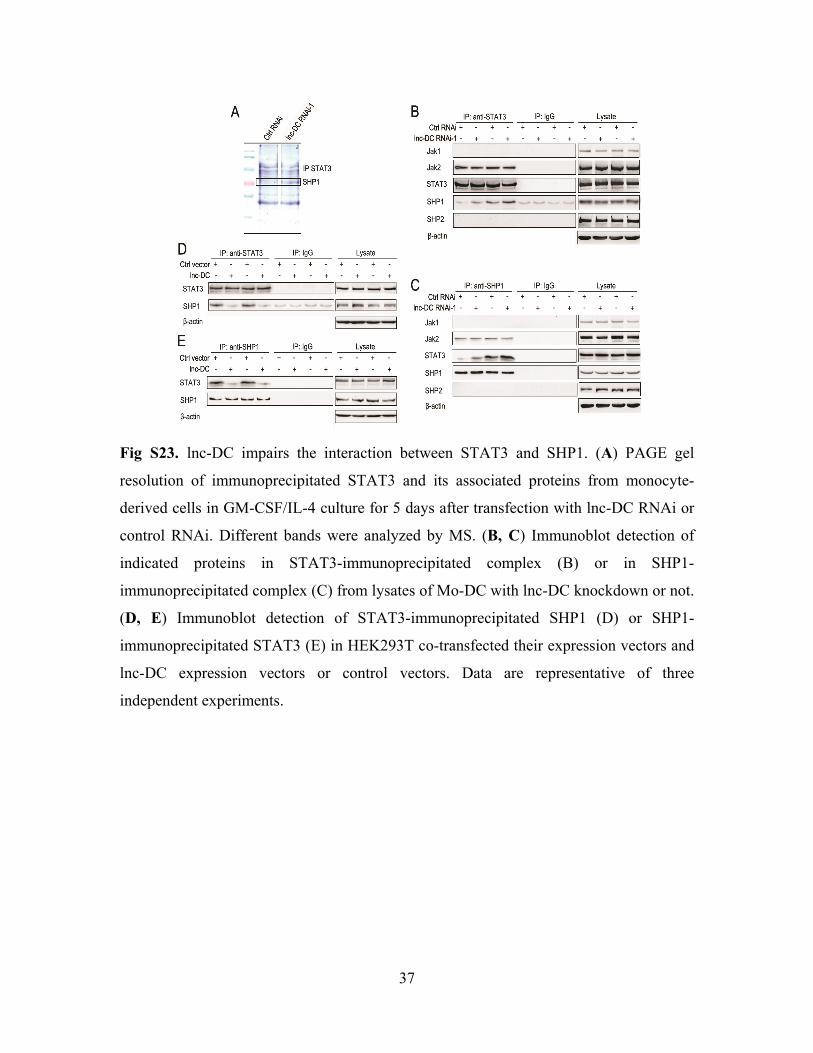
Fig S23. lnc-DC impairs the interaction between STAT3 and SHP1. (A) PAGE gel
resolution of immunoprecipitated STAT3 and its associated proteins from monocyte-
derived cells in GM-CSF/IL-4 culture for 5 days after transfection with lnc-DC RNAi or
control RNAi. Different bands were analyzed by MS. (B, C) Immunoblot detection of
indicated proteins in STAT3-immunoprecipitated complex (B) or in SHP1-
immunoprecipitated complex (C) from lysates of Mo-DC with lnc-DC knockdown or not.
(D, E) Immunoblot detection of STAT3-immunoprecipitated SHP1 (D) or SHP1-
immunoprecipitated STAT3 (E) in HEK293T co-transfected their expression vectors and
lnc-DC expression vectors or control vectors. Data are representative of three
independent experiments.
38
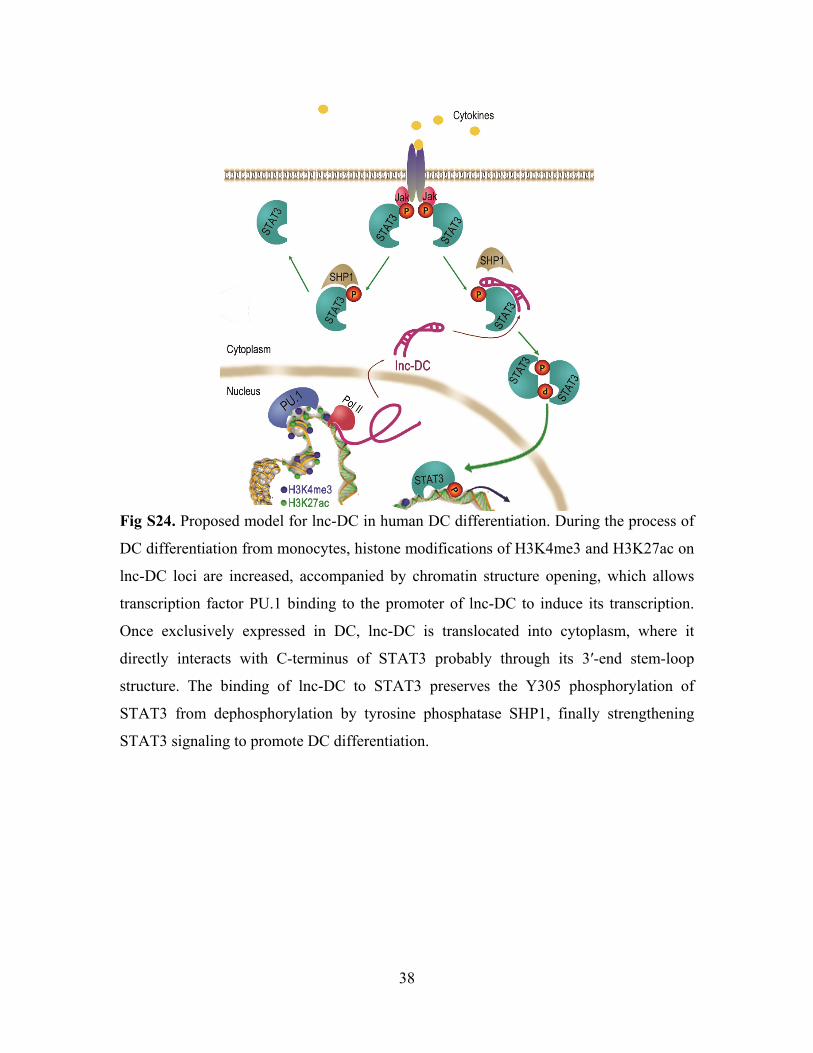
Fig S24. Proposed model for lnc-DC in human DC differentiation. During the process of
DC differentiation from monocytes, histone modifications of H3K4me3 and H3K27ac on
lnc-DC loci are increased, accompanied by chromatin structure opening, which allows
transcription factor PU.1 binding to the promoter of lnc-DC to induce its transcription.
Once exclusively expressed in DC, lnc-DC is translocated into cytoplasm, where it
directly interacts with C-terminus of STAT3 probably through its 3′-end stem-loop
structure. The binding of lnc-DC to STAT3 preserves the Y305 phosphorylation of
STAT3 from dephosphorylation by tyrosine phosphatase SHP1, finally strengthening
STAT3 signaling to promote DC differentiation.
39
Table S1. SILAC-based MS analysis of STAT3 for post translational modification
(PTM): phosphorylation.
H is for heavy isotope STAT3 from cells with lnc-DC, L is for light isotope STAT3 from
cells with no lnc-DC. Normalized Ratio H/L is shown. To see more details, please refer
to Materials and Methods.
Gene names Position Localization
prob Score diff Score
Phospho Amino
acid M/Z Mass_error
[ppm] Ratio H/L
normalized
GALNT2 392 0.99977 36.378 38.178 Y 932.90603 2.1136 0.0012936
FAM13C1 446 1 48.7963 48.796 Y 606.31284 1.327 0.0016774
STAT3 705 1 67.4033 133.26 Y 861.3721 0.72873 1.4177
RFT1 537 0.999984 48.0611 49.5 T 675.84811 -0.97445 1.1552
DPEP3 270 0.841605 12.5943 25.824 S 952.40586 0.05233 1.0579
ADORA2 213 1 32.3406 32.341 S 631.63979 -2.7219 0.019216
TAS2R10 212 0.803541 3.20172 6.6639 T 906.36689 -0.41742 0.00032091
TAS2R10 217 0.803541 3.20172 6.6639 S 906.36689 -0.41742 0.00032091
TAS2R10 219 0.803541 3.20172 6.6639 T 906.36689 -0.41742 0.00032091 SELM; SEPM 44 1 35.7567 35.757 T 614.62186 -0.31661 1.0247
TJP1 758 0.999983 47.7549 50.607 S 641.32681 2.2784 0.67659
WBP2 49 0.9996 38.75 42.395 T 679.30129 -0.1859 16.699
WBP2 51 0.999597 38.6319 42.395 Y 679.30129 -0.1859 16.699
ACAP3 109 1 66.2625 66.262 S 770.36379 -0.72591 0.043121
KIAA1984 255 0.766888 7.89448 45.915 T 811.41348 0.14434 13.483
PRKD1 280 0.833333 0 0.89892 T 844.60703 -3.7261 0.2912
PRKD1 285 0.833333 0 0.89892 S 844.60703 -3.7261 0.2912
PRKD1 286 0.833333 0 0.89892 Y 844.60703 -3.7261 0.2912
PRKD1 287 0.833333 0 0.89892 T 844.60703 -3.7261 0.2912
PRKD1 290 0.833333 0 0.89892 T 844.60703 -3.7261 0.2912
PRKD1 294 0.833333 0 0.89892 Y 844.60703 -3.7261 0.2912
CCDC121 209 0.324239 0 0.91935 T 1035.116 1.2385 NaN
CCDC121 213 0.324239 0 0.91935 T 1035.116 1.2385 NaN
CCDC121 222 0.324239 0 0.91935 S 1035.116 1.2385 NaN
CCDC121 227 0.352211 0.0204299 0.91935 S 1035.116 1.2385 NaN
FIGF; VEGFD 15 0.5 0 11.517 Y 1252.9204 -0.039321 0.085882
FIGF; VEGFD 2 0.5 0 11.517 Y 1252.9204 -0.039321 0.085882
FIGF; VEGFD 22 0.5 0 11.517 S 1252.9204 -0.039321 0.085882
FIGF; VEGFD 23 0.5 0 11.517 S 1252.9204 -0.039321 0.085882
CGI-124; CYPL1; PPIL1;
UNQ2425/ PRO4984
68 0.5 0 37.092 T 634.63241 1.3692 1.1021
CGI-124; CYPL1; 70 0.5 0 37.092 T 634.63241 1.3692 1.1021
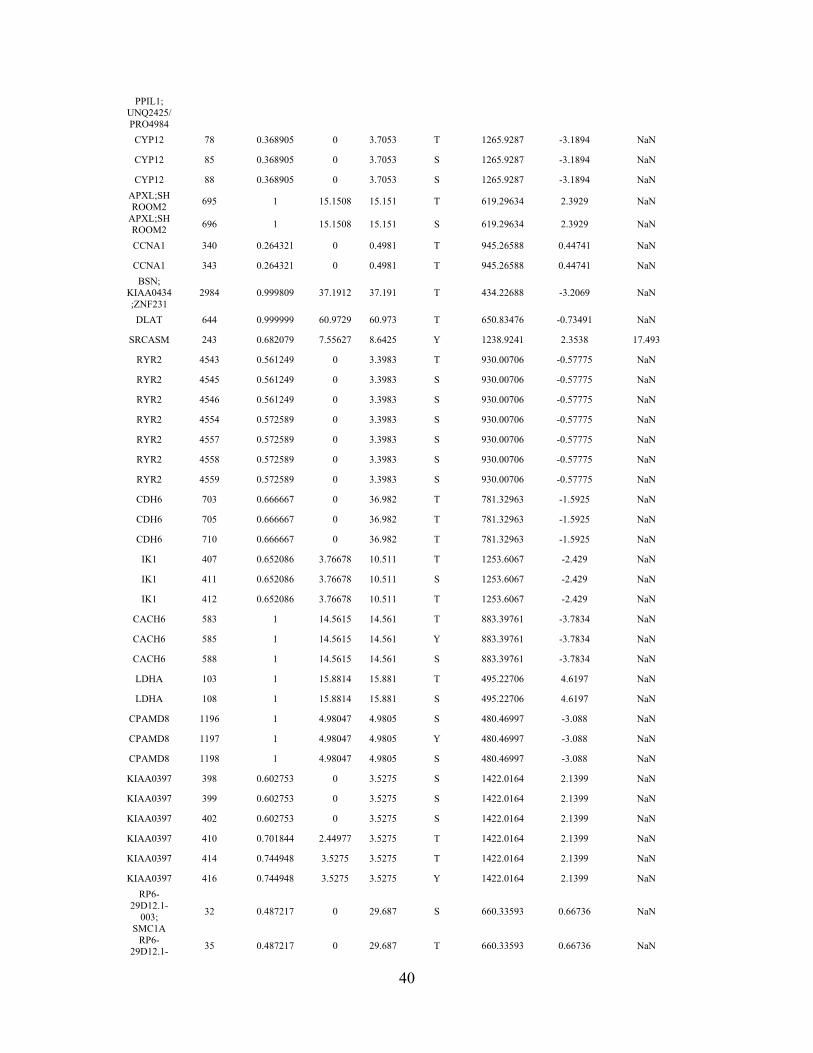
40
PPIL1; UNQ2425/ PRO4984
CYP12 78 0.368905 0 3.7053 T 1265.9287 -3.1894 NaN
CYP12 85 0.368905 0 3.7053 S 1265.9287 -3.1894 NaN
CYP12 88 0.368905 0 3.7053 S 1265.9287 -3.1894 NaN APXL;SHROOM2 695 1 15.1508 15.151 T 619.29634 2.3929 NaN
APXL;SHROOM2 696 1 15.1508 15.151 S 619.29634 2.3929 NaN
CCNA1 340 0.264321 0 0.4981 T 945.26588 0.44741 NaN
CCNA1 343 0.264321 0 0.4981 T 945.26588 0.44741 NaN BSN;
KIAA0434;ZNF231
2984 0.999809 37.1912 37.191 T 434.22688 -3.2069 NaN
DLAT 644 0.999999 60.9729 60.973 T 650.83476 -0.73491 NaN
SRCASM 243 0.682079 7.55627 8.6425 Y 1238.9241 2.3538 17.493
RYR2 4543 0.561249 0 3.3983 T 930.00706 -0.57775 NaN
RYR2 4545 0.561249 0 3.3983 S 930.00706 -0.57775 NaN
RYR2 4546 0.561249 0 3.3983 S 930.00706 -0.57775 NaN
RYR2 4554 0.572589 0 3.3983 S 930.00706 -0.57775 NaN
RYR2 4557 0.572589 0 3.3983 S 930.00706 -0.57775 NaN
RYR2 4558 0.572589 0 3.3983 S 930.00706 -0.57775 NaN
RYR2 4559 0.572589 0 3.3983 S 930.00706 -0.57775 NaN
CDH6 703 0.666667 0 36.982 T 781.32963 -1.5925 NaN
CDH6 705 0.666667 0 36.982 T 781.32963 -1.5925 NaN
CDH6 710 0.666667 0 36.982 T 781.32963 -1.5925 NaN
IK1 407 0.652086 3.76678 10.511 T 1253.6067 -2.429 NaN
IK1 411 0.652086 3.76678 10.511 S 1253.6067 -2.429 NaN
IK1 412 0.652086 3.76678 10.511 T 1253.6067 -2.429 NaN
CACH6 583 1 14.5615 14.561 T 883.39761 -3.7834 NaN
CACH6 585 1 14.5615 14.561 Y 883.39761 -3.7834 NaN
CACH6 588 1 14.5615 14.561 S 883.39761 -3.7834 NaN
LDHA 103 1 15.8814 15.881 T 495.22706 4.6197 NaN
LDHA 108 1 15.8814 15.881 S 495.22706 4.6197 NaN
CPAMD8 1196 1 4.98047 4.9805 S 480.46997 -3.088 NaN
CPAMD8 1197 1 4.98047 4.9805 Y 480.46997 -3.088 NaN
CPAMD8 1198 1 4.98047 4.9805 S 480.46997 -3.088 NaN
KIAA0397 398 0.602753 0 3.5275 S 1422.0164 2.1399 NaN
KIAA0397 399 0.602753 0 3.5275 S 1422.0164 2.1399 NaN
KIAA0397 402 0.602753 0 3.5275 S 1422.0164 2.1399 NaN
KIAA0397 410 0.701844 2.44977 3.5275 T 1422.0164 2.1399 NaN
KIAA0397 414 0.744948 3.5275 3.5275 T 1422.0164 2.1399 NaN
KIAA0397 416 0.744948 3.5275 3.5275 Y 1422.0164 2.1399 NaN RP6-
29D12.1-003;
SMC1A
32 0.487217 0 29.687 S 660.33593 0.66736 NaN
RP6-29D12.1- 35 0.487217 0 29.687 T 660.33593 0.66736 NaN

41
003; SMC1A STAT3 727 1 69.7527 181.41 S 1195.5331 -0.17341 NaN
ANKRD28 6 0.93199 11.3684 11.368 T 496.73538 -3.2932 NaN
References and Notes
1. P. Johnsson, L. Lipovich, D. Grandér, K. V. Morris, Evolutionary conservation of long non-
coding RNAs; sequence, structure, function. Biochim. Biophys. Acta 1840, 1063–1071
(2014). Medline doi:10.1016/j.bbagen.2013.10.035
2. O. Wapinski, H. Y. Chang, Long noncoding RNAs and human disease. Trends Cell Biol. 21,
354–361 (2011). Medline doi:10.1016/j.tcb.2011.04.001
3. M. Sauvageau, L. A. Goff, S. Lodato, B. Bonev, A. F. Groff, C. Gerhardinger, D. B. Sanchez-
Gomez, E. Hacisuleyman, E. Li, M. Spence, S. C. Liapis, W. Mallard, M. Morse, M. R.
Swerdel, M. F. D’Ecclessis, J. C. Moore, V. Lai, G. Gong, G. D. Yancopoulos, D.
Frendewey, M. Kellis, R. P. Hart, D. M. Valenzuela, P. Arlotta, J. L. Rinn, Multiple
knockout mouse models reveal lincRNAs are required for life and brain development.
eLife 2, e01749 (2013). Medline doi:10.7554/eLife.01749
4. J. L. Rinn, H. Y. Chang, Genome regulation by long noncoding RNAs. Annu. Rev. Biochem.
81, 145–166 (2012). Medline doi:10.1146/annurev-biochem-051410-092902
5. Z. Li, T. C. Chao, K. Y. Chang, N. Lin, V. S. Patil, C. Shimizu, S. R. Head, J. C. Burns, T. M.
Rana, The long noncoding RNA THRIL regulates TNFα expression through its
interaction with hnRNPL. Proc. Natl. Acad. Sci. U.S.A. 111, 1002–1007 (2014). Medline
doi:10.1073/pnas.1313768111
6. S. Carpenter, D. Aiello, M. K. Atianand, E. P. Ricci, P. Gandhi, L. L. Hall, M. Byron, B.
Monks, M. Henry-Bezy, J. B. Lawrence, L. A. O’Neill, M. J. Moore, D. R. Caffrey, K.
A. Fitzgerald, A long noncoding RNA mediates both activation and repression of
immune response genes. Science 341, 789–792 (2013). doi:10.1126/science.1240925
7. G. Hu, Q. Tang, S. Sharma, F. Yu, T. M. Escobar, S. A. Muljo, J. Zhu, K. Zhao, Expression
and regulation of intergenic long noncoding RNAs during T cell development and
differentiation. Nat. Immunol. 14, 1190–1198 (2013). Medline doi:10.1038/ni.2712
8. P. Guermonprez, J. Helft, C. Claser, S. Deroubaix, H. Karanje, A. Gazumyan, G. Darasse-
Jèze, S. B. Telerman, G. Breton, H. A. Schreiber, N. Frias-Staheli, E. Billerbeck, M.
Dorner, C. M. Rice, A. Ploss, F. Klein, M. Swiecki, M. Colonna, A. O. Kamphorst, M.
Meredith, R. Niec, C. Takacs, F. Mikhail, A. Hari, D. Bosque, T. Eisenreich, M. Merad,
Y. Shi, F. Ginhoux, L. Rénia, B. C. Urban, M. C. Nussenzweig, Inflammatory Flt3l is
essential to mobilize dendritic cells and for T cell responses during Plasmodium
infection. Nat. Med. 19, 730–738 (2013). Medline doi:10.1038/nm.3197
9. Y. Laouar, T. Welte, X. Y. Fu, R. A. Flavell, STAT3 is required for Flt3L-dependent dendritic
cell differentiation. Immunity 19, 903–912 (2003). Medline doi:10.1016/S1074-
7613(03)00332-7
10. S. Carotta, A. Dakic, A. D’Amico, S. H. Pang, K. T. Greig, S. L. Nutt, L. Wu, The
transcription factor PU.1 controls dendritic cell development and Flt3 cytokine receptor
expression in a dose-dependent manner. Immunity 32, 628–641 (2010). Medline
doi:10.1016/j.immuni.2010.05.005
11. M. Merad, P. Sathe, J. Helft, J. Miller, A. Mortha, The dendritic cell lineage: Ontogeny and
function of dendritic cells and their subsets in the steady state and the inflamed setting.
Annu. Rev. Immunol. 31, 563–604 (2013). Medline doi:10.1146/annurev-immunol-
020711-074950
12. L. A. O’Neill, F. J. Sheedy, C. E. McCoy, MicroRNAs: The fine-tuners of Toll-like receptor
signalling. Nat. Rev. Immunol. 11, 163–175 (2011). Medline doi:10.1038/nri2957
13. M. S. Ebert, P. A. Sharp, Roles for microRNAs in conferring robustness to biological
processes. Cell 149, 515–524 (2012). Medline doi:10.1016/j.cell.2012.04.005
14. T. R. Mercer, J. S. Mattick, Structure and function of long noncoding RNAs in epigenetic
regulation. Nat. Struct. Mol. Biol. 20, 300–307 (2013). Medline doi:10.1038/nsmb.2480
15. K. V. Morris, S. Santoso, A. M. Turner, C. Pastori, P. G. Hawkins, Bidirectional
transcription directs both transcriptional gene activation and suppression in human cells.
PLOS Genet. 4, e1000258 (2008). Medline doi:10.1371/journal.pgen.1000258
16. P. Johnsson, A. Ackley, L. Vidarsdottir, W. O. Lui, M. Corcoran, D. Grandér, K. V. Morris,
A pseudogene long-noncoding-RNA network regulates PTEN transcription and
translation in human cells. Nat. Struct. Mol. Biol. 20, 440–446 (2013). Medline
doi:10.1038/nsmb.2516
17. M. Huarte, M. Guttman, D. Feldser, M. Garber, M. J. Koziol, D. Kenzelmann-Broz, A. M.
Khalil, O. Zuk, I. Amit, M. Rabani, L. D. Attardi, A. Regev, E. S. Lander, T. Jacks, J. L.
Rinn, A large intergenic noncoding RNA induced by p53 mediates global gene repression
in the p53 response. Cell 142, 409–419 (2010). Medline doi:10.1016/j.cell.2010.06.040
18. U. A. Ørom, T. Derrien, M. Beringer, K. Gumireddy, A. Gardini, G. Bussotti, F. Lai, M.
Zytnicki, C. Notredame, Q. Huang, R. Guigo, R. Shiekhattar, Long noncoding RNAs
with enhancer-like function in human cells. Cell 143, 46–58 (2010). Medline
doi:10.1016/j.cell.2010.09.001
19. M. Cesana, D. Cacchiarelli, I. Legnini, T. Santini, O. Sthandier, M. Chinappi, A.
Tramontano, I. Bozzoni, A long noncoding RNA controls muscle differentiation by
functioning as a competing endogenous RNA. Cell 147, 358–369 (2011). Medline
doi:10.1016/j.cell.2011.09.028
20. Y. Tay, L. Kats, L. Salmena, D. Weiss, S. M. Tan, U. Ala, F. Karreth, L. Poliseno, P.
Provero, F. Di Cunto, J. Lieberman, I. Rigoutsos, P. P. Pandolfi, Coding-independent
regulation of the tumor suppressor PTEN by competing endogenous mRNAs. Cell 147,
344–357 (2011). Medline doi:10.1016/j.cell.2011.09.029
21. C. Gong, L. E. Maquat, lncRNAs transactivate STAU1-mediated mRNA decay by duplexing
with 3′ UTRs via Alu elements. Nature 470, 284–288 (2011). Medline
doi:10.1038/nature09701
22. See supplementary materials and methods on Science Online.
23. M. Haniffa, A. Shin, V. Bigley, N. McGovern, P. Teo, P. See, P. S. Wasan, X. N. Wang, F.
Malinarich, B. Malleret, A. Larbi, P. Tan, H. Zhao, M. Poidinger, S. Pagan, S. Cookson,
R. Dickinson, I. Dimmick, R. F. Jarrett, L. Renia, J. Tam, C. Song, J. Connolly, J. K.
Chan, A. Gehring, A. Bertoletti, M. Collin, F. Ginhoux, Human tissues contain CD141hi
cross-presenting dendritic cells with functional homology to mouse CD103+

nonlymphoid dendritic cells. Immunity 37, 60–73 (2012). Medline
doi:10.1016/j.immuni.2012.04.012
24. S. Djebali, C. A. Davis, A. Merkel, A. Dobin, T. Lassmann, A. Mortazavi, A. Tanzer, J.
Lagarde, W. Lin, F. Schlesinger, C. Xue, G. K. Marinov, J. Khatun, B. A. Williams, C.
Zaleski, J. Rozowsky, M. Röder, F. Kokocinski, R. F. Abdelhamid, T. Alioto, I.
Antoshechkin, M. T. Baer, N. S. Bar, P. Batut, K. Bell, I. Bell, S. Chakrabortty, X. Chen,
J. Chrast, J. Curado, T. Derrien, J. Drenkow, E. Dumais, J. Dumais, R. Duttagupta, E.
Falconnet, M. Fastuca, K. Fejes-Toth, P. Ferreira, S. Foissac, M. J. Fullwood, H. Gao, D.
Gonzalez, A. Gordon, H. Gunawardena, C. Howald, S. Jha, R. Johnson, P. Kapranov, B.
King, C. Kingswood, O. J. Luo, E. Park, K. Persaud, J. B. Preall, P. Ribeca, B. Risk, D.
Robyr, M. Sammeth, L. Schaffer, L. H. See, A. Shahab, J. Skancke, A. M. Suzuki, H.
Takahashi, H. Tilgner, D. Trout, N. Walters, H. Wang, J. Wrobel, Y. Yu, X. Ruan, Y.
Hayashizaki, J. Harrow, M. Gerstein, T. Hubbard, A. Reymond, S. E. Antonarakis, G.
Hannon, M. C. Giddings, Y. Ruan, B. Wold, P. Carninci, R. Guigó, T. R. Gingeras,
Landscape of transcription in human cells. Nature 489, 101–108 (2012). Medline
doi:10.1038/nature11233
25. A. Guerriero, P. B. Langmuir, L. M. Spain, E. W. Scott, PU.1 is required for myeloid-derived
but not lymphoid-derived dendritic cells. Blood 95, 879–885 (2000). Medline
26. A. R. Gruber, R. Lorenz, S. H. Bernhart, R. Neuböck, I. L. Hofacker, The Vienna RNA
Websuite. Nucleic Acids Res. 36 (suppl. 2), W70–W74 (2008). Medline
doi:10.1093/nar/gkn188
27. J. J. O’Shea, R. Plenge, JAK and STAT signaling molecules in immunoregulation and
immune-mediated disease. Immunity 36, 542–550 (2012). Medline
doi:10.1016/j.immuni.2012.03.014
28. K. Siddiquee, S. Zhang, W. C. Guida, M. A. Blaskovich, B. Greedy, H. R. Lawrence, M. L.
Yip, R. Jove, M. M. McLaughlin, N. J. Lawrence, S. M. Sebti, J. Turkson, Selective
chemical probe inhibitor of Stat3, identified through structure-based virtual screening,
induces antitumor activity. Proc. Natl. Acad. Sci. U.S.A. 104, 7391–7396 (2007). Medline
doi:10.1073/pnas.0609757104
29. S. Liu, Y. Yu, M. Zhang, W. Wang, X. Cao, The involvement of TNF-α-related apoptosis-
inducing ligand in the enhanced cytotoxicity of IFN-β-stimulated human dendritic cells to
tumor cells. J. Immunol. 166, 5407–5415 (2001). Medline
30. W. Chen, C. Han, B. Xie, X. Hu, Q. Yu, L. Shi, Q. Wang, D. Li, J. Wang, P. Zheng, Y. Liu,
X. Cao, Induction of Siglec-G by RNA viruses inhibits the innate immune response by
promoting RIG-I degradation. Cell 152, 467–478 (2013). Medline
doi:10.1016/j.cell.2013.01.011
31. P. Wang, Y. Gu, Q. Zhang, Y. Han, J. Hou, L. Lin, C. Wu, Y. Bao, X. Su, M. Jiang, Q.
Wang, N. Li, X. Cao, Identification of resting and type I IFN-activated human NK cell
miRNomes reveals microRNA-378 and microRNA-30e as negative regulators of NK cell
cytotoxicity. J. Immunol. 189, 211–221 (2012). Medline doi:10.4049/jimmunol.1200609
32. S. Xu, X. Liu, Y. Bao, X. Zhu, C. Han, P. Zhang, X. Zhang, W. Li, X. Cao, Constitutive
MHC class I molecules negatively regulate TLR-triggered inflammatory responses via
the Fps-SHP-2 pathway. Nat. Immunol. 13, 551–559 (2012). Medline
doi:10.1038/ni.2283
33. J. D. Keene, J. M. Komisarow, M. B. Friedersdorf, RIP-Chip: The isolation and identification
of mRNAs, microRNAs and protein components of ribonucleoprotein complexes from
cell extracts. Nat. Protoc. 1, 302–307 (2006). Medline doi:10.1038/nprot.2006.47
34. F. Allantaz, D. T. Cheng, T. Bergauer, P. Ravindran, M. F. Rossier, M. Ebeling, L. Badi, B.
Reis, H. Bitter, M. D’Asaro, A. Chiappe, S. Sridhar, G. D. Pacheco, M. E. Burczynski, D.
Hochstrasser, J. Vonderscher, T. Matthes, Expression profiling of human immune cell
subsets identifies miRNA-mRNA regulatory relationships correlated with cell type
specific expression. PLOS ONE 7, e29979 (2012). Medline
doi:10.1371/journal.pone.0029979
35. M. C. Tsai, O. Manor, Y. Wan, N. Mosammaparast, J. K. Wang, F. Lan, Y. Shi, E. Segal, H.
Y. Chang, Long noncoding RNA as modular scaffold of histone modification complexes.
Science 329, 689–693 (2010). doi:10.1126/science.1192002
36. L. Kong, Y. Zhang, Z.-Q. Ye, X.-Q. Liu, S.-Q. Zhao, L. Wei, G. Gao, CPC: Assess the
protein-coding potential of transcripts using sequence features and support vector
machine. Nucleic Acids Res. 35 (suppl. 2), W345–W349 (2007). Medline
doi:10.1093/nar/gkm391
37. R. E. Thurman, E. Rynes, R. Humbert, J. Vierstra, M. T. Maurano, E. Haugen, N. C.
Sheffield, A. B. Stergachis, H. Wang, B. Vernot, K. Garg, S. John, R. Sandstrom, D.
Bates, L. Boatman, T. K. Canfield, M. Diegel, D. Dunn, A. K. Ebersol, T. Frum, E. Giste,
A. K. Johnson, E. M. Johnson, T. Kutyavin, B. Lajoie, B. K. Lee, K. Lee, D. London, D.
Lotakis, S. Neph, F. Neri, E. D. Nguyen, H. Qu, A. P. Reynolds, V. Roach, A. Safi, M. E.
Sanchez, A. Sanyal, A. Shafer, J. M. Simon, L. Song, S. Vong, M. Weaver, Y. Yan, Z.
Zhang, Z. Zhang, B. Lenhard, M. Tewari, M. O. Dorschner, R. S. Hansen, P. A. Navas,
G. Stamatoyannopoulos, V. R. Iyer, J. D. Lieb, S. R. Sunyaev, J. M. Akey, P. J. Sabo, R.
Kaul, T. S. Furey, J. Dekker, G. E. Crawford, J. A. Stamatoyannopoulos, The accessible
chromatin landscape of the human genome. Nature 489, 75–82 (2012). Medline
doi:10.1038/nature11232
38. M. B. Gerstein, A. Kundaje, M. Hariharan, S. G. Landt, K. K. Yan, C. Cheng, X. J. Mu, E.
Khurana, J. Rozowsky, R. Alexander, R. Min, P. Alves, A. Abyzov, N. Addleman, N.
Bhardwaj, A. P. Boyle, P. Cayting, A. Charos, D. Z. Chen, Y. Cheng, D. Clarke, C.
Eastman, G. Euskirchen, S. Frietze, Y. Fu, J. Gertz, F. Grubert, A. Harmanci, P. Jain, M.
Kasowski, P. Lacroute, J. Leng, J. Lian, H. Monahan, H. O’Geen, Z. Ouyang, E. C.
Partridge, D. Patacsil, F. Pauli, D. Raha, L. Ramirez, T. E. Reddy, B. Reed, M. Shi, T.
Slifer, J. Wang, L. Wu, X. Yang, K. Y. Yip, G. Zilberman-Schapira, S. Batzoglou, A.
Sidow, P. J. Farnham, R. M. Myers, S. M. Weissman, M. Snyder, Architecture of the
human regulatory network derived from ENCODE data. Nature 489, 91–100 (2012).
Medline doi:10.1038/nature11245