Supplementary Greenhouse Gas Assessment Report · PDF fileSupplementary Greenhouse Gas...
120
REPORT SUPPLEMENTARY GREENHOUSE GAS ASSESSMENT REPORT Coffey Environments Job No: 3568C 11 June 2013
Transcript of Supplementary Greenhouse Gas Assessment Report · PDF fileSupplementary Greenhouse Gas...
REPORT
SUPPLEMENTARY GREENHOUSE GAS
ASSESSMENT REPORT
Coffey Environments
Job No: 3568C
11 June 2013
Supplementary Greenhouse Gas Assessment.docx ii
Supplementary Greenhouse Gas Assessment Report
Coffey Environments | Job Number 3568C
PROJECT TITLE: Supplementary Greenhouse Gas Assessment Report
JOB NUMBER: 3568C
PREPARED FOR: Coffey Environments
APPROVED FOR RELEASE BY: Chaim Kolominskas
DISCLAIMER & COPYRIGHT: This report is subject to the copyright statement
located at www.pacific-environment.com © Pacific
Environment Operations Pty Ltd ABN 86 127 101 642
DOCUMENT CONTROL
VERSION DATE PREPARED BY REVIEWED BY
01 - Draft 23.04.2013 Sarah Colson/Mitch Kelly Chaim Kolominskas
02 - Draft 08.05.2013 Sarah Colson Chaim Kolominskas
03 - Final 24.05.2013 Sarah Colson Chaim Kolominskas
04 – Final v2 06.06.2013 Sarah Colson Chaim Kolominskas
05 – Final v3 11.06.2013 Sarah Colson Chaim Kolominskas
Pacific Environment Operations Pty ABN 86 127 101 642
BRISBANE
Level 1, 59A Melbourne Street, South Brisbane QLD 4101
PO Box 3306, South Brisbane QLD 4101
Ph: +61 7 3004 6400
Fax: +61 7 3844 5858
Unit 1, 22 Varley Street
Yeerongpilly, Qld 4105
Ph: +61 7 3004 6460
ADELAIDE
35 Edward Street, Norwood SA 5067
PO Box 3187, Norwood SA 5067
Ph: +61 8 8332 0960
Fax: +61 7 3844 5858
PERTH
Level 1, Suite 3
34 Queen Street, Perth WA 6000
Ph: +61 8 9481 4961
Fax: +61 7 3844 5858
SYDNEY Suite 1, Level 1, 146 Arthur Street
North Sydney, NSW 2060
Ph: +61 2 9870 0900
Fax: +61 2 9870 0999
MELBOURNE
Suite 62, 63 Turner Street, Port Melbourne VIC 3207
PO Box 23293, Docklands VIC 8012
Ph: +61 3 9681 8551
Fax: +61 3 9646 3408
GLADSTONE
Suite 2, 36 Herbert Street, Gladstone QLD 4680
Ph: +61 7 4972 7313
Fax: +61 7 3844 5858
Supplementary Greenhouse Gas Assessment.docx iii
Supplementary Greenhouse Gas Assessment Report
Coffey Environments | Job Number 3568C
DISCLAIMER
Pacific Environment acts in all professional matters as a faithful advisor to the Client and exercises all
reasonable skill and care in the provision of its professional services.
Reports are commissioned by and prepared for the exclusive use of the Client. They are subject to and
issued in accordance with the agreement between the Client and Pacific Environment. Pacific
Environment is not responsible for any liability and accepts no responsibility whatsoever arising from the
misapplication or misinterpretation by third parties of the contents of its reports.
Except where expressly stated, Pacific Environment does not attempt to verify the accuracy, validity or
comprehensiveness of any information supplied to Pacific Environment for its reports.
Reports cannot be copied or reproduced in whole or part for any purpose without the prior written
agreement of Pacific Environment.
Where site inspections, testing or fieldwork have taken place, the report is based on the information
made available by the client or their nominees during the visit, visual observations and any subsequent
discussions with regulatory authorities. The validity and comprehensiveness of supplied information has
not been independently verified and, for the purposes of this report, it is assumed that the information
provided to Pacific Environment is both complete and accurate. It is further assumed that normal
activities were being undertaken at the site on the day of the site visit(s), unless explicitly stated
otherwise.

Supplementary Greenhouse Gas Assessment.docx iv
Supplementary Greenhouse Gas Assessment Report
Coffey Environments | Job Number 3568C
Supplementary Greenhouse Gas Assessment.docx v
Supplementary Greenhouse Gas Assessment Report
Coffey Environments | Job Number 3568C
EXECUTIVE SUMMARY
Arrow Energy Pty Ltd (Arrow) proposes to expand its coal seam gas operations in the Surat Basin
through the Surat Gas Project. The Surat Gas Project (the project) is a component of the larger Arrow
LNG Project, which incorporates an additional gas field development in the Bowen Basin, transmission
gas pipelines and the Arrow LNG Plant.
An environmental impact statement (EIS) was prepared and submitted for the project. Arrow is required
to prepare a supplementary report to the EIS (SREIS) to present any refinements to the project
description, address issues identified in the EIS that require further consideration and/or information, and
to respond to comments raised in the submissions on the EIS. Pacific Environment (formerly PAEHolmes)
prepared the greenhouse gas (GHG) assessment for the project’s EIS and was requested to assist
Coffey Environments Pty Ltd (Coffey Environments) to prepare a supplementary technical study for
inclusion in the SREIS.
This supplementary report addresses the changes to the greenhouse gas assessment for the EIS
(PAEHolmes, 2011) as a result of refinements to the project description as described in SREIS Chapter 3,
Project Description.
The revised total direct (scope 1) and indirect (scope 2) greenhouse emissions for worst-case year 2029
were estimated to be approximately 3.6 Mt CO2-e/annum. These emissions are approximately 4.5%
higher than the estimated emissions for worst-case year 2030 in the EIS for a higher forecast quantity of
CSG produced (i.e., approximately 23%). The majority of the emissions generated will now be
associated with electricity consumption from the grid as opposed to gas combustion, as a result of
Arrow presenting its alternative power supply option (connection to Queensland’s electricity grid) as its
preferred option in the SREIS.
The scope 1 and scope 2 emissions associated with worst-case year 2029 are expected to contribute
approximately 0.012% to Global 2009 emissions. These emissions also represent approximately 0.89% of
Australia’s 2009 emissions for the energy sector and around 0.69% of the Australian Government’s 2020
emissions target.
Combined scope 1 and scope 2 emissions are minor (approximately 13% of the life cycle emissions) in
comparison with scope 3 emissions, which will primarily be due to greenhouse emissions associated with
the end use of the product fuel.
The refined project design results in estimated cumulative scope 1 and scope 2 emissions for the life of
the project of 81 Mt CO2-e, which is 16% lower than the estimated cumulative emissions of 96 Mt CO2-e
associated with the design at the time of the EIS.
Based on the worst-case year (2029) of this assessment, it was determined that combusting coal seam
gas for heating or electricity generation purposes emits overall significantly less greenhouse gas
emissions over its life cycle (scope 1 and scope 3) per unit of thermal energy produced in comparison
with other fossil fuels, particularly coal. For example, the life cycle emissions associated with the
combustion of CSG from this project will be approximately 38% lower than the life cycle emissions
associated with the combustion of brown or black coal.
The changes in design for the project, in particular the change in permanent power supply (i.e., self-
generation using CSG was assessed in the EIS while electricity from the grid is now assessed in the SREIS),
were expected to materially affect the annual and cumulative scope 1 and scope 2 emissions.
However, lower refined annual power requirements for the facilities and wells were provided for the
SREIS. Consequently, despite the difference in contribution from scope 1 and scope 2 emissions, the
revised annual total scope 1 and scope 2 emissions for worst-case year 2029 are comparable to the
emissions presented in the EIS for worst-case year 2030. There was however, a substantial reduction in

Supplementary Greenhouse Gas Assessment.docx vi
Supplementary Greenhouse Gas Assessment Report
Coffey Environments | Job Number 3568C
cumulative emissions due to lower annual power requirements, in particular for the ramp-up and ramp-
down phases.
Based solely on the emissions for worst-case year 2029, it is predicted that the potential impacts from
the project will be slightly higher than those predicted in the EIS, for a higher forecast quantity of CSG
produced. The impacts associated with the project, with respect to climate change, will be in
proportion with the project’s contribution to global greenhouse gas emissions. Therefore, the potential
impacts associated with climate change directly attributable to the project on a global scale can be
expected to be negligible.
Supplementary Greenhouse Gas Assessment.docx vii
Supplementary Greenhouse Gas Assessment Report
Coffey Environments | Job Number 3568C
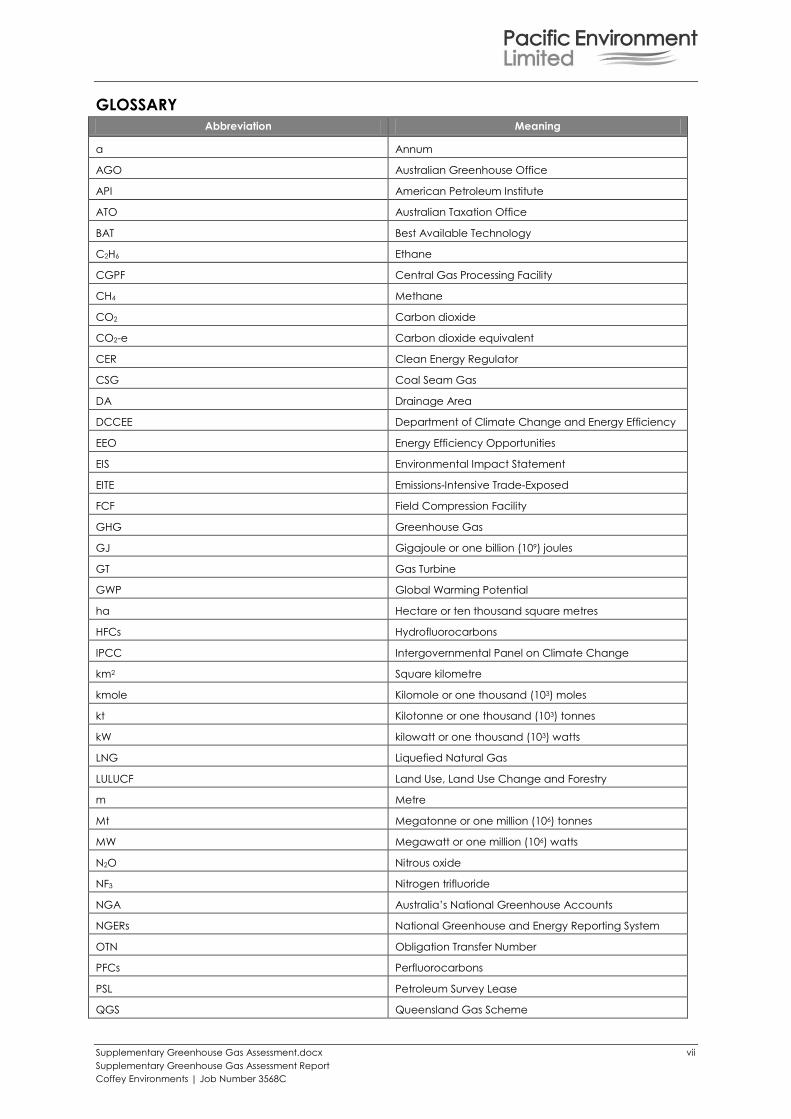
GLOSSARY
Abbreviation Meaning
a Annum
AGO Australian Greenhouse Office
API American Petroleum Institute
ATO Australian Taxation Office
BAT Best Available Technology
C2H6 Ethane
CGPF Central Gas Processing Facility
CH4 Methane
CO2 Carbon dioxide
CO2-e Carbon dioxide equivalent
CER Clean Energy Regulator
CSG Coal Seam Gas
DA Drainage Area
DCCEE Department of Climate Change and Energy Efficiency
EEO Energy Efficiency Opportunities
EIS Environmental Impact Statement
EITE Emissions-Intensive Trade-Exposed
FCF Field Compression Facility
GHG Greenhouse Gas
GJ Gigajoule or one billion (109) joules
GT Gas Turbine
GWP Global Warming Potential
ha Hectare or ten thousand square metres
HFCs Hydrofluorocarbons
IPCC Intergovernmental Panel on Climate Change
km2 Square kilometre
kmole Kilomole or one thousand (103) moles
kt Kilotonne or one thousand (103) tonnes
kW kilowatt or one thousand (103) watts
LNG Liquefied Natural Gas
LULUCF Land Use, Land Use Change and Forestry
m Metre
Mt Megatonne or one million (106) tonnes
MW Megawatt or one million (106) watts
N2O Nitrous oxide
NF3 Nitrogen trifluoride
NGA Australia’s National Greenhouse Accounts
NGERs National Greenhouse and Energy Reporting System
OTN Obligation Transfer Number
PFCs Perfluorocarbons
PSL Petroleum Survey Lease
QGS Queensland Gas Scheme
Supplementary Greenhouse Gas Assessment.docx viii
Supplementary Greenhouse Gas Assessment Report
Coffey Environments | Job Number 3568C
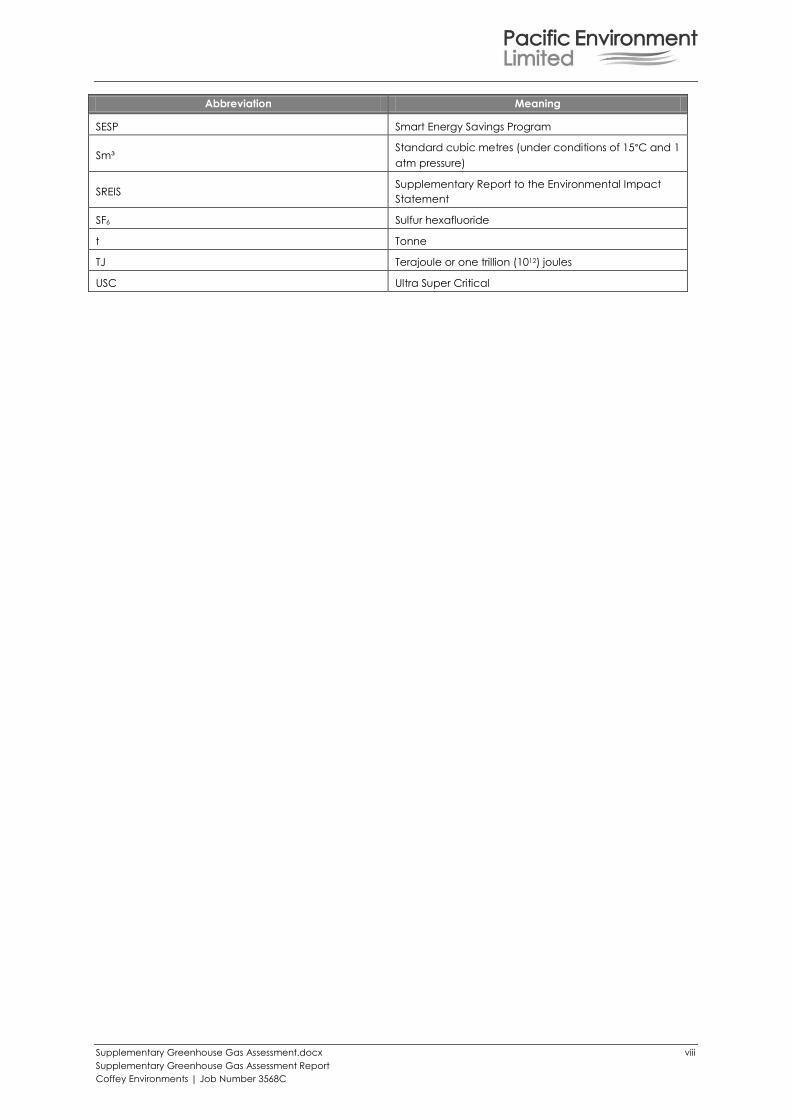
Abbreviation Meaning
SESP Smart Energy Savings Program
Sm³ Standard cubic metres (under conditions of 15°C and 1
atm pressure)
SREIS Supplementary Report to the Environmental Impact
Statement
SF6 Sulfur hexafluoride
t Tonne
TJ Terajoule or one trillion (1012) joules
USC Ultra Super Critical
Supplementary Greenhouse Gas Assessment.docx ix
Supplementary Greenhouse Gas Assessment Report
Coffey Environments | Job Number 3568C
CONTENTS
1 INTRODUCTION 1 1.1 SREIS Project Description 1 1.2 Relevant Updates to the Project Description 2
1.2.1 Project Schedule and Facilities Development 2 1.2.2 CSG Production 3 1.2.3 Flaring 3 1.2.4 Venting 3 1.2.5 Production Wells 3 1.2.6 Power Supply 4 1.2.7 CSG Composition 4 1.2.8 Workforce 4 1.2.9 Traffic 4 1.2.10 Wastewater Treatment 4 1.2.11 Summary of Key Changes in Project Description 4
2 UPDATES TO LEGISLATIVE AND POLICY CONTEXT OF THE ASSESSMENT 7 2.1 Kyoto Protocol 7 2.2 EEO Program 7 2.3 Smart Energy Savings Program 7 2.4 Additional Information on the Carbon Pricing Mechanism 8
2.4.1 Covered Emissions 8 2.4.2 Obligation Transfer Numbers (OTNs) 8 2.4.3 Support Measures 9
2.5 Summary of Relevant Policies 9
3 GREENHOUSE EMISSIONS ESTIMATION METHODOLOGY 11 3.1 Summary of Activities 11 3.2 Methodology Documents Updated Since Submission of EIS 12 3.3 Anticipated Changes to the Methodology Documents 12 3.4 Project Phases 12 3.5 Assumptions Associated with this Assessment 13
3.5.1 Power Supply 13 3.5.2 CGPF Construction and Decommissioning 13 3.5.3 Maintenance Flaring 13 3.5.4 Venting 13 3.5.5 Wells 15 3.5.6 Wastewater Treatment 15 3.5.7 Transmission Pipeline to Arrow LNG Plant 15 3.5.8 Camps 16
4 REVISED GHG EMISSION ESTIMATES FOR THE SURAT GAS PROJECT 17 4.1 Project Schedule 17 4.2 Summary of GHG Emissions Sources 18 4.3 Revised Estimated Emissions 20
4.3.1 Ramp-up Emissions 22 4.3.2 Sustained Production Emissions 24 4.3.3 Ramp-down Emissions 26 4.3.4 Annual and Cumulative Emissions 28
4.4 Comparison with the Previous Assessment 30
5 ASSESSMENT OF IMPACT OF GHG EMISSIONS FROM THE SURAT GAS PROJECT 43
6 REVISED BENCHMARKING OF COAL SEAM GAS 47 6.1 Life Cycle Emissions of Coal Seam Gas 47 6.2 Emissions per MWh of Exported Electricity 48
Supplementary Greenhouse Gas Assessment.docx x
Supplementary Greenhouse Gas Assessment Report
Coffey Environments | Job Number 3568C
7 MANAGEMENT MEASURES 51
8 CONCLUSIONS 53
9 REFERENCES 55
APPENDIX A ESTIMATION OF EMISSIONS A-1 A.1 Wells and Gas Production Data A-2 A.2 CSG Mass Balance A-4 A.3 Scope 1 Emissions – Construction A-7
A.3.1 Fugitive Emissions – Ramp-Up Flaring A-7 A.3.2 Vegetation Clearing A-9 A.3.3 Fuel Combustion – Diesel Combusted for Drilling Activities A-12
A.4 Scope 1 Emissions – Construction and Decommissioning A-15 A.4.1 Fuel Combustion – Diesel Combusted in Stationary Engines A-15
A.5 Scope 1 Emissions – Construction, Operation, Decommissioning A-17 A.5.1 Fuel Combustion – Diesel Used in Vehicles for Transport and Construction Energy A-17
A.6 Scope 1 Emissions – Operation A-21 A.6.1 CSG Combustion for Temporary Power Generation A-21 A.6.2 Fugitive Emissions – Maintenance Flaring A-25 A.6.3 Fugitive Emissions – Facility-Level Fugitive Emissions from Production and Processing A-28 A.6.4 Fugitive Emissions - Venting A-31
A.7 Scope 2 Emissions – Operation A-33 A.8 Scope 3 Emissions – Construction, Operation And Decommissioning A-37
A.8.1 Full Fuel Cycles A-37 A.9 Scope 3 Emissions – Operation A-42
A.9.1 End Use of Gas A-42 A.9.2 Emissions Associated with the Third Party Infrastructure Required to Export CSG A-45
A.9.2.1 Transmission A-45 A.9.2.2 Emissions Associated with Downstream Processing of Coal Seam Gas A-46
LIST OF FIGURES
Figure 1: Total Scope 1 and Scope 2 Emissions in tonnes CO2-e for the 35-year project life 21
Figure 2: Comparison of Cumulative Emissions between the EIS and the SREIS 44
Figure 3: Emission Intensity of CSG Produced for the Surat Gas Project versus Common Fuels 48
Figure 4: Comparison of Emissions per MWh of Electricity Generated 49
LIST OF TABLES
Table 1.1: Revised Gas Composition and Properties 4
Table 1.2: Summary of Key Refinements to the Project Description 5
Table 2.1: Summary of Greenhouse Gas Emissions Policies Relevant to the Project 10
Table 3.1: Activities Associated with the Project 11
Table 3.2: Venting Emissions Sources Considered in the SREIS 14
Table 4.1: Facility Construction, Operation and Decommissioning Schedule 17
Table 4.2: Summary of Project Phases 18
Table 4.3: Emission Sources Considered in the SREIS 19
Table 4.4: Forecast Greenhouse Gas Emissions during the Ramp-Up Phase (Worst-Case Year 2019) 23
Supplementary Greenhouse Gas Assessment.docx xi
Supplementary Greenhouse Gas Assessment Report
Coffey Environments | Job Number 3568C
Table 4.5: Forecast Greenhouse Gas Emissions during the Sustained Production Phase (Worst-Case Year
2029) 25
Table 4.6: Forecast Greenhouse Gas Emissions during the Ramp-Down Phase (Worst-Case Year 2044) 27
Table 4.7: Forecast Annual Greenhouse Gas Emissions for the Life of the Project (2014-2048) 29
Table 4.8: Comparison of Forecast GHG Emissions for the Ramp-Up Phase (Worst-Case Year 2019) 31
Table 4.9: Comparison of Forecast GHG Emissions for the Sustained Production Phase (Worst-Case Year
2029) 35
Table 4.10: Comparison of Forecast GHG Emissions for the Ramp-Down Phase (Worst-Case Year 2044) 39
Table 5.1: Summary of Estimated Emissions for the EIS 43
Table 5.2: Summary of Estimated Emissions for the SREIS 43
Table 5.3: Comparison of Forecast Worst-Case Emissions from the Project with Large Scale Emissions 45
Table 6.1: Life Cycle Emissions of Common Fuels in Comparison to the CSG Product from the Project 47
Table 6.2: Scope 1 and Scope 3 Emissions per MWh of Electricity Generated 49
Table A.1: Cumulative Total Gas Production and Cumulative Number of Wells On-Line A-2
Table A.2: Parameters Associated with the Estimation of the Quantity of Processed Gas A-5
Table A.3: CSG Mass Balance Inputs and Outputs for Time Period 2014-2048 A-6
Table A.4: Energy Content Factor and Emission Factors Associated with Ramp-Up Flaring A-7
Table A.5: Parameters Associated with the Estimation of the Quantity of Gas Flared A-8
Table A.6: Activity Data Associated with Gas Ramp-Up Flaring A-8
Table A.7: Greenhouse Gas Emissions Associated with Gas Ramp-Up Flaring A-8
Table A.8: Emission Factor Associated with Vegetation Clearance A-9
Table A.9: Activity Data Associated with Vegetation Clearance A-10
Table A.10: Estimated Greenhouse Gas Emissions Associated with Vegetation Clearance A-11
Table A.11: Energy Content Factor and Emission Factors Associated with Diesel Combusted in Drill Rigs
A-12
Table A.12: Parameters Associated with Diesel Combusted in Drill Rigs A-12
Table A.13: Activity Data Associated with Diesel Combusted in Drill Rigs A-13
Table A.14: Greenhouse Gas Emissions Associated with Diesel Combusted in Drill Rigs A-14
Table A.15: Activity Data Associated with Diesel Combustion in Stationary Engines for Construction and
Decommissioning/Rehabilitation Activities A-15
Table A.16: Greenhouse Gas Emissions Associated with Diesel Combustion in Stationary Engines for
Construction and Decommissioning/Rehabilitation Activities A-16
Table A.17: Energy Content Factor and Emission Factors Associated with Diesel Combustion in Vehicles
for Construction, Operation, Decommissioning/Rehabilitation Activities A-18
Table A.18: Parameters Associated with Diesel Combustion in Vehicles Estimation A-18
Table A.19: Activity Data Associated with Diesel Combusted in Light and Heavy Vehicles for
Construction, Operation, Decommissioning/Rehabilitation Activities A-19
Table A.20: Greenhouse Gas Emissions Associated with Diesel Combusted in Light and Heavy Vehicles
for Construction, Operation, Decommissioning/Rehabilitation Activities A-20
Table A.21: Emission Factors Associated with CSG Combusted in Stationary Engines for Temporary
Power Supply during Operation A-21
Table A.22: Activity Data Associated with Gas Combusted in Stationary Engines for Temporary Power
Supply during Operation A-22
Supplementary Greenhouse Gas Assessment.docx xii
Supplementary Greenhouse Gas Assessment Report
Coffey Environments | Job Number 3568C
Table A.23: Amount of Fuel Combusted at the CGPFs, Wells and Multi-well Pads A-23
Table A.24: Greenhouse Gas Emissions Associated with Gas Combusted in Stationary Engines for
Temporary Power Supply during Operation A-24
Table A.25: Energy Content Factor and Emission Factors Associated with Maintenance Flaring A-25
Table A.26: Activity Data Associated with Maintenance Flaring (1) A-25
Table A.27: Activity Data Associated with Maintenance Flaring (2) A-26
Table A.28: Greenhouse Gas Emissions Associated with Maintenance Flaring A-27
Table A.29: Parameters for (Site-Specific) Facility-Level Fugitive Emission Factors Estimation A-28
Table A.30: Facility-Level Fugitive Emission Factors Comparison A-29
Table A.31: Greenhouse Gas Emissions Associated with Facility-Level Fugitive Emissions from Gas
Production or Processing A-30
Table A.32: Data Required to Estimate Venting Emissions A-31
Table A.33: Greenhouse Gas Emissions Associated with Venting A-32
Table A.34: Energy Content Factor and CO2 Emission Factor of Electricity Purchased from the Grid in
Queensland A-34
Table A.35: Activity Data Associated with Electricity Purchased from the Grid (1) A-34
Table A.36: Activity Data Associated with Electricity Purchased from the Grid (2) A-35
Table A.37: Emissions of Scope 2 CO2 and Energy Consumption from Electricity Purchased from the Grid
in Queensland A-36
Table A.38: Energy Content Factor and Scope 3 Emission Factors Associated with Full Fuel Cycles A-37
Table A.39: Activity Data Associated with Full Fuel Cycle of Diesel A-38
Table A.40: Scope 3 Greenhouse Gas Emissions from Full Fuel of Diesel A-39
Table A.41: Activity Data Associated with Full Fuel Cycle of Electricity A-40
Table A.42: Scope 3 Greenhouse Gas Emissions from Full Fuel Cycle of Electricity A-41
Table A.43: Energy Content Factor and Scope 3 Emission Factors Associated with the End-Use of CSG A-
42
Table A.44: Activity Data Associated with the End-Use of CSG A-43
Table A.45: Scope 3 Greenhouse Gas Emissions Associated with the End-Use of CSG A-44
Table A.46: Emission Factors Associated with Gas Transmission to Arrow LNG Plant (Scope 3) A-45
Table A.47: Activity Data Associated with Gas Transmission to Arrow LNG Plant (Scope 3) A-46
Table A.48: Greenhouse Gas Emissions Associated with Gas Transmission to Arrow LNG Plant (Scope 3) A-
46
Table A.49: Parameters Associated with the Estimation of the Quantity of CSG losses during Transmission
to Arrow LNG Plant A-47
Table A.50: Activity Data Associated with Downstream Processing of CSG (Scope 3) (1) A-48
Table A.51: Activity Data Associated with Downstream Processing of CSG (Scope 3) (2) A-48
Table A.52: Arrow LNG Plant Operational Emissions (Scope 1 and Scope 2) A-49
Table A.53: Scope 3 Greenhouse Gas Emissions Associated with Downstream Processing of CSG A-50
Supplementary Greenhouse Gas Assessment.docx 1
Supplementary Greenhouse Gas Assessment Report
Coffey Environments | Job Number 3568C
1 INTRODUCTION
Arrow Energy Pty Ltd (Arrow) proposes to expand its coal seam gas operations in the Surat Basin
through the Surat Gas Project. The Surat Gas Project (the project) is a component of the larger Arrow
LNG Project, which incorporates an additional gas field development in the Bowen Basin, transmission
gas pipelines and the Arrow LNG Plant.
An environmental impact statement (EIS) was prepared and submitted for the project. Arrow is required
to prepare a supplementary report to the EIS (SREIS) to present information on refinements to the
project description, address issues identified in the EIS as requiring further consideration and/or
information, and to respond to comments raised in the submissions on the EIS. Pacific Environment
(formerly PAEHolmes) prepared the greenhouse gas (GHG) assessment for the project EIS and was
requested to prepare a supplementary technical study for inclusion in the SREIS.
This supplementary report addresses the changes to the greenhouse gas assessment for the EIS
(PAEHolmes, 2011) as a result of the identified refinements to the project description (outlined in SREIS
Chapter 3, Project Description). This report evaluates whether the emission estimates presented in the
EIS were materially affected and whether the mitigation measures applied for the EIS are still relevant
and adequate to address the identified potential impacts.
1.1 SREIS Project Description
Since preparation of the Surat Gas Project EIS, further knowledge of the gas reserves has been gained
resulting in refinement of the field development plan and basis for design of coal seam gas
infrastructure. The refinements which are applicable to the greenhouse gas assessment include:
A reduction in the size of the project development area including the number of wells and
facilities.
A revised project development schedule for the anticipated construction, operation and
decommissioning of facilities and wells.
An increase in the capacity of production facilities and changes in associated equipment.
An update of the well type described within the EIS to include the addition of multi-well pads.
A revised power supply option for facilities and wells, with temporary power generation to be
used only in the initial phase of operation until a grid connection is made.
A revised flaring scenario.
Details of these refinements to the project description are provided below.
Due to the relinquishment of parcels of land within Arrow’s exploration tenements, there has been a
reduction in the overall size of the project development area from 8,600 km2 to 6,100 km2.
Advancement in the field development planning since the preparation of the EIS has seen the project
development area being separated into eleven drainage areas. It is currently expected that eight of
these drainage areas will be initially developed for the Surat Gas Project with each drainage basin
incorporating wells with connections to a water gathering network, a gas gathering network and a
CGPF. The anticipated commissioning of production wells and facilities has been revised in line with the
approach to the initial development of eight drainage areas.
The current project schedule shows construction of wells beginning in 2014. Construction of the eight
CGPFs is scheduled to commence in late 2015 and all CGPFs are intended to be operational by 2020.
Decommissioning of wells is forecast to begin in 2028. This means the project would have a 35 year
lifespan ending in 2048.
Arrow has identified the properties on which four of the eight CGPFs will be located, two of which will
have water treatment facilities located adjacent to them (reduced from six water treatment facilities
assessed in the EIS). In the EIS this arrangement was referred to as an integrated processing facility. This
Supplementary Greenhouse Gas Assessment.docx 2
Supplementary Greenhouse Gas Assessment Report
Coffey Environments | Job Number 3568C
term will no longer be used and the facilities will be referred to by their function i.e., CGPF and water
treatment facility. The exact locations of infrastructure within the properties have not been determined
with the final siting of infrastructure to be determined through a constraints analysis.
With the smaller project development area, there has been a reduction in the number of production
wells anticipated to be drilled, reducing from 7,500 to approximately 6,500 wells. In addition to single
wells, multi-well pads will be drilled, which will comprise an average of 9 wells per pad with the potential
for up to 12 wells per pad, spaced approximately 8 m apart.
The EIS assessed the potential impacts associated with power being supplied through self-generation at
the site of the facilities and wells, with power supplied by the Queensland electricity grid described as
the alternate power supply option that Arrow was considering.
Refinements to Arrow’s basis for design include consideration for their power supply, with the alternate
option of grid power, now being favoured. Self-generated power may however, still be necessary until
connection to a third party’s infrastructure can be made. This assessment includes the power
requirements for self-generated power at CGPFs (50 MW), at multi-well pads of up to 12 wells (749 kW)
and at single wells (60 kW).
The maximum capacity of a CGPF has increased to 225 TJ/day from 150 TJ/day and an additional
layout sparing for one extra train (75 TJ/day) may be adopted. The temporary self-generated power
supply option for a CGPF allows for up to 50 MW of power to be supplied, which has been assessed
through consideration for two typical power generation configurations: 47 reciprocating gas engines
each with a capacity of 1.1 MW and 10 gas turbines, each with a capacity of 5.7 MW.
Wells will be either supplied with power from the nearest CGPF or in a few exceptional circumstances
may have temporary power generation from a gas engine. A multi-well pad has a power requirement
of 720 kW, which for the temporary self-generated power supply option has been assessed through
consideration of a 749 kW engine.
Ramp-up flaring is expected to result from commissioning of only eight CGPFs. Planned and unplanned
maintenance flaring at CGPFs includes partial (i.e., one train) and full shutdowns which have changed
due to the increased capacity of a CGPF and larger train sizes. Pilot flaring of the CGPF will no longer
occur as nitrogen will be used for purging. No gas will be flared at a field compression facility (FCF).
1.2 Relevant Updates to the Project Description
Project description updates relevant to the greenhouse gas assessment are described in this section. A
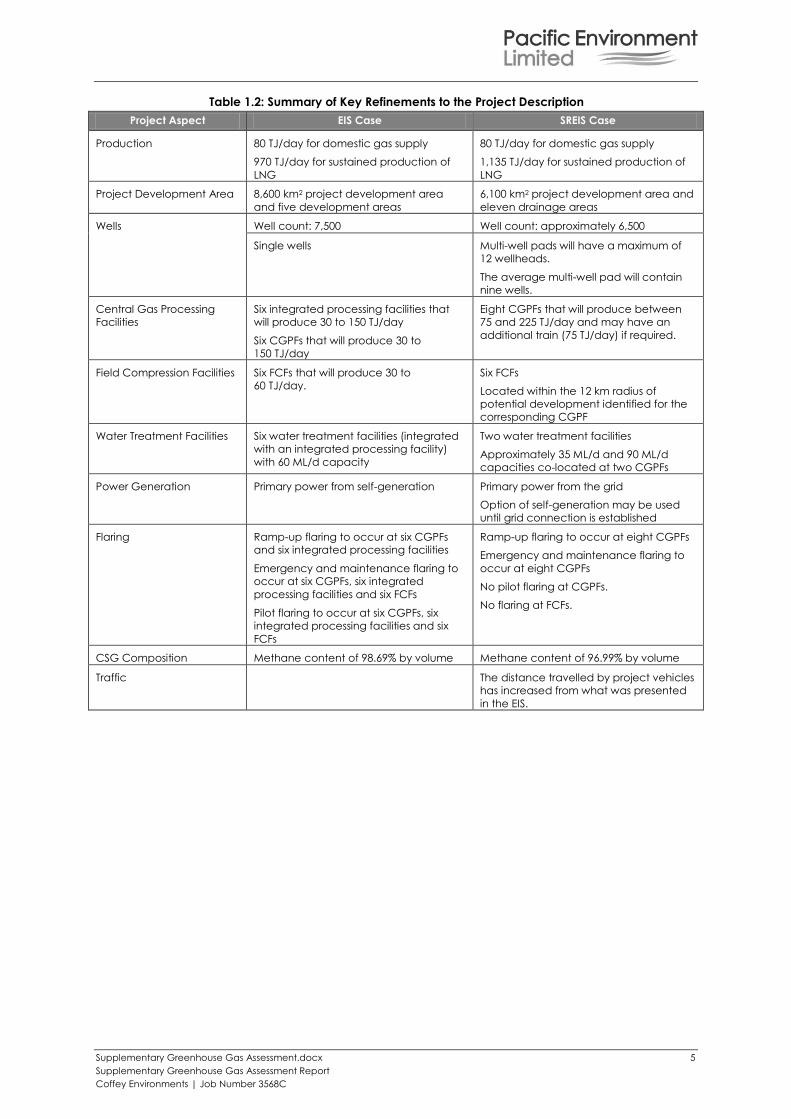
summary of the key refinements to the project description is also provided in Table 1.2. The data
describing the updates were provided to Pacific Environment by Coffey Environments as advised by
Arrow.
1.2.1 Project Schedule and Facilities Development
Since preparation of the project’s EIS, a number of parcels of land within Arrow’s exploration tenements
have been relinquished. This has also led to a revision of the project schedule for the commissioning of
the central gas processing facilities (CGPF) and wells.
It is currently expected that there will be eight CGPFs, each fed by an area of wells and associated
gathering lines. A further three CGPF locations may be developed, depending on favourable reservoir
outcomes and future market conditions. Commissioning of all of the eight CGPFs is expected to occur
in the first seven years of the project. To accommodate the construction workforce, six camp sites will
also be constructed one year prior to the construction of the CGPFs.
The number of water treatment facilities has reduced from six facilities to two facilities. These water
treatment facilities are co-located with two of the CGPFs (i.e., equivalent to an integrated processing
Supplementary Greenhouse Gas Assessment.docx 3
Supplementary Greenhouse Gas Assessment Report
Coffey Environments | Job Number 3568C
facility as defined in the EIS). Therefore, the number of integrated processing facilities has reduced from
six to two.
FCFs may be located between the wells and the CGPFs to improve compression at sites where
wellhead pressure is not sufficient to transport gas to the larger production facilities. The revised project
description retains six FCFs.
1.2.2 CSG Production
The maximum individual CGPF compression capacity has increased to 225 TJ/day (previously
150 TJ/day) with an option of an additional spare train (75 TJ/day). However, the number of CGPFs has
decreased to eight (twelve in the EIS). As a result, the maximum cumulative installed compression
facility capacity decreased from 1,440 TJ/day to 1,275 TJ/day.
A total sustained gas production of 1,215 TJ/day is forecast across the entire field, which comprises
Arrow’s domestic gas supply of 80 TJ/day (as described in the EIS) and the revised estimate of
1,135 TJ/day for LNG production (970 TJ/day presented in the EIS).
1.2.3 Flaring
The emissions from ramp-up flaring are expected to reduce as they are now expected to be
generated from the commissioning of only eight CGPFs.
Planned and unplanned maintenance flaring at CGPFs included partial and full shutdowns which have
changed due to the increased capacity of a CGPF and larger train sizes.
Pilot flaring of the CGPF will no longer occur as nitrogen will be used for purging and was therefore
excluded from this assessment.
No gas will be flared at an FCF.
Note that emissions associated with exploration activities do not form part of the Surat Gas Project as
they are already approved under a separate environmental authority.
1.2.4 Venting
Water pipelines in the water gathering system will contain high-point vents, allowing for the release of
accumulated gas to the atmosphere.
1.2.5 Production Wells
Production wells will be drilled throughout the life of the project (average rate of approximately 400
wells per year), commencing in 2014 and ceasing in 2035.
The EIS estimated that 7,500 wells would be drilled over the life of the project. Due to a refinement of
the project description (including the relinquishment of land), only 6,500 wells are anticipated to be
commissioned during the life of the project. In the GHG assessment conducted as part of the EIS, the
worst-case year considering the expected maximum number of wells that would be operating
simultaneously was 5,873 wells in year 2031. For the SREIS assessment, the worst-case year was 2030 with
4,690 wells operating simultaneously.
The SREIS also introduced a method for well pad drilling that further reduces Arrow’s footprint, in the
form of direction drilling, allowing multiple wells to be drilled from one central surface location. The
multi-well pads will be comprised of up to twelve wellheads per pad with an average of nine
wellheads, approximately 8 m apart.
The dimensions of the multi-well pads will be approximately up to 200 m by 100 m (approximately 2 ha).
Supplementary Greenhouse Gas Assessment.docx 4
Supplementary Greenhouse Gas Assessment Report
Coffey Environments | Job Number 3568C
1.2.6 Power Supply
Construction power will be supplied by diesel generators.
Temporary power may be used for commissioning and operation of the CGPFs, water treatment
facilities, miscellaneous equipment and wells until connection to the grid is established.
Electricity from the grid will be supplied to the CGPFs and then distributed to water treatment facilities,
wells and water transfer stations.
1.2.7 CSG Composition
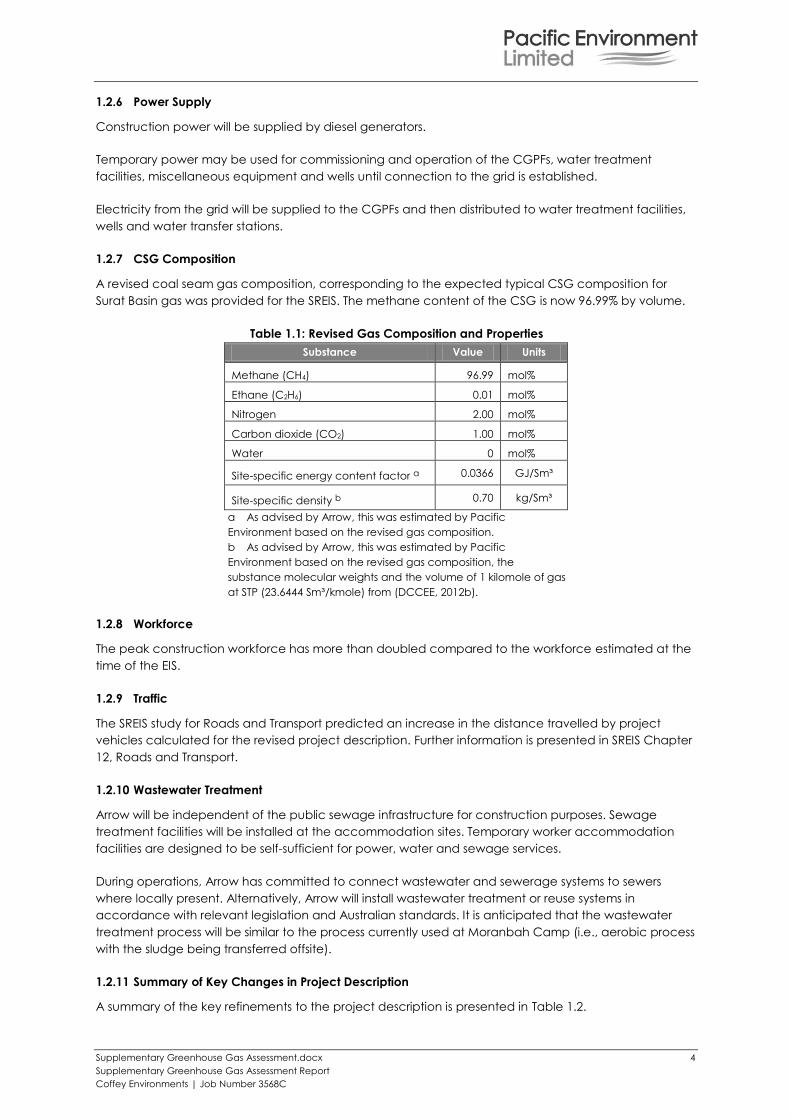
A revised coal seam gas composition, corresponding to the expected typical CSG composition for
Surat Basin gas was provided for the SREIS. The methane content of the CSG is now 96.99% by volume.
Table 1.1: Revised Gas Composition and Properties
Substance Value Units
Methane (CH4) 96.99 mol%
Ethane (C2H6) 0.01 mol%
Nitrogen 2.00 mol%
Carbon dioxide (CO2) 1.00 mol%
Water 0 mol%
Site-specific energy content factor a 0.0366 GJ/Sm³
Site-specific density b 0.70 kg/Sm³
a As advised by Arrow, this was estimated by Pacific
Environment based on the revised gas composition.
b As advised by Arrow, this was estimated by Pacific
Environment based on the revised gas composition, the
substance molecular weights and the volume of 1 kilomole of gas
at STP (23.6444 Sm³/kmole) from (DCCEE, 2012b).
1.2.8 Workforce
The peak construction workforce has more than doubled compared to the workforce estimated at the
time of the EIS.
1.2.9 Traffic
The SREIS study for Roads and Transport predicted an increase in the distance travelled by project
vehicles calculated for the revised project description. Further information is presented in SREIS Chapter
12, Roads and Transport.
1.2.10 Wastewater Treatment
Arrow will be independent of the public sewage infrastructure for construction purposes. Sewage
treatment facilities will be installed at the accommodation sites. Temporary worker accommodation
facilities are designed to be self-sufficient for power, water and sewage services.
During operations, Arrow has committed to connect wastewater and sewerage systems to sewers
where locally present. Alternatively, Arrow will install wastewater treatment or reuse systems in
accordance with relevant legislation and Australian standards. It is anticipated that the wastewater
treatment process will be similar to the process currently used at Moranbah Camp (i.e., aerobic process
with the sludge being transferred offsite).
1.2.11 Summary of Key Changes in Project Description
A summary of the key refinements to the project description is presented in Table 1.2.
Supplementary Greenhouse Gas Assessment.docx 5
Supplementary Greenhouse Gas Assessment Report
Coffey Environments | Job Number 3568C
Table 1.2: Summary of Key Refinements to the Project Description
Project Aspect EIS Case SREIS Case
Production 80 TJ/day for domestic gas supply
970 TJ/day for sustained production of
LNG
80 TJ/day for domestic gas supply
1,135 TJ/day for sustained production of
LNG
Project Development Area 8,600 km2 project development area
and five development areas
6,100 km2 project development area and
eleven drainage areas
Wells Well count: 7,500 Well count: approximately 6,500
Single wells Multi-well pads will have a maximum of
12 wellheads.
The average multi-well pad will contain
nine wells.
Central Gas Processing
Facilities
Six integrated processing facilities that
will produce 30 to 150 TJ/day
Six CGPFs that will produce 30 to
150 TJ/day
Eight CGPFs that will produce between
75 and 225 TJ/day and may have an
additional train (75 TJ/day) if required.
Field Compression Facilities Six FCFs that will produce 30 to
60 TJ/day.
Six FCFs
Located within the 12 km radius of
potential development identified for the
corresponding CGPF
Water Treatment Facilities Six water treatment facilities (integrated
with an integrated processing facility)
with 60 ML/d capacity
Two water treatment facilities
Approximately 35 ML/d and 90 ML/d
capacities co-located at two CGPFs
Power Generation Primary power from self-generation Primary power from the grid
Option of self-generation may be used
until grid connection is established
Flaring Ramp-up flaring to occur at six CGPFs
and six integrated processing facilities
Emergency and maintenance flaring to
occur at six CGPFs, six integrated
processing facilities and six FCFs
Pilot flaring to occur at six CGPFs, six
integrated processing facilities and six
FCFs
Ramp-up flaring to occur at eight CGPFs
Emergency and maintenance flaring to
occur at eight CGPFs
No pilot flaring at CGPFs.
No flaring at FCFs.
CSG Composition Methane content of 98.69% by volume Methane content of 96.99% by volume
Traffic The distance travelled by project vehicles
has increased from what was presented
in the EIS.

Supplementary Greenhouse Gas Assessment.docx 6
Supplementary Greenhouse Gas Assessment Report
Coffey Environments | Job Number 3568C
Supplementary Greenhouse Gas Assessment.docx 7
Supplementary Greenhouse Gas Assessment Report
Coffey Environments | Job Number 3568C
2 UPDATES TO LEGISLATIVE AND POLICY CONTEXT OF THE ASSESSMENT
This section describes changes to the relevant aspects of legislation and policy since the submission of
the EIS. At the time of the EIS submission, Australia was a participant of the first commitment period of
the Kyoto Protocol and the Carbon Pricing Mechanism was still a proposed policy as part of the Clean
Energy Plan released in July 2011.
Since the submission of the EIS, the Carbon Pricing Mechanism came into effect in July 2012 and
therefore, more information about the scheme is now available. Amendments to the Energy Efficiency
Opportunities (EEO) Program were also made and Australia has agreed to a second commitment
period under the Kyoto Protocol, as the first commitment period ended in December 2012.
2.1 Kyoto Protocol
The Kyoto Protocol first commitment period ended on 31 December 2012. On 9 December 2012, at the
United Nations climate change conference in Doha, it was announced that Australia has agreed to a
second commitment period under the Kyoto Protocol. The second commitment period of the Kyoto
Protocol was scheduled to commence on 1 January 2013 and end in 2020, in line with the start of the
new global agreement (Australian Government, 2012).
Australia agreed a Kyoto target to reduce its emissions to five per cent below 2000 levels by 2020; i.e.,
530 Mt CO2-e.a However, the option to increase the target to up to 15 or 25 per cent might be
considered, depending on the scale of global action (Australian Government, 2012).
An additional greenhouse gas, nitrogen trifluoride (NF3), was included to the list of the greenhouse
gases covered by the Kyoto Protocol for the second commitment period (UNFCCC, 2012). Nitrogen
trifluoride is, for instance, predominantly employed in the manufacture of silicon-based thin film solar
cells, and therefore, emissions of this substance are not expected from this project.
2.2 EEO Program
According to the amended EEO regulations that came into effect on 1 July 2012, corporations are now
allowed to align their assessment liability with their National Greenhouse and Energy Reporting (NGER)
liability (DRET, 2012).
The EEO Amendment Regulation 2012 indicates that the EEO program will expand to include new
developments and expansion projects from 1 July 2013. Corporations will be required to (DRET, 2012):
Assess projected energy use after commercial operation has commenced.
Assess opportunities to improve energy efficiency in the design, commissioning or equivalent
process for the project.
Define participation thresholds.
Corporations not registered for EEO whose projects meet the above thresholds will be required to
participate (DRET, 2012).
Further consultation and trials with industry are currently being undertaken to better inform how the
program should be implemented (DRET, 2013).
2.3 Smart Energy Savings Program
Under the Queensland government formed in April 2012, the Smart Energy Savings Program (SESP) was
discontinued to reduce regulatory burden on Queensland businesses (Queensland Government 2013).
a Based on 2000 Australian emissions levels for all sectors = 558 Mt CO2-e (DCCEE, 2010).
Supplementary Greenhouse Gas Assessment.docx 8
Supplementary Greenhouse Gas Assessment Report
Coffey Environments | Job Number 3568C
This will have no effect on the outcomes of the greenhouse gas assessment for the project as the facility
will be required to report under the EEO Program.
2.4 Additional Information on the Carbon Pricing Mechanism
2.4.1 Covered Emissions
Entities are liable as direct emitters under the carbon pricing mechanism if they operate facilities that
exceed the threshold for scope 1 emissions covered by the mechanism, or if they supply or use natural
gas (CER, 2013a). Scope 1 emissions covered under the carbon pricing mechanism include emissions:
Released into the atmosphere as a direct result of the operation of the facility.
Released in Australia.
For which a method or criterion for measurement has been provided to measure those
emissions under the NGER Act (DCCEE, 2012c), specified in the National Greenhouse and
Energy Reporting (Measurement) Determination 2008 made under the NGER Act.
That are not part of the excluded types of emissions.
Entities are not directly liable for scope 2 emissions; i.e., emissions released into the atmosphere as a
direct result of one or more activities that generate electricity, heating, cooling or steam consumed by
the facility, but do not form part of the facility. The electricity generator is liable for the emissions it
produces in generating the electricity (CER, 2013a).
The following categories of emissions are not part of the covered emissions under the carbon pricing
mechanism:
Emissions from transport fuels. Transport fuels are not covered directly under the carbon pricing
mechanism. Where a carbon price applies, it is through fuel tax credits or charges in excise.
Emissions of synthetic greenhouse gases; i.e., hydrofluorocarbons (HFCs), perfluorocarbons
(PFCs) and sulphur hexafluoride (SF6). This does not apply to emissions of PFCs emitted from
aluminium production activities. These emissions will be subject to an equivalent carbon price
under the Ozone Protection and Synthetic Greenhouse Gas Management legislation.
Emissions from biomass, biofuel and biogas. Carbon dioxide produced from these sources is
part of the natural carbon cycle and does not count towards Australia's emissions obligations.
Other greenhouse gases from the combustion of these sources are a minor source of emissions
and are therefore excluded.
Under the Clean Energy Act 2011 (CER, 2013b), large users of specified taxable liquid fuels can choose
to manage their carbon price liability through the carbon pricing mechanism rather than through the
fuel tax or excise systems under the operation of the Australian Taxation Office (ATO) (CER, 2013c).
2.4.2 Obligation Transfer Numbers (OTNs)
An OTN is used to transfer carbon price liability for the potential greenhouse emissions embodied in an
amount of natural gas, supplied from a gaseous fuel supplier to the recipient of that gas. It is used to
keep track of liability so that liability is not imposed twice on the same quantity of gas (CER, 2013d).
A 'large gas consuming facility' is liable as a direct emitter for the emissions resulting from the
combustion of the natural gas supplied to the facility. A facility becomes a 'large gas consuming
facility' the second year after it has emissions from natural gas combustion of 25,000 tonnes or more
CO2-e (in any financial year after 1 July 2010). It is mandatory for the recipient of the natural gas
supplied for use at a large gas consuming facility to quote an OTN and mandatory for suppliers of
natural gas to accept the quotation (CER, 2013d).
Supplementary Greenhouse Gas Assessment.docx 9
Supplementary Greenhouse Gas Assessment Report
Coffey Environments | Job Number 3568C
2.4.3 Support Measures
Under the carbon pricing mechanism, the Jobs and Competitiveness Program provides ongoing
assistance to entities that face high carbon costs and are constrained in their capacity to pass through
costs in global markets. The program issues free carbon units to eligible applicants.
Through the Jobs and Competitiveness Program, highly emissions-intensive trade-exposed (EITE)
activities receive assistance to cover 94.5 per cent of industry average carbon costs in the first year of
the carbon price. Moderately intensive emissions-intensive trade-exposed activities receive assistance
to cover 66 per cent of industry average carbon costs in the first year. Assistance reduces by 1.3 per
cent each year to encourage industry to cut pollution (Department of Industry, 2013).
In accordance with the Clean Energy Regulations 2011, LNG production activities, which are
moderately intensive EITE activities, will receive supplementary allocation of free carbon units under the
Jobs and Competitiveness Program. The additional number of free carbon units will be estimated
based on the final LNG emissions number and the estimated baseline allocation for EITE activities, if
assessed as eligible under the Jobs and Competitiveness Program.
2.5 Summary of Relevant Policies
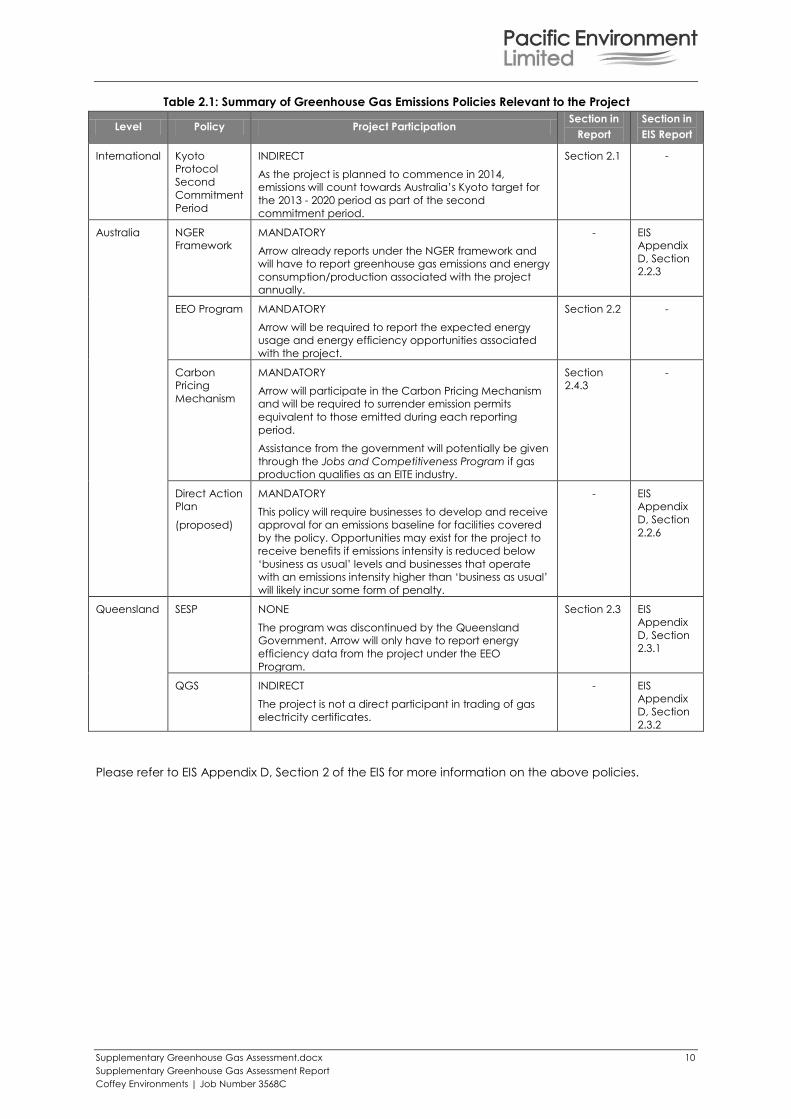
A summary of the relevant policies relating to emissions of greenhouse gases and electricity
consumption/generation from the Arrow Surat Gas Project is presented in Table 2.1.
Supplementary Greenhouse Gas Assessment.docx 10
Supplementary Greenhouse Gas Assessment Report
Coffey Environments | Job Number 3568C
Table 2.1: Summary of Greenhouse Gas Emissions Policies Relevant to the Project
Level Policy Project Participation Section in
Report
Section in
EIS Report
International Kyoto
Protocol
Second
Commitment
Period
INDIRECT
As the project is planned to commence in 2014,
emissions will count towards Australia’s Kyoto target for
the 2013 - 2020 period as part of the second
commitment period.
Section 2.1 -
Australia NGER
Framework
MANDATORY
Arrow already reports under the NGER framework and
will have to report greenhouse gas emissions and energy
consumption/production associated with the project
annually.
- EIS
Appendix
D, Section
2.2.3
EEO Program MANDATORY
Arrow will be required to report the expected energy
usage and energy efficiency opportunities associated
with the project.
Section 2.2 -
Carbon
Pricing
Mechanism
MANDATORY
Arrow will participate in the Carbon Pricing Mechanism
and will be required to surrender emission permits
equivalent to those emitted during each reporting
period.
Assistance from the government will potentially be given
through the Jobs and Competitiveness Program if gas
production qualifies as an EITE industry.
Section
2.4.3
-
Direct Action
Plan
(proposed)
MANDATORY
This policy will require businesses to develop and receive
approval for an emissions baseline for facilities covered
by the policy. Opportunities may exist for the project to
receive benefits if emissions intensity is reduced below
‘business as usual’ levels and businesses that operate
with an emissions intensity higher than ‘business as usual’
will likely incur some form of penalty.
- EIS
Appendix
D, Section
2.2.6
Queensland SESP NONE
The program was discontinued by the Queensland
Government. Arrow will only have to report energy
efficiency data from the project under the EEO
Program.
Section 2.3 EIS
Appendix
D, Section
2.3.1
QGS INDIRECT
The project is not a direct participant in trading of gas
electricity certificates.
- EIS
Appendix
D, Section
2.3.2
Please refer to EIS Appendix D, Section 2 of the EIS for more information on the above policies.
Supplementary Greenhouse Gas Assessment.docx 11
Supplementary Greenhouse Gas Assessment Report
Coffey Environments | Job Number 3568C
3 GREENHOUSE EMISSIONS ESTIMATION METHODOLOGY
3.1 Summary of Activities
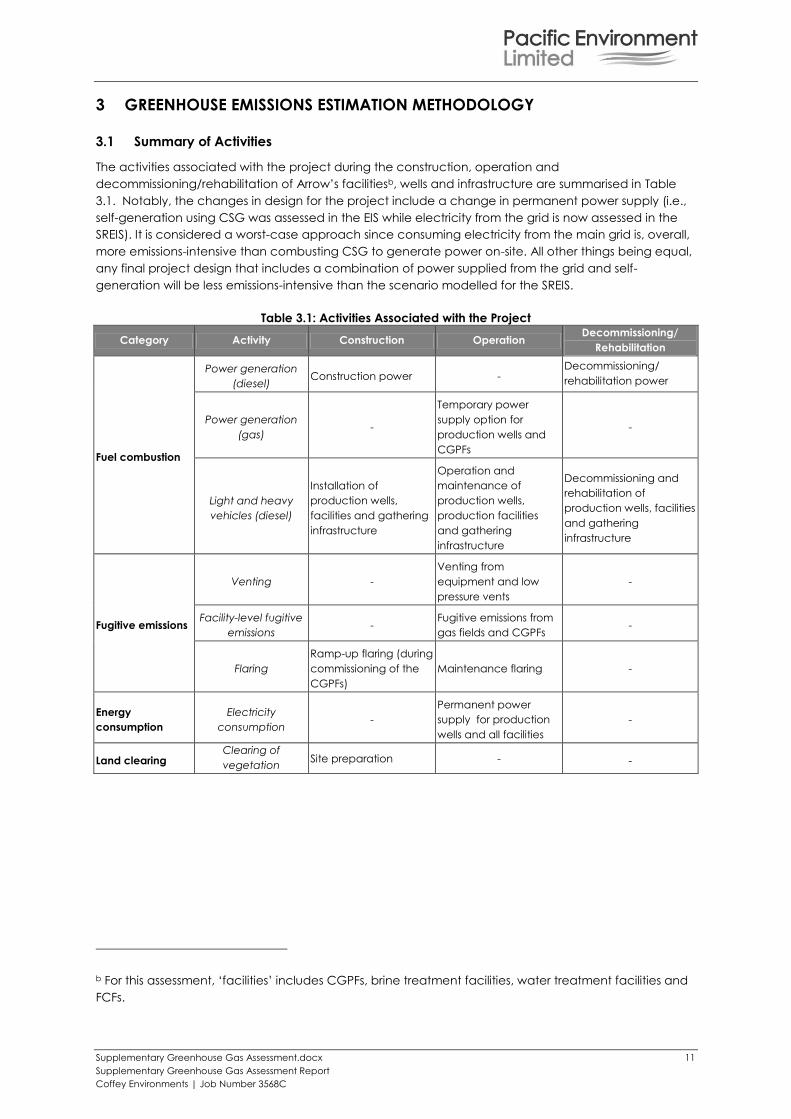
The activities associated with the project during the construction, operation and
decommissioning/rehabilitation of Arrow’s facilitiesb, wells and infrastructure are summarised in Table
3.1. Notably, the changes in design for the project include a change in permanent power supply (i.e.,
self-generation using CSG was assessed in the EIS while electricity from the grid is now assessed in the
SREIS). It is considered a worst-case approach since consuming electricity from the main grid is, overall,
more emissions-intensive than combusting CSG to generate power on-site. All other things being equal,
any final project design that includes a combination of power supplied from the grid and self-
generation will be less emissions-intensive than the scenario modelled for the SREIS.
Table 3.1: Activities Associated with the Project
Category Activity Construction Operation Decommissioning/
Rehabilitation
Fuel combustion
Power generation
(diesel) Construction power -
Decommissioning/
rehabilitation power
Power generation
(gas) -
Temporary power
supply option for
production wells and
CGPFs
-
Light and heavy
vehicles (diesel)
Installation of
production wells,
facilities and gathering
infrastructure
Operation and
maintenance of
production wells,
production facilities
and gathering
infrastructure
Decommissioning and
rehabilitation of
production wells, facilities
and gathering
infrastructure
Fugitive emissions
Venting -
Venting from
equipment and low
pressure vents
-
Facility-level fugitive
emissions -
Fugitive emissions from
gas fields and CGPFs -
Flaring
Ramp-up flaring (during
commissioning of the
CGPFs)
Maintenance flaring -
Energy
consumption
Electricity
consumption -
Permanent power
supply for production
wells and all facilities
-
Land clearing Clearing of
vegetation Site preparation - -
b For this assessment, ‘facilities’ includes CGPFs, brine treatment facilities, water treatment facilities and
FCFs.
Supplementary Greenhouse Gas Assessment.docx 12
Supplementary Greenhouse Gas Assessment Report
Coffey Environments | Job Number 3568C
3.2 Methodology Documents Updated Since Submission of EIS
Since the submission of the EIS, the following methodology documents have been updated:
The Australian National Greenhouse Accounts - National Greenhouse Accounts (NGA) Factors
(DCCEE, 2012a). c
The National Greenhouse and Energy Reporting (Measurement) Determination.
The National Greenhouse and Energy Reporting System Measurement Technical Guidelines for
the estimation of greenhouse gas emissions by facilities in Australia 2012 (Technical Guidelines),
(DCCEE, 2012b).
Greenhouse gas emissions presented in this supplementary report are based on the most recent
published guidance documents available.
Since the submission of the EIS, the scope 2 and scope 3 emission factors for electricity consumption
from the Queensland grid provided in the NGA Factors were updated. No other updates relevant to
the project were identified.
3.3 Anticipated Changes to the Methodology Documents
This assessment was prepared using a methane global warming potential (GWP) of 21 tonnes CO2-e/
tonne CH4, in accordance with the most recent National Greenhouse and Energy Reporting
(Measurement) Determination.
It should be noted that the Department of Climate Change and Energy Efficiency (DCCEE) has
indicated that an updated methane GWP of 25 tonnes CO2-e/ tonne CH4 will be adopted by the
Australian Government for the purpose of estimating emissions under the carbon pricing mechanism for
the 2017/2018 financial year and for determining the equivalent carbon applied to synthetic
greenhouse gases from 1 July 2017 (DCCEE, 2013). This revised GWP is sourced from the
Intergovernmental Panel on Climate Change (IPCC) 2007 Fourth Assessment Report (AR4) and will
replace the value used from the IPCC's Second Assessment Report (AR2). It is possible that this value
may be revised in the future by the IPCC.
The IPCC Fourth Assessment Report (IPCC, 2007) also contains an updated GWP value for nitrous oxide
of 298 tonnes CO2-e/ tonne N2O compared to a current value of 310 tonnes CO2-e/ tonne N2O that
was used in this assessment.
As a consequence of these potential future changes to the GWP, the cumulative scope 1 and scope 2
emissions estimates prepared for the project would increase by approximately 3%, based on the
updated GWPs from IPCC’s AR4 assumed to be used from 2017 onwards.
3.4 Project Phases
Emissions from each year of the project were estimated in accordance with the methodologies
described above using the emission factors in Appendix A. One worst-case year (i.e., the year
predicted to generate the most scope 1 and scope 2 emissions) was selected for each of the three
phases of the project’s development for presentation in this report, as follows:
Year 2019 for ramp-up (2014-2019).
Year 2029 for sustained production (2020-2043).
Year 2044 for ramp-down (2044-2048).
c The Department of Climate Change and Energy Efficiency (DCCEE) is now known as the Department
of Industry, Innovation, Climate Change, Science, Research and Tertiary Education (Department of
Industry).
Supplementary Greenhouse Gas Assessment.docx 13
Supplementary Greenhouse Gas Assessment Report
Coffey Environments | Job Number 3568C
The worst-case year (i.e., 2029) was subsequently presented in comparison to Queensland, Australian
and global annual emissions to assess the potential impacts of the project.
3.5 Assumptions Associated with this Assessment
The assumptions used for this assessment are presented below. These assumptions were provided by
Coffey Environments in consultation with Arrow.
3.5.1 Power Supply
Temporary power may be used for commissioning and operation of the CGPFs, water treatment
facilities, miscellaneous equipment and wells until connection to the grid is established.
For assessment purposes, an allowance of two years after commissioning for the CGPFs and six months
after commissioning for the wells has been made, after which it is assumed that connection to the
Queensland electricity grid can be established. Wells commissioned prior to the construction of a CGPF
are assumed to be self-powered for up to two years prior to supply from grid or CGPF. As higher GHG
emissions are associated with the use of electricity from the grid, this scenario is considered as the
worst-case.
For the purposes of this assessment, the following typical temporary power generation configurations
have been adopted:
47 of the 1.1 MW engines or 10 of the 5.7 MW gas turbines to deliver 50 MW of power required
for each CGPF.
60 kW for single wells.
749 kW for multi-well pads.
3.5.2 CGPF Construction and Decommissioning
The project development schedule prepared by Coffey Environments in consultation with Arrow was
used to characterise construction and decommissioning. Arrow nominated an expected 55 week
timeframe for construction of a CGPF and a 60 week timeframe for construction of a CGPF and water
treatment facility (CGPF-2 and CGPF-9). For the purposes of estimating annual greenhouse emissions,
the emissions generated in any given year were based on the activities that were expected for the
majority of the year. Therefore, construction for each CGPF was shown as occurring over 52 weeks. For
CGPF-1, CGPF-5 and CGPF-11, construction was assumed to span over two years (with the operations
phase commencing mid-way through the second year).
The decommissioning year of each CGPF was estimated based on an approximate 25 year operational
life as outlined in SREIS Chapter 3, Project Description. FCFs are expected to have a similar operational
life.
3.5.3 Maintenance Flaring
For this assessment, average planned and unplanned maintenance flaring of 662 TJ/year/CGPF during
the operational years of a CGPF were used for the eight CGPFs.
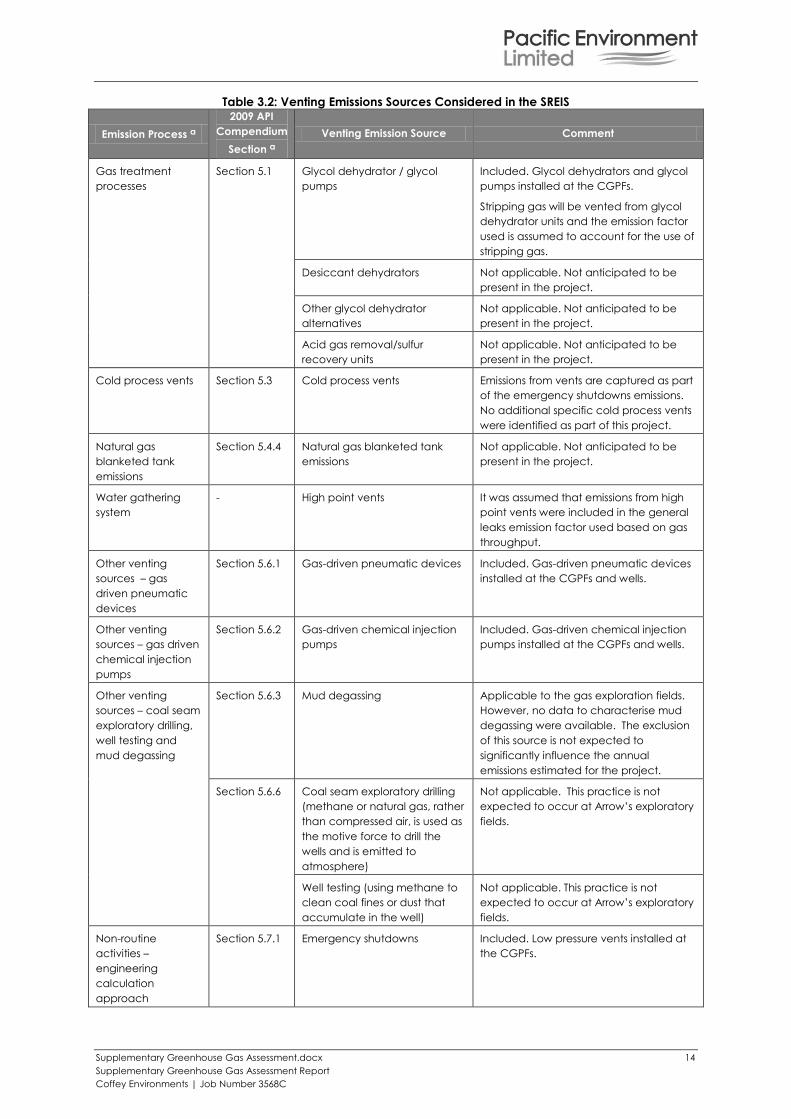
3.5.4 Venting
In addition to the emissions sources considered in the EIS, supplementary venting emissions sources
(refer to Table 3.2) are included in this assessment based on their historical proportion to Arrow’s total
gas production, sourced from their 2011/2012 NGER inventory. To estimate venting emissions, the 2012
NGER Technical Guidelines (DCCEE, 2012b) refers to the methodologies described in specific sections
of the American Petroleum Institute Compendium of Greenhouse Gas Emissions Methodologies for the
Oil and Natural Gas Industry (API Compendium) released in 2009.
Supplementary Greenhouse Gas Assessment.docx 14
Supplementary Greenhouse Gas Assessment Report
Coffey Environments | Job Number 3568C
Table 3.2: Venting Emissions Sources Considered in the SREIS
Emission Process a
2009 API
Compendium
Section a
Venting Emission Source Comment
Gas treatment
processes
Section 5.1 Glycol dehydrator / glycol
pumps
Included. Glycol dehydrators and glycol
pumps installed at the CGPFs.
Stripping gas will be vented from glycol
dehydrator units and the emission factor
used is assumed to account for the use of
stripping gas.
Desiccant dehydrators Not applicable. Not anticipated to be
present in the project.
Other glycol dehydrator
alternatives
Not applicable. Not anticipated to be
present in the project.
Acid gas removal/sulfur
recovery units
Not applicable. Not anticipated to be
present in the project.
Cold process vents Section 5.3 Cold process vents Emissions from vents are captured as part
of the emergency shutdowns emissions.
No additional specific cold process vents
were identified as part of this project.
Natural gas
blanketed tank
emissions
Section 5.4.4 Natural gas blanketed tank
emissions
Not applicable. Not anticipated to be
present in the project.
Water gathering
system
- High point vents It was assumed that emissions from high
point vents were included in the general
leaks emission factor used based on gas
throughput.
Other venting
sources – gas
driven pneumatic
devices
Section 5.6.1 Gas-driven pneumatic devices Included. Gas-driven pneumatic devices
installed at the CGPFs and wells.
Other venting
sources – gas driven
chemical injection
pumps
Section 5.6.2 Gas-driven chemical injection
pumps
Included. Gas-driven chemical injection
pumps installed at the CGPFs and wells.
Other venting
sources – coal seam
exploratory drilling,
well testing and
mud degassing
Section 5.6.3 Mud degassing Applicable to the gas exploration fields.
However, no data to characterise mud
degassing were available. The exclusion
of this source is not expected to
significantly influence the annual
emissions estimated for the project.
Section 5.6.6 Coal seam exploratory drilling
(methane or natural gas, rather
than compressed air, is used as
the motive force to drill the
wells and is emitted to
atmosphere)
Not applicable. This practice is not
expected to occur at Arrow’s exploratory
fields.
Well testing (using methane to
clean coal fines or dust that
accumulate in the well)
Not applicable. This practice is not
expected to occur at Arrow’s exploratory
fields.
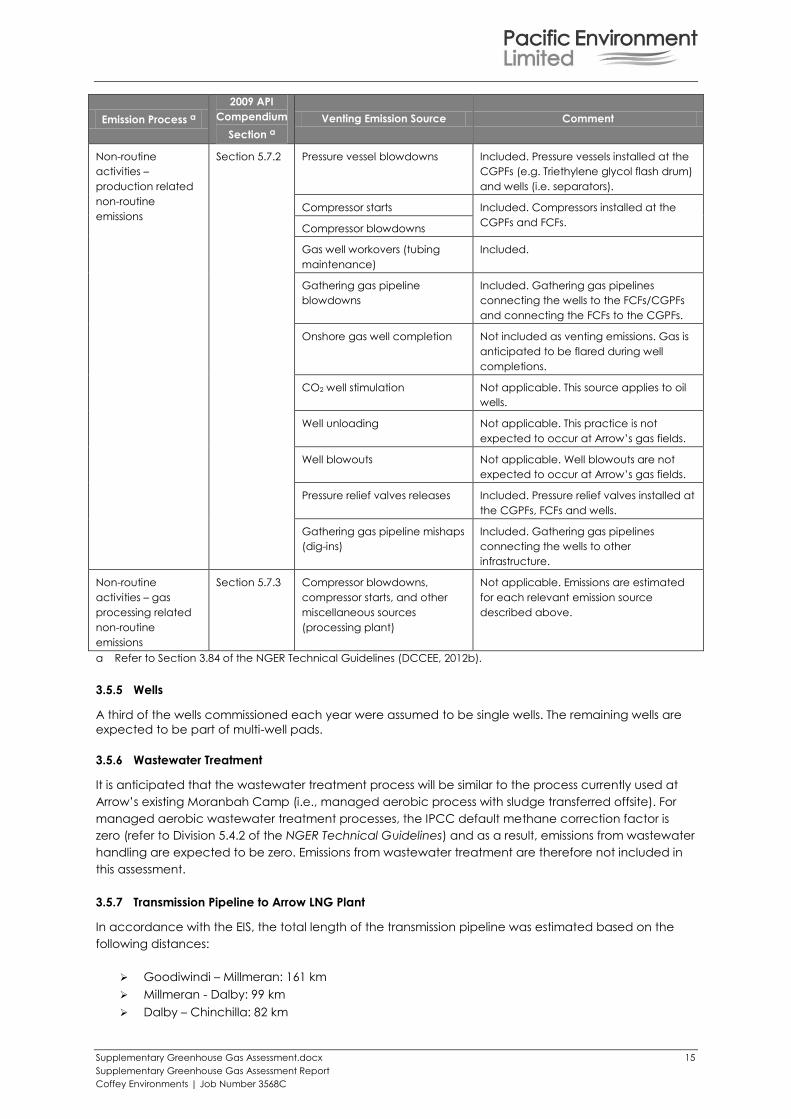
Non-routine
activities –
engineering
calculation
approach
Section 5.7.1 Emergency shutdowns Included. Low pressure vents installed at
the CGPFs.
Supplementary Greenhouse Gas Assessment.docx 15
Supplementary Greenhouse Gas Assessment Report
Coffey Environments | Job Number 3568C
Emission Process a
2009 API
Compendium
Section a
Venting Emission Source Comment
Non-routine
activities –
production related
non-routine
emissions
Section 5.7.2 Pressure vessel blowdowns Included. Pressure vessels installed at the
CGPFs (e.g. Triethylene glycol flash drum)
and wells (i.e. separators).
Compressor starts Included. Compressors installed at the
CGPFs and FCFs. Compressor blowdowns
Gas well workovers (tubing
maintenance)
Included.
Gathering gas pipeline
blowdowns
Included. Gathering gas pipelines
connecting the wells to the FCFs/CGPFs
and connecting the FCFs to the CGPFs.
Onshore gas well completion Not included as venting emissions. Gas is
anticipated to be flared during well
completions.
CO2 well stimulation Not applicable. This source applies to oil
wells.
Well unloading Not applicable. This practice is not
expected to occur at Arrow’s gas fields.
Well blowouts Not applicable. Well blowouts are not
expected to occur at Arrow’s gas fields.
Pressure relief valves releases Included. Pressure relief valves installed at
the CGPFs, FCFs and wells.
Gathering gas pipeline mishaps
(dig-ins)
Included. Gathering gas pipelines
connecting the wells to other
infrastructure.
Non-routine
activities – gas
processing related
non-routine
emissions
Section 5.7.3 Compressor blowdowns,
compressor starts, and other
miscellaneous sources
(processing plant)
Not applicable. Emissions are estimated
for each relevant emission source
described above.
a Refer to Section 3.84 of the NGER Technical Guidelines (DCCEE, 2012b).
3.5.5 Wells
A third of the wells commissioned each year were assumed to be single wells. The remaining wells are
expected to be part of multi-well pads.
3.5.6 Wastewater Treatment
It is anticipated that the wastewater treatment process will be similar to the process currently used at
Arrow’s existing Moranbah Camp (i.e., managed aerobic process with sludge transferred offsite). For
managed aerobic wastewater treatment processes, the IPCC default methane correction factor is
zero (refer to Division 5.4.2 of the NGER Technical Guidelines) and as a result, emissions from wastewater
handling are expected to be zero. Emissions from wastewater treatment are therefore not included in
this assessment.
3.5.7 Transmission Pipeline to Arrow LNG Plant
In accordance with the EIS, the total length of the transmission pipeline was estimated based on the
following distances:
Goodiwindi – Millmeran: 161 km
Millmeran - Dalby: 99 km
Dalby – Chinchilla: 82 km
Supplementary Greenhouse Gas Assessment.docx 16
Supplementary Greenhouse Gas Assessment Report
Coffey Environments | Job Number 3568C
Chinchilla – Wandoan: 115 km
Wandoan - Arrow LNG (Gladstone): 303 km.
No emissions associated with transmission of coal seam gas to Arrow LNG Plant are expected to occur
for the period 2014 – 2017 as no CGPFs will be operational until 2017.
3.5.8 Camps
As the construction of camp sites will occur a year prior to the construction of the relevant CGPFs, the
construction year of the camp sites was estimated based on the locations of the camp sites and of the
CGPFs, and the development schedule.
Supplementary Greenhouse Gas Assessment.docx 17
Supplementary Greenhouse Gas Assessment Report
Coffey Environments | Job Number 3568C
4 REVISED GHG EMISSION ESTIMATES FOR THE SURAT GAS PROJECT
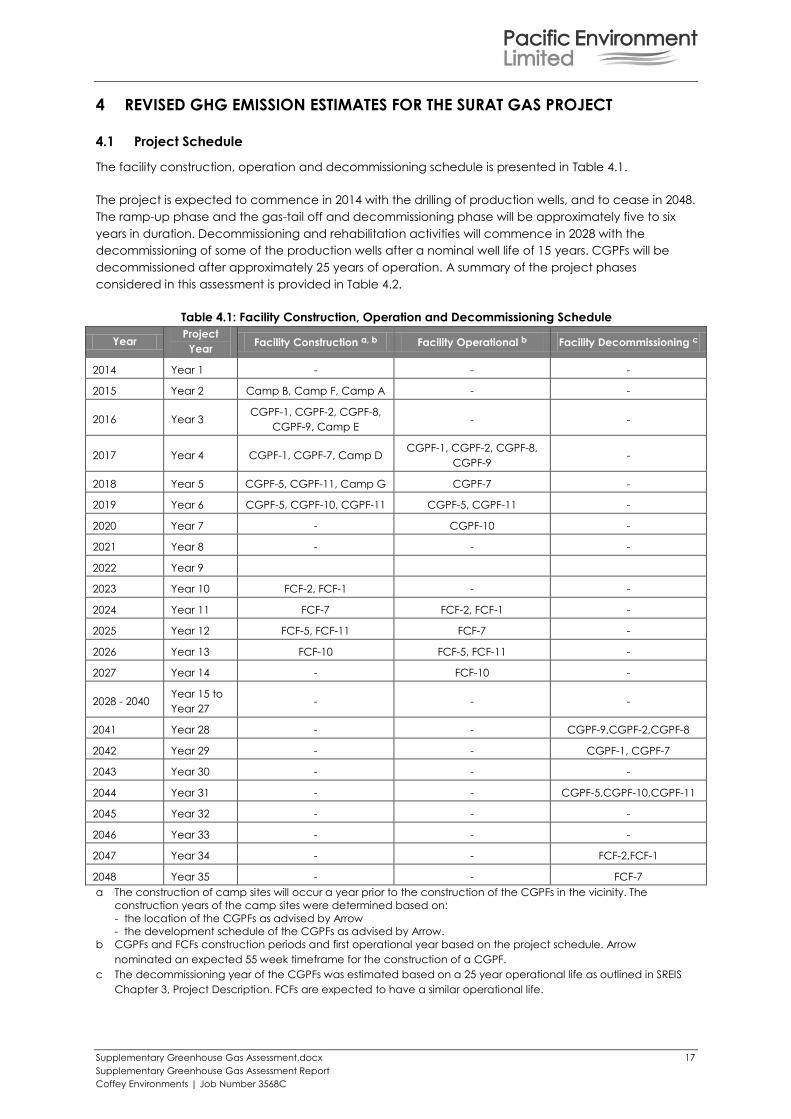
4.1 Project Schedule
The facility construction, operation and decommissioning schedule is presented in Table 4.1.
The project is expected to commence in 2014 with the drilling of production wells, and to cease in 2048.
The ramp-up phase and the gas-tail off and decommissioning phase will be approximately five to six
years in duration. Decommissioning and rehabilitation activities will commence in 2028 with the
decommissioning of some of the production wells after a nominal well life of 15 years. CGPFs will be
decommissioned after approximately 25 years of operation. A summary of the project phases
considered in this assessment is provided in Table 4.2.
Table 4.1: Facility Construction, Operation and Decommissioning Schedule
Year Project
Year Facility Construction a, b Facility Operational b Facility Decommissioning c
2014 Year 1 - - -
2015 Year 2 Camp B, Camp F, Camp A - -
2016 Year 3 CGPF-1, CGPF-2, CGPF-8,
CGPF-9, Camp E - -
2017 Year 4 CGPF-1, CGPF-7, Camp D CGPF-1, CGPF-2, CGPF-8,
CGPF-9 -
2018 Year 5 CGPF-5, CGPF-11, Camp G CGPF-7 -
2019 Year 6 CGPF-5, CGPF-10, CGPF-11 CGPF-5, CGPF-11 -
2020 Year 7 - CGPF-10 -
2021 Year 8 - - -
2022 Year 9
2023 Year 10 FCF-2, FCF-1 - -
2024 Year 11 FCF-7 FCF-2, FCF-1 -
2025 Year 12 FCF-5, FCF-11 FCF-7 -
2026 Year 13 FCF-10 FCF-5, FCF-11 -
2027 Year 14 - FCF-10 -
2028 - 2040 Year 15 to
Year 27 - - -
2041 Year 28 - - CGPF-9,CGPF-2,CGPF-8
2042 Year 29 - - CGPF-1, CGPF-7
2043 Year 30 - - -
2044 Year 31 - - CGPF-5,CGPF-10,CGPF-11
2045 Year 32 - - -
2046 Year 33 - - -
2047 Year 34 - - FCF-2,FCF-1
2048 Year 35 - - FCF-7
a The construction of camp sites will occur a year prior to the construction of the CGPFs in the vicinity. The
construction years of the camp sites were determined based on:
- the location of the CGPFs as advised by Arrow
- the development schedule of the CGPFs as advised by Arrow. b CGPFs and FCFs construction periods and first operational year based on the project schedule. Arrow
nominated an expected 55 week timeframe for the construction of a CGPF.
c The decommissioning year of the CGPFs was estimated based on a 25 year operational life as outlined in SREIS
Chapter 3, Project Description. FCFs are expected to have a similar operational life.
Supplementary Greenhouse Gas Assessment.docx 18
Supplementary Greenhouse Gas Assessment Report
Coffey Environments | Job Number 3568C
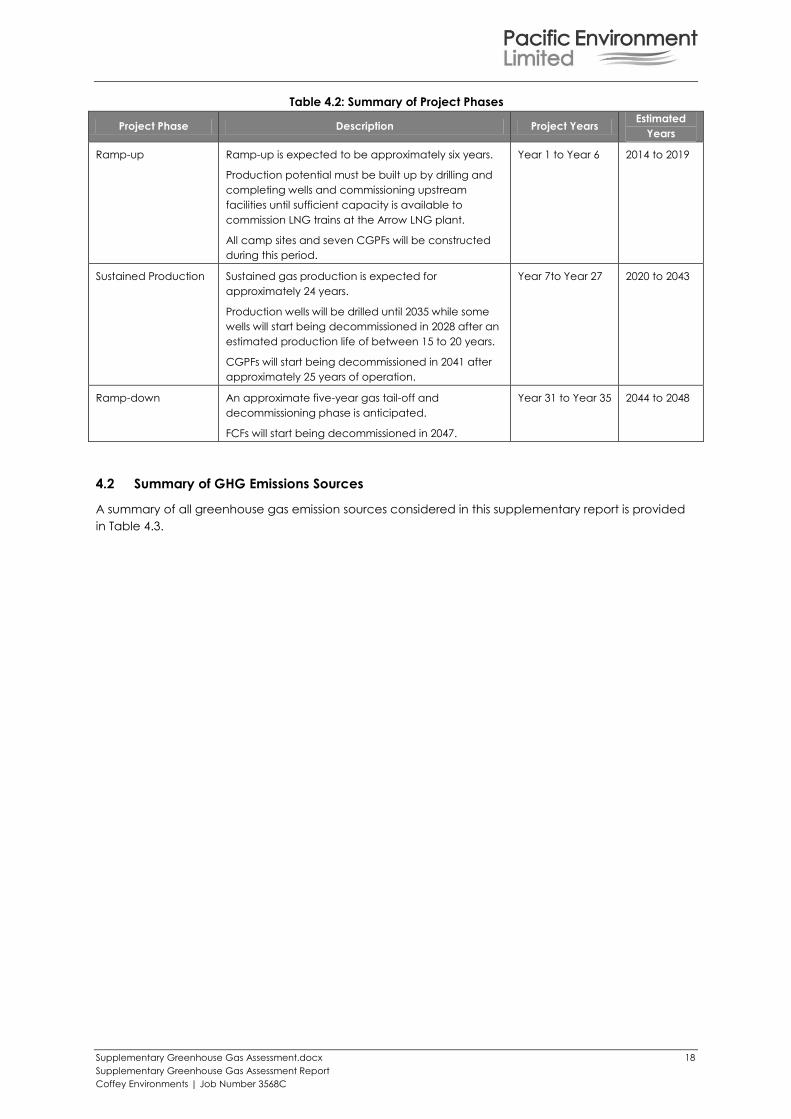
Table 4.2: Summary of Project Phases
Project Phase Description Project Years Estimated
Years
Ramp-up Ramp-up is expected to be approximately six years.
Production potential must be built up by drilling and
completing wells and commissioning upstream
facilities until sufficient capacity is available to
commission LNG trains at the Arrow LNG plant.
All camp sites and seven CGPFs will be constructed
during this period.
Year 1 to Year 6 2014 to 2019
Sustained Production Sustained gas production is expected for
approximately 24 years.
Production wells will be drilled until 2035 while some
wells will start being decommissioned in 2028 after an
estimated production life of between 15 to 20 years.
CGPFs will start being decommissioned in 2041 after
approximately 25 years of operation.
Year 7to Year 27 2020 to 2043
Ramp-down An approximate five-year gas tail-off and
decommissioning phase is anticipated.
FCFs will start being decommissioned in 2047.
Year 31 to Year 35 2044 to 2048
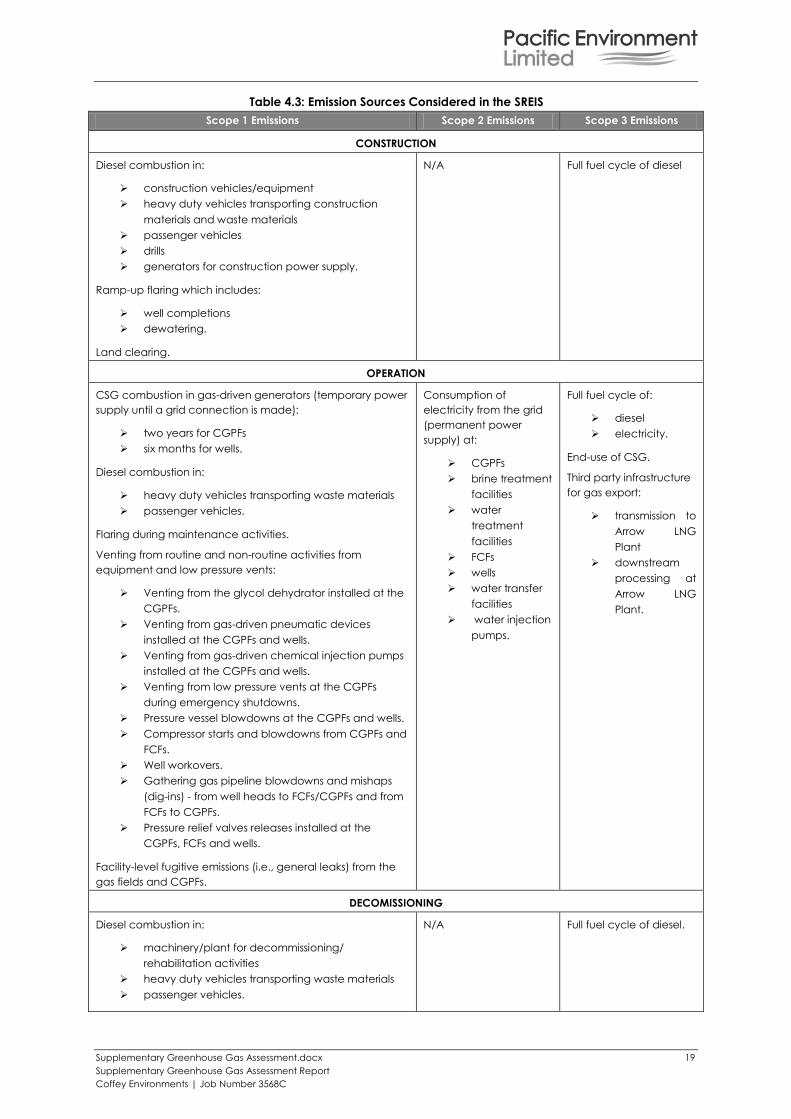
4.2 Summary of GHG Emissions Sources
A summary of all greenhouse gas emission sources considered in this supplementary report is provided
in Table 4.3.
Supplementary Greenhouse Gas Assessment.docx 19
Supplementary Greenhouse Gas Assessment Report
Coffey Environments | Job Number 3568C
Table 4.3: Emission Sources Considered in the SREIS
Scope 1 Emissions Scope 2 Emissions Scope 3 Emissions
CONSTRUCTION
Diesel combustion in:
construction vehicles/equipment
heavy duty vehicles transporting construction
materials and waste materials
passenger vehicles
drills
generators for construction power supply.
Ramp-up flaring which includes:
well completions
dewatering.
Land clearing.
N/A Full fuel cycle of diesel
OPERATION
CSG combustion in gas-driven generators (temporary power
supply until a grid connection is made):
two years for CGPFs
six months for wells.
Diesel combustion in:
heavy duty vehicles transporting waste materials
passenger vehicles.
Flaring during maintenance activities.
Venting from routine and non-routine activities from
equipment and low pressure vents:
Venting from the glycol dehydrator installed at the
CGPFs.
Venting from gas-driven pneumatic devices
installed at the CGPFs and wells.
Venting from gas-driven chemical injection pumps
installed at the CGPFs and wells.
Venting from low pressure vents at the CGPFs
during emergency shutdowns.
Pressure vessel blowdowns at the CGPFs and wells.
Compressor starts and blowdowns from CGPFs and
FCFs.
Well workovers.
Gathering gas pipeline blowdowns and mishaps
(dig-ins) - from well heads to FCFs/CGPFs and from
FCFs to CGPFs.
Pressure relief valves releases installed at the
CGPFs, FCFs and wells.
Facility-level fugitive emissions (i.e., general leaks) from the
gas fields and CGPFs.
Consumption of
electricity from the grid
(permanent power
supply) at:
CGPFs
brine treatment
facilities
water
treatment
facilities
FCFs
wells
water transfer
facilities
water injection
pumps.
Full fuel cycle of:
diesel
electricity.
End-use of CSG.
Third party infrastructure
for gas export:
transmission to
Arrow LNG
Plant
downstream
processing at
Arrow LNG
Plant.
DECOMISSIONING
Diesel combustion in:
machinery/plant for decommissioning/
rehabilitation activities
heavy duty vehicles transporting waste materials
passenger vehicles.
N/A Full fuel cycle of diesel.
Supplementary Greenhouse Gas Assessment.docx 20
Supplementary Greenhouse Gas Assessment Report
Coffey Environments | Job Number 3568C
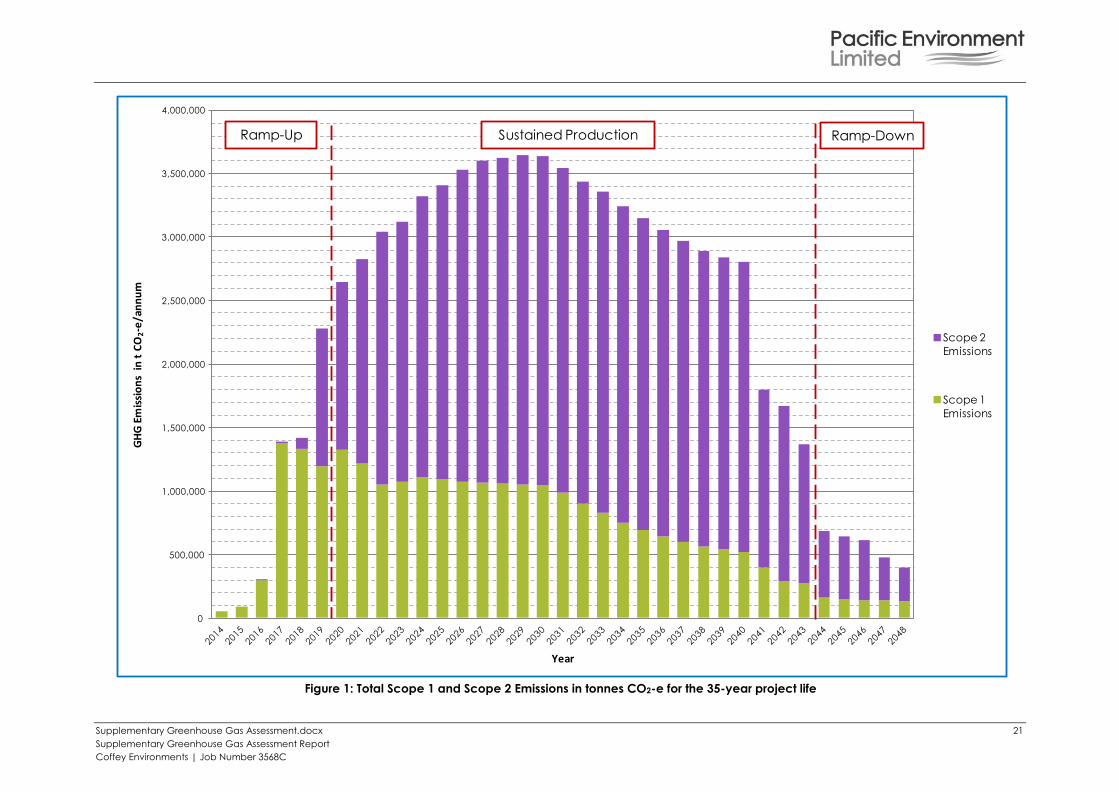
4.3 Revised Estimated Emissions
Figure 1 shows the annual scope 1 and scope 2 greenhouse gas emissions associated with the
construction, operation and decommissioning/rehabilitation activities for the life of the project. Based
on Figure 1, the year that generates the highest scope 1 and scope 2 greenhouse emission estimates
was selected for each project phase (i.e., ramp-up, sustained production and ramp-down) in order to
present the most conservative estimates (i.e., a worst-case year). Year 2019, Year 2029 and Year 2044
were selected as the worst-case years for the three selected phases. The greenhouse emission
estimates for each worst-case year are presented in sections 4.3.1 to 4.3.3.
Note that only scope 1 and scope 2 emissions were presented in Figure 1 as these emissions provide the
most robust basis for comparing performance with other projects. Scope 3 emissions do not provide
useful comparisons with other projects due to differing project boundaries in many cases.
CGPFs will start being decommissioned in 2041 after approximately 25 years of operation, which
explains the significant drop in emissions for that year.
Supplementary Greenhouse Gas Assessment.docx 21
Supplementary Greenhouse Gas Assessment Report
Coffey Environments | Job Number 3568C
Figure 1: Total Scope 1 and Scope 2 Emissions in tonnes CO2-e for the 35-year project life
0
500,000
1,000,000
1,500,000
2,000,000
2,500,000
3,000,000
3,500,000
4,000,000
GH
G E
mis
sio
ns
in t
CO
2-e
/an
nu
m
Year
Scope 2
Emissions
Scope 1
Emissions
Ramp-Up Sustained Production Ramp-Down
Supplementary Greenhouse Gas Assessment.docx 22
Supplementary Greenhouse Gas Assessment Report
Coffey Environments | Job Number 3568C
4.3.1 Ramp-up Emissions
The combined scope 1 and scope 2 emissions generated during worst-case year 2019 during the ramp-
up phase (i.e., 2014 to 2019) were estimated to be approximately 2,281 kt CO2-e. The breakdown of
scope 1, scope 2 and scope 3 emission estimates, categorised by source, for year 2019 is presented in
Table 4.4.
In 2019, an equivalent d number of 371 wells are expected to be self-powered whereas an equivalent
number of 990 wells will be connected to the grid for the entire year. Three of the commissioned CGPFs
are anticipated to be self- powered for six months and connected to the main grid for the remaining six
months, while the fourth CGPF will be self-powered for the entire year.
Scope 1 ramp-up emissions will be mainly associated with gas combustion in gas-driven generators (to
provide temporary power to wells and CGPFs until a grid connection is made), and fugitive emissions.
The total annual scope 1 emissions were estimated to be approximately 1,199 kt CO2-e/annum (i.e.,
52.6% of the total scope 1 and scope 2 emissions), as shown in Table 4.4.
Scope 2 ramp-up emissions will be mainly associated with the consumption of electricity at all facilities
and wells (once connection to the grid is made, negating the need for gas-driven generators to supply
power to the wells and CGPFs). The total annual scope 2 emissions were estimated to be approximately
1,082 kt CO2-e/annum, as shown in Table 4.4, which will represent 47.4% of the scope 1 and scope 2
emissions that will be generated during Year 2019.
Scope 3 emissions will primarily be associated with the combustion of CSG by end-users. The total
annual scope 3 emissions were estimated to be approximately 15,840 kt CO2-e/annum (see Table 4.4),
which will correspond to around seven times the quantity of scope 1 and scope 2 emissions generated
during Year 2019.
d As some wells will be self-powered for a duration of two years and other wells will be self-powered for
a duration of six months, an equivalent number of self-powered wells for the full year is presented.
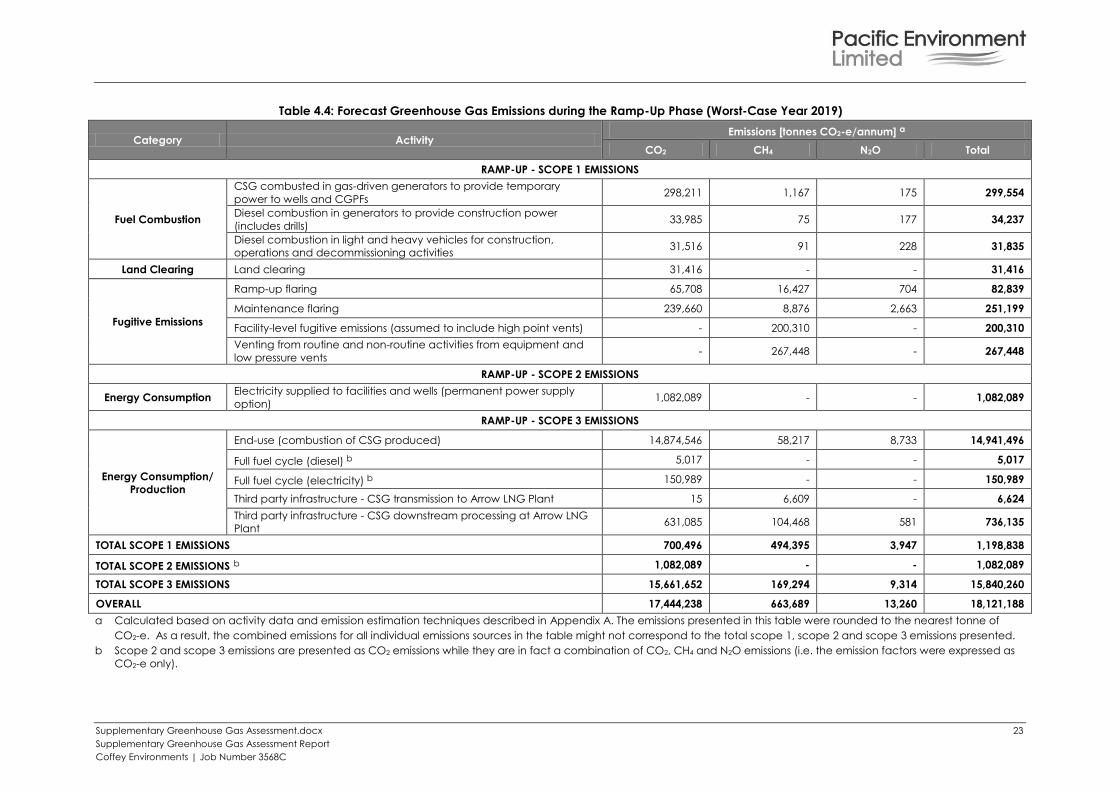
Supplementary Greenhouse Gas Assessment.docx 23
Supplementary Greenhouse Gas Assessment Report
Coffey Environments | Job Number 3568C
Table 4.4: Forecast Greenhouse Gas Emissions during the Ramp-Up Phase (Worst-Case Year 2019)
Category Activity Emissions [tonnes CO2-e/annum] a
CO2 CH4 N2O Total
RAMP-UP - SCOPE 1 EMISSIONS
Fuel Combustion
CSG combusted in gas-driven generators to provide temporary
power to wells and CGPFs 298,211 1,167 175 299,554
Diesel combustion in generators to provide construction power
(includes drills) 33,985 75 177 34,237
Diesel combustion in light and heavy vehicles for construction,
operations and decommissioning activities 31,516 91 228 31,835
Land Clearing Land clearing 31,416 - - 31,416
Fugitive Emissions
Ramp-up flaring 65,708 16,427 704 82,839
Maintenance flaring 239,660 8,876 2,663 251,199
Facility-level fugitive emissions (assumed to include high point vents) - 200,310 - 200,310
Venting from routine and non-routine activities from equipment and
low pressure vents - 267,448 - 267,448
RAMP-UP - SCOPE 2 EMISSIONS
Energy Consumption Electricity supplied to facilities and wells (permanent power supply
option) 1,082,089 - - 1,082,089
RAMP-UP - SCOPE 3 EMISSIONS
Energy Consumption/
Production
End-use (combustion of CSG produced) 14,874,546 58,217 8,733 14,941,496
Full fuel cycle (diesel) b 5,017 - - 5,017
Full fuel cycle (electricity) b 150,989 - - 150,989
Third party infrastructure - CSG transmission to Arrow LNG Plant 15 6,609 - 6,624
Third party infrastructure - CSG downstream processing at Arrow LNG
Plant 631,085 104,468 581 736,135
TOTAL SCOPE 1 EMISSIONS 700,496 494,395 3,947 1,198,838
TOTAL SCOPE 2 EMISSIONS b 1,082,089 - - 1,082,089
TOTAL SCOPE 3 EMISSIONS 15,661,652 169,294 9,314 15,840,260
OVERALL 17,444,238 663,689 13,260 18,121,188
a Calculated based on activity data and emission estimation techniques described in Appendix A. The emissions presented in this table were rounded to the nearest tonne of
CO2-e. As a result, the combined emissions for all individual emissions sources in the table might not correspond to the total scope 1, scope 2 and scope 3 emissions presented.
b Scope 2 and scope 3 emissions are presented as CO2 emissions while they are in fact a combination of CO2, CH4 and N2O emissions (i.e. the emission factors were expressed as
CO2-e only).
Supplementary Greenhouse Gas Assessment.docx 24
Supplementary Greenhouse Gas Assessment Report
Coffey Environments | Job Number 3568C
4.3.2 Sustained Production Emissions
Worst-case year 2029 is anticipated to generate the highest emissions for the entire life of the project.
As a result, the emissions generated for this year were compared to Queensland, Australian and Global
annual emissions to assess the potential impacts of the project.
The combined scope 1 and scope 2 emissions generated during year 2029 during the sustained
production phase (i.e., 2020 to 2043) was estimated to be approximately 3,644 kt CO2-e. The
breakdown of scope 1, scope 2 and scope 3 emission estimates, categorised by source, for year 2029
are presented in Table 4.5.
Scope 1 emissions will be mainly associated with fugitive emissions, which include maintenance flaring,
facility-level fugitive emissions and venting. Commissioning of all facilities (including the FCFs) will be
completed by 2027. At this time, it is planned all CGPFs and FCFs will be powered from the Queensland
electricity grid and temporary gas-driven generators will only be in operation at some wells. Ramp-up
flaring (occurring during the commissioning of the CGPFs) will have also ceased at this time. The total
annual scope 1 emissions were estimated to be approximately 1,053 kt CO2-e/annum (i.e., 28.9% of the
total scope 1 and scope 2 emissions), as shown in Table 4.5.
Scope 2 emissions will be mainly associated with the consumption of electricity from the grid at the
facilities and wells. The total annual scope 2 emissions were estimated to be approximately
2,590 kt CO2-e/annum, as shown in Table 4.5, which will represent approximately 71.1% of the scope 1
and scope 2 emissions that will be generated during Year 2029.
Scope 3 emissions will primarily be associated with the combustion of CSG by end-users. The total
annual scope 3 emissions were estimated to be approximately 24,880 kt CO2-e/annum, as shown in
Table 4.5. This corresponds to around seven times the quantity of scope 1 and scope 2 emissions
generated during Year 2029.
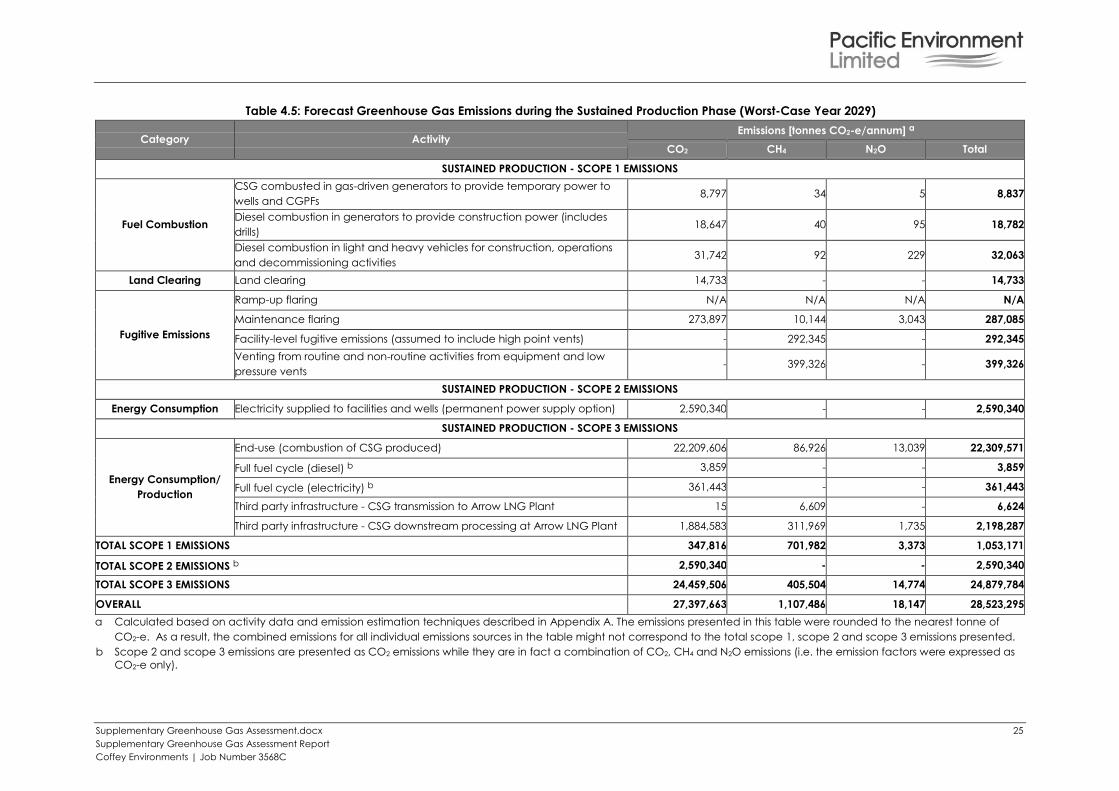
Supplementary Greenhouse Gas Assessment.docx 25
Supplementary Greenhouse Gas Assessment Report
Coffey Environments | Job Number 3568C
Table 4.5: Forecast Greenhouse Gas Emissions during the Sustained Production Phase (Worst-Case Year 2029)
Category Activity Emissions [tonnes CO2-e/annum] a
CO2 CH4 N2O Total
SUSTAINED PRODUCTION - SCOPE 1 EMISSIONS
Fuel Combustion
CSG combusted in gas-driven generators to provide temporary power to
wells and CGPFs 8,797 34 5 8,837
Diesel combustion in generators to provide construction power (includes
drills) 18,647 40 95 18,782
Diesel combustion in light and heavy vehicles for construction, operations
and decommissioning activities 31,742 92 229 32,063
Land Clearing Land clearing 14,733 - - 14,733
Fugitive Emissions
Ramp-up flaring N/A N/A N/A N/A
Maintenance flaring 273,897 10,144 3,043 287,085
Facility-level fugitive emissions (assumed to include high point vents) - 292,345 - 292,345
Venting from routine and non-routine activities from equipment and low
pressure vents - 399,326 - 399,326
SUSTAINED PRODUCTION - SCOPE 2 EMISSIONS
Energy Consumption Electricity supplied to facilities and wells (permanent power supply option) 2,590,340 - - 2,590,340
SUSTAINED PRODUCTION - SCOPE 3 EMISSIONS
Energy Consumption/
Production
End-use (combustion of CSG produced) 22,209,606 86,926 13,039 22,309,571
Full fuel cycle (diesel) b 3,859 - - 3,859
Full fuel cycle (electricity) b 361,443 - - 361,443
Third party infrastructure - CSG transmission to Arrow LNG Plant 15 6,609 - 6,624
Third party infrastructure - CSG downstream processing at Arrow LNG Plant 1,884,583 311,969 1,735 2,198,287
TOTAL SCOPE 1 EMISSIONS 347,816 701,982 3,373 1,053,171
TOTAL SCOPE 2 EMISSIONS b 2,590,340 - - 2,590,340
TOTAL SCOPE 3 EMISSIONS 24,459,506 405,504 14,774 24,879,784
OVERALL 27,397,663 1,107,486 18,147 28,523,295
a Calculated based on activity data and emission estimation techniques described in Appendix A. The emissions presented in this table were rounded to the nearest tonne of
CO2-e. As a result, the combined emissions for all individual emissions sources in the table might not correspond to the total scope 1, scope 2 and scope 3 emissions presented.
b Scope 2 and scope 3 emissions are presented as CO2 emissions while they are in fact a combination of CO2, CH4 and N2O emissions (i.e. the emission factors were expressed as
CO2-e only).

Supplementary Greenhouse Gas Assessment.docx 26
Supplementary Greenhouse Gas Assessment Report
Coffey Environments | Job Number 3568C
4.3.3 Ramp-down Emissions
Worst-case year 2044 for the ramp-down phase (i.e., 2044 – 2048) is anticipated to generate
significantly less emissions than the worst-case years associated with the ramp-up and sustained
production phases.
The combined scope 1 and scope 2 emissions generated during Year 2044 for the ramp-down phase
were estimated to be approximately 688 kt CO2-e. The breakdown of scope 1, scope 2 and scope 3
emission estimates, categorised by source, for year 2044 are presented in Table 4.6.
Scope 1 ramp-down emissions will be mainly associated with fugitive emissions, which include facility-
level fugitive emissions and venting. However, these emissions will be less significant than for Year 2029,
as most of the CGPFs will be decommissioned by that time. The total annual scope 1 emissions were
estimated to be approximately 158 kt CO2-e (i.e., 23.1% of the total scope 1 and scope 2 emissions), as
shown in Table 4.6.
Scope 2 ramp-down emissions will be mainly associated with the consumption of electricity from the
grid at the remaining facilities and wells. However, these emissions will be less significant than for Year
2029 as 75% of the wells and the majority of the CGPFs are anticipated to be decommissioned by that
stage. The total annual scope 2 emissions were estimated to be approximately 529 kt CO2-e, as shown
in Table 4.6, which represent approximately 76.9% of the scope 1 and scope 2 emissions that will be
generated during Year 2044.
Scope 3 emissions will primarily be associated with the combustion of CSG by end-users. The total
annual scope 3 emissions were estimated to be approximately 4,818 kt CO2-e/annum, as shown in
Table 4.6, which corresponds to around seven times the quantity of scope 1 and scope 2 emissions
generated during Year 2044.
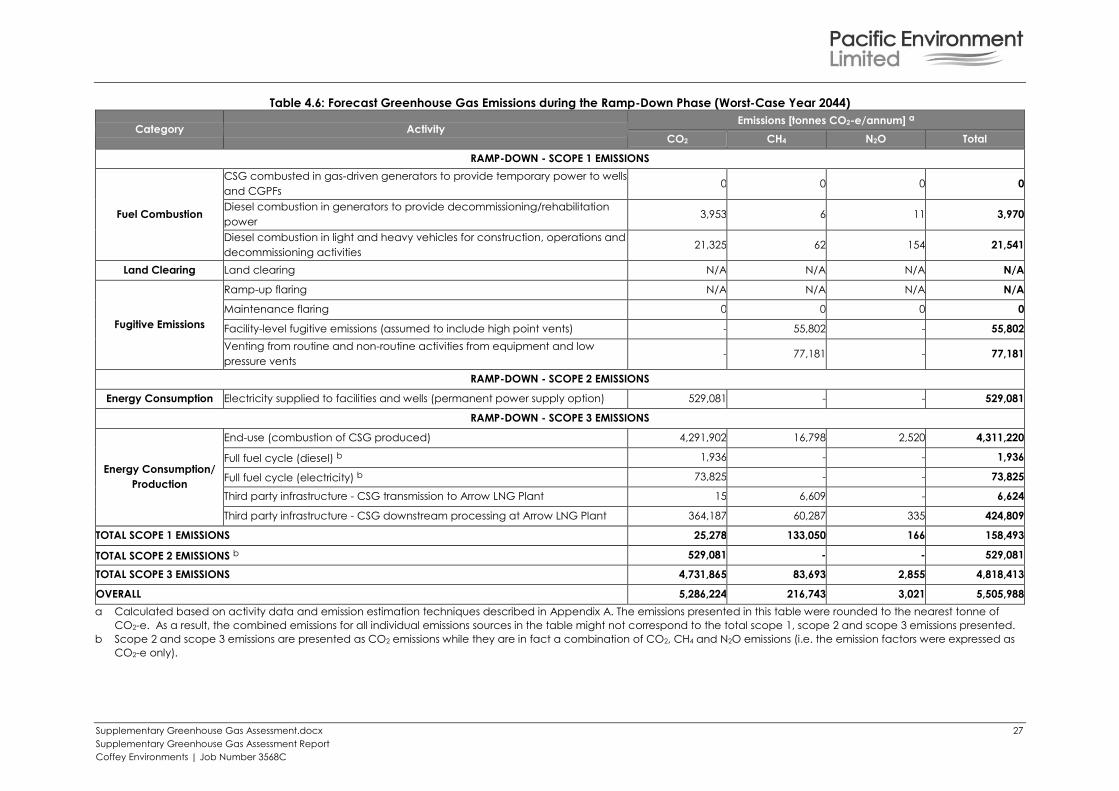
Supplementary Greenhouse Gas Assessment.docx 27
Supplementary Greenhouse Gas Assessment Report
Coffey Environments | Job Number 3568C
Table 4.6: Forecast Greenhouse Gas Emissions during the Ramp-Down Phase (Worst-Case Year 2044)
Category Activity Emissions [tonnes CO2-e/annum] a
CO2 CH4 N2O Total
RAMP-DOWN - SCOPE 1 EMISSIONS
Fuel Combustion
CSG combusted in gas-driven generators to provide temporary power to wells
and CGPFs 0 0 0 0
Diesel combustion in generators to provide decommissioning/rehabilitation
power 3,953 6 11 3,970
Diesel combustion in light and heavy vehicles for construction, operations and
decommissioning activities 21,325 62 154 21,541
Land Clearing Land clearing N/A N/A N/A N/A
Fugitive Emissions
Ramp-up flaring N/A N/A N/A N/A
Maintenance flaring 0 0 0 0
Facility-level fugitive emissions (assumed to include high point vents) - 55,802 - 55,802
Venting from routine and non-routine activities from equipment and low
pressure vents - 77,181 - 77,181
RAMP-DOWN - SCOPE 2 EMISSIONS
Energy Consumption Electricity supplied to facilities and wells (permanent power supply option) 529,081 - - 529,081
RAMP-DOWN - SCOPE 3 EMISSIONS
Energy Consumption/
Production
End-use (combustion of CSG produced) 4,291,902 16,798 2,520 4,311,220
Full fuel cycle (diesel) b 1,936 - - 1,936
Full fuel cycle (electricity) b 73,825 - - 73,825
Third party infrastructure - CSG transmission to Arrow LNG Plant 15 6,609 - 6,624
Third party infrastructure - CSG downstream processing at Arrow LNG Plant 364,187 60,287 335 424,809
TOTAL SCOPE 1 EMISSIONS 25,278 133,050 166 158,493
TOTAL SCOPE 2 EMISSIONS b 529,081 - - 529,081
TOTAL SCOPE 3 EMISSIONS 4,731,865 83,693 2,855 4,818,413
OVERALL 5,286,224 216,743 3,021 5,505,988
a Calculated based on activity data and emission estimation techniques described in Appendix A. The emissions presented in this table were rounded to the nearest tonne of
CO2-e. As a result, the combined emissions for all individual emissions sources in the table might not correspond to the total scope 1, scope 2 and scope 3 emissions presented.
b Scope 2 and scope 3 emissions are presented as CO2 emissions while they are in fact a combination of CO2, CH4 and N2O emissions (i.e. the emission factors were expressed as
CO2-e only).
Supplementary Greenhouse Gas Assessment.docx 28
Supplementary Greenhouse Gas Assessment Report
Coffey Environments | Job Number 3568C
4.3.4 Annual and Cumulative Emissions
Annual emissions for the entire life of the project are presented in Table 4.7. The cumulative scope 1
and scope 2 emissions associated with the project were estimated to be 80.9 Mt CO2-e. The total
cumulative emissions for the project (scope 1, scope 2 and scope 3 emissions) were estimated to be
533.8 Mt CO2-e. The methodology and data used to generate these annual emission estimates are
provided in Appendix A.
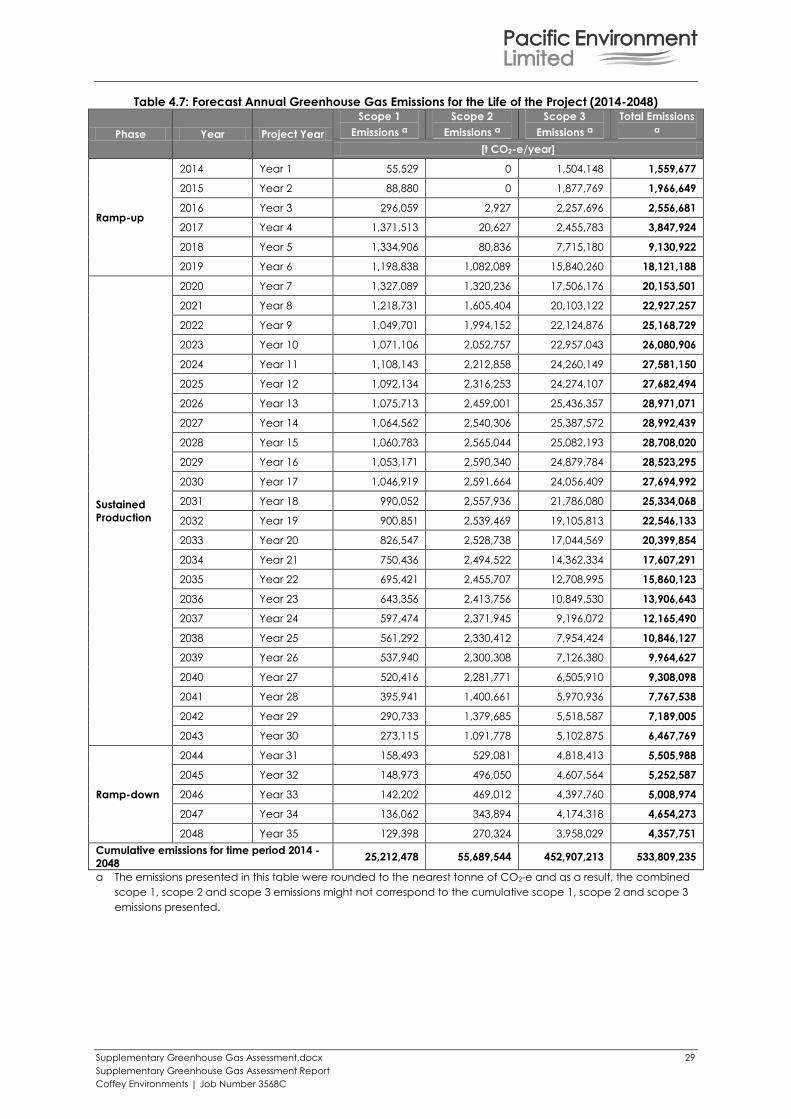
Supplementary Greenhouse Gas Assessment.docx 29
Supplementary Greenhouse Gas Assessment Report
Coffey Environments | Job Number 3568C
Table 4.7: Forecast Annual Greenhouse Gas Emissions for the Life of the Project (2014-2048)
Phase Year Project Year
Scope 1
Emissions a
Scope 2
Emissions a
Scope 3
Emissions a
Total Emissions a
[t CO2-e/year]
Ramp-up
2014 Year 1 55,529 0 1,504,148 1,559,677
2015 Year 2 88,880 0 1,877,769 1,966,649
2016 Year 3 296,059 2,927 2,257,696 2,556,681
2017 Year 4 1,371,513 20,627 2,455,783 3,847,924
2018 Year 5 1,334,906 80,836 7,715,180 9,130,922
2019 Year 6 1,198,838 1,082,089 15,840,260 18,121,188
Sustained
Production
2020 Year 7 1,327,089 1,320,236 17,506,176 20,153,501
2021 Year 8 1,218,731 1,605,404 20,103,122 22,927,257
2022 Year 9 1,049,701 1,994,152 22,124,876 25,168,729
2023 Year 10 1,071,106 2,052,757 22,957,043 26,080,906
2024 Year 11 1,108,143 2,212,858 24,260,149 27,581,150
2025 Year 12 1,092,134 2,316,253 24,274,107 27,682,494
2026 Year 13 1,075,713 2,459,001 25,436,357 28,971,071
2027 Year 14 1,064,562 2,540,306 25,387,572 28,992,439
2028 Year 15 1,060,783 2,565,044 25,082,193 28,708,020
2029 Year 16 1,053,171 2,590,340 24,879,784 28,523,295
2030 Year 17 1,046,919 2,591,664 24,056,409 27,694,992
2031 Year 18 990,052 2,557,936 21,786,080 25,334,068
2032 Year 19 900,851 2,539,469 19,105,813 22,546,133
2033 Year 20 826,547 2,528,738 17,044,569 20,399,854
2034 Year 21 750,436 2,494,522 14,362,334 17,607,291
2035 Year 22 695,421 2,455,707 12,708,995 15,860,123
2036 Year 23 643,356 2,413,756 10,849,530 13,906,643
2037 Year 24 597,474 2,371,945 9,196,072 12,165,490
2038 Year 25 561,292 2,330,412 7,954,424 10,846,127
2039 Year 26 537,940 2,300,308 7,126,380 9,964,627
2040 Year 27 520,416 2,281,771 6,505,910 9,308,098
2041 Year 28 395,941 1,400,661 5,970,936 7,767,538
2042 Year 29 290,733 1,379,685 5,518,587 7,189,005
2043 Year 30 273,115 1,091,778 5,102,875 6,467,769
Ramp-down
2044 Year 31 158,493 529,081 4,818,413 5,505,988
2045 Year 32 148,973 496,050 4,607,564 5,252,587
2046 Year 33 142,202 469,012 4,397,760 5,008,974
2047 Year 34 136,062 343,894 4,174,318 4,654,273
2048 Year 35 129,398 270,324 3,958,029 4,357,751
Cumulative emissions for time period 2014 -
2048 25,212,478 55,689,544 452,907,213 533,809,235
a The emissions presented in this table were rounded to the nearest tonne of CO2-e and as a result, the combined
scope 1, scope 2 and scope 3 emissions might not correspond to the cumulative scope 1, scope 2 and scope 3
emissions presented.
Supplementary Greenhouse Gas Assessment.docx 30
Supplementary Greenhouse Gas Assessment Report
Coffey Environments | Job Number 3568C
4.4 Comparison with the Previous Assessment
A comparison between the emissions estimates presented in the EIS and presented in the SREIS is
provided in this section. This comparison will assist in assessing the impacts of the revisions made to the
project description on the projected greenhouse emission estimates.
Comparative emission estimates for each determined worst-case year and explanations for the
encountered variations are presented in:
Table 4.8 for Year 2019 of the ramp-up phase. Year 2019 was also calculated as the worst-case
year for the ramp-up phase in the EIS.
Table 4.9 for Year 2029 of the sustained production phase. Year 2030 was calculated as the
worst-case year for the sustained production phase in the EIS.
Table 4.10 for Year 2044 of the ramp-down phase. Year 2040 was calculated as the worst-case
year for the ramp-down phase in the EIS.
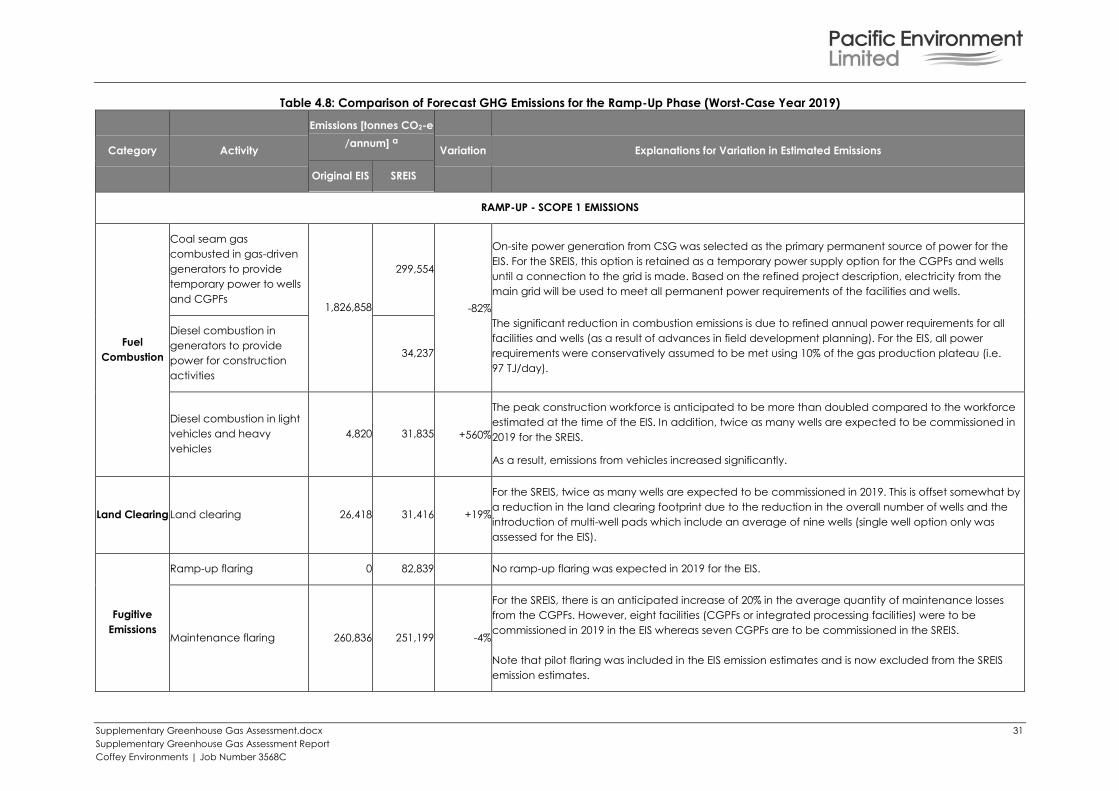
Supplementary Greenhouse Gas Assessment.docx 31
Supplementary Greenhouse Gas Assessment Report
Coffey Environments | Job Number 3568C
Table 4.8: Comparison of Forecast GHG Emissions for the Ramp-Up Phase (Worst-Case Year 2019)
Category Activity
Emissions [tonnes CO2-e
/annum] a Variation Explanations for Variation in Estimated Emissions
Original EIS SREIS
RAMP-UP - SCOPE 1 EMISSIONS
Fuel
Combustion
Coal seam gas
combusted in gas-driven
generators to provide
temporary power to wells
and CGPFs 1,826,858
299,554
-82%
On-site power generation from CSG was selected as the primary permanent source of power for the
EIS. For the SREIS, this option is retained as a temporary power supply option for the CGPFs and wells
until a connection to the grid is made. Based on the refined project description, electricity from the
main grid will be used to meet all permanent power requirements of the facilities and wells.
The significant reduction in combustion emissions is due to refined annual power requirements for all
facilities and wells (as a result of advances in field development planning). For the EIS, all power
requirements were conservatively assumed to be met using 10% of the gas production plateau (i.e.
97 TJ/day).
Diesel combustion in
generators to provide
power for construction
activities
34,237
Diesel combustion in light
vehicles and heavy
vehicles
4,820 31,835 +560%
The peak construction workforce is anticipated to be more than doubled compared to the workforce
estimated at the time of the EIS. In addition, twice as many wells are expected to be commissioned in
2019 for the SREIS.
As a result, emissions from vehicles increased significantly.
Land Clearing Land clearing 26,418 31,416 +19%
For the SREIS, twice as many wells are expected to be commissioned in 2019. This is offset somewhat by
a reduction in the land clearing footprint due to the reduction in the overall number of wells and the
introduction of multi-well pads which include an average of nine wells (single well option only was
assessed for the EIS).
Fugitive
Emissions
Ramp-up flaring 0 82,839 No ramp-up flaring was expected in 2019 for the EIS.
Maintenance flaring 260,836 251,199 -4%
For the SREIS, there is an anticipated increase of 20% in the average quantity of maintenance losses
from the CGPFs. However, eight facilities (CGPFs or integrated processing facilities) were to be
commissioned in 2019 in the EIS whereas seven CGPFs are to be commissioned in the SREIS.
Note that pilot flaring was included in the EIS emission estimates and is now excluded from the SREIS
emission estimates.
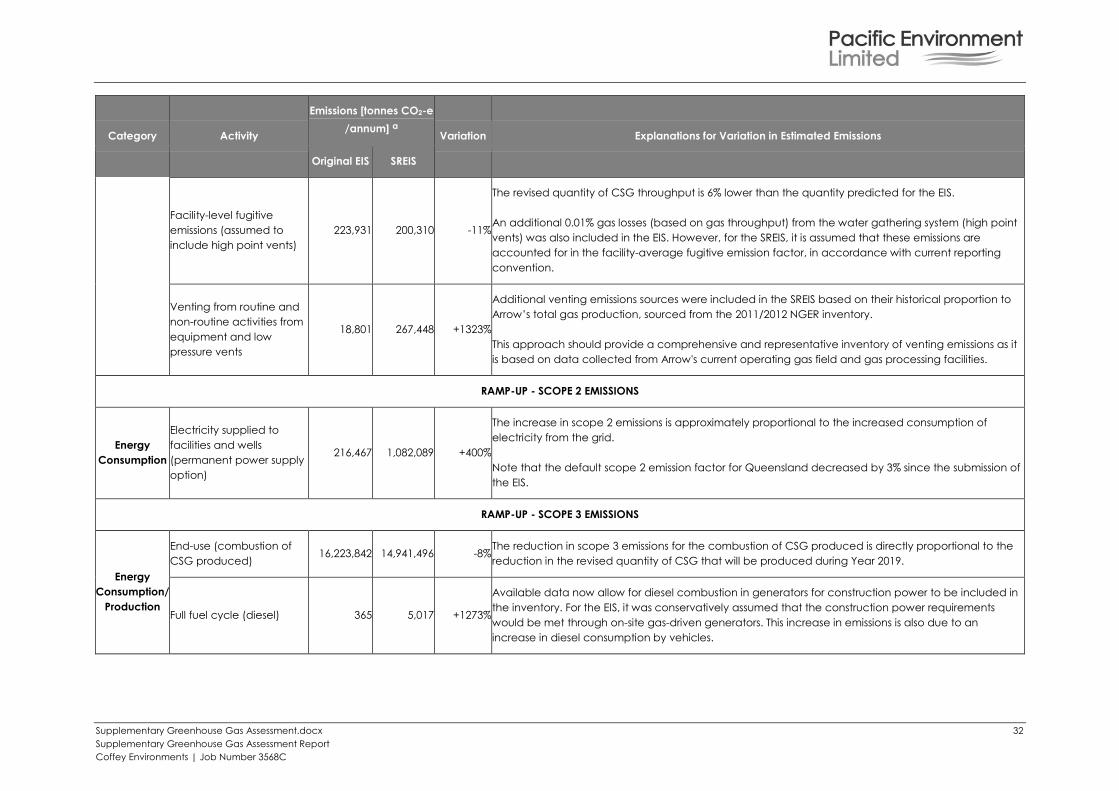
Supplementary Greenhouse Gas Assessment.docx 32
Supplementary Greenhouse Gas Assessment Report
Coffey Environments | Job Number 3568C
Category Activity
Emissions [tonnes CO2-e
/annum] a Variation Explanations for Variation in Estimated Emissions
Original EIS SREIS
Facility-level fugitive
emissions (assumed to
include high point vents)
223,931 200,310 -11%
The revised quantity of CSG throughput is 6% lower than the quantity predicted for the EIS.
An additional 0.01% gas losses (based on gas throughput) from the water gathering system (high point
vents) was also included in the EIS. However, for the SREIS, it is assumed that these emissions are
accounted for in the facility-average fugitive emission factor, in accordance with current reporting
convention.
Venting from routine and
non-routine activities from
equipment and low
pressure vents
18,801 267,448 +1323%
Additional venting emissions sources were included in the SREIS based on their historical proportion to
Arrow’s total gas production, sourced from the 2011/2012 NGER inventory.
This approach should provide a comprehensive and representative inventory of venting emissions as it
is based on data collected from Arrow's current operating gas field and gas processing facilities.
RAMP-UP - SCOPE 2 EMISSIONS
Energy
Consumption
Electricity supplied to
facilities and wells
(permanent power supply
option)
216,467 1,082,089 +400%
The increase in scope 2 emissions is approximately proportional to the increased consumption of
electricity from the grid.
Note that the default scope 2 emission factor for Queensland decreased by 3% since the submission of
the EIS.
RAMP-UP - SCOPE 3 EMISSIONS
Energy
Consumption/
Production
End-use (combustion of
CSG produced) 16,223,842 14,941,496 -8%
The reduction in scope 3 emissions for the combustion of CSG produced is directly proportional to the
reduction in the revised quantity of CSG that will be produced during Year 2019.
Full fuel cycle (diesel) 365 5,017 +1273%
Available data now allow for diesel combustion in generators for construction power to be included in
the inventory. For the EIS, it was conservatively assumed that the construction power requirements
would be met through on-site gas-driven generators. This increase in emissions is also due to an
increase in diesel consumption by vehicles.
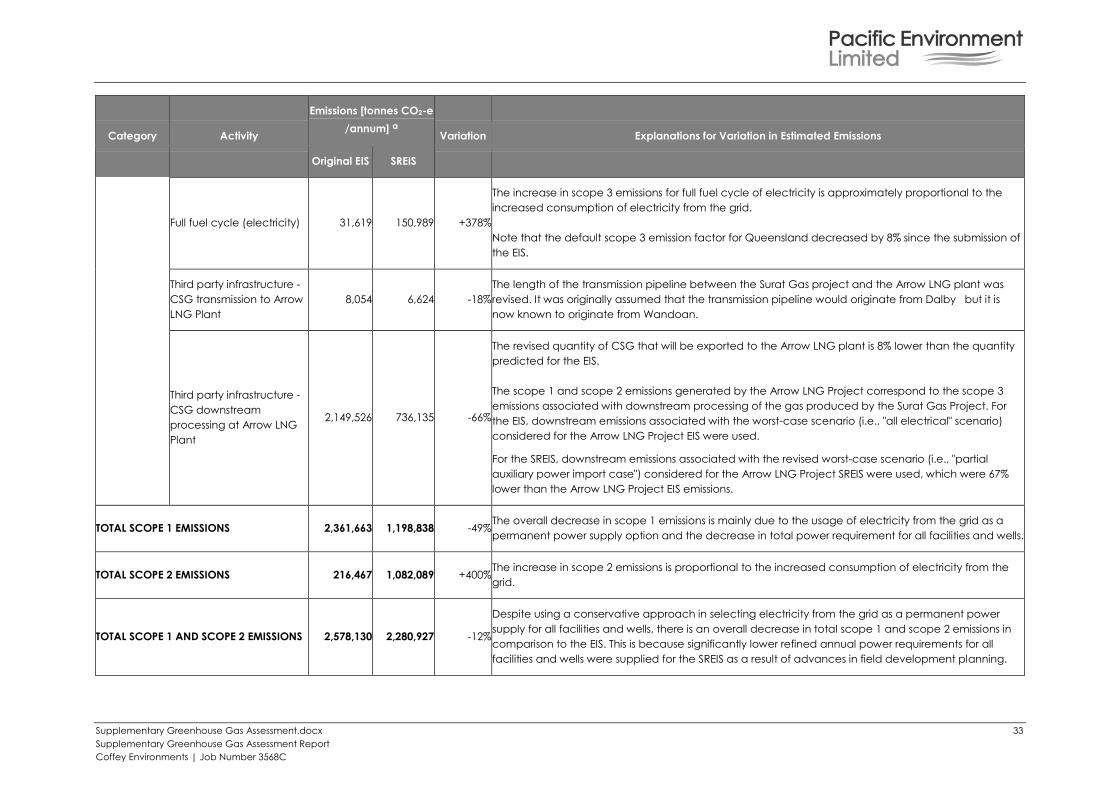
Supplementary Greenhouse Gas Assessment.docx 33
Supplementary Greenhouse Gas Assessment Report
Coffey Environments | Job Number 3568C
Category Activity
Emissions [tonnes CO2-e
/annum] a Variation Explanations for Variation in Estimated Emissions
Original EIS SREIS
Full fuel cycle (electricity) 31,619 150,989 +378%
The increase in scope 3 emissions for full fuel cycle of electricity is approximately proportional to the
increased consumption of electricity from the grid.
Note that the default scope 3 emission factor for Queensland decreased by 8% since the submission of
the EIS.
Third party infrastructure -
CSG transmission to Arrow
LNG Plant
8,054 6,624 -18%
The length of the transmission pipeline between the Surat Gas project and the Arrow LNG plant was
revised. It was originally assumed that the transmission pipeline would originate from Dalby but it is
now known to originate from Wandoan.
Third party infrastructure -
CSG downstream
processing at Arrow LNG
Plant
2,149,526 736,135 -66%
The revised quantity of CSG that will be exported to the Arrow LNG plant is 8% lower than the quantity
predicted for the EIS.
The scope 1 and scope 2 emissions generated by the Arrow LNG Project correspond to the scope 3
emissions associated with downstream processing of the gas produced by the Surat Gas Project. For
the EIS, downstream emissions associated with the worst-case scenario (i.e., "all electrical" scenario)
considered for the Arrow LNG Project EIS were used.
For the SREIS, downstream emissions associated with the revised worst-case scenario (i.e., "partial
auxiliary power import case") considered for the Arrow LNG Project SREIS were used, which were 67%
lower than the Arrow LNG Project EIS emissions.
TOTAL SCOPE 1 EMISSIONS 2,361,663 1,198,838 -49% The overall decrease in scope 1 emissions is mainly due to the usage of electricity from the grid as a
permanent power supply option and the decrease in total power requirement for all facilities and wells.
TOTAL SCOPE 2 EMISSIONS 216,467 1,082,089 +400% The increase in scope 2 emissions is proportional to the increased consumption of electricity from the
grid.
TOTAL SCOPE 1 AND SCOPE 2 EMISSIONS 2,578,130 2,280,927 -12%
Despite using a conservative approach in selecting electricity from the grid as a permanent power
supply for all facilities and wells, there is an overall decrease in total scope 1 and scope 2 emissions in
comparison to the EIS. This is because significantly lower refined annual power requirements for all
facilities and wells were supplied for the SREIS as a result of advances in field development planning.
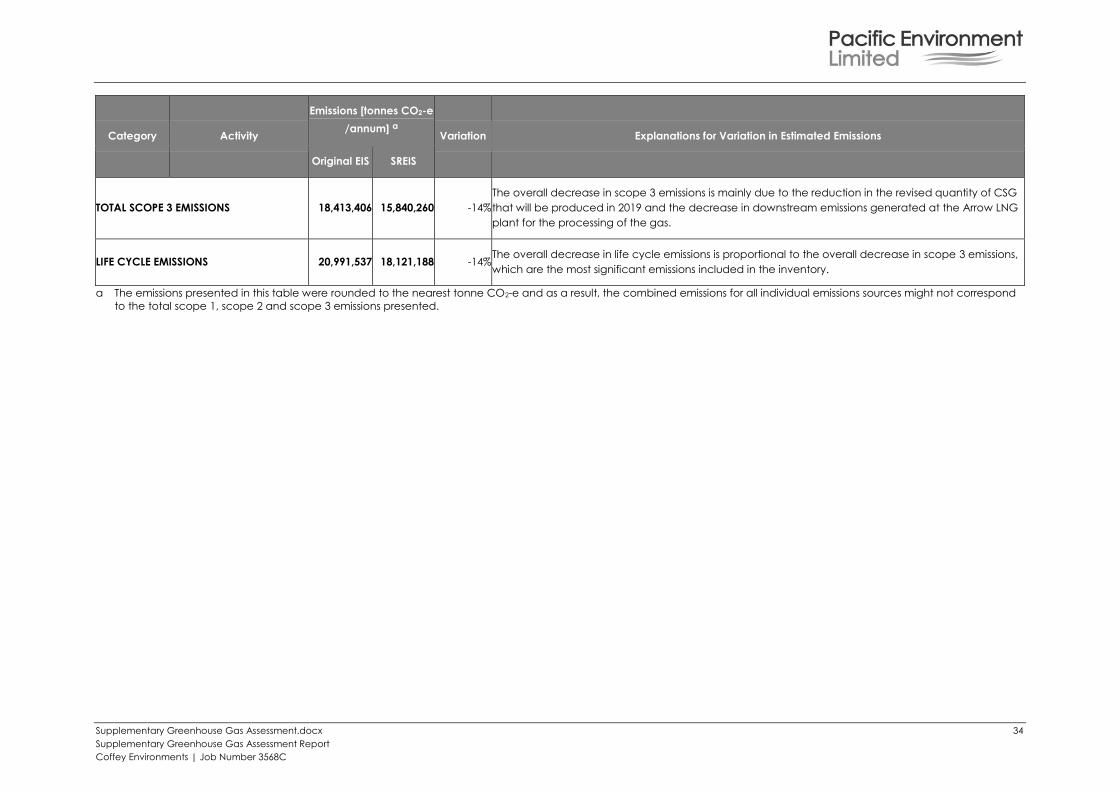
Supplementary Greenhouse Gas Assessment.docx 34
Supplementary Greenhouse Gas Assessment Report
Coffey Environments | Job Number 3568C
Category Activity
Emissions [tonnes CO2-e
/annum] a Variation Explanations for Variation in Estimated Emissions
Original EIS SREIS
TOTAL SCOPE 3 EMISSIONS 18,413,406 15,840,260 -14%
The overall decrease in scope 3 emissions is mainly due to the reduction in the revised quantity of CSG
that will be produced in 2019 and the decrease in downstream emissions generated at the Arrow LNG
plant for the processing of the gas.
LIFE CYCLE EMISSIONS 20,991,537 18,121,188 -14% The overall decrease in life cycle emissions is proportional to the overall decrease in scope 3 emissions,
which are the most significant emissions included in the inventory.
a The emissions presented in this table were rounded to the nearest tonne CO2-e and as a result, the combined emissions for all individual emissions sources might not correspond
to the total scope 1, scope 2 and scope 3 emissions presented.
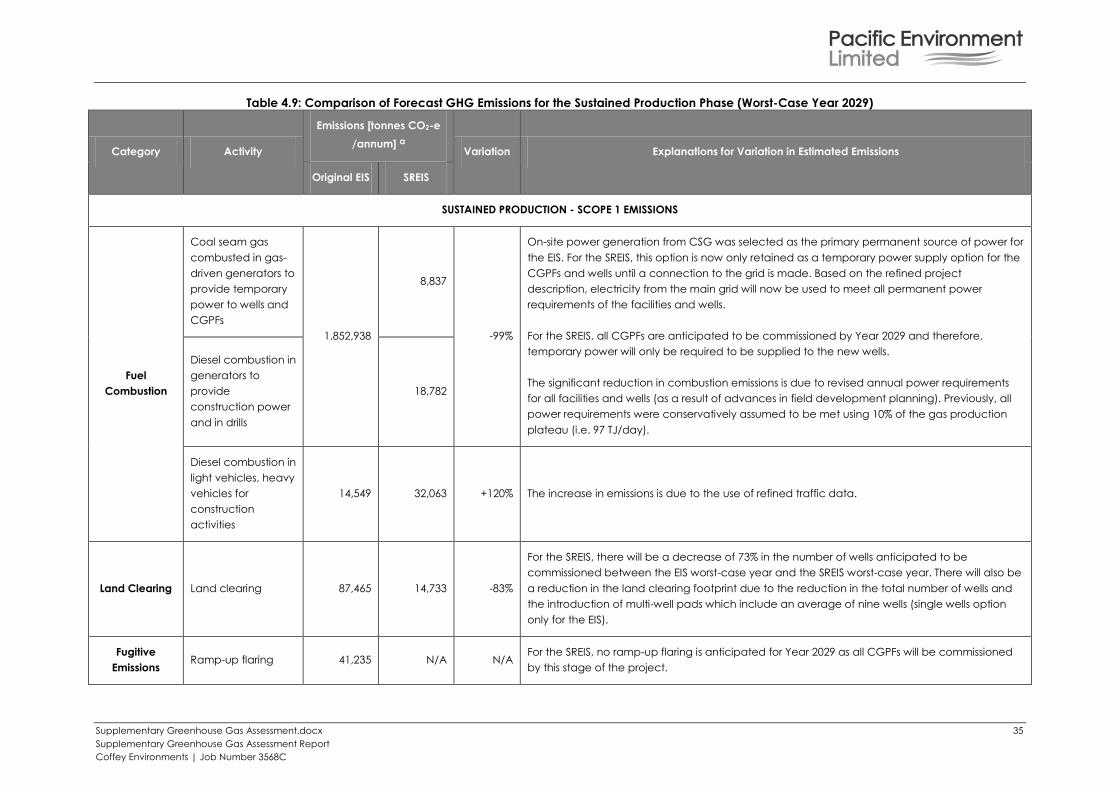
Supplementary Greenhouse Gas Assessment.docx 35
Supplementary Greenhouse Gas Assessment Report
Coffey Environments | Job Number 3568C
Table 4.9: Comparison of Forecast GHG Emissions for the Sustained Production Phase (Worst-Case Year 2029)
Category Activity
Emissions [tonnes CO2-e
/annum] a Variation Explanations for Variation in Estimated Emissions
Original EIS SREIS
SUSTAINED PRODUCTION - SCOPE 1 EMISSIONS
Fuel
Combustion
Coal seam gas
combusted in gas-
driven generators to
provide temporary
power to wells and
CGPFs
1,852,938
8,837
-99%
On-site power generation from CSG was selected as the primary permanent source of power for
the EIS. For the SREIS, this option is now only retained as a temporary power supply option for the
CGPFs and wells until a connection to the grid is made. Based on the refined project
description, electricity from the main grid will now be used to meet all permanent power
requirements of the facilities and wells.
For the SREIS, all CGPFs are anticipated to be commissioned by Year 2029 and therefore,
temporary power will only be required to be supplied to the new wells.
The significant reduction in combustion emissions is due to revised annual power requirements
for all facilities and wells (as a result of advances in field development planning). Previously, all
power requirements were conservatively assumed to be met using 10% of the gas production
plateau (i.e. 97 TJ/day).
Diesel combustion in
generators to
provide
construction power
and in drills
18,782
Diesel combustion in
light vehicles, heavy
vehicles for
construction
activities
14,549 32,063 +120% The increase in emissions is due to the use of refined traffic data.
Land Clearing Land clearing 87,465 14,733 -83%
For the SREIS, there will be a decrease of 73% in the number of wells anticipated to be
commissioned between the EIS worst-case year and the SREIS worst-case year. There will also be
a reduction in the land clearing footprint due to the reduction in the total number of wells and
the introduction of multi-well pads which include an average of nine wells (single wells option
only for the EIS).
Fugitive
Emissions Ramp-up flaring 41,235 N/A N/A
For the SREIS, no ramp-up flaring is anticipated for Year 2029 as all CGPFs will be commissioned
by this stage of the project.
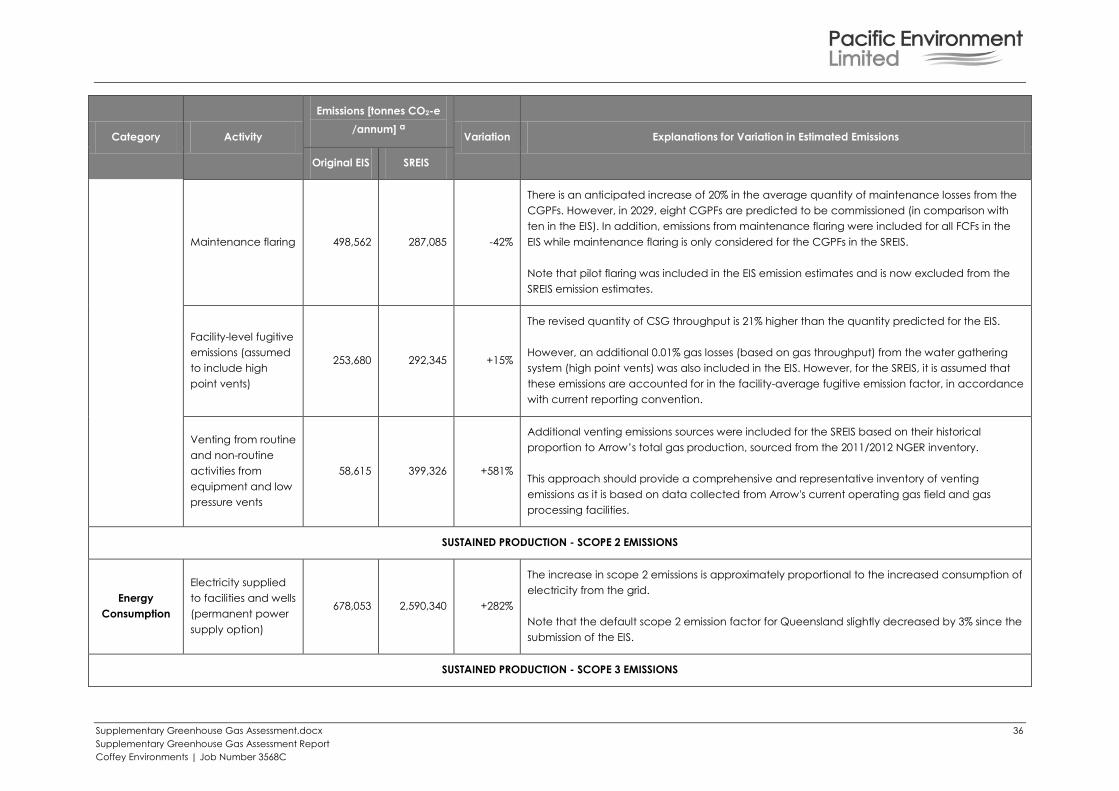
Supplementary Greenhouse Gas Assessment.docx 36
Supplementary Greenhouse Gas Assessment Report
Coffey Environments | Job Number 3568C
Category Activity
Emissions [tonnes CO2-e
/annum] a Variation Explanations for Variation in Estimated Emissions
Original EIS SREIS
Maintenance flaring 498,562 287,085 -42%
There is an anticipated increase of 20% in the average quantity of maintenance losses from the
CGPFs. However, in 2029, eight CGPFs are predicted to be commissioned (in comparison with
ten in the EIS). In addition, emissions from maintenance flaring were included for all FCFs in the
EIS while maintenance flaring is only considered for the CGPFs in the SREIS.
Note that pilot flaring was included in the EIS emission estimates and is now excluded from the
SREIS emission estimates.
Facility-level fugitive
emissions (assumed
to include high
point vents)
253,680 292,345 +15%
The revised quantity of CSG throughput is 21% higher than the quantity predicted for the EIS.
However, an additional 0.01% gas losses (based on gas throughput) from the water gathering
system (high point vents) was also included in the EIS. However, for the SREIS, it is assumed that
these emissions are accounted for in the facility-average fugitive emission factor, in accordance
with current reporting convention.
Venting from routine
and non-routine
activities from
equipment and low
pressure vents
58,615 399,326 +581%
Additional venting emissions sources were included for the SREIS based on their historical
proportion to Arrow’s total gas production, sourced from the 2011/2012 NGER inventory.
This approach should provide a comprehensive and representative inventory of venting
emissions as it is based on data collected from Arrow's current operating gas field and gas
processing facilities.
SUSTAINED PRODUCTION - SCOPE 2 EMISSIONS
Energy
Consumption
Electricity supplied
to facilities and wells
(permanent power
supply option)
678,053 2,590,340 +282%
The increase in scope 2 emissions is approximately proportional to the increased consumption of
electricity from the grid.
Note that the default scope 2 emission factor for Queensland slightly decreased by 3% since the
submission of the EIS.
SUSTAINED PRODUCTION - SCOPE 3 EMISSIONS
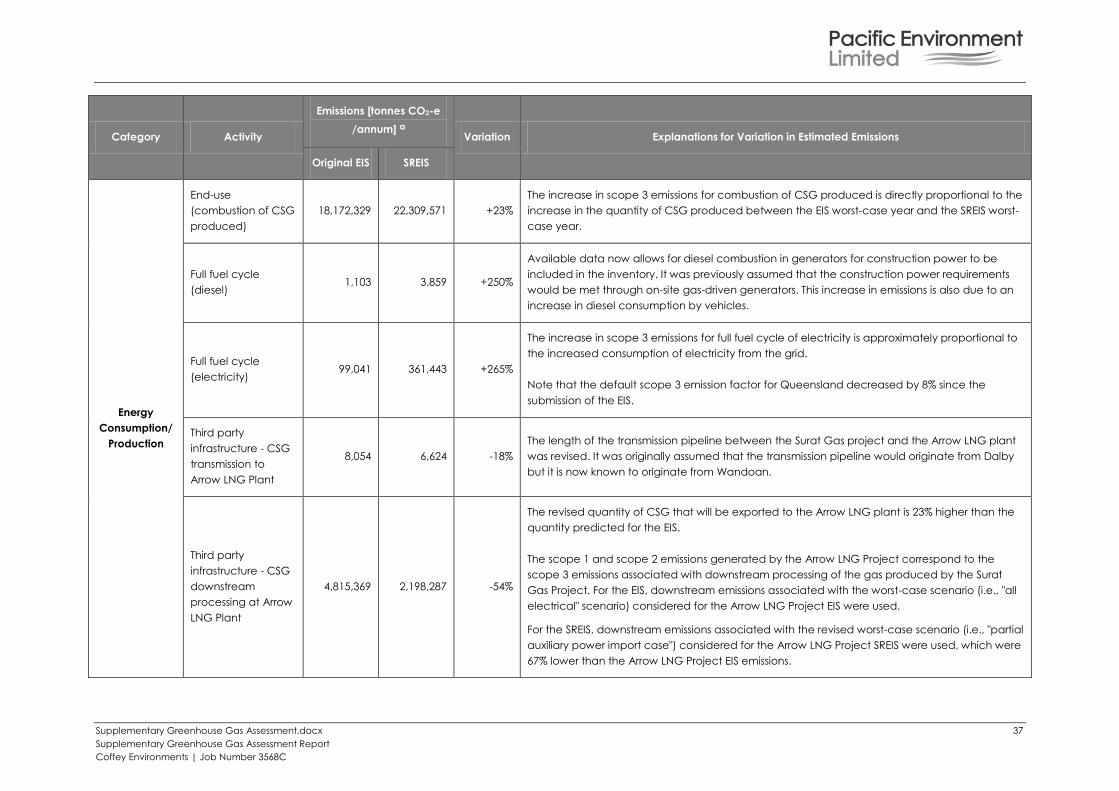
Supplementary Greenhouse Gas Assessment.docx 37
Supplementary Greenhouse Gas Assessment Report
Coffey Environments | Job Number 3568C
Category Activity
Emissions [tonnes CO2-e
/annum] a Variation Explanations for Variation in Estimated Emissions
Original EIS SREIS
Energy
Consumption/
Production
End-use
(combustion of CSG
produced)
18,172,329 22,309,571 +23%
The increase in scope 3 emissions for combustion of CSG produced is directly proportional to the
increase in the quantity of CSG produced between the EIS worst-case year and the SREIS worst-
case year.
Full fuel cycle
(diesel) 1,103 3,859 +250%
Available data now allows for diesel combustion in generators for construction power to be
included in the inventory. It was previously assumed that the construction power requirements
would be met through on-site gas-driven generators. This increase in emissions is also due to an
increase in diesel consumption by vehicles.
Full fuel cycle
(electricity) 99,041 361,443 +265%
The increase in scope 3 emissions for full fuel cycle of electricity is approximately proportional to
the increased consumption of electricity from the grid.
Note that the default scope 3 emission factor for Queensland decreased by 8% since the
submission of the EIS.
Third party
infrastructure - CSG
transmission to
Arrow LNG Plant
8,054 6,624 -18%
The length of the transmission pipeline between the Surat Gas project and the Arrow LNG plant
was revised. It was originally assumed that the transmission pipeline would originate from Dalby
but it is now known to originate from Wandoan.
Third party
infrastructure - CSG
downstream
processing at Arrow
LNG Plant
4,815,369 2,198,287 -54%
The revised quantity of CSG that will be exported to the Arrow LNG plant is 23% higher than the
quantity predicted for the EIS.
The scope 1 and scope 2 emissions generated by the Arrow LNG Project correspond to the
scope 3 emissions associated with downstream processing of the gas produced by the Surat
Gas Project. For the EIS, downstream emissions associated with the worst-case scenario (i.e., "all
electrical" scenario) considered for the Arrow LNG Project EIS were used.
For the SREIS, downstream emissions associated with the revised worst-case scenario (i.e., "partial
auxiliary power import case") considered for the Arrow LNG Project SREIS were used, which were
67% lower than the Arrow LNG Project EIS emissions.
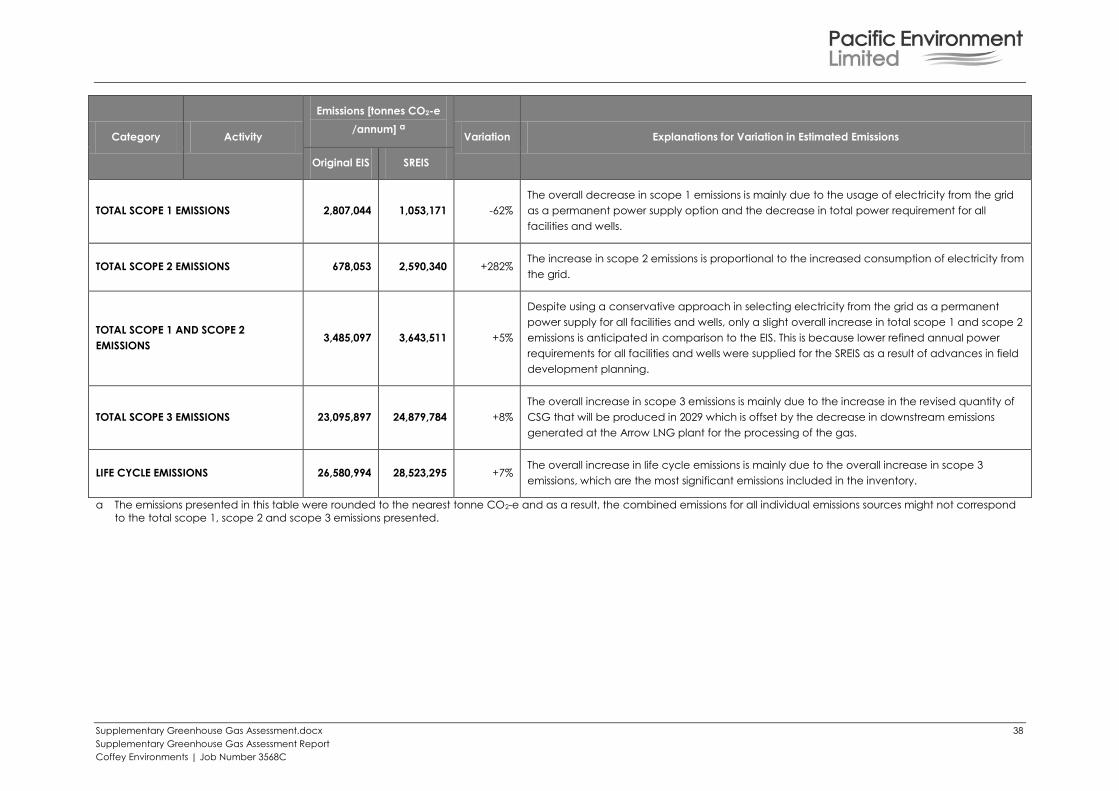
Supplementary Greenhouse Gas Assessment.docx 38
Supplementary Greenhouse Gas Assessment Report
Coffey Environments | Job Number 3568C
Category Activity
Emissions [tonnes CO2-e
/annum] a Variation Explanations for Variation in Estimated Emissions
Original EIS SREIS
TOTAL SCOPE 1 EMISSIONS 2,807,044 1,053,171 -62%
The overall decrease in scope 1 emissions is mainly due to the usage of electricity from the grid
as a permanent power supply option and the decrease in total power requirement for all
facilities and wells.
TOTAL SCOPE 2 EMISSIONS 678,053 2,590,340 +282% The increase in scope 2 emissions is proportional to the increased consumption of electricity from
the grid.
TOTAL SCOPE 1 AND SCOPE 2
EMISSIONS 3,485,097 3,643,511 +5%
Despite using a conservative approach in selecting electricity from the grid as a permanent
power supply for all facilities and wells, only a slight overall increase in total scope 1 and scope 2
emissions is anticipated in comparison to the EIS. This is because lower refined annual power
requirements for all facilities and wells were supplied for the SREIS as a result of advances in field
development planning.
TOTAL SCOPE 3 EMISSIONS 23,095,897 24,879,784 +8%
The overall increase in scope 3 emissions is mainly due to the increase in the revised quantity of
CSG that will be produced in 2029 which is offset by the decrease in downstream emissions
generated at the Arrow LNG plant for the processing of the gas.
LIFE CYCLE EMISSIONS 26,580,994 28,523,295 +7% The overall increase in life cycle emissions is mainly due to the overall increase in scope 3
emissions, which are the most significant emissions included in the inventory.
a The emissions presented in this table were rounded to the nearest tonne CO2-e and as a result, the combined emissions for all individual emissions sources might not correspond
to the total scope 1, scope 2 and scope 3 emissions presented.
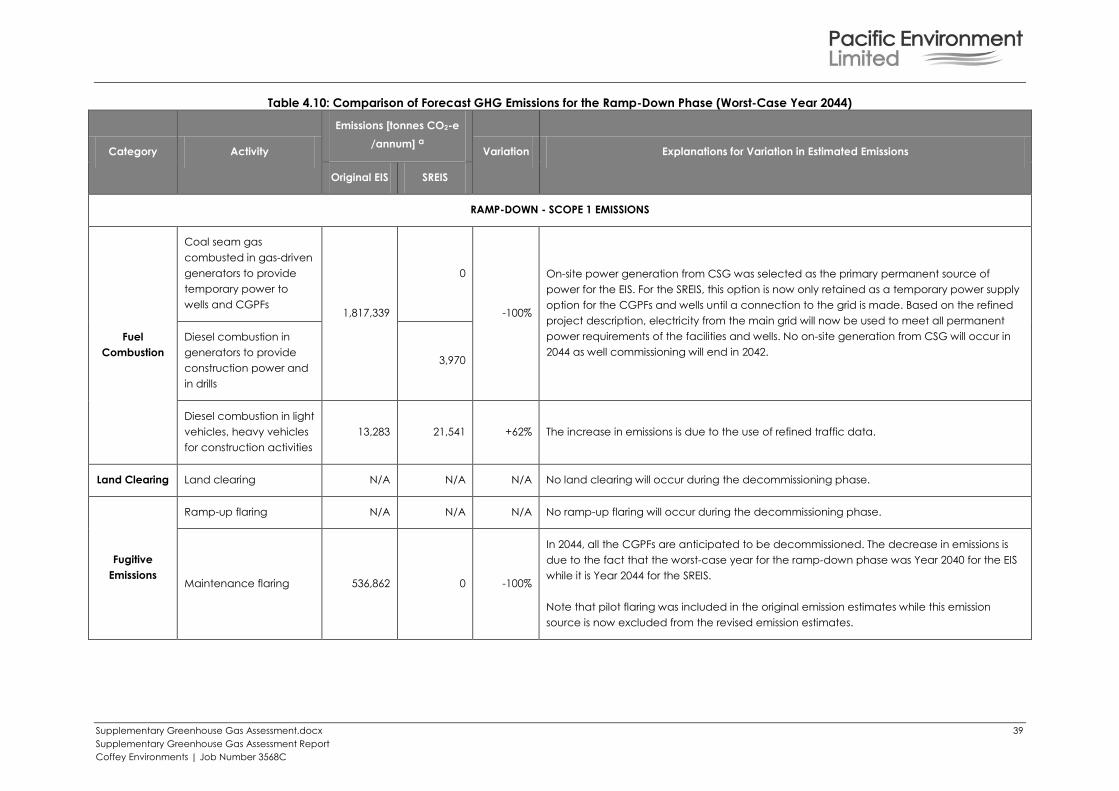
Supplementary Greenhouse Gas Assessment.docx 39
Supplementary Greenhouse Gas Assessment Report
Coffey Environments | Job Number 3568C
Table 4.10: Comparison of Forecast GHG Emissions for the Ramp-Down Phase (Worst-Case Year 2044)
Category Activity
Emissions [tonnes CO2-e
/annum] a Variation Explanations for Variation in Estimated Emissions
Original EIS SREIS
RAMP-DOWN - SCOPE 1 EMISSIONS
Fuel
Combustion
Coal seam gas
combusted in gas-driven
generators to provide
temporary power to
wells and CGPFs 1,817,339
0
-100%
On-site power generation from CSG was selected as the primary permanent source of
power for the EIS. For the SREIS, this option is now only retained as a temporary power supply
option for the CGPFs and wells until a connection to the grid is made. Based on the refined
project description, electricity from the main grid will now be used to meet all permanent
power requirements of the facilities and wells. No on-site generation from CSG will occur in
2044 as well commissioning will end in 2042.
Diesel combustion in
generators to provide
construction power and
in drills
3,970
Diesel combustion in light
vehicles, heavy vehicles
for construction activities
13,283 21,541 +62% The increase in emissions is due to the use of refined traffic data.
Land Clearing Land clearing N/A N/A N/A No land clearing will occur during the decommissioning phase.
Fugitive
Emissions
Ramp-up flaring N/A N/A N/A No ramp-up flaring will occur during the decommissioning phase.
Maintenance flaring 536,862 0 -100%
In 2044, all the CGPFs are anticipated to be decommissioned. The decrease in emissions is
due to the fact that the worst-case year for the ramp-down phase was Year 2040 for the EIS
while it is Year 2044 for the SREIS.
Note that pilot flaring was included in the original emission estimates while this emission
source is now excluded from the revised emission estimates.
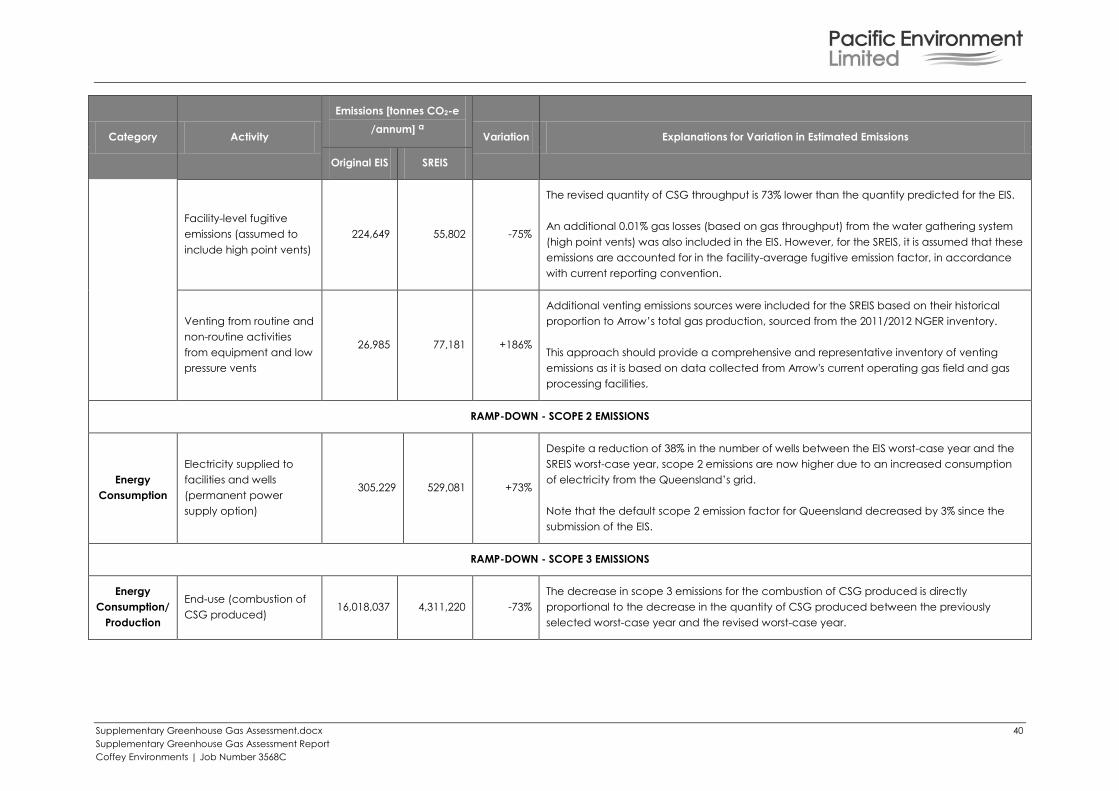
Supplementary Greenhouse Gas Assessment.docx 40
Supplementary Greenhouse Gas Assessment Report
Coffey Environments | Job Number 3568C
Category Activity
Emissions [tonnes CO2-e
/annum] a Variation Explanations for Variation in Estimated Emissions
Original EIS SREIS
Facility-level fugitive
emissions (assumed to
include high point vents)
224,649 55,802 -75%
The revised quantity of CSG throughput is 73% lower than the quantity predicted for the EIS.
An additional 0.01% gas losses (based on gas throughput) from the water gathering system
(high point vents) was also included in the EIS. However, for the SREIS, it is assumed that these
emissions are accounted for in the facility-average fugitive emission factor, in accordance
with current reporting convention.
Venting from routine and
non-routine activities
from equipment and low
pressure vents
26,985 77,181 +186%
Additional venting emissions sources were included for the SREIS based on their historical
proportion to Arrow’s total gas production, sourced from the 2011/2012 NGER inventory.
This approach should provide a comprehensive and representative inventory of venting
emissions as it is based on data collected from Arrow's current operating gas field and gas
processing facilities.
RAMP-DOWN - SCOPE 2 EMISSIONS
Energy
Consumption
Electricity supplied to
facilities and wells
(permanent power
supply option)
305,229 529,081 +73%
Despite a reduction of 38% in the number of wells between the EIS worst-case year and the
SREIS worst-case year, scope 2 emissions are now higher due to an increased consumption
of electricity from the Queensland’s grid.
Note that the default scope 2 emission factor for Queensland decreased by 3% since the
submission of the EIS.
RAMP-DOWN - SCOPE 3 EMISSIONS
Energy
Consumption/
Production
End-use (combustion of
CSG produced) 16,018,037 4,311,220 -73%
The decrease in scope 3 emissions for the combustion of CSG produced is directly
proportional to the decrease in the quantity of CSG produced between the previously
selected worst-case year and the revised worst-case year.
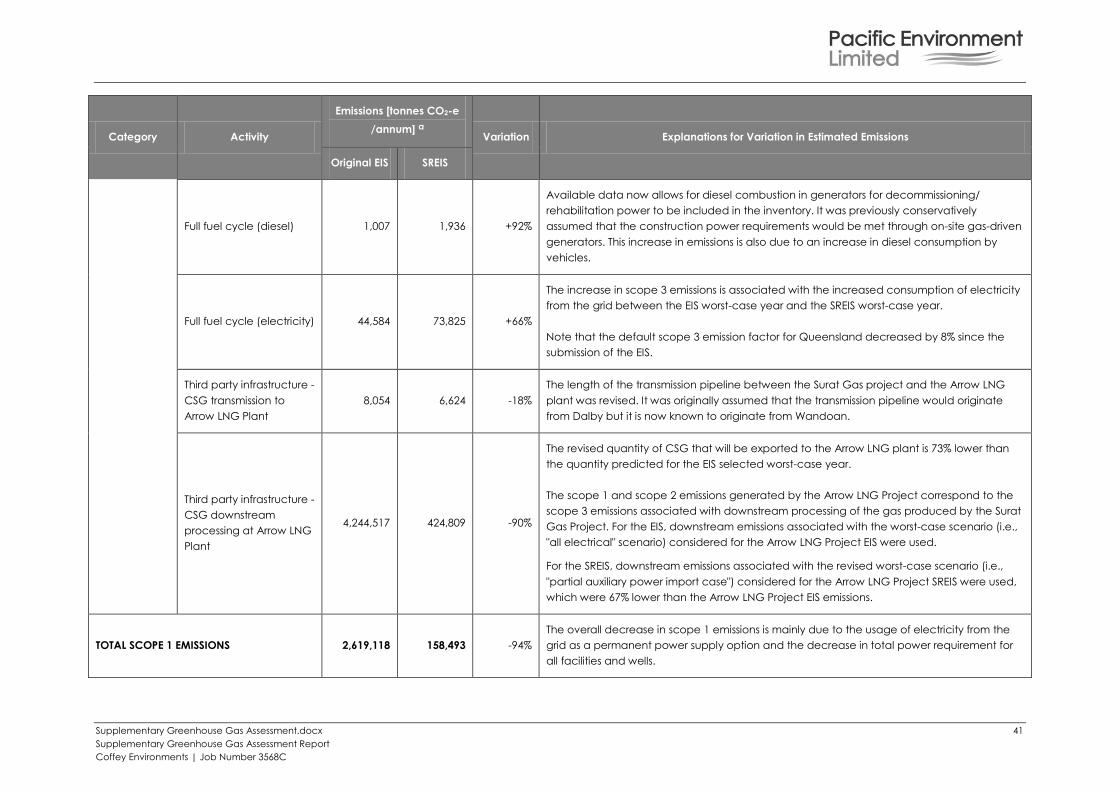
Supplementary Greenhouse Gas Assessment.docx 41
Supplementary Greenhouse Gas Assessment Report
Coffey Environments | Job Number 3568C
Category Activity
Emissions [tonnes CO2-e
/annum] a Variation Explanations for Variation in Estimated Emissions
Original EIS SREIS
Full fuel cycle (diesel) 1,007 1,936 +92%
Available data now allows for diesel combustion in generators for decommissioning/
rehabilitation power to be included in the inventory. It was previously conservatively
assumed that the construction power requirements would be met through on-site gas-driven
generators. This increase in emissions is also due to an increase in diesel consumption by
vehicles.
Full fuel cycle (electricity) 44,584 73,825 +66%
The increase in scope 3 emissions is associated with the increased consumption of electricity
from the grid between the EIS worst-case year and the SREIS worst-case year.
Note that the default scope 3 emission factor for Queensland decreased by 8% since the
submission of the EIS.
Third party infrastructure -
CSG transmission to
Arrow LNG Plant
8,054 6,624 -18%
The length of the transmission pipeline between the Surat Gas project and the Arrow LNG
plant was revised. It was originally assumed that the transmission pipeline would originate
from Dalby but it is now known to originate from Wandoan.
Third party infrastructure -
CSG downstream
processing at Arrow LNG
Plant
4,244,517 424,809 -90%
The revised quantity of CSG that will be exported to the Arrow LNG plant is 73% lower than
the quantity predicted for the EIS selected worst-case year.
The scope 1 and scope 2 emissions generated by the Arrow LNG Project correspond to the
scope 3 emissions associated with downstream processing of the gas produced by the Surat
Gas Project. For the EIS, downstream emissions associated with the worst-case scenario (i.e.,
"all electrical" scenario) considered for the Arrow LNG Project EIS were used.
For the SREIS, downstream emissions associated with the revised worst-case scenario (i.e.,
"partial auxiliary power import case") considered for the Arrow LNG Project SREIS were used,
which were 67% lower than the Arrow LNG Project EIS emissions.
TOTAL SCOPE 1 EMISSIONS 2,619,118 158,493 -94%
The overall decrease in scope 1 emissions is mainly due to the usage of electricity from the
grid as a permanent power supply option and the decrease in total power requirement for
all facilities and wells.
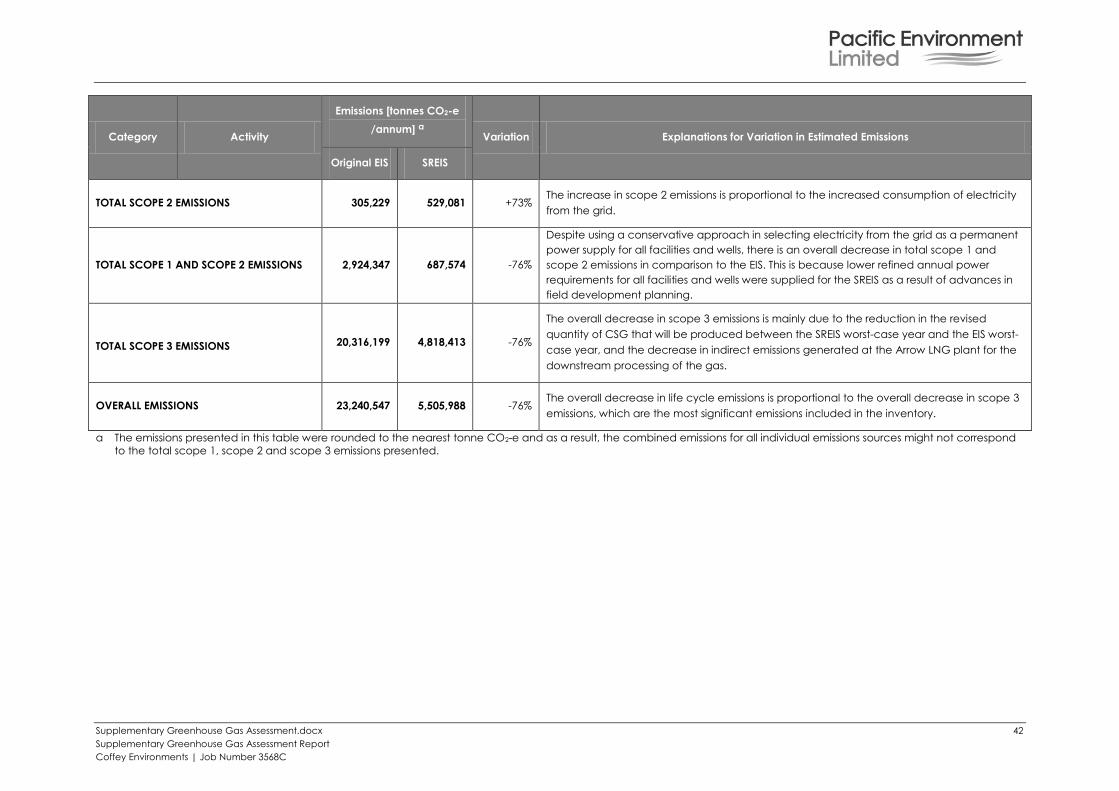
Supplementary Greenhouse Gas Assessment.docx 42
Supplementary Greenhouse Gas Assessment Report
Coffey Environments | Job Number 3568C
Category Activity
Emissions [tonnes CO2-e
/annum] a Variation Explanations for Variation in Estimated Emissions
Original EIS SREIS
TOTAL SCOPE 2 EMISSIONS 305,229 529,081 +73% The increase in scope 2 emissions is proportional to the increased consumption of electricity
from the grid.
TOTAL SCOPE 1 AND SCOPE 2 EMISSIONS 2,924,347 687,574 -76%
Despite using a conservative approach in selecting electricity from the grid as a permanent
power supply for all facilities and wells, there is an overall decrease in total scope 1 and
scope 2 emissions in comparison to the EIS. This is because lower refined annual power
requirements for all facilities and wells were supplied for the SREIS as a result of advances in
field development planning.
TOTAL SCOPE 3 EMISSIONS 20,316,199 4,818,413 -76%
The overall decrease in scope 3 emissions is mainly due to the reduction in the revised
quantity of CSG that will be produced between the SREIS worst-case year and the EIS worst-
case year, and the decrease in indirect emissions generated at the Arrow LNG plant for the
downstream processing of the gas.
OVERALL EMISSIONS 23,240,547 5,505,988 -76% The overall decrease in life cycle emissions is proportional to the overall decrease in scope 3
emissions, which are the most significant emissions included in the inventory.
a The emissions presented in this table were rounded to the nearest tonne CO2-e and as a result, the combined emissions for all individual emissions sources might not correspond
to the total scope 1, scope 2 and scope 3 emissions presented.
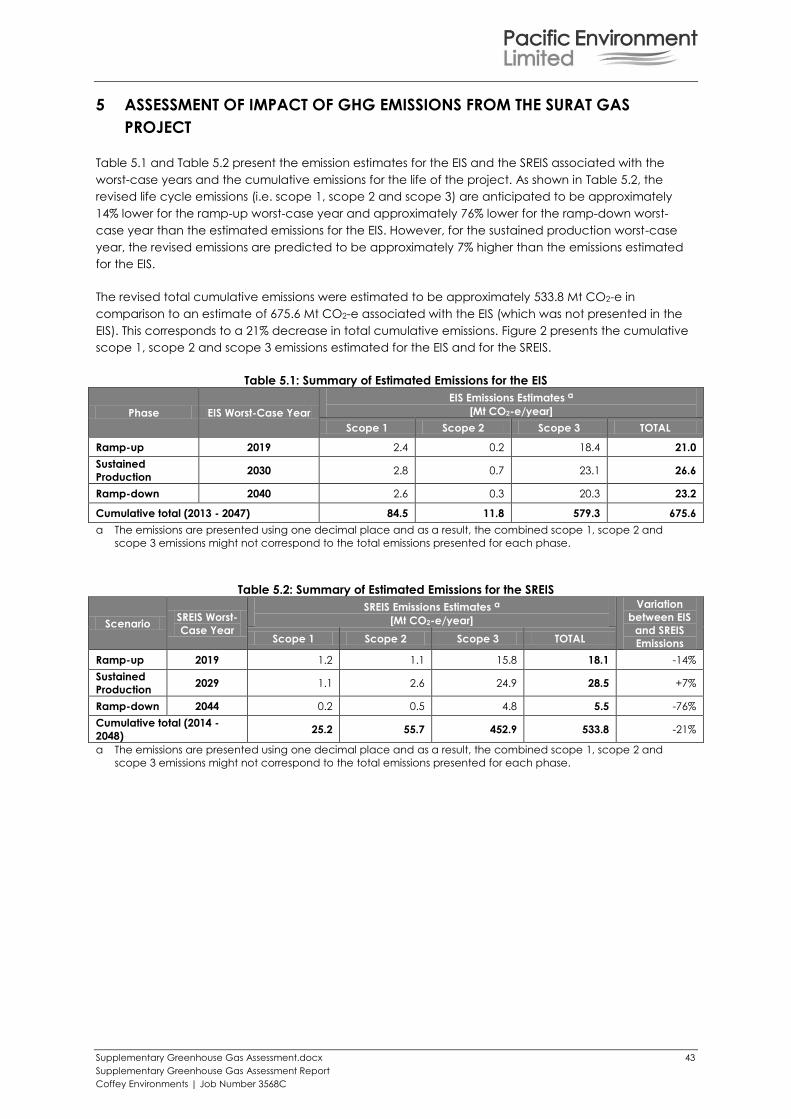
Supplementary Greenhouse Gas Assessment.docx 43
Supplementary Greenhouse Gas Assessment Report
Coffey Environments | Job Number 3568C
5 ASSESSMENT OF IMPACT OF GHG EMISSIONS FROM THE SURAT GAS
PROJECT
Table 5.1 and Table 5.2 present the emission estimates for the EIS and the SREIS associated with the
worst-case years and the cumulative emissions for the life of the project. As shown in Table 5.2, the
revised life cycle emissions (i.e. scope 1, scope 2 and scope 3) are anticipated to be approximately
14% lower for the ramp-up worst-case year and approximately 76% lower for the ramp-down worst-
case year than the estimated emissions for the EIS. However, for the sustained production worst-case
year, the revised emissions are predicted to be approximately 7% higher than the emissions estimated
for the EIS.
The revised total cumulative emissions were estimated to be approximately 533.8 Mt CO2-e in
comparison to an estimate of 675.6 Mt CO2-e associated with the EIS (which was not presented in the
EIS). This corresponds to a 21% decrease in total cumulative emissions. Figure 2 presents the cumulative
scope 1, scope 2 and scope 3 emissions estimated for the EIS and for the SREIS.
Table 5.1: Summary of Estimated Emissions for the EIS
Phase EIS Worst-Case Year
EIS Emissions Estimates a
[Mt CO2-e/year]
Scope 1 Scope 2 Scope 3 TOTAL
Ramp-up 2019 2.4 0.2 18.4 21.0
Sustained
Production 2030 2.8 0.7 23.1 26.6
Ramp-down 2040 2.6 0.3 20.3 23.2
Cumulative total (2013 - 2047) 84.5 11.8 579.3 675.6
a The emissions are presented using one decimal place and as a result, the combined scope 1, scope 2 and
scope 3 emissions might not correspond to the total emissions presented for each phase.
Table 5.2: Summary of Estimated Emissions for the SREIS
Scenario SREIS Worst-
Case Year
SREIS Emissions Estimates a
[Mt CO2-e/year]
Variation
between EIS
and SREIS
Emissions Scope 1 Scope 2 Scope 3 TOTAL
Ramp-up 2019 1.2 1.1 15.8 18.1 -14%
Sustained
Production 2029 1.1 2.6 24.9 28.5 +7%
Ramp-down 2044 0.2 0.5 4.8 5.5 -76%
Cumulative total (2014 -
2048) 25.2 55.7 452.9 533.8 -21%
a The emissions are presented using one decimal place and as a result, the combined scope 1, scope 2 and
scope 3 emissions might not correspond to the total emissions presented for each phase.
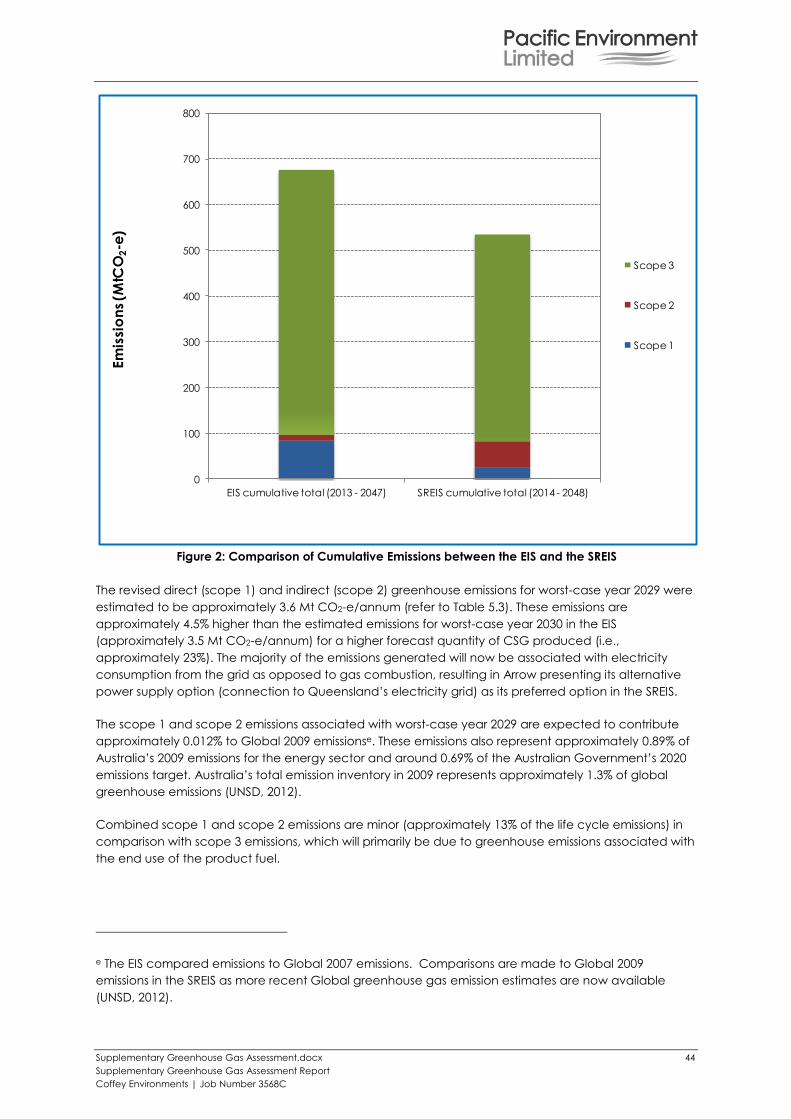
Supplementary Greenhouse Gas Assessment.docx 44
Supplementary Greenhouse Gas Assessment Report
Coffey Environments | Job Number 3568C
Figure 2: Comparison of Cumulative Emissions between the EIS and the SREIS
The revised direct (scope 1) and indirect (scope 2) greenhouse emissions for worst-case year 2029 were
estimated to be approximately 3.6 Mt CO2-e/annum (refer to Table 5.3). These emissions are
approximately 4.5% higher than the estimated emissions for worst-case year 2030 in the EIS
(approximately 3.5 Mt CO2-e/annum) for a higher forecast quantity of CSG produced (i.e.,
approximately 23%). The majority of the emissions generated will now be associated with electricity
consumption from the grid as opposed to gas combustion, resulting in Arrow presenting its alternative
power supply option (connection to Queensland’s electricity grid) as its preferred option in the SREIS.
The scope 1 and scope 2 emissions associated with worst-case year 2029 are expected to contribute
approximately 0.012% to Global 2009 emissionse. These emissions also represent approximately 0.89% of
Australia’s 2009 emissions for the energy sector and around 0.69% of the Australian Government’s 2020
emissions target. Australia’s total emission inventory in 2009 represents approximately 1.3% of global
greenhouse emissions (UNSD, 2012).
Combined scope 1 and scope 2 emissions are minor (approximately 13% of the life cycle emissions) in
comparison with scope 3 emissions, which will primarily be due to greenhouse emissions associated with
the end use of the product fuel.
e The EIS compared emissions to Global 2007 emissions. Comparisons are made to Global 2009
emissions in the SREIS as more recent Global greenhouse gas emission estimates are now available
(UNSD, 2012).
0
100
200
300
400
500
600
700
800
EIS cumulative total (2013 - 2047) SREIS cumulative total (2014 - 2048)
Em
issi
on
s (M
tCO
2-e
)
Scope 3
Scope 2
Scope 1
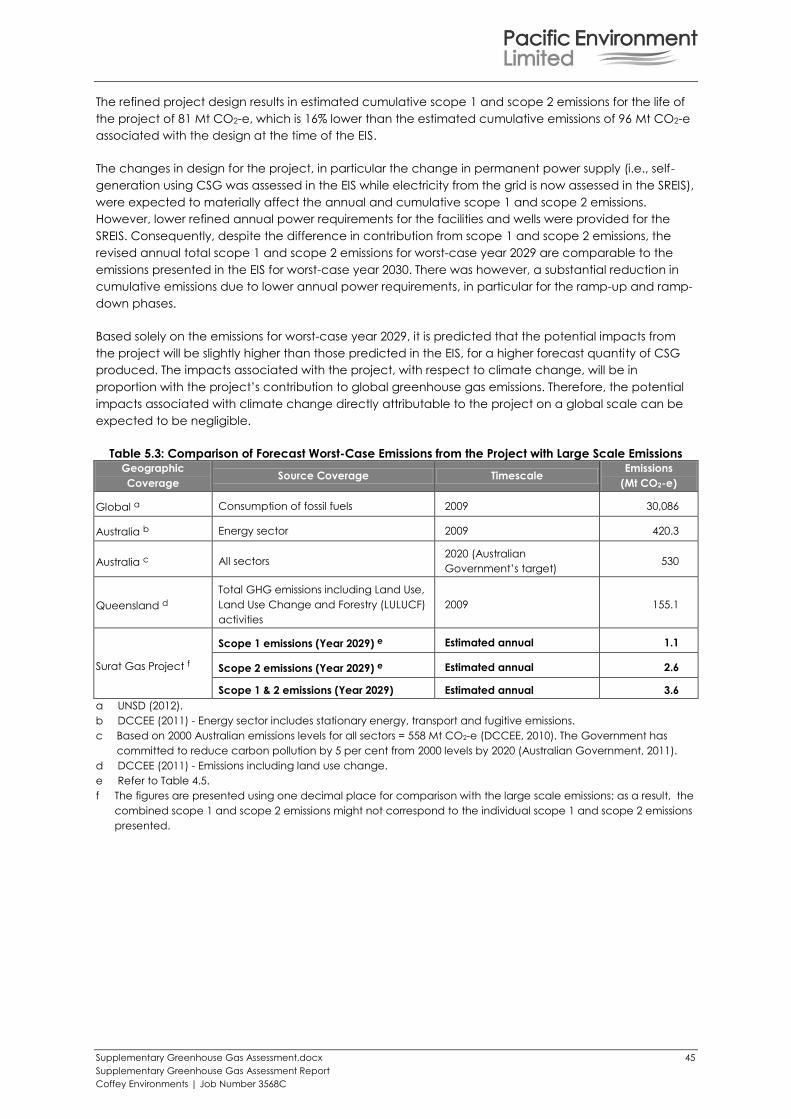
Supplementary Greenhouse Gas Assessment.docx 45
Supplementary Greenhouse Gas Assessment Report
Coffey Environments | Job Number 3568C
The refined project design results in estimated cumulative scope 1 and scope 2 emissions for the life of
the project of 81 Mt CO2-e, which is 16% lower than the estimated cumulative emissions of 96 Mt CO2-e
associated with the design at the time of the EIS.
The changes in design for the project, in particular the change in permanent power supply (i.e., self-
generation using CSG was assessed in the EIS while electricity from the grid is now assessed in the SREIS),
were expected to materially affect the annual and cumulative scope 1 and scope 2 emissions.
However, lower refined annual power requirements for the facilities and wells were provided for the
SREIS. Consequently, despite the difference in contribution from scope 1 and scope 2 emissions, the
revised annual total scope 1 and scope 2 emissions for worst-case year 2029 are comparable to the
emissions presented in the EIS for worst-case year 2030. There was however, a substantial reduction in
cumulative emissions due to lower annual power requirements, in particular for the ramp-up and ramp-
down phases.
Based solely on the emissions for worst-case year 2029, it is predicted that the potential impacts from
the project will be slightly higher than those predicted in the EIS, for a higher forecast quantity of CSG
produced. The impacts associated with the project, with respect to climate change, will be in
proportion with the project’s contribution to global greenhouse gas emissions. Therefore, the potential
impacts associated with climate change directly attributable to the project on a global scale can be
expected to be negligible.
Table 5.3: Comparison of Forecast Worst-Case Emissions from the Project with Large Scale Emissions Geographic
Coverage Source Coverage Timescale
Emissions
(Mt CO2-e)
Global a Consumption of fossil fuels 2009 30,086
Australia b Energy sector 2009 420.3
Australia c All sectors 2020 (Australian
Government’s target) 530
Queensland d
Total GHG emissions including Land Use,
Land Use Change and Forestry (LULUCF)
activities
2009 155.1
Surat Gas Project f
Scope 1 emissions (Year 2029) e Estimated annual 1.1
Scope 2 emissions (Year 2029) e Estimated annual 2.6
Scope 1 & 2 emissions (Year 2029) Estimated annual 3.6
a UNSD (2012).
b DCCEE (2011) - Energy sector includes stationary energy, transport and fugitive emissions.
c Based on 2000 Australian emissions levels for all sectors = 558 Mt CO2-e (DCCEE, 2010). The Government has
committed to reduce carbon pollution by 5 per cent from 2000 levels by 2020 (Australian Government, 2011).
d DCCEE (2011) - Emissions including land use change.
e Refer to Table 4.5.
f The figures are presented using one decimal place for comparison with the large scale emissions; as a result, the
combined scope 1 and scope 2 emissions might not correspond to the individual scope 1 and scope 2 emissions
presented.

Supplementary Greenhouse Gas Assessment.docx 46
Supplementary Greenhouse Gas Assessment Report
Coffey Environments | Job Number 3568C
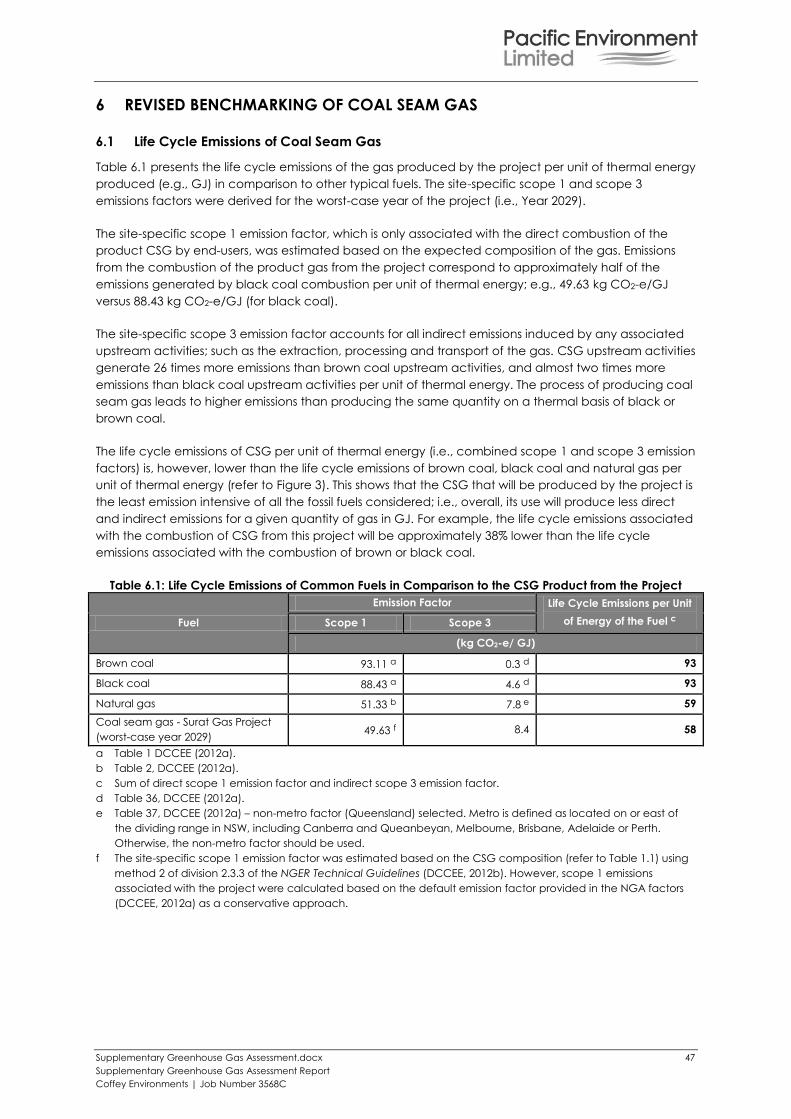
Supplementary Greenhouse Gas Assessment.docx 47
Supplementary Greenhouse Gas Assessment Report
Coffey Environments | Job Number 3568C
6 REVISED BENCHMARKING OF COAL SEAM GAS
6.1 Life Cycle Emissions of Coal Seam Gas
Table 6.1 presents the life cycle emissions of the gas produced by the project per unit of thermal energy
produced (e.g., GJ) in comparison to other typical fuels. The site-specific scope 1 and scope 3
emissions factors were derived for the worst-case year of the project (i.e., Year 2029).
The site-specific scope 1 emission factor, which is only associated with the direct combustion of the
product CSG by end-users, was estimated based on the expected composition of the gas. Emissions
from the combustion of the product gas from the project correspond to approximately half of the
emissions generated by black coal combustion per unit of thermal energy; e.g., 49.63 kg CO2-e/GJ
versus 88.43 kg CO2-e/GJ (for black coal).
The site-specific scope 3 emission factor accounts for all indirect emissions induced by any associated
upstream activities; such as the extraction, processing and transport of the gas. CSG upstream activities
generate 26 times more emissions than brown coal upstream activities, and almost two times more
emissions than black coal upstream activities per unit of thermal energy. The process of producing coal
seam gas leads to higher emissions than producing the same quantity on a thermal basis of black or
brown coal.
The life cycle emissions of CSG per unit of thermal energy (i.e., combined scope 1 and scope 3 emission
factors) is, however, lower than the life cycle emissions of brown coal, black coal and natural gas per
unit of thermal energy (refer to Figure 3). This shows that the CSG that will be produced by the project is
the least emission intensive of all the fossil fuels considered; i.e., overall, its use will produce less direct
and indirect emissions for a given quantity of gas in GJ. For example, the life cycle emissions associated
with the combustion of CSG from this project will be approximately 38% lower than the life cycle
emissions associated with the combustion of brown or black coal.
Table 6.1: Life Cycle Emissions of Common Fuels in Comparison to the CSG Product from the Project
Fuel
Emission Factor Life Cycle Emissions per Unit
of Energy of the Fuel c Scope 1 Scope 3
(kg CO2-e/ GJ)
Brown coal 93.11 a 0.3 d 93
Black coal 88.43 a 4.6 d 93
Natural gas 51.33 b 7.8 e 59
Coal seam gas - Surat Gas Project
(worst-case year 2029) 49.63 f 8.4 58
a Table 1 DCCEE (2012a).
b Table 2, DCCEE (2012a).
c Sum of direct scope 1 emission factor and indirect scope 3 emission factor.
d Table 36, DCCEE (2012a).
e Table 37, DCCEE (2012a) – non-metro factor (Queensland) selected. Metro is defined as located on or east of
the dividing range in NSW, including Canberra and Queanbeyan, Melbourne, Brisbane, Adelaide or Perth.
Otherwise, the non-metro factor should be used.
f The site-specific scope 1 emission factor was estimated based on the CSG composition (refer to Table 1.1) using
method 2 of division 2.3.3 of the NGER Technical Guidelines (DCCEE, 2012b). However, scope 1 emissions
associated with the project were calculated based on the default emission factor provided in the NGA factors
(DCCEE, 2012a) as a conservative approach.
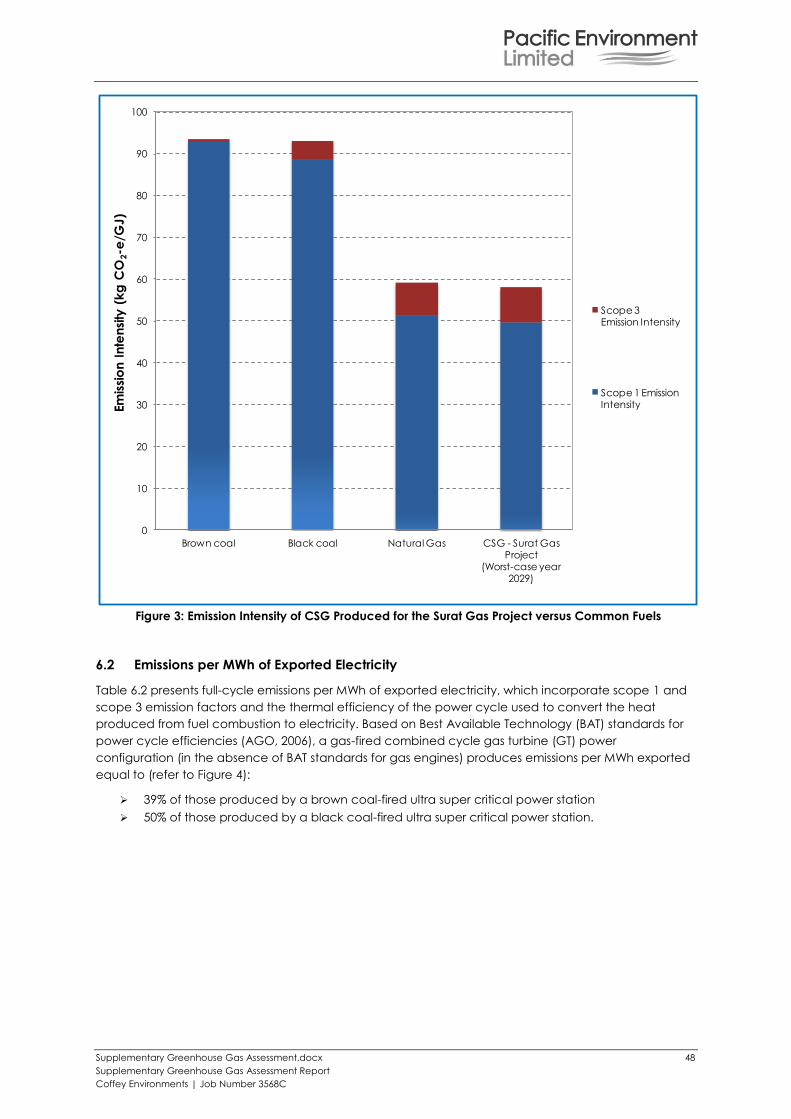
Supplementary Greenhouse Gas Assessment.docx 48
Supplementary Greenhouse Gas Assessment Report
Coffey Environments | Job Number 3568C
Figure 3: Emission Intensity of CSG Produced for the Surat Gas Project versus Common Fuels
6.2 Emissions per MWh of Exported Electricity
Table 6.2 presents full-cycle emissions per MWh of exported electricity, which incorporate scope 1 and
scope 3 emission factors and the thermal efficiency of the power cycle used to convert the heat
produced from fuel combustion to electricity. Based on Best Available Technology (BAT) standards for
power cycle efficiencies (AGO, 2006), a gas-fired combined cycle gas turbine (GT) power
configuration (in the absence of BAT standards for gas engines) produces emissions per MWh exported
equal to (refer to Figure 4):
39% of those produced by a brown coal-fired ultra super critical power station
50% of those produced by a black coal-fired ultra super critical power station.
0
10
20
30
40
50
60
70
80
90
100
Brown coal Black coal Natural Gas CSG - Surat Gas Project
(Worst-case year 2029)
Em
issi
on
In
ten
sity
(k
g C
O2-e
/GJ)
Scope 3Emission Intensity
Scope 1 Emission Intensity
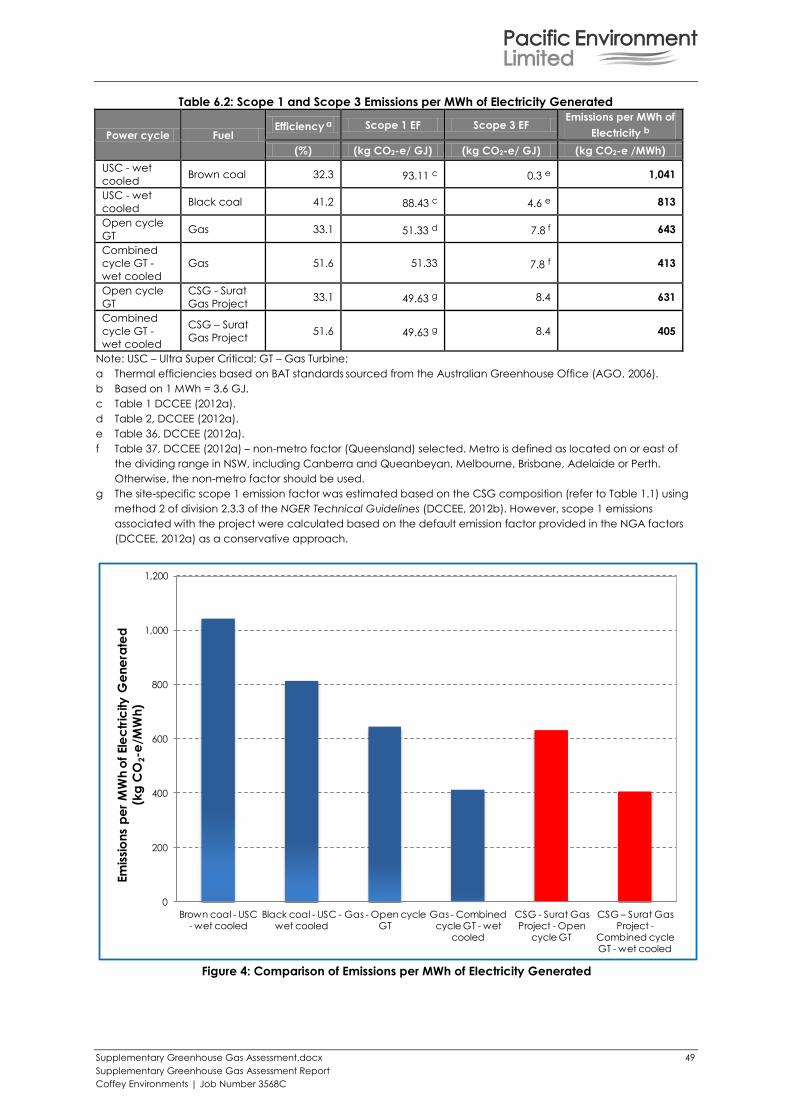
Supplementary Greenhouse Gas Assessment.docx 49
Supplementary Greenhouse Gas Assessment Report
Coffey Environments | Job Number 3568C
Table 6.2: Scope 1 and Scope 3 Emissions per MWh of Electricity Generated
Power cycle Fuel Efficiency
a Scope 1 EF Scope 3 EF Emissions per MWh of
Electricity b
(%) (kg CO2-e/ GJ) (kg CO2-e/ GJ) (kg CO2-e /MWh)
USC - wet
cooled Brown coal 32.3 93.11 c 0.3 e 1,041
USC - wet
cooled Black coal 41.2 88.43 c 4.6 e 813
Open cycle
GT Gas 33.1 51.33 d 7.8 f 643
Combined
cycle GT -
wet cooled
Gas 51.6 51.33 7.8 f 413
Open cycle
GT
CSG - Surat
Gas Project 33.1 49.63 g 8.4 631
Combined
cycle GT -
wet cooled
CSG – Surat
Gas Project 51.6 49.63 g 8.4 405
Note: USC – Ultra Super Critical; GT – Gas Turbine;
a Thermal efficiencies based on BAT standards sourced from the Australian Greenhouse Office (AGO, 2006).
b Based on 1 MWh = 3.6 GJ.
c Table 1 DCCEE (2012a).
d Table 2, DCCEE (2012a).
e Table 36, DCCEE (2012a).
f Table 37, DCCEE (2012a) – non-metro factor (Queensland) selected. Metro is defined as located on or east of
the dividing range in NSW, including Canberra and Queanbeyan, Melbourne, Brisbane, Adelaide or Perth.
Otherwise, the non-metro factor should be used.
g The site-specific scope 1 emission factor was estimated based on the CSG composition (refer to Table 1.1) using
method 2 of division 2.3.3 of the NGER Technical Guidelines (DCCEE, 2012b). However, scope 1 emissions
associated with the project were calculated based on the default emission factor provided in the NGA factors
(DCCEE, 2012a) as a conservative approach.
Figure 4: Comparison of Emissions per MWh of Electricity Generated
0
200
400
600
800
1,000
1,200
Brown coal - USC - wet cooled
Black coal - USC -wet cooled
Gas - Open cycle GT
Gas - Combined cycle GT - wet
cooled
CSG - Surat Gas Project - Open
cycle GT
CSG – Surat Gas Project -
Combined cycle GT - wet cooled
Em
issi
on
s p
er
MW
h o
f Ele
ctr
icity
Ge
ne
rate
d
(kg
CO
2-e
/MW
h)

Supplementary Greenhouse Gas Assessment.docx 50
Supplementary Greenhouse Gas Assessment Report
Coffey Environments | Job Number 3568C
Supplementary Greenhouse Gas Assessment.docx 51
Supplementary Greenhouse Gas Assessment Report
Coffey Environments | Job Number 3568C
7 MANAGEMENT MEASURES
The mitigation measures adopted for the EIS presented in Appendix D of the EIS are still valid; such as
minimising flaring and eliminating venting of gas where possible.
The overall estimated emissions intensity (kg CO2-e/GJ of CSG) was shown to be the lowest amongst
fossil fuels that are commonly used. In addition, Arrow has committed to the ongoing measurement
and monitoring of the project’s emissions, and energy consumption and production, through a range
of schemes, including:
the National Greenhouse and Energy Reporting (NGER) System
the Energy Efficiency Opportunities Program (EEO).
It is also recommended that Arrow continues to investigate GHG abatement measures for ongoing
monitoring and maintenance programs at the site-level, reducing fugitive emissions from equipment
leaks, and high-level investigations into new technologies as they become available.
In addition to those measures, as consumption of electricity is an important contributor to life cycle
emissions, it is recommended that electrical equipment (e.g. particularly engines, turbines, pumps and
compressors) is regularly monitored and maintained, as part of a comprehensive energy efficiency
improvement program for the project. These measures should be consistent with EEO program
activities.
Arrow is also a direct participant in the carbon price mechanism. This means that, in accordance with
the Clean Energy Act 2011, Arrow must, annually, report its emissions and submit permits to acquit its
liability. The availability and price of these permits are dictated by Australia’s emission targets. As such,
the project’s activities will be consistent with Australia’s current policy to reduce greenhouse gas
emissions.

Supplementary Greenhouse Gas Assessment.docx 52
Supplementary Greenhouse Gas Assessment Report
Coffey Environments | Job Number 3568C
Supplementary Greenhouse Gas Assessment.docx 53
Supplementary Greenhouse Gas Assessment Report
Coffey Environments | Job Number 3568C
8 CONCLUSIONS
The supplementary greenhouse gas impact assessment describes the revised estimated greenhouse
emissions from the construction, operation and decommissioning/rehabilitation of the project, based
on the recent refinements made to the project description, and predicts the potential impacts
associated with these emissions.
The revised direct (scope 1) and indirect (scope 2) greenhouse emissions for worst-case year 2029 were
estimated to be approximately 3.6 Mt CO2-e/annum. These emissions are approximately 4.5% higher
than the estimated emissions for worst-case year 2030 in the EIS, for a higher forecast quantity of CSG
produced (i.e., approximately 23%). The majority of the emissions generated will now be associated
with electricity consumption from the grid as opposed to gas combustion, as a result of Arrow
presenting its alternative power supply option (connection to Queensland’s electricity grid) as its
preferred option in the SREIS.
The scope 1 and scope 2 emissions associated with worst-case year 2029 are expected to contribute
approximately 0.012% to Global 2009 emissions. These emissions also represent approximately 0.89% of
Australia’s 2009 emissions for the energy sector and around 0.69% of the Australian Government’s 2020
emissions target.
Combined scope 1 and scope 2 emissions are minor (approximately 13% of the life cycle emissions) in
comparison with scope 3 emissions, which will primarily be due to greenhouse emissions associated with
the end use of the product fuel.
The refined project design results in estimated cumulative scope 1 and scope 2 emissions for the life of
the project of 81 Mt CO2-e, which is 16% lower than the estimated cumulative emissions of 96 Mt CO2-e
associated with the design at the time of the EIS.
Based on the worst-case year (2029) of this assessment, it was determined that combusting coal seam
gas for heating or electricity generation purposes emits overall significantly less greenhouse gas
emissions over the life cycle (scope 1 and scope 3) per unit of thermal energy produced in comparison
with other fossil fuels, particularly coal. For example, the life cycle emissions associated with the
combustion of CSG from this project will be approximately 38% lower than the life cycle emissions
associated with the combustion of brown or black coal.
The changes in design for the project, in particular the change in permanent power supply (i.e., self-
generation using CSG was assessed in the EIS while electricity from the grid is now assessed in the SREIS),
were expected to materially affect the annual and cumulative scope 1 and scope 2 emissions.
However, lower refined annual power requirements for the facilities and wells were provided for the
SREIS. Consequently, despite the difference in contribution from scope 1 and scope 2 emissions, the
revised annual total scope 1 and scope 2 emissions for worst-case year 2029 are comparable to the
emissions presented in the EIS for worst-case year 2030. There was however, a substantial reduction in
cumulative emissions due to lower annual power requirements, in particular for the ramp-up and ramp-
down phases.
Based solely on the emissions for worst-case year 2029, it is predicted that the potential impacts from
the project will be slightly higher than those predicted in the EIS, for a higher forecast quantity of CSG
produced. The impacts associated with the project, with respect to climate change, will be in
proportion with the project’s contribution to global greenhouse gas emissions. Therefore, the potential
impacts associated with climate change directly attributable to the project on a global scale can be
expected to be negligible.
Arrow has, however, committed to the ongoing measurement and monitoring of the project’s
emissions, and energy consumption and production, through a range of schemes, including:
Supplementary Greenhouse Gas Assessment.docx 54
Supplementary Greenhouse Gas Assessment Report
Coffey Environments | Job Number 3568C
the National Greenhouse and Energy Reporting (NGER) System
the Energy Efficiency Opportunities Program (EEO).
It is also recommended that Arrow continues to investigate GHG abatement measures for ongoing
monitoring and maintenance programs at the site-level, reducing fugitive emissions from equipment
leaks, and high-level investigations into new technologies as they become available.
In addition to those measures, as consumption of electricity is an important contributor to life cycle
emissions, it is recommended that electrical equipment (e.g., particularly engines, turbines, pumps and
compressors) is regularly monitored and maintained, as part of a comprehensive energy efficiency
improvement program for the project. These measures should be consistent with EEO program
activities.
Arrow is also direct participant in the carbon price mechanism. This means that, in accordance with the
Clean Energy Act 2011, Arrow must, annually, report its emissions and submit permits to acquit its
liability. The availability and price of these permits are dictated by Australia’s emission targets. As such,
the project’s activities will be consistent with Australia’s current policy to reduce greenhouse gas
emissions.
Supplementary Greenhouse Gas Assessment.docx 55
Supplementary Greenhouse Gas Assessment Report
Coffey Environments | Job Number 3568C
9 REFERENCES
ABS (2008) 9210055001 Survey of Motor Vehicle Use: Data Cubes, Australia, 12 months ended October
2007, Australian Bureau of Statistics, September 2008.
AGO (2006) Technical Guidelines: Generator Efficiency Standards, Australian Greenhouse Office
Department of the Environment and Heritage, December 2006.
Arrow Energy (2013), 6775 Arrow Energy 2011-2012 NGER calculations updated on 08-04-13.xlsx,
updated by Pacific Environment on 08/04/13 and approved for use by Arrow Energy.
Australian Government (2011) Securing a clean energy future – The Australian Government’s climate
change plan, Clean Energy Future, Commonwealth of Australia 2011.
http://www.cleanenergyfuture.gov.au/wp-content/uploads/2011/07/Consolidated-Final.pdf
Australian Government (2012), Media release: Australia ready to join Kyoto second commitment
period, November 2012.
http://www.climatechange.gov.au/minister/greg-combet/2012/media-releases/November/MR-302-
12.aspx
AGO (1999) Woody Biomass: Methods for Estimating Change, National Carbon Accounting System
Technical Report No. 3, Australian Greenhouse Office, August 1999.
AGO (2000) Synthesis of Allometrics, Review of Root Biomass and Design of Future Woody Biomass
Sampling Strategies, National Carbon Accounting System Technical Report No. 17, Australian
Greenhouse Office, September 2000.
AGO (2002) Greenhouse Gas Emissions from Land Use Change in Australia: An Integrated Application
of the National Carbon Accounting System, Australian Greenhouse Office, May 2002.
AGO (2003) Spatial Estimates of Biomass in ‘Mature’ Native Vegetation, National Carbon Accounting
System Technical Report No. 44, Australian Greenhouse Office, November 2003.
API (2009) Compendium of Greenhouse Gas Emissions Methodologies for the Oil and Natural Gas
Industry, American Petroleum Institute, August 2009.
CER (2013a), Carbon Pricing Mechanism – What emission typed are in and out?, Clean Energy
Regulator, Commonwealth of Australia 2013.
http://www.cleanenergyregulator.gov.au/Carbon-Pricing-Mechanism/About-the-Mechanism/What-
emission-types-are-in-and-out/Pages/default.aspx
CER (2013b), Clean Energy Act 2011 (as amended on 21 January 2013), Clean Energy Regulator,
Commonwealth of Australia 2013.
CER (2013c), Carbon Pricing Mechanism – Liquid fuel Opt-in Scheme, Clean Energy Regulator,
Commonwealth of Australia 2013.
http://www.cleanenergyregulator.gov.au/Carbon-Pricing-Mechanism/About-the-Mechanism/liquid-
fuel-opt-in-scheme/Pages/Default.aspx
CER (2013d), Carbon Pricing Mechanism – Obligation transfer numbers, Clean Energy Regulator,
Commonwealth of Australia 2013.
http://www.cleanenergyregulator.gov.au/Carbon-Pricing-Mechanism/About-the-
Mechanism/Obligation-transfer-numbers/Pages/default.aspx)
Supplementary Greenhouse Gas Assessment.docx 56
Supplementary Greenhouse Gas Assessment Report
Coffey Environments | Job Number 3568C
CER (2013e), Carbon Pricing Mechanism – Jobs and Competitiveness Program, Clean Energy
Regulator, Commonwealth of Australia 2013.
http://www.cleanenergyregulator.gov.au/Carbon-Pricing-Mechanism/Industry-Assistance/jobs-and-
competitiveness-program/Pages/default.aspx
Cardno (2013), Section 2 of the Transport Assumptions Report within the Road Impact Assessment.
DCCEE (2010), Fact sheet: Australia's emissions projections 2010, Department of Climate Change and
Energy Efficiency, Commonwealth of Australia, 2010.
http://www.climatechange.gov.au/en/publications/projections/australias-emissions-
projections/factsheet-emissions-projections.aspx
DCCEE (2011), Australia’s National Greenhouse Accounts: State and Territory Greenhouse Gas
Inventories 2009, Department of Climate Change and Energy Efficiency, Commonwealth of Australia,
2011.
http://www.climatechange.gov.au/~/media/publications/greenhouse-acctg/state-territory-inventory-
2009.pdf
DCCEE (2012a), Australian National Greenhouse Accounts - National Greenhouse Accounts (NGA)
Factors, Department of Climate Change and Energy Efficiency, Commonwealth of Australia, July 2012.
DCCEE (2012b), National Greenhouse and Energy Reporting System Measurement Technical Guidelines
for the estimation of greenhouse gas emissions by facilities in Australia, Department of Climate Change
and Energy Efficiency, Commonwealth of Australia, July 2012.
DCCEE (2012c), National Greenhouse and Energy Reporting Act 2007 (as amended on 12 July 2012),
Department of Climate Change and Energy Efficiency, Commonwealth of Australia, July 2012.
DCCEE (2013), Global Warming Potentials, Department of Climate Change and Energy Efficiency,
Commonwealth of Australia, 2013.
http://www.climatechange.gov.au/government/initiatives/gwp.aspx (viewed on 23/05/2013).
Department of Industry (2013), Reducing Carbon - Jobs and Competitiveness Program, Department of
Industry, Innovation, Climate Change, Science, Research and Tertiary Education, Commonwealth of
Australia, 2013.
http://climatechange.gov.au/reducing-carbon/jcp (viewed on 24/05/13).
DRET (2012), Summary of the EEO Amendment Regulation 2012, Department of Resources, Energy, and
Tourism, June 2012.
http://www.ret.gov.au/energy/efficiency/eeo/extentionGreen/Pages/ExtensionEEOGreenfieldGas.asp
x
DRET (2013), Expansion of Energy Efficiency Opportunities to new developments and expansion
projects, Department of Resources, Energy and Tourism, February 2013.
http://www.ret.gov.au/energy/efficiency/eeo/extentionGreen/Pages/ExtensionEEOGreenfieldGas.asp
x
IPCC (2007), Intergovernmental Panel on Climate Change Fourth Assessment Report: Climate Change
2007, 2.10.2 Direct Global Warming Potentials, Intergovernmental Panel on Climate Change, 2007.
http://www.ipcc.ch/publications_and_data/ar4/wg1/en/ch2s2-10-2.html#table-2-14
National Greenhouse and Energy Reporting (Measurement) Determination 2008 (as amended on 1 July
2012), Department of Climate Change and Energy Efficiency, Commonwealth of Australia, July 2012.
PAEHolmes (2011), 3568 Arrow Energy Surat Gas Project - Greenhouse Gas Assessment - no tracked
changes 24 nov 11.docx, PAEHolmes Brisbane, 24/11/11.
Supplementary Greenhouse Gas Assessment.docx 57
Supplementary Greenhouse Gas Assessment Report
Coffey Environments | Job Number 3568C
PAEHolmes (2012), 3678d Coffey Arrow Energy Report R6.docx, PAEHolmes Brisbane, 13/11/12.
Queensland Government (2013), Business and Industry Portal – Smart Energy Savings Program, last
updated on 25 March 2013.
http://www.business.qld.gov.au/business/running/environment/energy-saving-ideas/smart-energy-
saving-programs
UNFCCC (2012), The Kyoto Protocol lives on: Second commitment period secured in last minutes of
Durban, United Nations Framework Convention on Climate Change, March 2012.
http://unfccc.int/press/news_room/newsletter/in_focus/items/6672.php
UNSD (2012) Millennium Development Goals Indicators – Carbon dioxide emissions (CO2), thousand
metric tons of CO2 (CDIAC), United Nations Statistics Division, 2012.
http://mdgs.un.org/unsd/mdg/Search.aspx?q=Carbon%20dioxide%20emissions
WRI & WBCSD (2004) The Greenhouse Gas Protocol, World Resource Industry & World Business Council
for Sustainable Development, March 2004.

Supplementary Greenhouse Gas Assessment.docx 58
Supplementary Greenhouse Gas Assessment Report
Coffey Environments | Job Number 3568C
Supplementary Greenhouse Gas Assessment.docx A-1
Supplementary Greenhouse Gas Assessment Report
Coffey Environments | Job Number 3568C
Appendix A ESTIMATION OF EMISSIONS
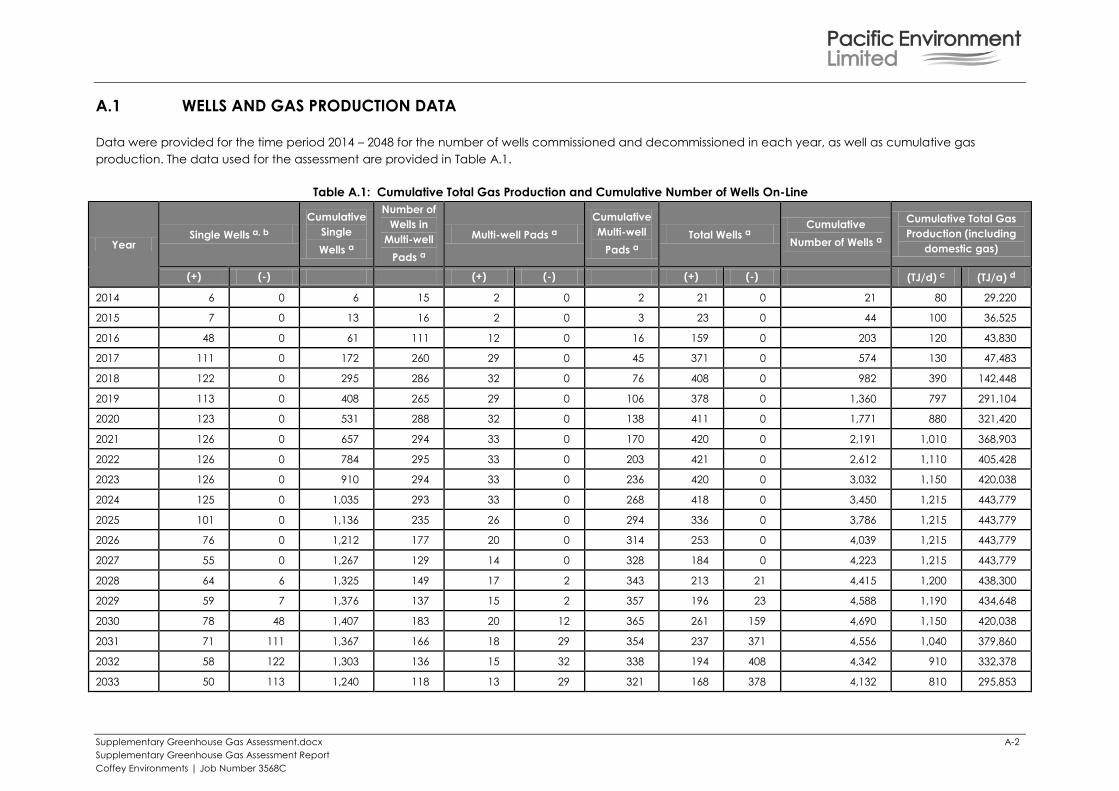
Supplementary Greenhouse Gas Assessment.docx A-2
Supplementary Greenhouse Gas Assessment Report
Coffey Environments | Job Number 3568C
A.1 WELLS AND GAS PRODUCTION DATA
Data were provided for the time period 2014 – 2048 for the number of wells commissioned and decommissioned in each year, as well as cumulative gas
production. The data used for the assessment are provided in Table A.1.
Table A.1: Cumulative Total Gas Production and Cumulative Number of Wells On-Line
Year Single Wells a, b
Cumulative
Single
Wells a
Number of
Wells in
Multi-well
Pads a
Multi-well Pads a
Cumulative
Multi-well
Pads a
Total Wells a Cumulative
Number of Wells a
Cumulative Total Gas
Production (including
domestic gas)
(+) (-) (+) (-) (+) (-) (TJ/d) c (TJ/a) d
2014 6 0 6 15 2 0 2 21 0 21 80 29,220
2015 7 0 13 16 2 0 3 23 0 44 100 36,525
2016 48 0 61 111 12 0 16 159 0 203 120 43,830
2017 111 0 172 260 29 0 45 371 0 574 130 47,483
2018 122 0 295 286 32 0 76 408 0 982 390 142,448
2019 113 0 408 265 29 0 106 378 0 1,360 797 291,104
2020 123 0 531 288 32 0 138 411 0 1,771 880 321,420
2021 126 0 657 294 33 0 170 420 0 2,191 1,010 368,903
2022 126 0 784 295 33 0 203 421 0 2,612 1,110 405,428
2023 126 0 910 294 33 0 236 420 0 3,032 1,150 420,038
2024 125 0 1,035 293 33 0 268 418 0 3,450 1,215 443,779
2025 101 0 1,136 235 26 0 294 336 0 3,786 1,215 443,779
2026 76 0 1,212 177 20 0 314 253 0 4,039 1,215 443,779
2027 55 0 1,267 129 14 0 328 184 0 4,223 1,215 443,779
2028 64 6 1,325 149 17 2 343 213 21 4,415 1,200 438,300
2029 59 7 1,376 137 15 2 357 196 23 4,588 1,190 434,648
2030 78 48 1,407 183 20 12 365 261 159 4,690 1,150 420,038
2031 71 111 1,367 166 18 29 354 237 371 4,556 1,040 379,860
2032 58 122 1,303 136 15 32 338 194 408 4,342 910 332,378
2033 50 113 1,240 118 13 29 321 168 378 4,132 810 295,853
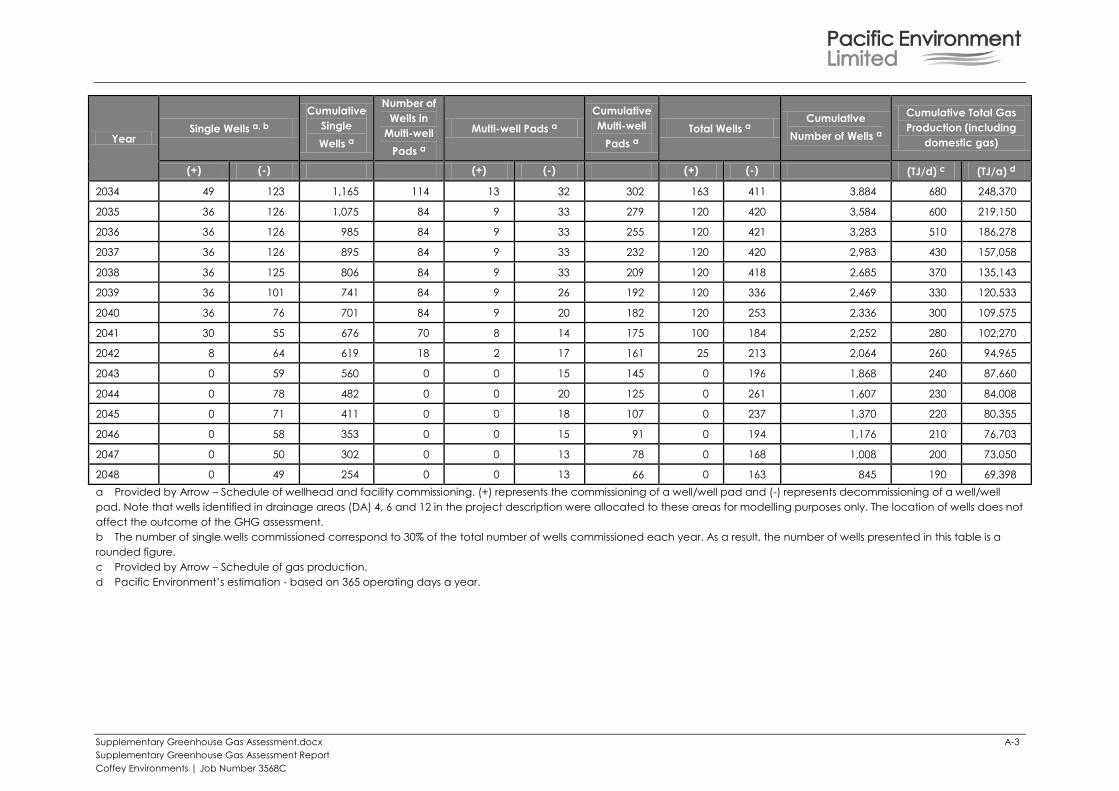
Supplementary Greenhouse Gas Assessment.docx A-3
Supplementary Greenhouse Gas Assessment Report
Coffey Environments | Job Number 3568C
Year Single Wells a, b
Cumulative
Single
Wells a
Number of
Wells in
Multi-well
Pads a
Multi-well Pads a
Cumulative
Multi-well
Pads a
Total Wells a Cumulative
Number of Wells a
Cumulative Total Gas
Production (including
domestic gas)
(+) (-) (+) (-) (+) (-) (TJ/d) c (TJ/a) d
2034 49 123 1,165 114 13 32 302 163 411 3,884 680 248,370
2035 36 126 1,075 84 9 33 279 120 420 3,584 600 219,150
2036 36 126 985 84 9 33 255 120 421 3,283 510 186,278
2037 36 126 895 84 9 33 232 120 420 2,983 430 157,058
2038 36 125 806 84 9 33 209 120 418 2,685 370 135,143
2039 36 101 741 84 9 26 192 120 336 2,469 330 120,533
2040 36 76 701 84 9 20 182 120 253 2,336 300 109,575
2041 30 55 676 70 8 14 175 100 184 2,252 280 102,270
2042 8 64 619 18 2 17 161 25 213 2,064 260 94,965
2043 0 59 560 0 0 15 145 0 196 1,868 240 87,660
2044 0 78 482 0 0 20 125 0 261 1,607 230 84,008
2045 0 71 411 0 0 18 107 0 237 1,370 220 80,355
2046 0 58 353 0 0 15 91 0 194 1,176 210 76,703
2047 0 50 302 0 0 13 78 0 168 1,008 200 73,050
2048 0 49 254 0 0 13 66 0 163 845 190 69,398
a Provided by Arrow – Schedule of wellhead and facility commissioning. (+) represents the commissioning of a well/well pad and (-) represents decommissioning of a well/well
pad. Note that wells identified in drainage areas (DA) 4, 6 and 12 in the project description were allocated to these areas for modelling purposes only. The location of wells does not
affect the outcome of the GHG assessment.
b The number of single wells commissioned correspond to 30% of the total number of wells commissioned each year. As a result, the number of wells presented in this table is a
rounded figure.
c Provided by Arrow – Schedule of gas production.
d Pacific Environment’s estimation - based on 365 operating days a year.
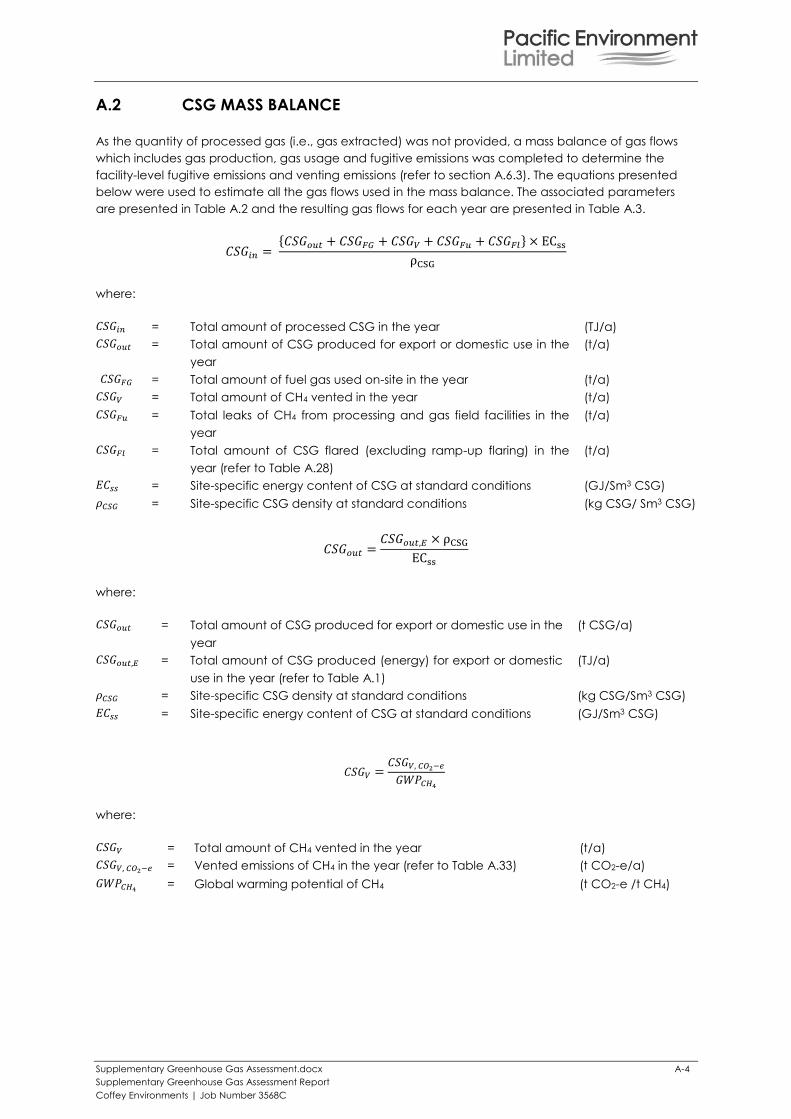
Supplementary Greenhouse Gas Assessment.docx A-4
Supplementary Greenhouse Gas Assessment Report
Coffey Environments | Job Number 3568C
A.2 CSG MASS BALANCE
As the quantity of processed gas (i.e., gas extracted) was not provided, a mass balance of gas flows
which includes gas production, gas usage and fugitive emissions was completed to determine the
facility-level fugitive emissions and venting emissions (refer to section A.6.3). The equations presented
below were used to estimate all the gas flows used in the mass balance. The associated parameters
are presented in Table A.2 and the resulting gas flows for each year are presented in Table A.3.
where:
= Total amount of processed CSG in the year (TJ/a)
= Total amount of CSG produced for export or domestic use in the
year
(t/a)
= Total amount of fuel gas used on-site in the year (t/a)
= Total amount of CH4 vented in the year (t/a)
= Total leaks of CH4 from processing and gas field facilities in the
year
(t/a)
= Total amount of CSG flared (excluding ramp-up flaring) in the
year (refer to Table A.28)
(t/a)
= Site-specific energy content of CSG at standard conditions (GJ/Sm3 CSG)
= Site-specific CSG density at standard conditions (kg CSG/ Sm3 CSG)
where:
= Total amount of CSG produced for export or domestic use in the
year
(t CSG/a)
= Total amount of CSG produced (energy) for export or domestic
use in the year (refer to Table A.1)
(TJ/a)
= Site-specific CSG density at standard conditions (kg CSG/Sm3 CSG)
= Site-specific energy content of CSG at standard conditions (GJ/Sm3 CSG)
where:
= Total amount of CH4 vented in the year (t/a)
= Vented emissions of CH4 in the year (refer to Table A.33) (t CO2-e/a)
= Global warming potential of CH4 (t CO2-e /t CH4)
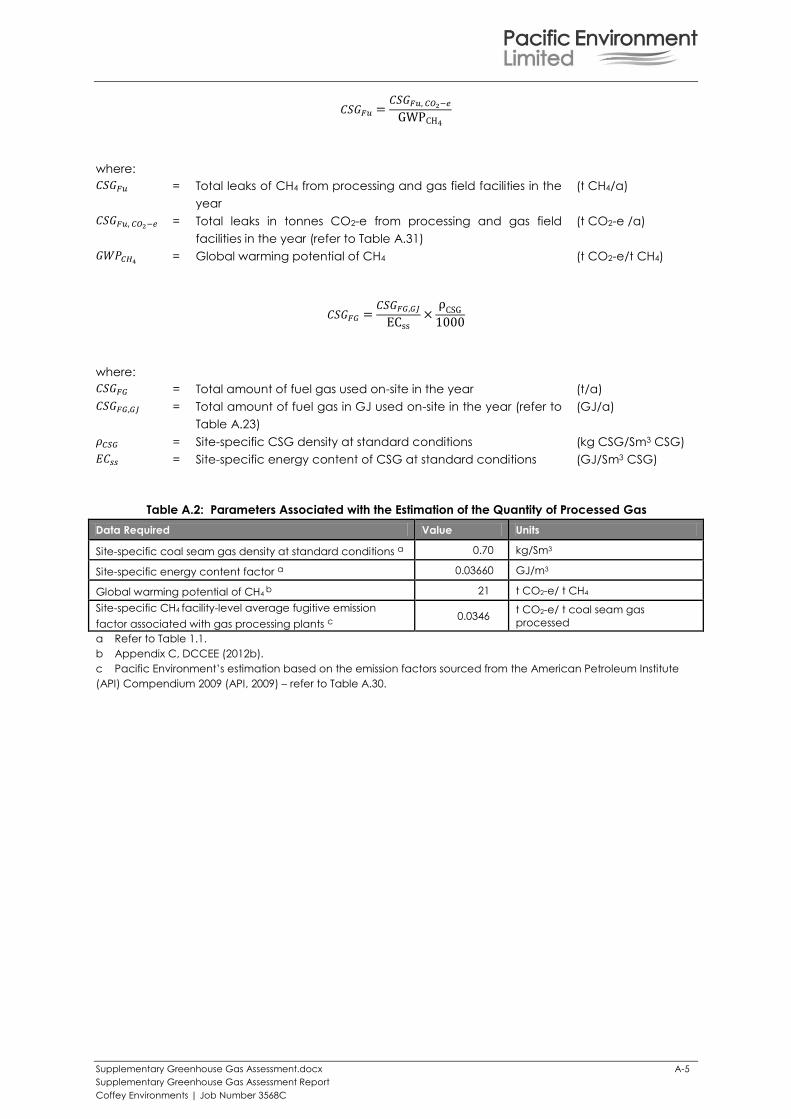
Supplementary Greenhouse Gas Assessment.docx A-5
Supplementary Greenhouse Gas Assessment Report
Coffey Environments | Job Number 3568C
where:
= Total leaks of CH4 from processing and gas field facilities in the
year
(t CH4/a)
= Total leaks in tonnes CO2-e from processing and gas field
facilities in the year (refer to Table A.31)
(t CO2-e /a)
= Global warming potential of CH4 (t CO2-e/t CH4)
where:
= Total amount of fuel gas used on-site in the year (t/a)
= Total amount of fuel gas in GJ used on-site in the year (refer to
Table A.23)
(GJ/a)
= Site-specific CSG density at standard conditions (kg CSG/Sm3 CSG)
= Site-specific energy content of CSG at standard conditions (GJ/Sm3 CSG)
Table A.2: Parameters Associated with the Estimation of the Quantity of Processed Gas
Data Required Value Units
Site-specific coal seam gas density at standard conditions a 0.70 kg/Sm3
Site-specific energy content factor a 0.03660 GJ/m3
Global warming potential of CH4 b 21 t CO2-e/ t CH4
Site-specific CH4 facility-level average fugitive emission
factor associated with gas processing plants c 0.0346
t CO2-e/ t coal seam gas
processed
a Refer to Table 1.1.
b Appendix C, DCCEE (2012b).
c Pacific Environment’s estimation based on the emission factors sourced from the American Petroleum Institute
(API) Compendium 2009 (API, 2009) – refer to Table A.30.
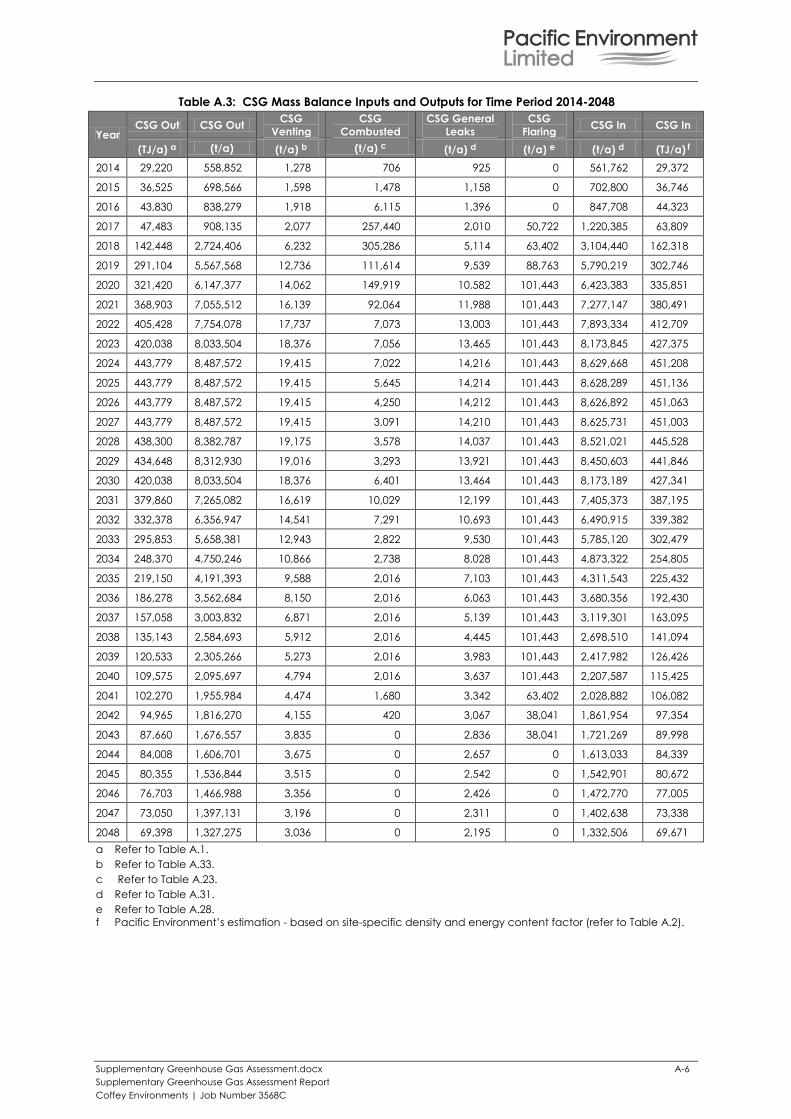
Supplementary Greenhouse Gas Assessment.docx A-6
Supplementary Greenhouse Gas Assessment Report
Coffey Environments | Job Number 3568C
Table A.3: CSG Mass Balance Inputs and Outputs for Time Period 2014-2048
Year CSG Out CSG Out
CSG
Venting
CSG
Combusted
CSG General
Leaks
CSG
Flaring CSG In CSG In
(TJ/a) a (t/a) (t/a) b (t/a) c (t/a) d (t/a) e (t/a) d (TJ/a) f
2014 29,220 558,852 1,278 706 925 0 561,762 29,372
2015 36,525 698,566 1,598 1,478 1,158 0 702,800 36,746
2016 43,830 838,279 1,918 6,115 1,396 0 847,708 44,323
2017 47,483 908,135 2,077 257,440 2,010 50,722 1,220,385 63,809
2018 142,448 2,724,406 6,232 305,286 5,114 63,402 3,104,440 162,318
2019 291,104 5,567,568 12,736 111,614 9,539 88,763 5,790,219 302,746
2020 321,420 6,147,377 14,062 149,919 10,582 101,443 6,423,383 335,851
2021 368,903 7,055,512 16,139 92,064 11,988 101,443 7,277,147 380,491
2022 405,428 7,754,078 17,737 7,073 13,003 101,443 7,893,334 412,709
2023 420,038 8,033,504 18,376 7,056 13,465 101,443 8,173,845 427,375
2024 443,779 8,487,572 19,415 7,022 14,216 101,443 8,629,668 451,208
2025 443,779 8,487,572 19,415 5,645 14,214 101,443 8,628,289 451,136
2026 443,779 8,487,572 19,415 4,250 14,212 101,443 8,626,892 451,063
2027 443,779 8,487,572 19,415 3,091 14,210 101,443 8,625,731 451,003
2028 438,300 8,382,787 19,175 3,578 14,037 101,443 8,521,021 445,528
2029 434,648 8,312,930 19,016 3,293 13,921 101,443 8,450,603 441,846
2030 420,038 8,033,504 18,376 6,401 13,464 101,443 8,173,189 427,341
2031 379,860 7,265,082 16,619 10,029 12,199 101,443 7,405,373 387,195
2032 332,378 6,356,947 14,541 7,291 10,693 101,443 6,490,915 339,382
2033 295,853 5,658,381 12,943 2,822 9,530 101,443 5,785,120 302,479
2034 248,370 4,750,246 10,866 2,738 8,028 101,443 4,873,322 254,805
2035 219,150 4,191,393 9,588 2,016 7,103 101,443 4,311,543 225,432
2036 186,278 3,562,684 8,150 2,016 6,063 101,443 3,680,356 192,430
2037 157,058 3,003,832 6,871 2,016 5,139 101,443 3,119,301 163,095
2038 135,143 2,584,693 5,912 2,016 4,445 101,443 2,698,510 141,094
2039 120,533 2,305,266 5,273 2,016 3,983 101,443 2,417,982 126,426
2040 109,575 2,095,697 4,794 2,016 3,637 101,443 2,207,587 115,425
2041 102,270 1,955,984 4,474 1,680 3,342 63,402 2,028,882 106,082
2042 94,965 1,816,270 4,155 420 3,067 38,041 1,861,954 97,354
2043 87,660 1,676,557 3,835 0 2,836 38,041 1,721,269 89,998
2044 84,008 1,606,701 3,675 0 2,657 0 1,613,033 84,339
2045 80,355 1,536,844 3,515 0 2,542 0 1,542,901 80,672
2046 76,703 1,466,988 3,356 0 2,426 0 1,472,770 77,005
2047 73,050 1,397,131 3,196 0 2,311 0 1,402,638 73,338
2048 69,398 1,327,275 3,036 0 2,195 0 1,332,506 69,671
a Refer to Table A.1.
b Refer to Table A.33.
c Refer to Table A.23.
d Refer to Table A.31.
e Refer to Table A.28.
f Pacific Environment’s estimation - based on site-specific density and energy content factor (refer to Table A.2).
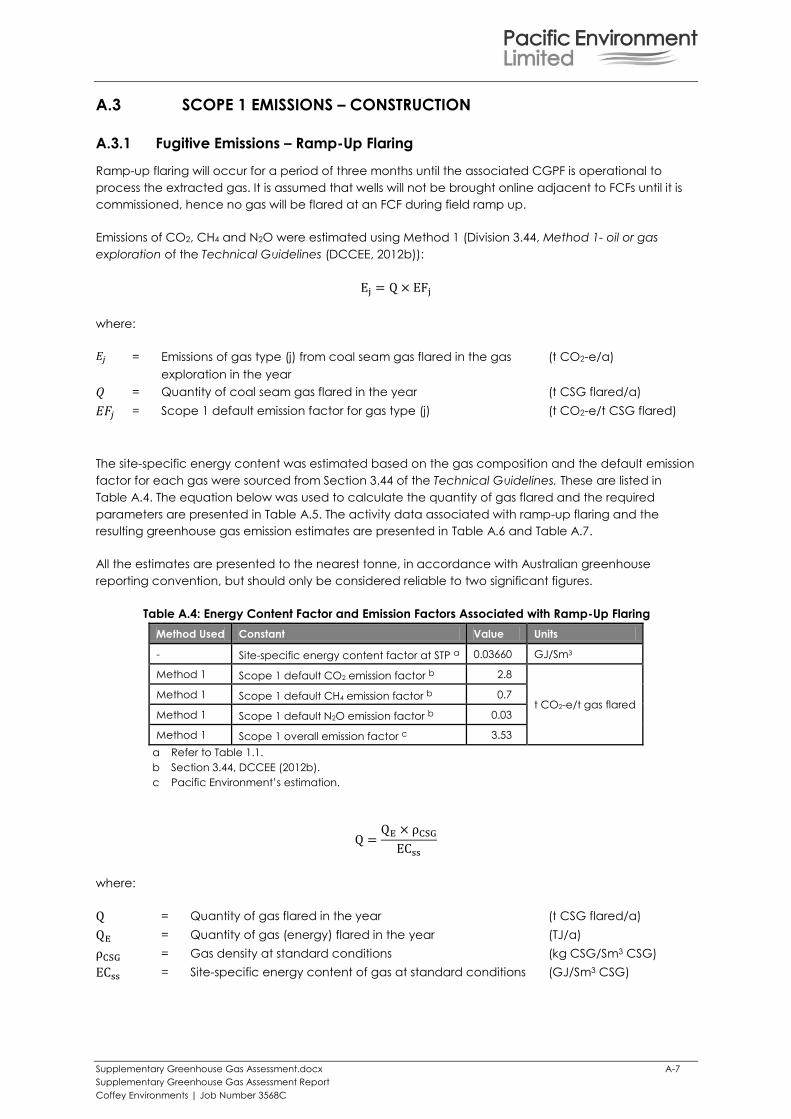
Supplementary Greenhouse Gas Assessment.docx A-7
Supplementary Greenhouse Gas Assessment Report
Coffey Environments | Job Number 3568C
A.3 SCOPE 1 EMISSIONS – CONSTRUCTION
A.3.1 Fugitive Emissions – Ramp-Up Flaring
Ramp-up flaring will occur for a period of three months until the associated CGPF is operational to
process the extracted gas. It is assumed that wells will not be brought online adjacent to FCFs until it is
commissioned, hence no gas will be flared at an FCF during field ramp up.
Emissions of CO2, CH4 and N2O were estimated using Method 1 (Division 3.44, Method 1- oil or gas
exploration of the Technical Guidelines (DCCEE, 2012b)):
where:
= Emissions of gas type (j) from coal seam gas flared in the gas
exploration in the year
(t CO2-e/a)
= Quantity of coal seam gas flared in the year (t CSG flared/a)
= Scope 1 default emission factor for gas type (j) (t CO2-e/t CSG flared)
The site-specific energy content was estimated based on the gas composition and the default emission
factor for each gas were sourced from Section 3.44 of the Technical Guidelines. These are listed in
Table A.4. The equation below was used to calculate the quantity of gas flared and the required
parameters are presented in Table A.5. The activity data associated with ramp-up flaring and the
resulting greenhouse gas emission estimates are presented in Table A.6 and Table A.7.
All the estimates are presented to the nearest tonne, in accordance with Australian greenhouse
reporting convention, but should only be considered reliable to two significant figures.
Table A.4: Energy Content Factor and Emission Factors Associated with Ramp-Up Flaring
Method Used Constant Value Units
- Site-specific energy content factor at STP a 0.03660 GJ/Sm3
Method 1 Scope 1 default CO2 emission factor b 2.8
t CO2-e/t gas flared Method 1 Scope 1 default CH4 emission factor b 0.7
Method 1 Scope 1 default N2O emission factor b 0.03
Method 1 Scope 1 overall emission factor c 3.53
a Refer to Table 1.1.
b Section 3.44, DCCEE (2012b).
c Pacific Environment’s estimation.
where:
= Quantity of gas flared in the year (t CSG flared/a)
= Quantity of gas (energy) flared in the year (TJ/a)
= Gas density at standard conditions (kg CSG/Sm3 CSG)
= Site-specific energy content of gas at standard conditions (GJ/Sm3 CSG)
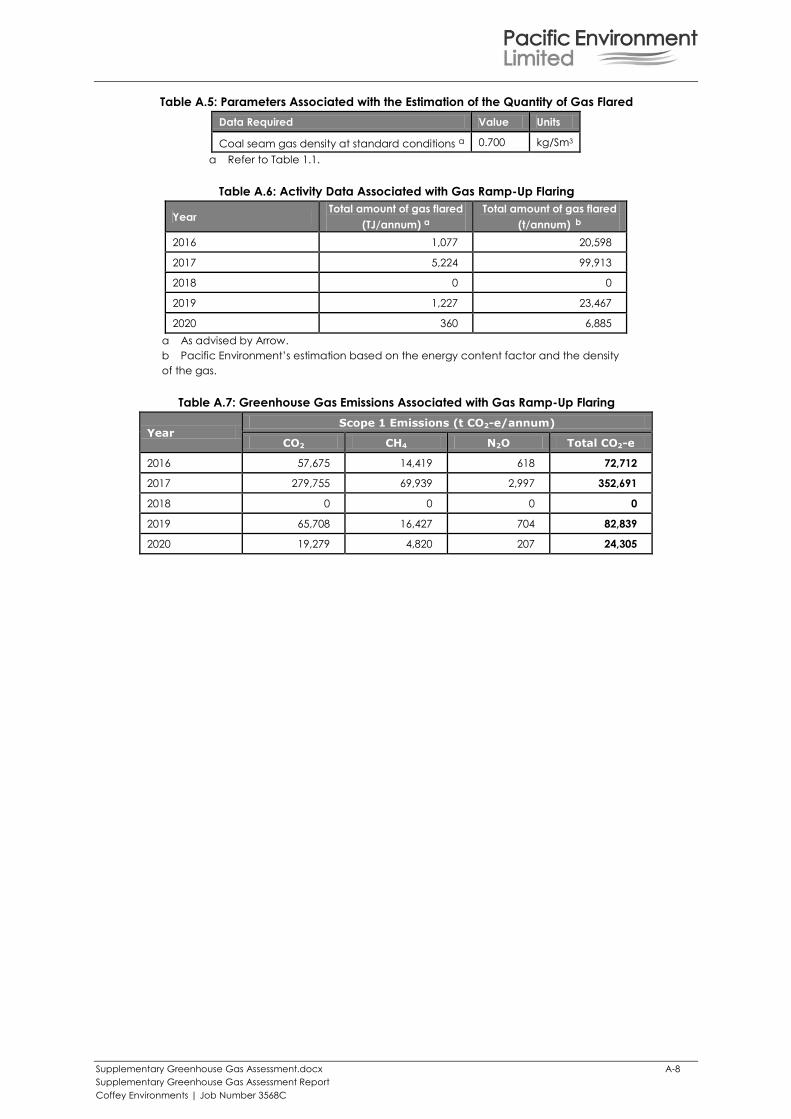
Supplementary Greenhouse Gas Assessment.docx A-8
Supplementary Greenhouse Gas Assessment Report
Coffey Environments | Job Number 3568C
Table A.5: Parameters Associated with the Estimation of the Quantity of Gas Flared
Data Required Value Units
Coal seam gas density at standard conditions a 0.700 kg/Sm3
a Refer to Table 1.1.
Table A.6: Activity Data Associated with Gas Ramp-Up Flaring
Year Total amount of gas flared
(TJ/annum) a
Total amount of gas flared
(t/annum) b
2016 1,077 20,598
2017 5,224 99,913
2018 0 0
2019 1,227 23,467
2020 360 6,885
a As advised by Arrow.
b Pacific Environment’s estimation based on the energy content factor and the density
of the gas.
Table A.7: Greenhouse Gas Emissions Associated with Gas Ramp-Up Flaring
Year Scope 1 Emissions (t CO2-e/annum)
CO2 CH4 N2O Total CO2-e
2016 57,675 14,419 618 72,712
2017 279,755 69,939 2,997 352,691
2018 0 0 0 0
2019 65,708 16,427 704 82,839
2020 19,279 4,820 207 24,305
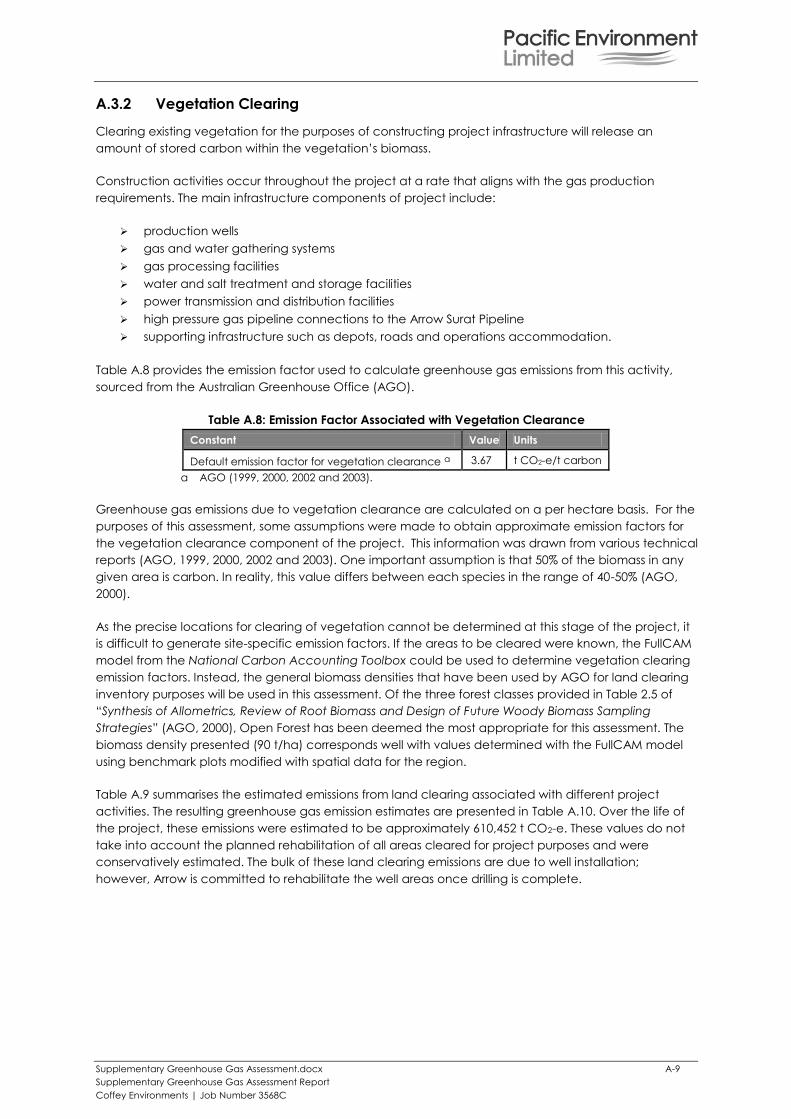
Supplementary Greenhouse Gas Assessment.docx A-9
Supplementary Greenhouse Gas Assessment Report
Coffey Environments | Job Number 3568C
A.3.2 Vegetation Clearing
Clearing existing vegetation for the purposes of constructing project infrastructure will release an
amount of stored carbon within the vegetation’s biomass.
Construction activities occur throughout the project at a rate that aligns with the gas production
requirements. The main infrastructure components of project include:
production wells
gas and water gathering systems
gas processing facilities
water and salt treatment and storage facilities
power transmission and distribution facilities
high pressure gas pipeline connections to the Arrow Surat Pipeline
supporting infrastructure such as depots, roads and operations accommodation.
Table A.8 provides the emission factor used to calculate greenhouse gas emissions from this activity,
sourced from the Australian Greenhouse Office (AGO).
Table A.8: Emission Factor Associated with Vegetation Clearance
Constant Value Units
Default emission factor for vegetation clearance a 3.67 t CO2-e/t carbon
a AGO (1999, 2000, 2002 and 2003).
Greenhouse gas emissions due to vegetation clearance are calculated on a per hectare basis. For the
purposes of this assessment, some assumptions were made to obtain approximate emission factors for
the vegetation clearance component of the project. This information was drawn from various technical
reports (AGO, 1999, 2000, 2002 and 2003). One important assumption is that 50% of the biomass in any
given area is carbon. In reality, this value differs between each species in the range of 40-50% (AGO,
2000).
As the precise locations for clearing of vegetation cannot be determined at this stage of the project, it
is difficult to generate site-specific emission factors. If the areas to be cleared were known, the FullCAM
model from the National Carbon Accounting Toolbox could be used to determine vegetation clearing
emission factors. Instead, the general biomass densities that have been used by AGO for land clearing
inventory purposes will be used in this assessment. Of the three forest classes provided in Table 2.5 of
“Synthesis of Allometrics, Review of Root Biomass and Design of Future Woody Biomass Sampling
Strategies” (AGO, 2000), Open Forest has been deemed the most appropriate for this assessment. The
biomass density presented (90 t/ha) corresponds well with values determined with the FullCAM model
using benchmark plots modified with spatial data for the region.
Table A.9 summarises the estimated emissions from land clearing associated with different project
activities. The resulting greenhouse gas emission estimates are presented in Table A.10. Over the life of
the project, these emissions were estimated to be approximately 610,452 t CO2-e. These values do not
take into account the planned rehabilitation of all areas cleared for project purposes and were
conservatively estimated. The bulk of these land clearing emissions are due to well installation;
however, Arrow is committed to rehabilitate the well areas once drilling is complete.
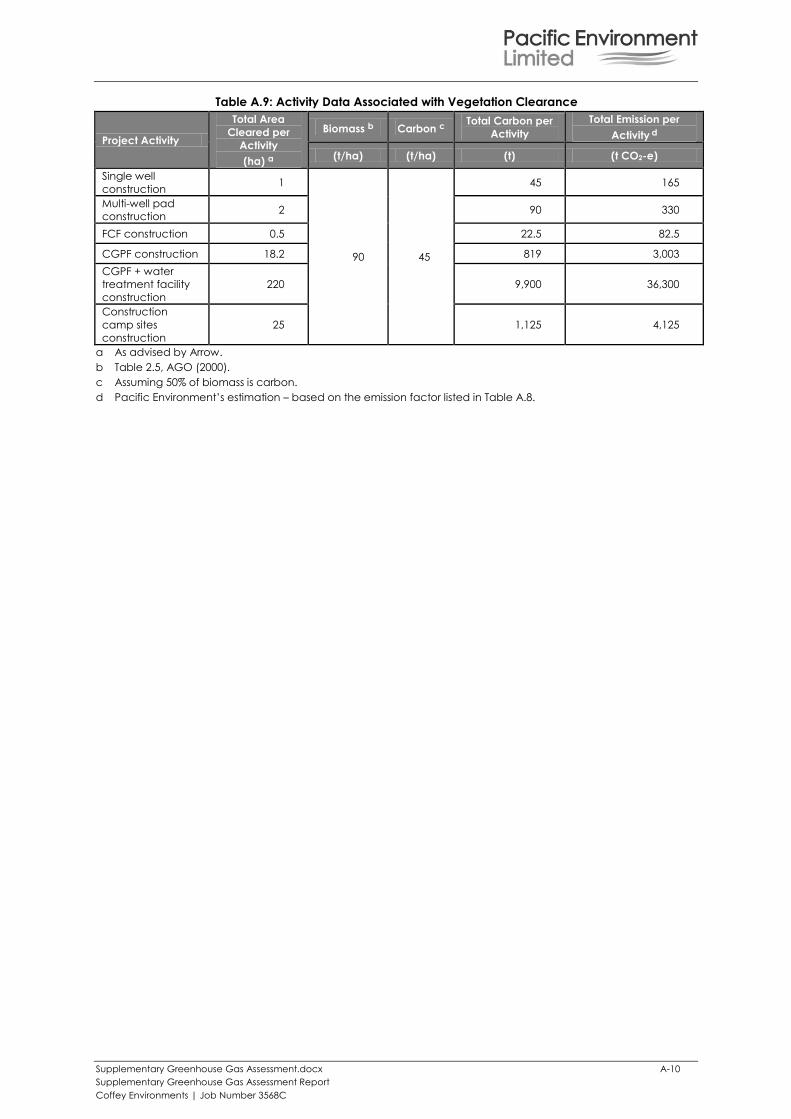
Supplementary Greenhouse Gas Assessment.docx A-10
Supplementary Greenhouse Gas Assessment Report
Coffey Environments | Job Number 3568C
Table A.9: Activity Data Associated with Vegetation Clearance
Project Activity
Total Area
Cleared per
Activity
(ha) a
Biomass b Carbon c Total Carbon per
Activity
Total Emission per
Activity d
(t/ha) (t/ha) (t) (t CO2-e)
Single well
construction 1
90 45
45 165
Multi-well pad
construction 2 90 330
FCF construction 0.5 22.5 82.5
CGPF construction 18.2 819 3,003
CGPF + water
treatment facility
construction
220 9,900 36,300
Construction
camp sites
construction
25 1,125 4,125
a As advised by Arrow.
b Table 2.5, AGO (2000).
c Assuming 50% of biomass is carbon.
d Pacific Environment’s estimation – based on the emission factor listed in Table A.8.
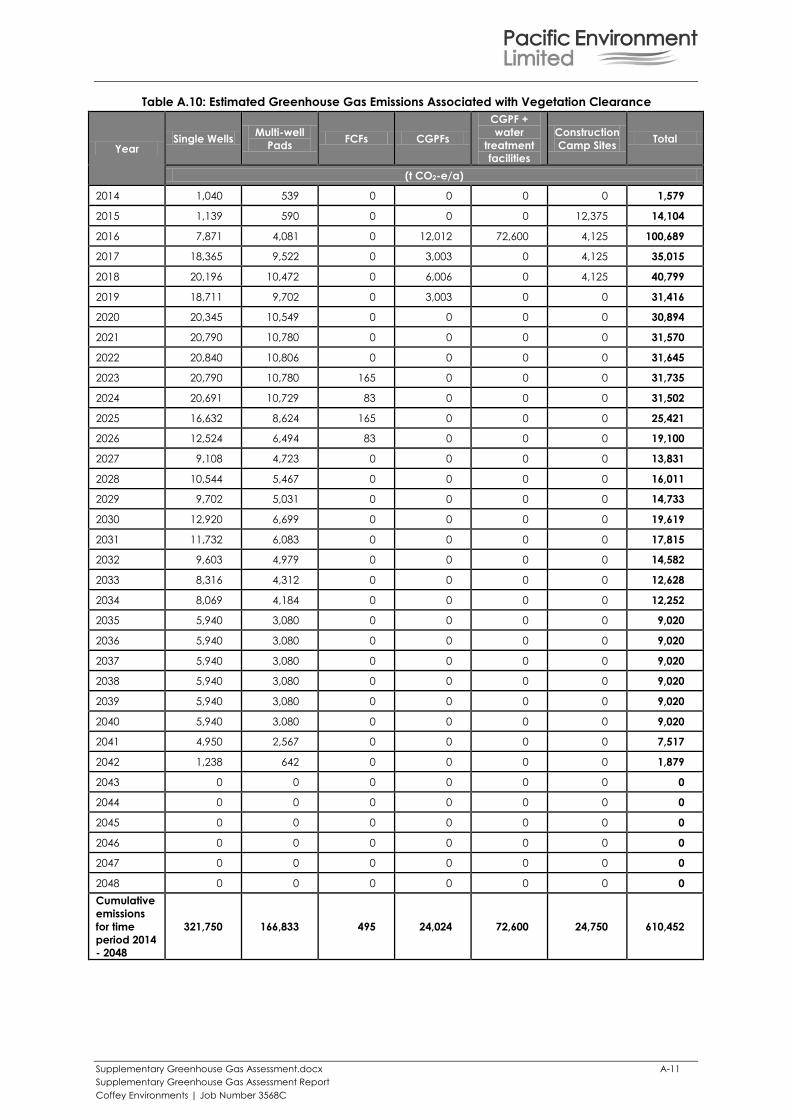
Supplementary Greenhouse Gas Assessment.docx A-11
Supplementary Greenhouse Gas Assessment Report
Coffey Environments | Job Number 3568C
Table A.10: Estimated Greenhouse Gas Emissions Associated with Vegetation Clearance
Year Single Wells
Multi-well
Pads FCFs CGPFs
CGPF +
water
treatment
facilities
Construction
Camp Sites Total
(t CO2-e/a)
2014 1,040 539 0 0 0 0 1,579
2015 1,139 590 0 0 0 12,375 14,104
2016 7,871 4,081 0 12,012 72,600 4,125 100,689
2017 18,365 9,522 0 3,003 0 4,125 35,015
2018 20,196 10,472 0 6,006 0 4,125 40,799
2019 18,711 9,702 0 3,003 0 0 31,416
2020 20,345 10,549 0 0 0 0 30,894
2021 20,790 10,780 0 0 0 0 31,570
2022 20,840 10,806 0 0 0 0 31,645
2023 20,790 10,780 165 0 0 0 31,735
2024 20,691 10,729 83 0 0 0 31,502
2025 16,632 8,624 165 0 0 0 25,421
2026 12,524 6,494 83 0 0 0 19,100
2027 9,108 4,723 0 0 0 0 13,831
2028 10,544 5,467 0 0 0 0 16,011
2029 9,702 5,031 0 0 0 0 14,733
2030 12,920 6,699 0 0 0 0 19,619
2031 11,732 6,083 0 0 0 0 17,815
2032 9,603 4,979 0 0 0 0 14,582
2033 8,316 4,312 0 0 0 0 12,628
2034 8,069 4,184 0 0 0 0 12,252
2035 5,940 3,080 0 0 0 0 9,020
2036 5,940 3,080 0 0 0 0 9,020
2037 5,940 3,080 0 0 0 0 9,020
2038 5,940 3,080 0 0 0 0 9,020
2039 5,940 3,080 0 0 0 0 9,020
2040 5,940 3,080 0 0 0 0 9,020
2041 4,950 2,567 0 0 0 0 7,517
2042 1,238 642 0 0 0 0 1,879
2043 0 0 0 0 0 0 0
2044 0 0 0 0 0 0 0
2045 0 0 0 0 0 0 0
2046 0 0 0 0 0 0 0
2047 0 0 0 0 0 0 0
2048 0 0 0 0 0 0 0
Cumulative
emissions
for time
period 2014
- 2048
321,750 166,833 495 24,024 72,600 24,750 610,452
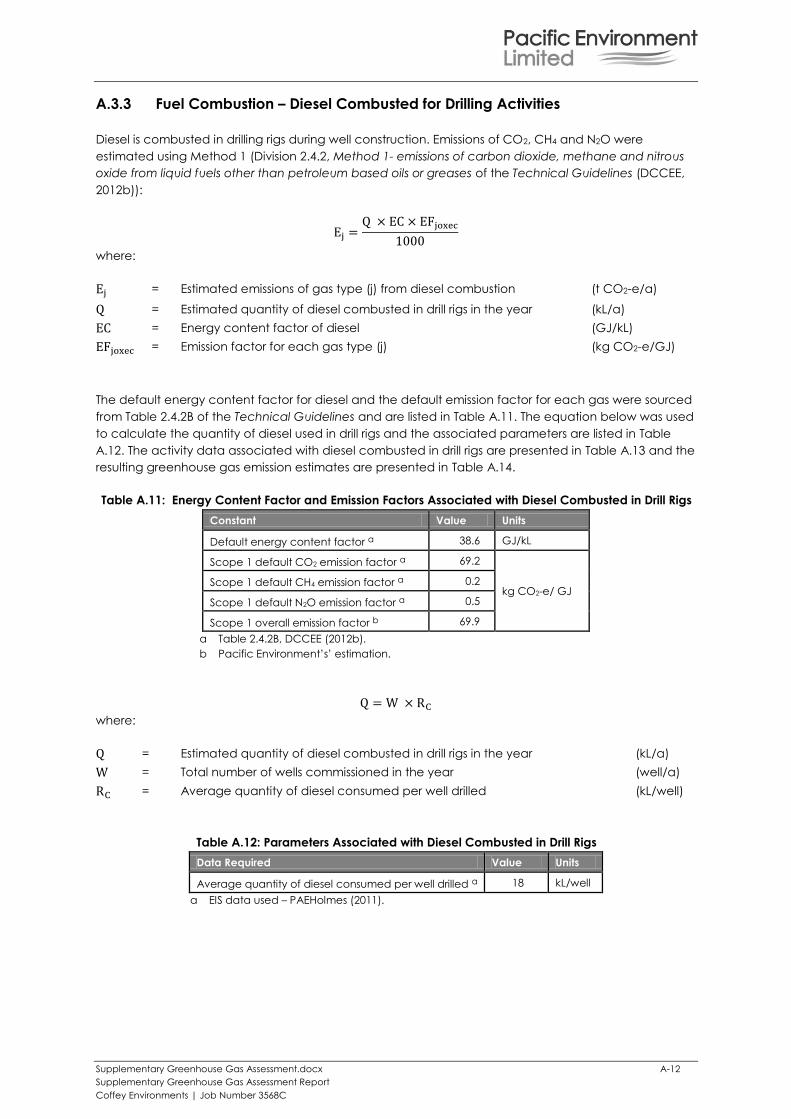
Supplementary Greenhouse Gas Assessment.docx A-12
Supplementary Greenhouse Gas Assessment Report
Coffey Environments | Job Number 3568C
A.3.3 Fuel Combustion – Diesel Combusted for Drilling Activities
Diesel is combusted in drilling rigs during well construction. Emissions of CO2, CH4 and N2O were
estimated using Method 1 (Division 2.4.2, Method 1- emissions of carbon dioxide, methane and nitrous
oxide from liquid fuels other than petroleum based oils or greases of the Technical Guidelines (DCCEE,
2012b)):
where:
= Estimated emissions of gas type (j) from diesel combustion (t CO2-e/a)
= Estimated quantity of diesel combusted in drill rigs in the year (kL/a)
= Energy content factor of diesel (GJ/kL)
= Emission factor for each gas type (j) (kg CO2-e/GJ)
The default energy content factor for diesel and the default emission factor for each gas were sourced
from Table 2.4.2B of the Technical Guidelines and are listed in Table A.11. The equation below was used
to calculate the quantity of diesel used in drill rigs and the associated parameters are listed in Table
A.12. The activity data associated with diesel combusted in drill rigs are presented in Table A.13 and the
resulting greenhouse gas emission estimates are presented in Table A.14.
Table A.11: Energy Content Factor and Emission Factors Associated with Diesel Combusted in Drill Rigs
Constant Value Units
Default energy content factor a 38.6 GJ/kL
Scope 1 default CO2 emission factor a 69.2
kg CO2-e/ GJ Scope 1 default CH4 emission factor a 0.2
Scope 1 default N2O emission factor a 0.5
Scope 1 overall emission factor b 69.9
a Table 2.4.2B, DCCEE (2012b).
b Pacific Environment’s’ estimation.
where:
= Estimated quantity of diesel combusted in drill rigs in the year (kL/a)
= Total number of wells commissioned in the year (well/a)
= Average quantity of diesel consumed per well drilled (kL/well)
Table A.12: Parameters Associated with Diesel Combusted in Drill Rigs
Data Required Value Units
Average quantity of diesel consumed per well drilled a 18 kL/well
a EIS data used – PAEHolmes (2011).
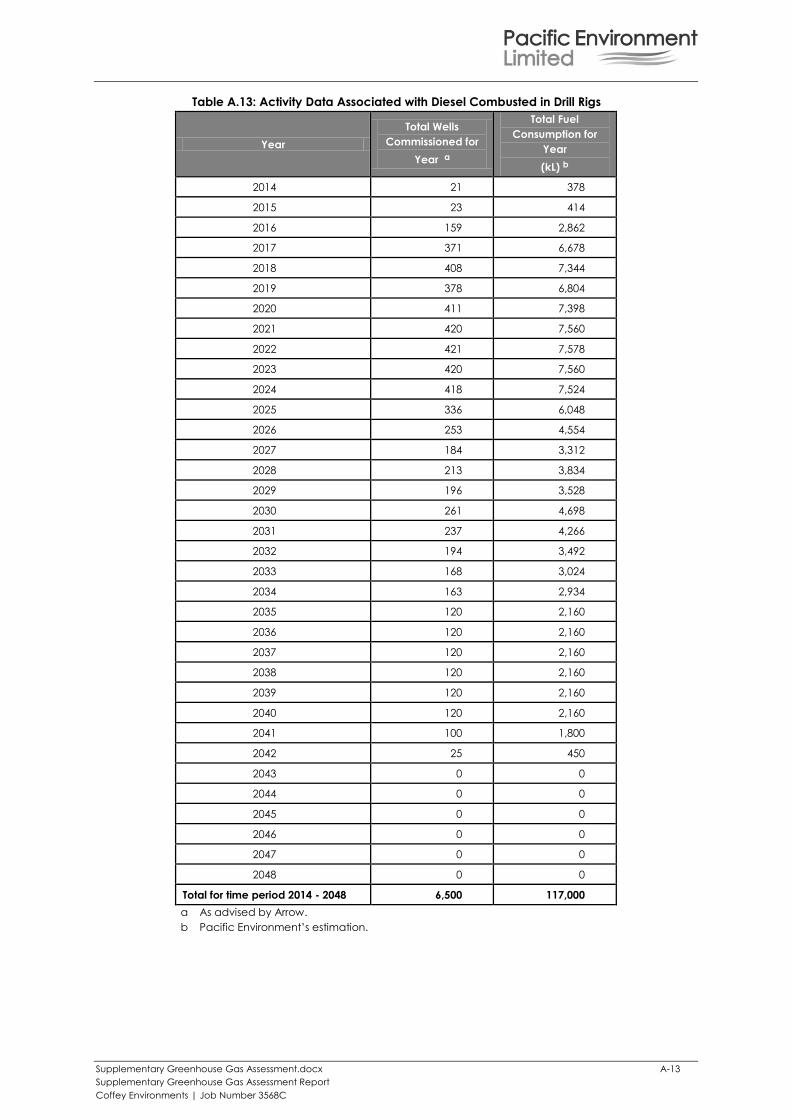
Supplementary Greenhouse Gas Assessment.docx A-13
Supplementary Greenhouse Gas Assessment Report
Coffey Environments | Job Number 3568C
Table A.13: Activity Data Associated with Diesel Combusted in Drill Rigs
Year
Total Wells
Commissioned for
Year a
Total Fuel
Consumption for
Year
(kL) b
2014 21 378
2015 23 414
2016 159 2,862
2017 371 6,678
2018 408 7,344
2019 378 6,804
2020 411 7,398
2021 420 7,560
2022 421 7,578
2023 420 7,560
2024 418 7,524
2025 336 6,048
2026 253 4,554
2027 184 3,312
2028 213 3,834
2029 196 3,528
2030 261 4,698
2031 237 4,266
2032 194 3,492
2033 168 3,024
2034 163 2,934
2035 120 2,160
2036 120 2,160
2037 120 2,160
2038 120 2,160
2039 120 2,160
2040 120 2,160
2041 100 1,800
2042 25 450
2043 0 0
2044 0 0
2045 0 0
2046 0 0
2047 0 0
2048 0 0
Total for time period 2014 - 2048 6,500 117,000
a As advised by Arrow.
b Pacific Environment’s estimation.
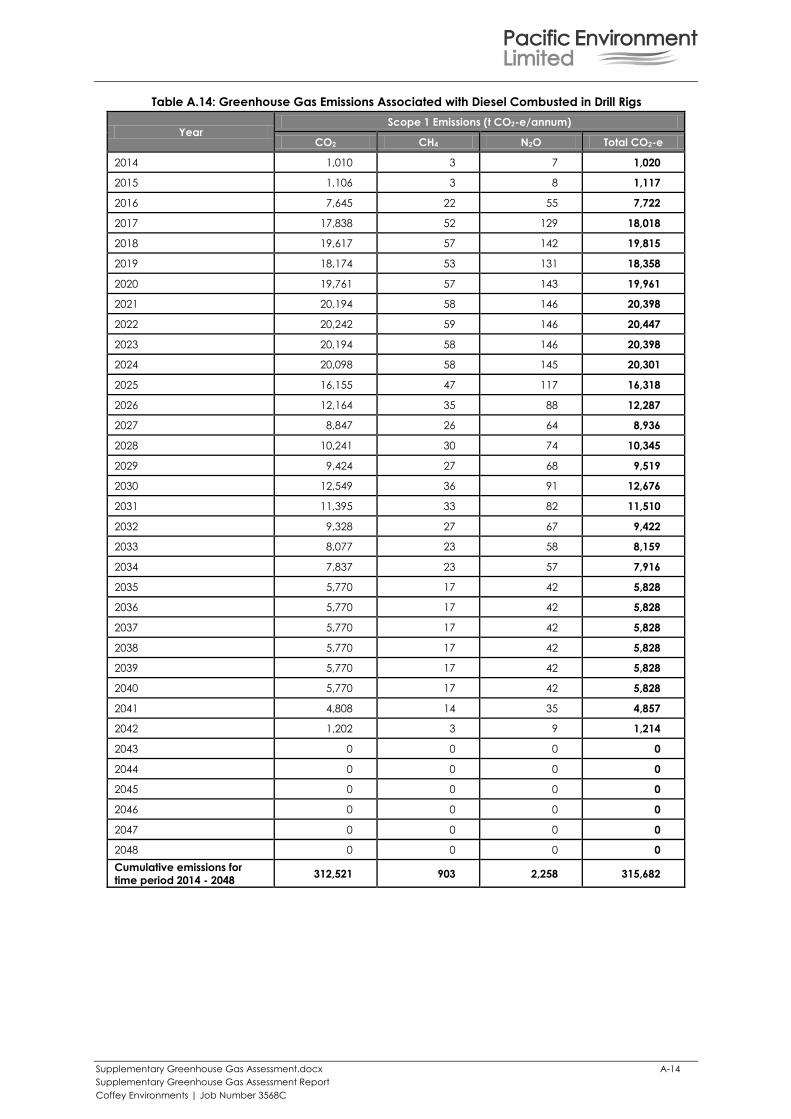
Supplementary Greenhouse Gas Assessment.docx A-14
Supplementary Greenhouse Gas Assessment Report
Coffey Environments | Job Number 3568C
Table A.14: Greenhouse Gas Emissions Associated with Diesel Combusted in Drill Rigs
Year Scope 1 Emissions (t CO2-e/annum)
CO2 CH4 N2O Total CO2-e
2014 1,010 3 7 1,020
2015 1,106 3 8 1,117
2016 7,645 22 55 7,722
2017 17,838 52 129 18,018
2018 19,617 57 142 19,815
2019 18,174 53 131 18,358
2020 19,761 57 143 19,961
2021 20,194 58 146 20,398
2022 20,242 59 146 20,447
2023 20,194 58 146 20,398
2024 20,098 58 145 20,301
2025 16,155 47 117 16,318
2026 12,164 35 88 12,287
2027 8,847 26 64 8,936
2028 10,241 30 74 10,345
2029 9,424 27 68 9,519
2030 12,549 36 91 12,676
2031 11,395 33 82 11,510
2032 9,328 27 67 9,422
2033 8,077 23 58 8,159
2034 7,837 23 57 7,916
2035 5,770 17 42 5,828
2036 5,770 17 42 5,828
2037 5,770 17 42 5,828
2038 5,770 17 42 5,828
2039 5,770 17 42 5,828
2040 5,770 17 42 5,828
2041 4,808 14 35 4,857
2042 1,202 3 9 1,214
2043 0 0 0 0
2044 0 0 0 0
2045 0 0 0 0
2046 0 0 0 0
2047 0 0 0 0
2048 0 0 0 0
Cumulative emissions for
time period 2014 - 2048 312,521 903 2,258 315,682
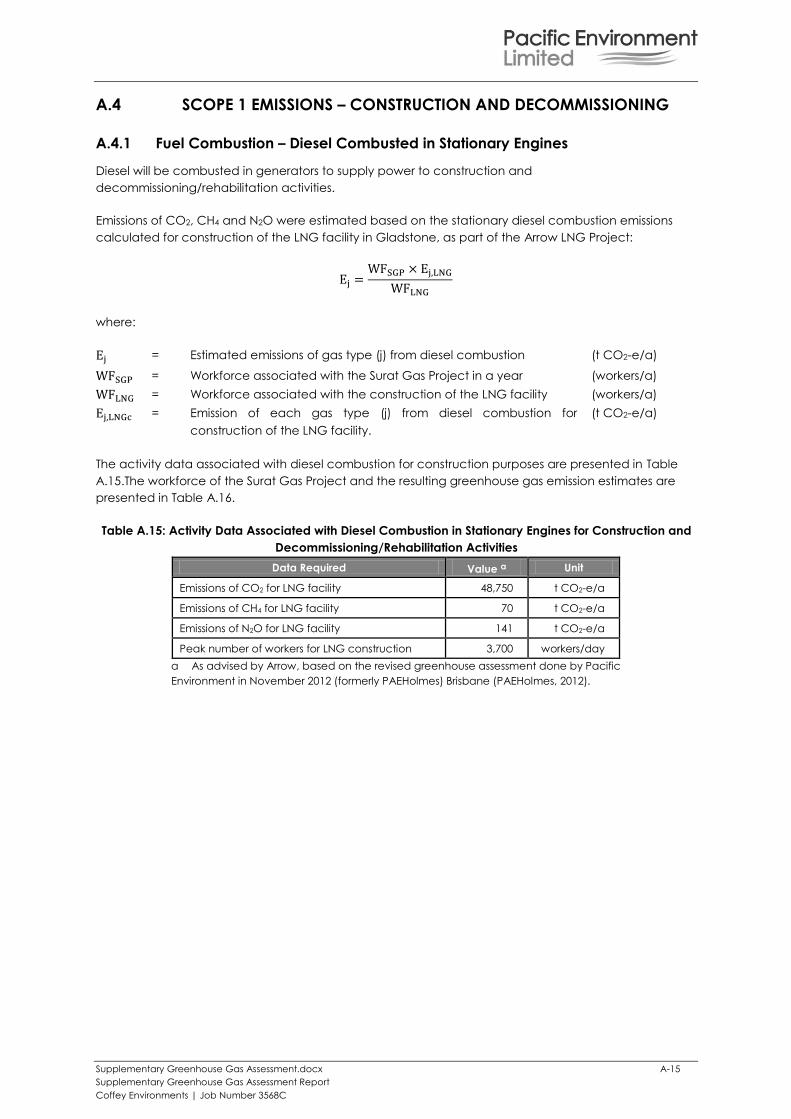
Supplementary Greenhouse Gas Assessment.docx A-15
Supplementary Greenhouse Gas Assessment Report
Coffey Environments | Job Number 3568C
A.4 SCOPE 1 EMISSIONS – CONSTRUCTION AND DECOMMISSIONING
A.4.1 Fuel Combustion – Diesel Combusted in Stationary Engines
Diesel will be combusted in generators to supply power to construction and
decommissioning/rehabilitation activities.
Emissions of CO2, CH4 and N2O were estimated based on the stationary diesel combustion emissions
calculated for construction of the LNG facility in Gladstone, as part of the Arrow LNG Project:
where:
= Estimated emissions of gas type (j) from diesel combustion (t CO2-e/a)
= Workforce associated with the Surat Gas Project in a year (workers/a)
= Workforce associated with the construction of the LNG facility (workers/a)
= Emission of each gas type (j) from diesel combustion for
construction of the LNG facility.
(t CO2-e/a)
The activity data associated with diesel combustion for construction purposes are presented in Table
A.15.The workforce of the Surat Gas Project and the resulting greenhouse gas emission estimates are
presented in Table A.16.
Table A.15: Activity Data Associated with Diesel Combustion in Stationary Engines for Construction and
Decommissioning/Rehabilitation Activities
Data Required Value a Unit
Emissions of CO2 for LNG facility 48,750 t CO2-e/a
Emissions of CH4 for LNG facility 70 t CO2-e/a
Emissions of N2O for LNG facility 141 t CO2-e/a
Peak number of workers for LNG construction 3,700 workers/day
a As advised by Arrow, based on the revised greenhouse assessment done by Pacific
Environment in November 2012 (formerly PAEHolmes) Brisbane (PAEHolmes, 2012).
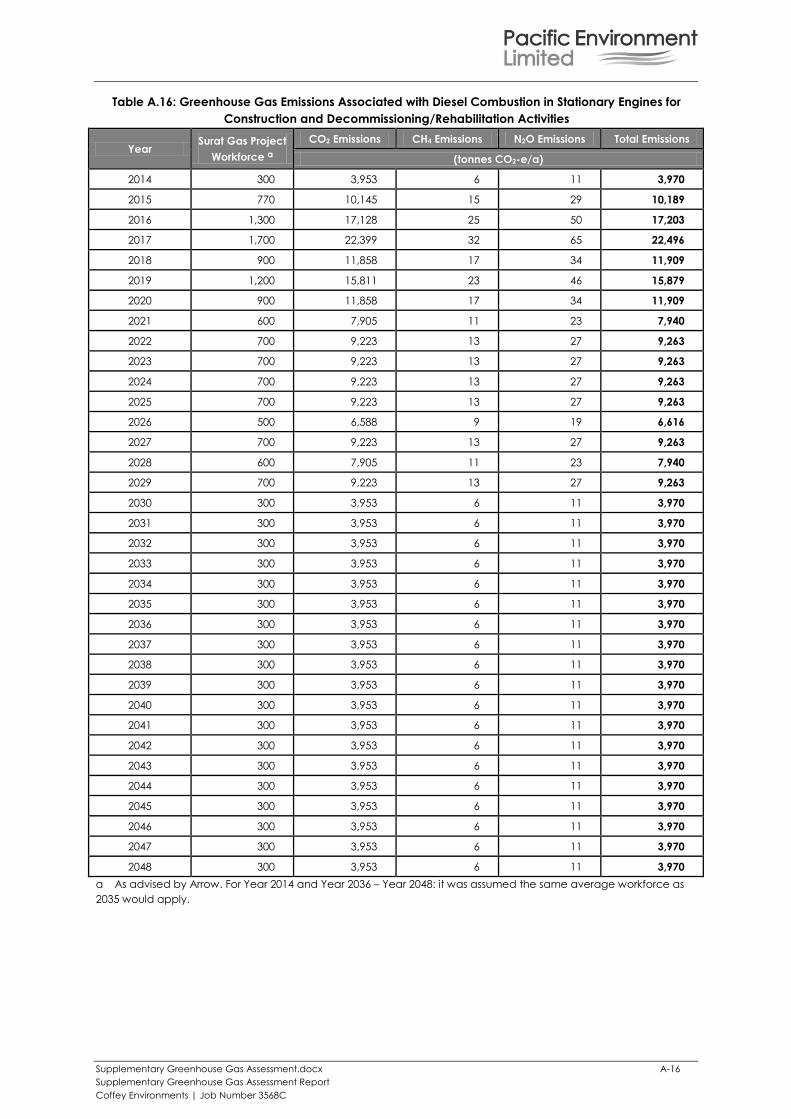
Supplementary Greenhouse Gas Assessment.docx A-16
Supplementary Greenhouse Gas Assessment Report
Coffey Environments | Job Number 3568C
Table A.16: Greenhouse Gas Emissions Associated with Diesel Combustion in Stationary Engines for
Construction and Decommissioning/Rehabilitation Activities
Year Surat Gas Project
Workforce a
CO2 Emissions CH4 Emissions N2O Emissions Total Emissions
(tonnes CO2-e/a)
2014 300 3,953 6 11 3,970
2015 770 10,145 15 29 10,189
2016 1,300 17,128 25 50 17,203
2017 1,700 22,399 32 65 22,496
2018 900 11,858 17 34 11,909
2019 1,200 15,811 23 46 15,879
2020 900 11,858 17 34 11,909
2021 600 7,905 11 23 7,940
2022 700 9,223 13 27 9,263
2023 700 9,223 13 27 9,263
2024 700 9,223 13 27 9,263
2025 700 9,223 13 27 9,263
2026 500 6,588 9 19 6,616
2027 700 9,223 13 27 9,263
2028 600 7,905 11 23 7,940
2029 700 9,223 13 27 9,263
2030 300 3,953 6 11 3,970
2031 300 3,953 6 11 3,970
2032 300 3,953 6 11 3,970
2033 300 3,953 6 11 3,970
2034 300 3,953 6 11 3,970
2035 300 3,953 6 11 3,970
2036 300 3,953 6 11 3,970
2037 300 3,953 6 11 3,970
2038 300 3,953 6 11 3,970
2039 300 3,953 6 11 3,970
2040 300 3,953 6 11 3,970
2041 300 3,953 6 11 3,970
2042 300 3,953 6 11 3,970
2043 300 3,953 6 11 3,970
2044 300 3,953 6 11 3,970
2045 300 3,953 6 11 3,970
2046 300 3,953 6 11 3,970
2047 300 3,953 6 11 3,970
2048 300 3,953 6 11 3,970
a As advised by Arrow. For Year 2014 and Year 2036 – Year 2048: it was assumed the same average workforce as
2035 would apply.
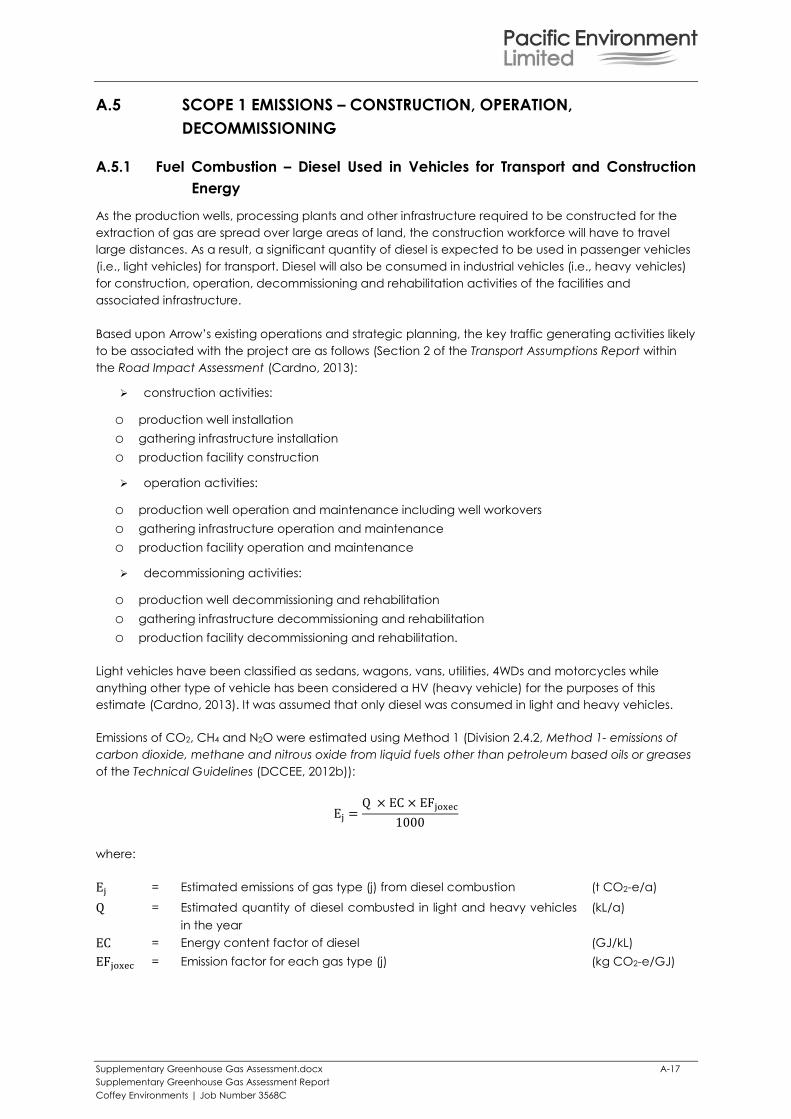
Supplementary Greenhouse Gas Assessment.docx A-17
Supplementary Greenhouse Gas Assessment Report
Coffey Environments | Job Number 3568C
A.5 SCOPE 1 EMISSIONS – CONSTRUCTION, OPERATION,
DECOMMISSIONING
A.5.1 Fuel Combustion – Diesel Used in Vehicles for Transport and Construction
Energy
As the production wells, processing plants and other infrastructure required to be constructed for the
extraction of gas are spread over large areas of land, the construction workforce will have to travel
large distances. As a result, a significant quantity of diesel is expected to be used in passenger vehicles
(i.e., light vehicles) for transport. Diesel will also be consumed in industrial vehicles (i.e., heavy vehicles)
for construction, operation, decommissioning and rehabilitation activities of the facilities and
associated infrastructure.
Based upon Arrow’s existing operations and strategic planning, the key traffic generating activities likely
to be associated with the project are as follows (Section 2 of the Transport Assumptions Report within
the Road Impact Assessment (Cardno, 2013):
construction activities:
o production well installation
o gathering infrastructure installation
o production facility construction
operation activities:
o production well operation and maintenance including well workovers
o gathering infrastructure operation and maintenance
o production facility operation and maintenance
decommissioning activities:
o production well decommissioning and rehabilitation
o gathering infrastructure decommissioning and rehabilitation
o production facility decommissioning and rehabilitation.
Light vehicles have been classified as sedans, wagons, vans, utilities, 4WDs and motorcycles while
anything other type of vehicle has been considered a HV (heavy vehicle) for the purposes of this
estimate (Cardno, 2013). It was assumed that only diesel was consumed in light and heavy vehicles.
Emissions of CO2, CH4 and N2O were estimated using Method 1 (Division 2.4.2, Method 1- emissions of
carbon dioxide, methane and nitrous oxide from liquid fuels other than petroleum based oils or greases
of the Technical Guidelines (DCCEE, 2012b)):
where:
= Estimated emissions of gas type (j) from diesel combustion (t CO2-e/a)
= Estimated quantity of diesel combusted in light and heavy vehicles
in the year
(kL/a)
= Energy content factor of diesel (GJ/kL)
= Emission factor for each gas type (j) (kg CO2-e/GJ)
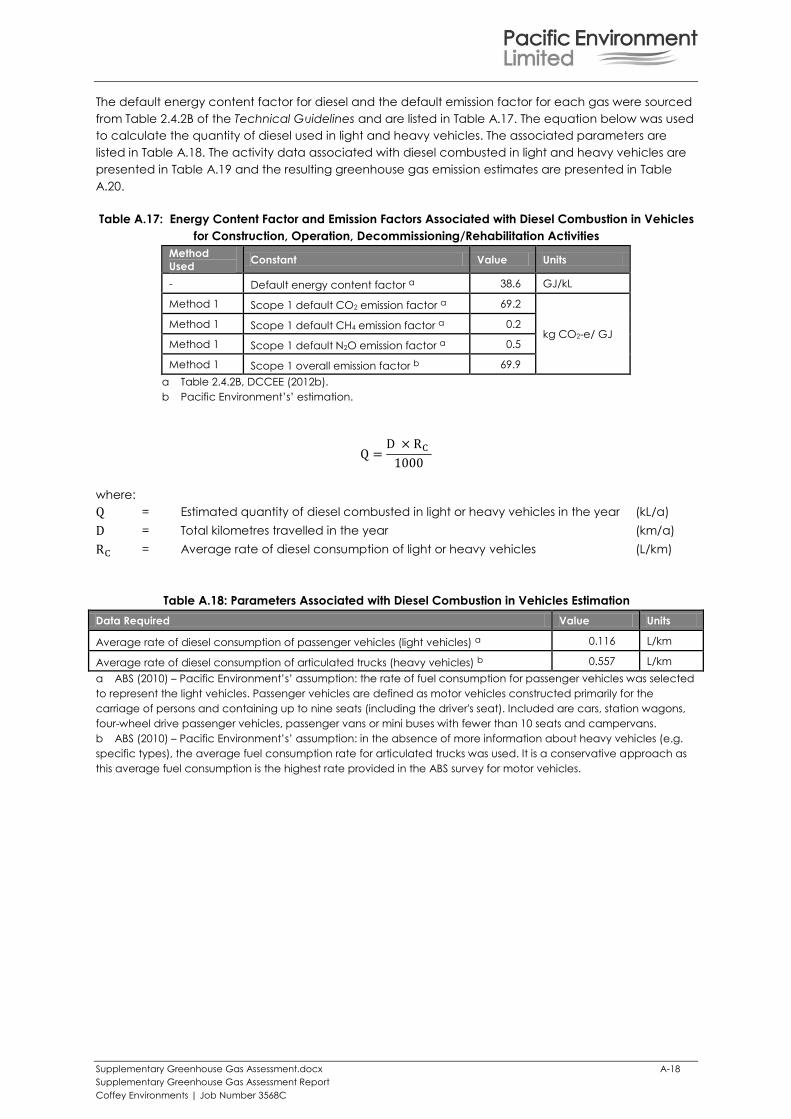
Supplementary Greenhouse Gas Assessment.docx A-18
Supplementary Greenhouse Gas Assessment Report
Coffey Environments | Job Number 3568C
The default energy content factor for diesel and the default emission factor for each gas were sourced
from Table 2.4.2B of the Technical Guidelines and are listed in Table A.17. The equation below was used
to calculate the quantity of diesel used in light and heavy vehicles. The associated parameters are
listed in Table A.18. The activity data associated with diesel combusted in light and heavy vehicles are
presented in Table A.19 and the resulting greenhouse gas emission estimates are presented in Table
A.20.
Table A.17: Energy Content Factor and Emission Factors Associated with Diesel Combustion in Vehicles
for Construction, Operation, Decommissioning/Rehabilitation Activities
Method
Used Constant Value Units
- Default energy content factor a 38.6 GJ/kL
Method 1 Scope 1 default CO2 emission factor a 69.2
kg CO2-e/ GJ Method 1 Scope 1 default CH4 emission factor a 0.2
Method 1 Scope 1 default N2O emission factor a 0.5
Method 1 Scope 1 overall emission factor b 69.9
a Table 2.4.2B, DCCEE (2012b).
b Pacific Environment’s’ estimation.
where:
= Estimated quantity of diesel combusted in light or heavy vehicles in the year (kL/a)
= Total kilometres travelled in the year (km/a)
= Average rate of diesel consumption of light or heavy vehicles (L/km)
Table A.18: Parameters Associated with Diesel Combustion in Vehicles Estimation
Data Required Value Units
Average rate of diesel consumption of passenger vehicles (light vehicles) a 0.116 L/km
Average rate of diesel consumption of articulated trucks (heavy vehicles) b 0.557 L/km
a ABS (2010) – Pacific Environment’s’ assumption: the rate of fuel consumption for passenger vehicles was selected
to represent the light vehicles. Passenger vehicles are defined as motor vehicles constructed primarily for the
carriage of persons and containing up to nine seats (including the driver's seat). Included are cars, station wagons,
four-wheel drive passenger vehicles, passenger vans or mini buses with fewer than 10 seats and campervans.
b ABS (2010) – Pacific Environment’s’ assumption: in the absence of more information about heavy vehicles (e.g.
specific types), the average fuel consumption rate for articulated trucks was used. It is a conservative approach as
this average fuel consumption is the highest rate provided in the ABS survey for motor vehicles.
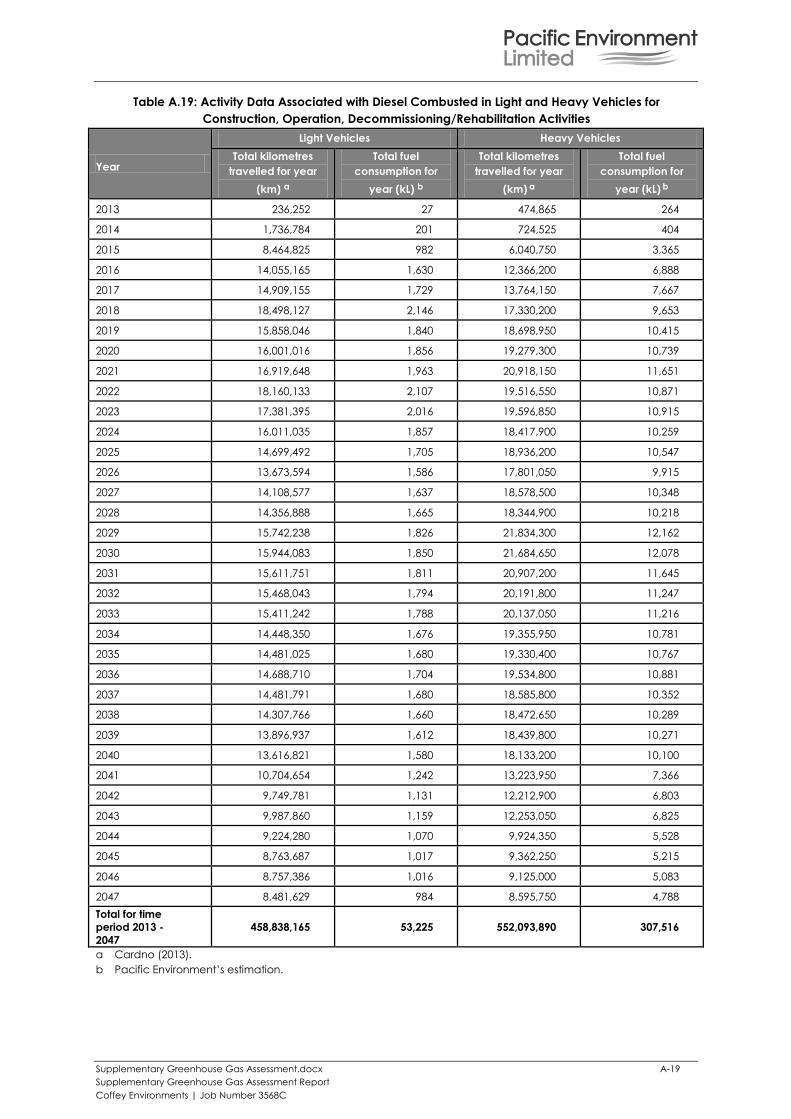
Supplementary Greenhouse Gas Assessment.docx A-19
Supplementary Greenhouse Gas Assessment Report
Coffey Environments | Job Number 3568C
Table A.19: Activity Data Associated with Diesel Combusted in Light and Heavy Vehicles for
Construction, Operation, Decommissioning/Rehabilitation Activities
Year
Light Vehicles Heavy Vehicles
Total kilometres
travelled for year
(km) a
Total fuel
consumption for
year (kL) b
Total kilometres
travelled for year
(km) a
Total fuel
consumption for
year (kL) b
2013 236,252 27 474,865 264
2014 1,736,784 201 724,525 404
2015 8,464,825 982 6,040,750 3,365
2016 14,055,165 1,630 12,366,200 6,888
2017 14,909,155 1,729 13,764,150 7,667
2018 18,498,127 2,146 17,330,200 9,653
2019 15,858,046 1,840 18,698,950 10,415
2020 16,001,016 1,856 19,279,300 10,739
2021 16,919,648 1,963 20,918,150 11,651
2022 18,160,133 2,107 19,516,550 10,871
2023 17,381,395 2,016 19,596,850 10,915
2024 16,011,035 1,857 18,417,900 10,259
2025 14,699,492 1,705 18,936,200 10,547
2026 13,673,594 1,586 17,801,050 9,915
2027 14,108,577 1,637 18,578,500 10,348
2028 14,356,888 1,665 18,344,900 10,218
2029 15,742,238 1,826 21,834,300 12,162
2030 15,944,083 1,850 21,684,650 12,078
2031 15,611,751 1,811 20,907,200 11,645
2032 15,468,043 1,794 20,191,800 11,247
2033 15,411,242 1,788 20,137,050 11,216
2034 14,448,350 1,676 19,355,950 10,781
2035 14,481,025 1,680 19,330,400 10,767
2036 14,688,710 1,704 19,534,800 10,881
2037 14,481,791 1,680 18,585,800 10,352
2038 14,307,766 1,660 18,472,650 10,289
2039 13,896,937 1,612 18,439,800 10,271
2040 13,616,821 1,580 18,133,200 10,100
2041 10,704,654 1,242 13,223,950 7,366
2042 9,749,781 1,131 12,212,900 6,803
2043 9,987,860 1,159 12,253,050 6,825
2044 9,224,280 1,070 9,924,350 5,528
2045 8,763,687 1,017 9,362,250 5,215
2046 8,757,386 1,016 9,125,000 5,083
2047 8,481,629 984 8,595,750 4,788
Total for time
period 2013 -
2047
458,838,165 53,225 552,093,890 307,516
a Cardno (2013).
b Pacific Environment’s estimation.
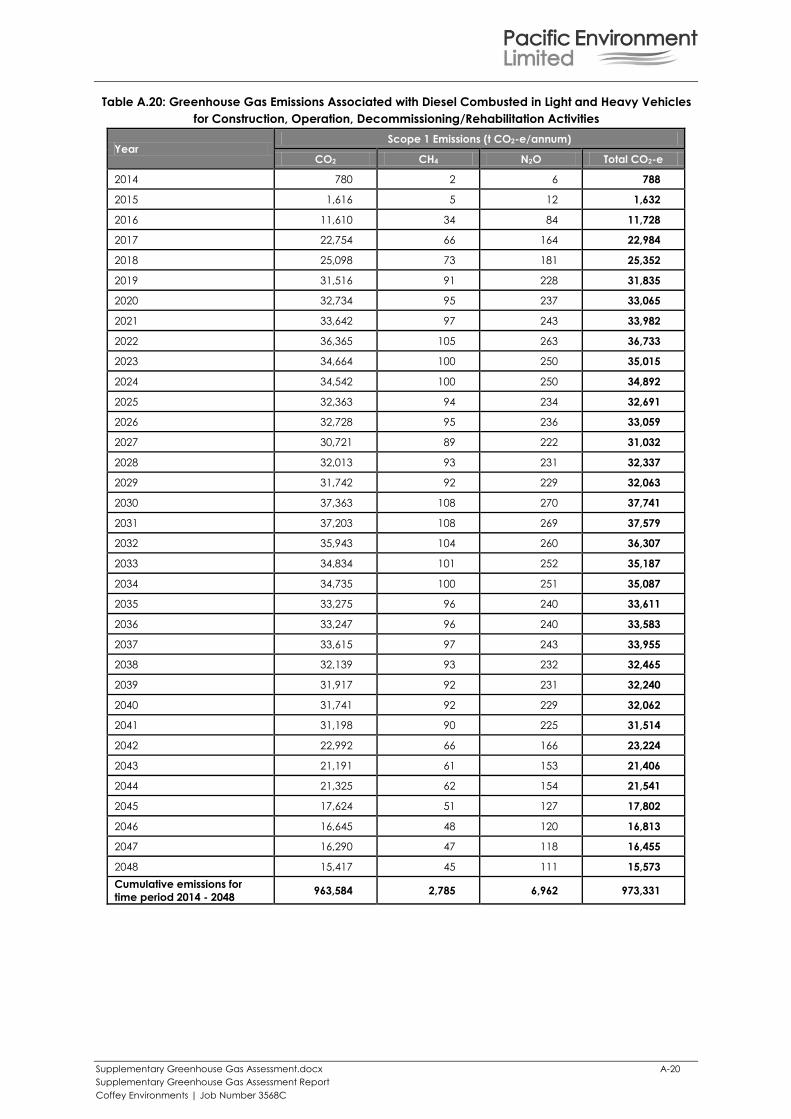
Supplementary Greenhouse Gas Assessment.docx A-20
Supplementary Greenhouse Gas Assessment Report
Coffey Environments | Job Number 3568C
Table A.20: Greenhouse Gas Emissions Associated with Diesel Combusted in Light and Heavy Vehicles
for Construction, Operation, Decommissioning/Rehabilitation Activities
Year Scope 1 Emissions (t CO2-e/annum)
CO2 CH4 N2O Total CO2-e
2014 780 2 6 788
2015 1,616 5 12 1,632
2016 11,610 34 84 11,728
2017 22,754 66 164 22,984
2018 25,098 73 181 25,352
2019 31,516 91 228 31,835
2020 32,734 95 237 33,065
2021 33,642 97 243 33,982
2022 36,365 105 263 36,733
2023 34,664 100 250 35,015
2024 34,542 100 250 34,892
2025 32,363 94 234 32,691
2026 32,728 95 236 33,059
2027 30,721 89 222 31,032
2028 32,013 93 231 32,337
2029 31,742 92 229 32,063
2030 37,363 108 270 37,741
2031 37,203 108 269 37,579
2032 35,943 104 260 36,307
2033 34,834 101 252 35,187
2034 34,735 100 251 35,087
2035 33,275 96 240 33,611
2036 33,247 96 240 33,583
2037 33,615 97 243 33,955
2038 32,139 93 232 32,465
2039 31,917 92 231 32,240
2040 31,741 92 229 32,062
2041 31,198 90 225 31,514
2042 22,992 66 166 23,224
2043 21,191 61 153 21,406
2044 21,325 62 154 21,541
2045 17,624 51 127 17,802
2046 16,645 48 120 16,813
2047 16,290 47 118 16,455
2048 15,417 45 111 15,573
Cumulative emissions for
time period 2014 - 2048 963,584 2,785 6,962 973,331
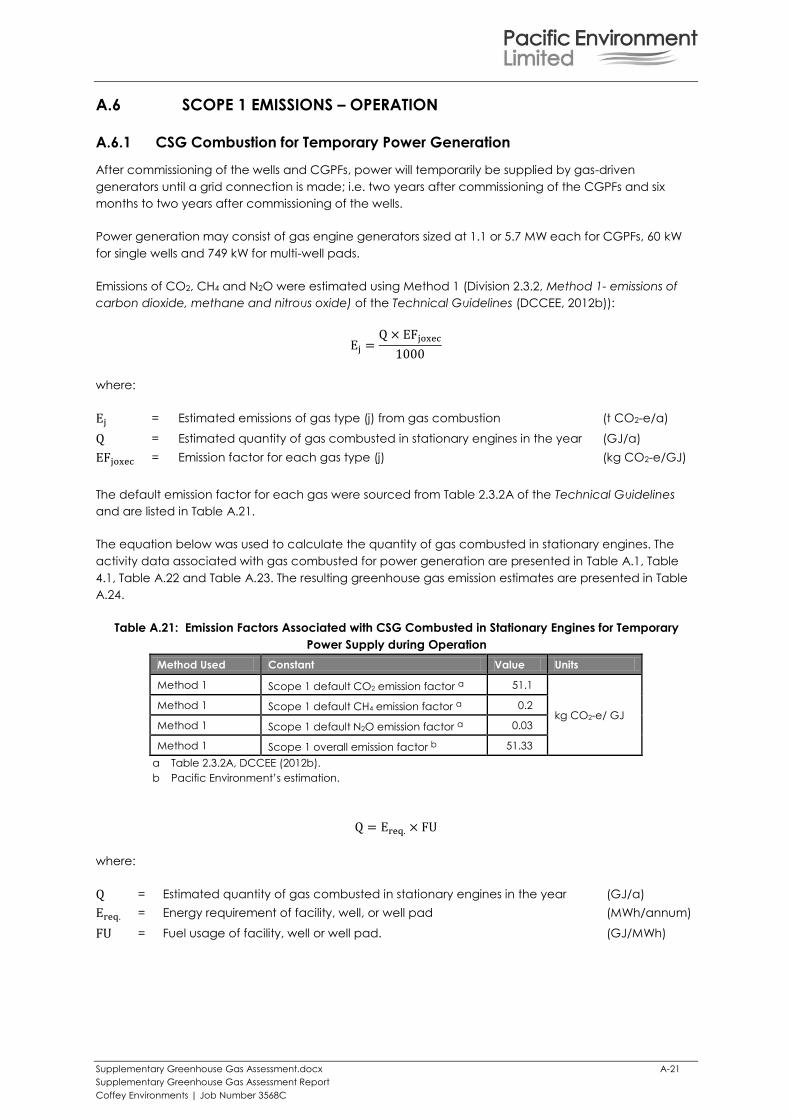
Supplementary Greenhouse Gas Assessment.docx A-21
Supplementary Greenhouse Gas Assessment Report
Coffey Environments | Job Number 3568C
A.6 SCOPE 1 EMISSIONS – OPERATION
A.6.1 CSG Combustion for Temporary Power Generation
After commissioning of the wells and CGPFs, power will temporarily be supplied by gas-driven
generators until a grid connection is made; i.e. two years after commissioning of the CGPFs and six
months to two years after commissioning of the wells.
Power generation may consist of gas engine generators sized at 1.1 or 5.7 MW each for CGPFs, 60 kW
for single wells and 749 kW for multi-well pads.
Emissions of CO2, CH4 and N2O were estimated using Method 1 (Division 2.3.2, Method 1- emissions of
carbon dioxide, methane and nitrous oxide) of the Technical Guidelines (DCCEE, 2012b)):
where:
= Estimated emissions of gas type (j) from gas combustion (t CO2-e/a)
= Estimated quantity of gas combusted in stationary engines in the year (GJ/a)
= Emission factor for each gas type (j) (kg CO2-e/GJ)
The default emission factor for each gas were sourced from Table 2.3.2A of the Technical Guidelines
and are listed in Table A.21.
The equation below was used to calculate the quantity of gas combusted in stationary engines. The
activity data associated with gas combusted for power generation are presented in Table A.1, Table
4.1, Table A.22 and Table A.23. The resulting greenhouse gas emission estimates are presented in Table
A.24.
Table A.21: Emission Factors Associated with CSG Combusted in Stationary Engines for Temporary
Power Supply during Operation
Method Used Constant Value Units
Method 1 Scope 1 default CO2 emission factor a 51.1
kg CO2-e/ GJ Method 1 Scope 1 default CH4 emission factor a 0.2
Method 1 Scope 1 default N2O emission factor a 0.03
Method 1 Scope 1 overall emission factor b 51.33
a Table 2.3.2A, DCCEE (2012b).
b Pacific Environment’s estimation.
where:
= Estimated quantity of gas combusted in stationary engines in the year (GJ/a)
= Energy requirement of facility, well, or well pad (MWh/annum)
= Fuel usage of facility, well or well pad. (GJ/MWh)
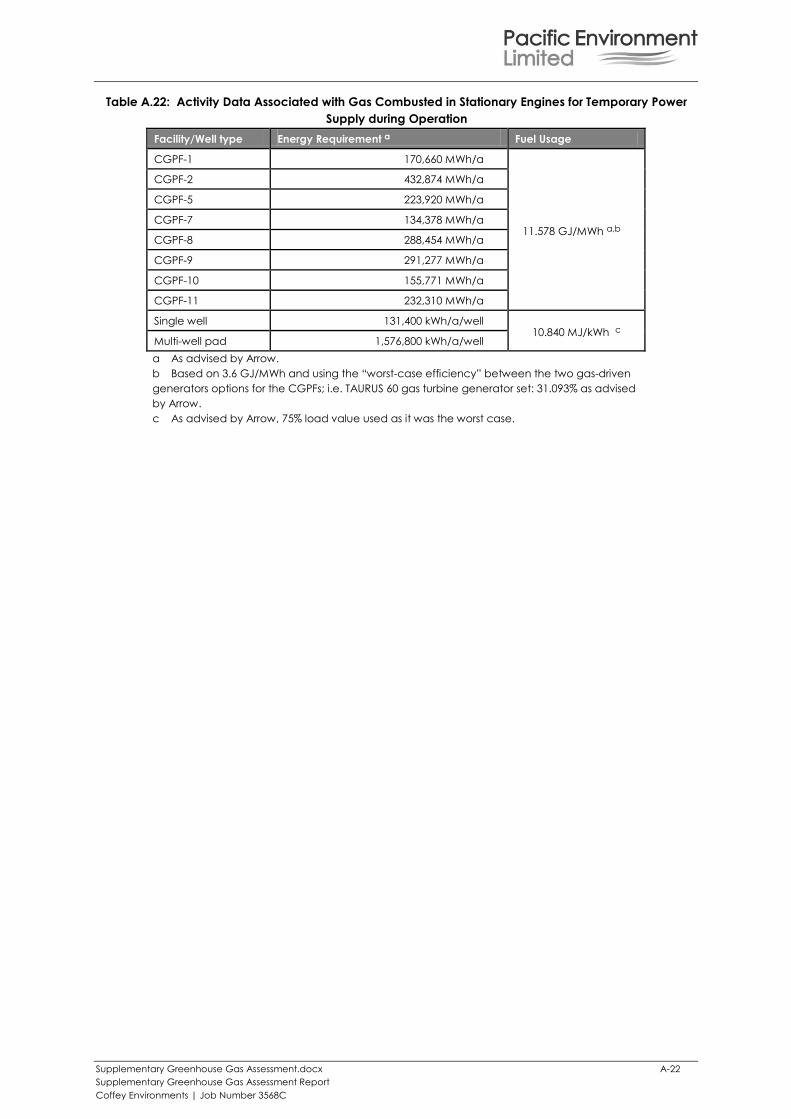
Supplementary Greenhouse Gas Assessment.docx A-22
Supplementary Greenhouse Gas Assessment Report
Coffey Environments | Job Number 3568C
Table A.22: Activity Data Associated with Gas Combusted in Stationary Engines for Temporary Power
Supply during Operation
Facility/Well type Energy Requirement a Fuel Usage
CGPF-1 170,660 MWh/a
11.578 GJ/MWh a,b
CGPF-2 432,874 MWh/a
CGPF-5 223,920 MWh/a
CGPF-7 134,378 MWh/a
CGPF-8 288,454 MWh/a
CGPF-9 291,277 MWh/a
CGPF-10 155,771 MWh/a
CGPF-11 232,310 MWh/a
Single well 131,400 kWh/a/well 10.840 MJ/kWh c
Multi-well pad 1,576,800 kWh/a/well
a As advised by Arrow.
b Based on 3.6 GJ/MWh and using the “worst-case efficiency” between the two gas-driven
generators options for the CGPFs; i.e. TAURUS 60 gas turbine generator set: 31.093% as advised
by Arrow.
c As advised by Arrow, 75% load value used as it was the worst case.
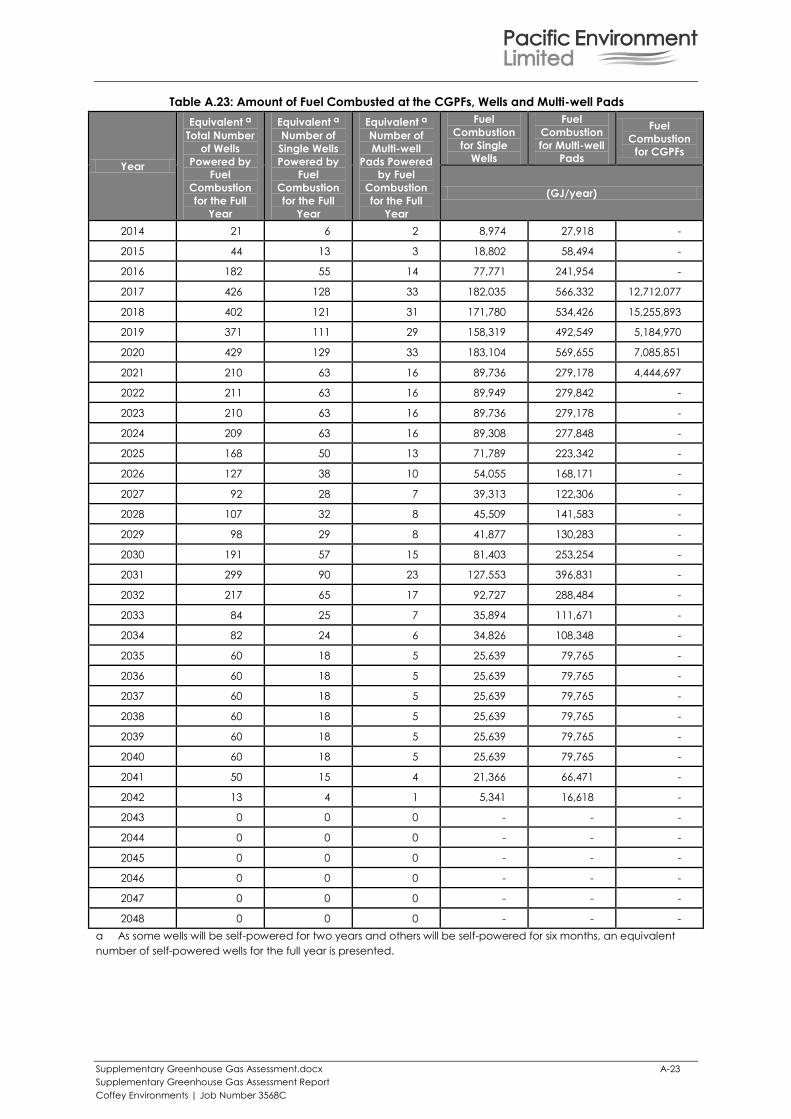
Supplementary Greenhouse Gas Assessment.docx A-23
Supplementary Greenhouse Gas Assessment Report
Coffey Environments | Job Number 3568C
Table A.23: Amount of Fuel Combusted at the CGPFs, Wells and Multi-well Pads
Year
Equivalent a
Total Number
of Wells
Powered by
Fuel
Combustion
for the Full
Year
Equivalent a
Number of
Single Wells
Powered by
Fuel
Combustion
for the Full
Year
Equivalent a
Number of
Multi-well
Pads Powered
by Fuel
Combustion
for the Full
Year
Fuel
Combustion
for Single
Wells
Fuel
Combustion
for Multi-well
Pads
Fuel
Combustion
for CGPFs
(GJ/year)
2014 21 6 2 8,974 27,918 -
2015 44 13 3 18,802 58,494 -
2016 182 55 14 77,771 241,954 -
2017 426 128 33 182,035 566,332 12,712,077
2018 402 121 31 171,780 534,426 15,255,893
2019 371 111 29 158,319 492,549 5,184,970
2020 429 129 33 183,104 569,655 7,085,851
2021 210 63 16 89,736 279,178 4,444,697
2022 211 63 16 89,949 279,842 -
2023 210 63 16 89,736 279,178 -
2024 209 63 16 89,308 277,848 -
2025 168 50 13 71,789 223,342 -
2026 127 38 10 54,055 168,171 -
2027 92 28 7 39,313 122,306 -
2028 107 32 8 45,509 141,583 -
2029 98 29 8 41,877 130,283 -
2030 191 57 15 81,403 253,254 -
2031 299 90 23 127,553 396,831 -
2032 217 65 17 92,727 288,484 -
2033 84 25 7 35,894 111,671 -
2034 82 24 6 34,826 108,348 -
2035 60 18 5 25,639 79,765 -
2036 60 18 5 25,639 79,765 -
2037 60 18 5 25,639 79,765 -
2038 60 18 5 25,639 79,765 -
2039 60 18 5 25,639 79,765 -
2040 60 18 5 25,639 79,765 -
2041 50 15 4 21,366 66,471 -
2042 13 4 1 5,341 16,618 -
2043 0 0 0 - - -
2044 0 0 0 - - -
2045 0 0 0 - - -
2046 0 0 0 - - -
2047 0 0 0 - - -
2048 0 0 0 - - -
a As some wells will be self-powered for two years and others will be self-powered for six months, an equivalent
number of self-powered wells for the full year is presented.
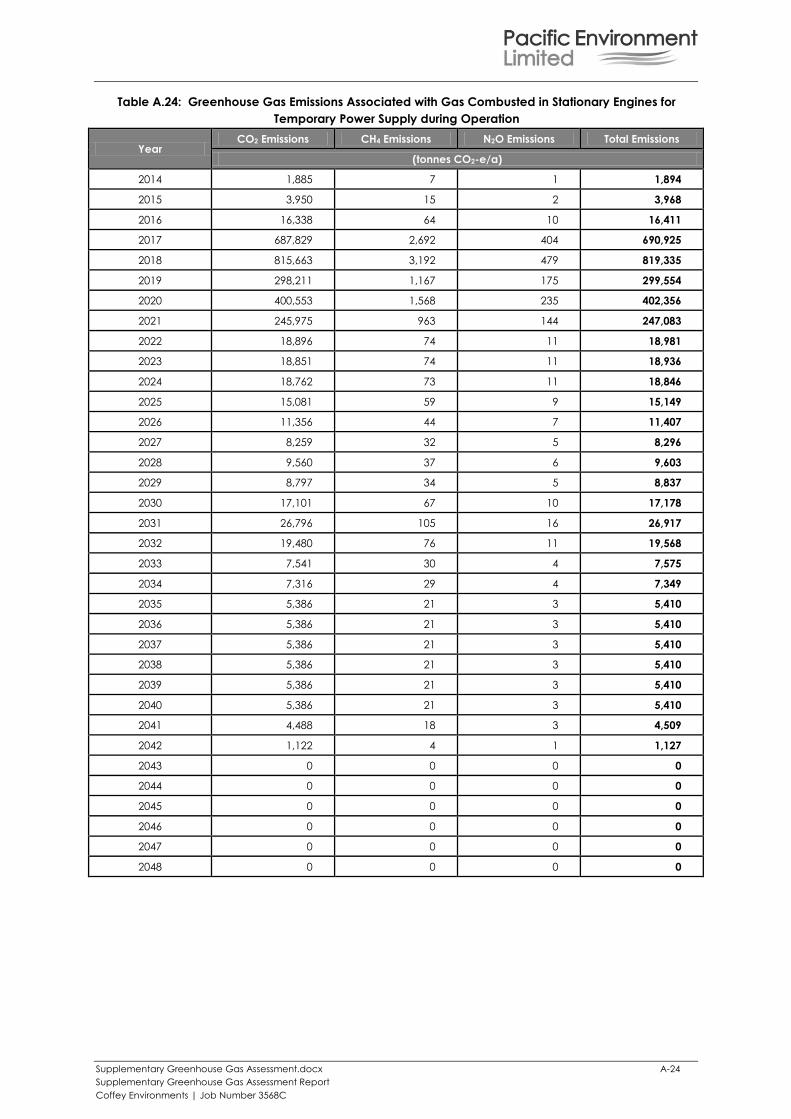
Supplementary Greenhouse Gas Assessment.docx A-24
Supplementary Greenhouse Gas Assessment Report
Coffey Environments | Job Number 3568C
Table A.24: Greenhouse Gas Emissions Associated with Gas Combusted in Stationary Engines for
Temporary Power Supply during Operation
Year CO2 Emissions CH4 Emissions N2O Emissions Total Emissions
(tonnes CO2-e/a)
2014 1,885 7 1 1,894
2015 3,950 15 2 3,968
2016 16,338 64 10 16,411
2017 687,829 2,692 404 690,925
2018 815,663 3,192 479 819,335
2019 298,211 1,167 175 299,554
2020 400,553 1,568 235 402,356
2021 245,975 963 144 247,083
2022 18,896 74 11 18,981
2023 18,851 74 11 18,936
2024 18,762 73 11 18,846
2025 15,081 59 9 15,149
2026 11,356 44 7 11,407
2027 8,259 32 5 8,296
2028 9,560 37 6 9,603
2029 8,797 34 5 8,837
2030 17,101 67 10 17,178
2031 26,796 105 16 26,917
2032 19,480 76 11 19,568
2033 7,541 30 4 7,575
2034 7,316 29 4 7,349
2035 5,386 21 3 5,410
2036 5,386 21 3 5,410
2037 5,386 21 3 5,410
2038 5,386 21 3 5,410
2039 5,386 21 3 5,410
2040 5,386 21 3 5,410
2041 4,488 18 3 4,509
2042 1,122 4 1 1,127
2043 0 0 0 0
2044 0 0 0 0
2045 0 0 0 0
2046 0 0 0 0
2047 0 0 0 0
2048 0 0 0 0
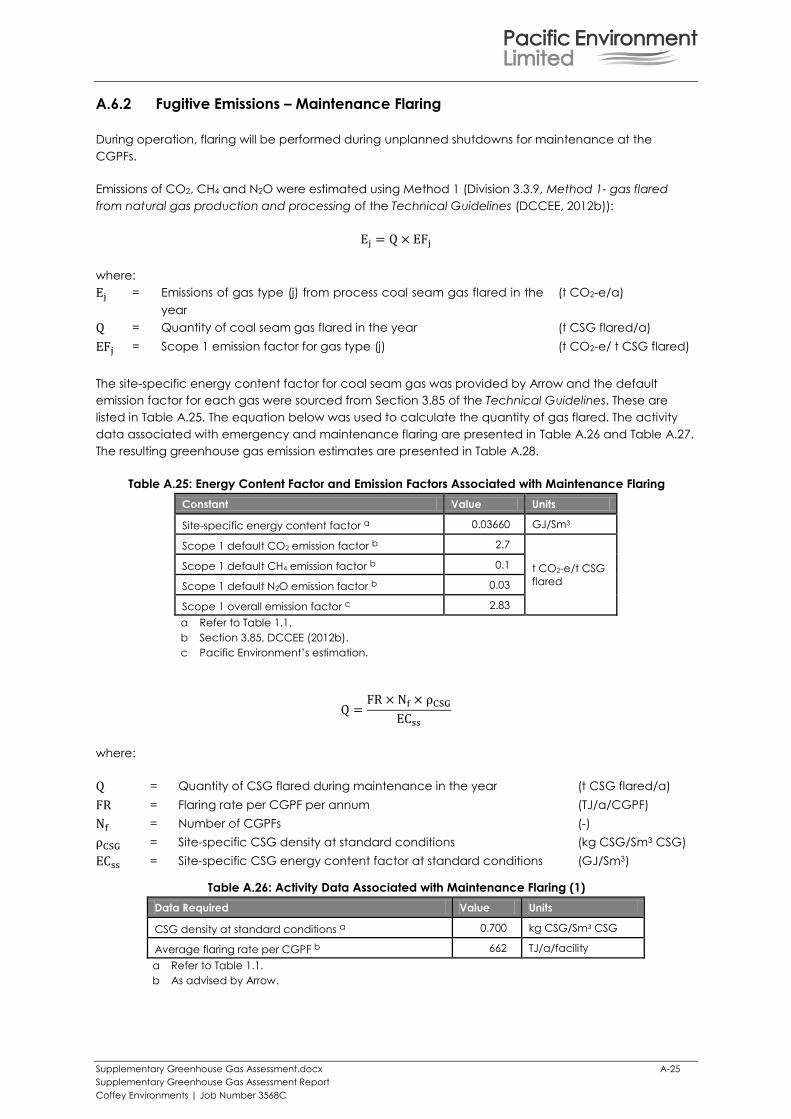
Supplementary Greenhouse Gas Assessment.docx A-25
Supplementary Greenhouse Gas Assessment Report
Coffey Environments | Job Number 3568C
A.6.2 Fugitive Emissions – Maintenance Flaring
During operation, flaring will be performed during unplanned shutdowns for maintenance at the
CGPFs.
Emissions of CO2, CH4 and N2O were estimated using Method 1 (Division 3.3.9, Method 1- gas flared
from natural gas production and processing of the Technical Guidelines (DCCEE, 2012b)):
where:
= Emissions of gas type (j) from process coal seam gas flared in the
year
(t CO2-e/a)
= Quantity of coal seam gas flared in the year (t CSG flared/a)
= Scope 1 emission factor for gas type (j) (t CO2-e/ t CSG flared)
The site-specific energy content factor for coal seam gas was provided by Arrow and the default
emission factor for each gas were sourced from Section 3.85 of the Technical Guidelines. These are
listed in Table A.25. The equation below was used to calculate the quantity of gas flared. The activity
data associated with emergency and maintenance flaring are presented in Table A.26 and Table A.27.
The resulting greenhouse gas emission estimates are presented in Table A.28.
Table A.25: Energy Content Factor and Emission Factors Associated with Maintenance Flaring
Constant Value Units
Site-specific energy content factor a 0.03660 GJ/Sm3
Scope 1 default CO2 emission factor b 2.7
t CO2-e/t CSG
flared
Scope 1 default CH4 emission factor b 0.1
Scope 1 default N2O emission factor b 0.03
Scope 1 overall emission factor c 2.83
a Refer to Table 1.1.
b Section 3.85, DCCEE (2012b).
c Pacific Environment’s estimation.
where:
= Quantity of CSG flared during maintenance in the year (t CSG flared/a)
= Flaring rate per CGPF per annum (TJ/a/CGPF)
= Number of CGPFs (-)
= Site-specific CSG density at standard conditions (kg CSG/Sm3 CSG)
= Site-specific CSG energy content factor at standard conditions (GJ/Sm3)
Table A.26: Activity Data Associated with Maintenance Flaring (1)
Data Required Value Units
CSG density at standard conditions a 0.700 kg CSG/Sm3 CSG
Average flaring rate per CGPF b 662 TJ/a/facility
a Refer to Table 1.1.
b As advised by Arrow.
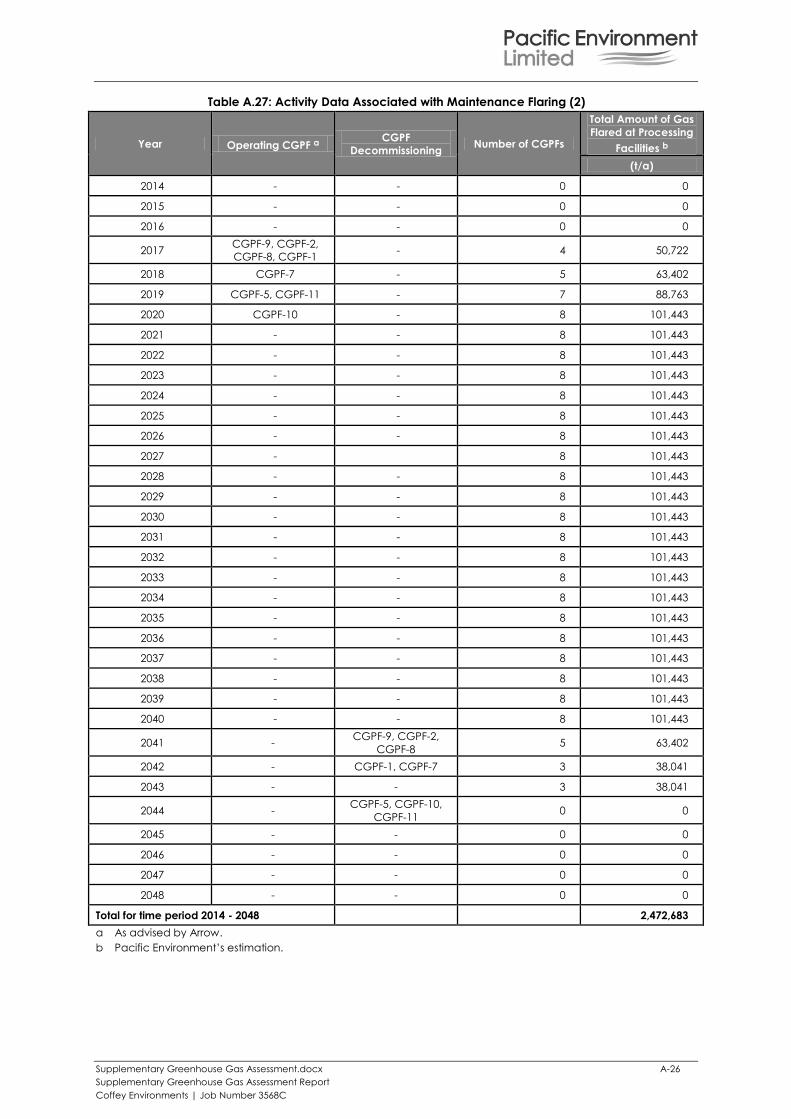
Supplementary Greenhouse Gas Assessment.docx A-26
Supplementary Greenhouse Gas Assessment Report
Coffey Environments | Job Number 3568C
Table A.27: Activity Data Associated with Maintenance Flaring (2)
Year Operating CGPF a CGPF
Decommissioning Number of CGPFs
Total Amount of Gas
Flared at Processing
Facilities b
(t/a)
2014 - - 0 0
2015 - - 0 0
2016 - - 0 0
2017 CGPF-9, CGPF-2,
CGPF-8, CGPF-1 - 4 50,722
2018 CGPF-7 - 5 63,402
2019 CGPF-5, CGPF-11 - 7 88,763
2020 CGPF-10 - 8 101,443
2021 - - 8 101,443
2022 - - 8 101,443
2023 - - 8 101,443
2024 - - 8 101,443
2025 - - 8 101,443
2026 - - 8 101,443
2027 - 8 101,443
2028 - - 8 101,443
2029 - - 8 101,443
2030 - - 8 101,443
2031 - - 8 101,443
2032 - - 8 101,443
2033 - - 8 101,443
2034 - - 8 101,443
2035 - - 8 101,443
2036 - - 8 101,443
2037 - - 8 101,443
2038 - - 8 101,443
2039 - - 8 101,443
2040 - - 8 101,443
2041 - CGPF-9, CGPF-2,
CGPF-8 5 63,402
2042 - CGPF-1, CGPF-7 3 38,041
2043 - - 3 38,041
2044 - CGPF-5, CGPF-10,
CGPF-11 0 0
2045 - - 0 0
2046 - - 0 0
2047 - - 0 0
2048 - - 0 0
Total for time period 2014 - 2048 2,472,683
a As advised by Arrow.
b Pacific Environment’s estimation.
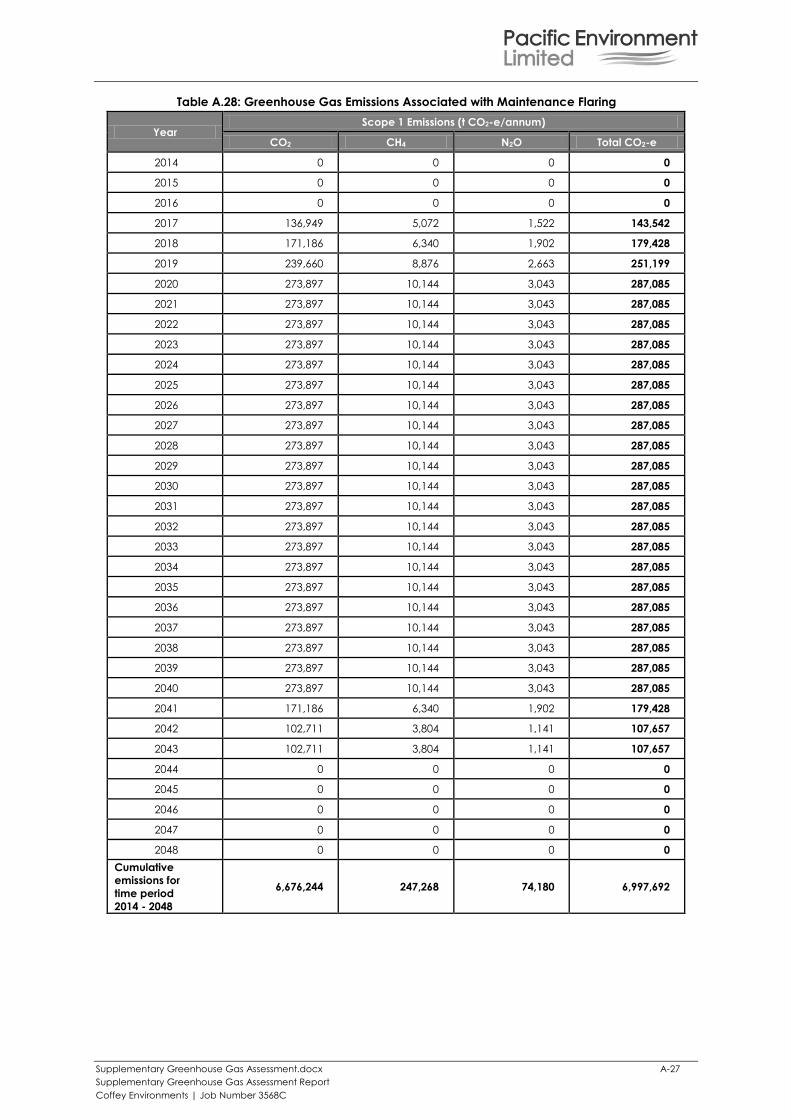
Supplementary Greenhouse Gas Assessment.docx A-27
Supplementary Greenhouse Gas Assessment Report
Coffey Environments | Job Number 3568C
Table A.28: Greenhouse Gas Emissions Associated with Maintenance Flaring
Year Scope 1 Emissions (t CO2-e/annum)
CO2 CH4 N2O Total CO2-e
2014 0 0 0 0
2015 0 0 0 0
2016 0 0 0 0
2017 136,949 5,072 1,522 143,542
2018 171,186 6,340 1,902 179,428
2019 239,660 8,876 2,663 251,199
2020 273,897 10,144 3,043 287,085
2021 273,897 10,144 3,043 287,085
2022 273,897 10,144 3,043 287,085
2023 273,897 10,144 3,043 287,085
2024 273,897 10,144 3,043 287,085
2025 273,897 10,144 3,043 287,085
2026 273,897 10,144 3,043 287,085
2027 273,897 10,144 3,043 287,085
2028 273,897 10,144 3,043 287,085
2029 273,897 10,144 3,043 287,085
2030 273,897 10,144 3,043 287,085
2031 273,897 10,144 3,043 287,085
2032 273,897 10,144 3,043 287,085
2033 273,897 10,144 3,043 287,085
2034 273,897 10,144 3,043 287,085
2035 273,897 10,144 3,043 287,085
2036 273,897 10,144 3,043 287,085
2037 273,897 10,144 3,043 287,085
2038 273,897 10,144 3,043 287,085
2039 273,897 10,144 3,043 287,085
2040 273,897 10,144 3,043 287,085
2041 171,186 6,340 1,902 179,428
2042 102,711 3,804 1,141 107,657
2043 102,711 3,804 1,141 107,657
2044 0 0 0 0
2045 0 0 0 0
2046 0 0 0 0
2047 0 0 0 0
2048 0 0 0 0
Cumulative
emissions for
time period
2014 - 2048
6,676,244 247,268 74,180 6,997,692
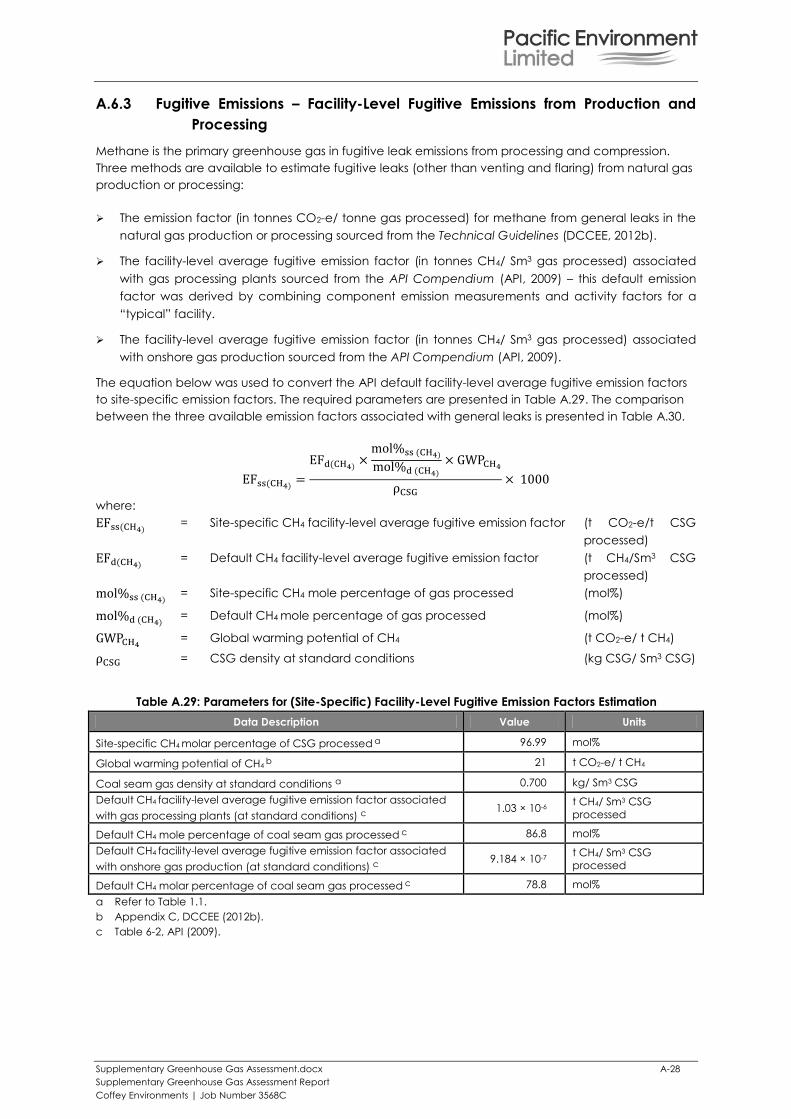
Supplementary Greenhouse Gas Assessment.docx A-28
Supplementary Greenhouse Gas Assessment Report
Coffey Environments | Job Number 3568C
A.6.3 Fugitive Emissions – Facility-Level Fugitive Emissions from Production and
Processing
Methane is the primary greenhouse gas in fugitive leak emissions from processing and compression.
Three methods are available to estimate fugitive leaks (other than venting and flaring) from natural gas
production or processing:
The emission factor (in tonnes CO2-e/ tonne gas processed) for methane from general leaks in the
natural gas production or processing sourced from the Technical Guidelines (DCCEE, 2012b).
The facility-level average fugitive emission factor (in tonnes CH4/ Sm3 gas processed) associated
with gas processing plants sourced from the API Compendium (API, 2009) – this default emission
factor was derived by combining component emission measurements and activity factors for a
“typical” facility.
The facility-level average fugitive emission factor (in tonnes CH4/ Sm3 gas processed) associated
with onshore gas production sourced from the API Compendium (API, 2009).
The equation below was used to convert the API default facility-level average fugitive emission factors
to site-specific emission factors. The required parameters are presented in Table A.29. The comparison
between the three available emission factors associated with general leaks is presented in Table A.30.
where:
= Site-specific CH4 facility-level average fugitive emission factor (t CO2-e/t CSG
processed)
= Default CH4 facility-level average fugitive emission factor (t CH4/Sm3 CSG
processed)
= Site-specific CH4 mole percentage of gas processed (mol%)
= Default CH4 mole percentage of gas processed (mol%)
= Global warming potential of CH4 (t CO2-e/ t CH4)
= CSG density at standard conditions (kg CSG/ Sm3 CSG)
Table A.29: Parameters for (Site-Specific) Facility-Level Fugitive Emission Factors Estimation
Data Description Value Units
Site-specific CH4 molar percentage of CSG processed a 96.99 mol%
Global warming potential of CH4 b 21 t CO2-e/ t CH4
Coal seam gas density at standard conditions a 0.700 kg/ Sm3 CSG
Default CH4 facility-level average fugitive emission factor associated
with gas processing plants (at standard conditions) c 1.03 × 10⁻⁶
t CH4/ Sm3 CSG
processed
Default CH4 mole percentage of coal seam gas processed c 86.8 mol%
Default CH4 facility-level average fugitive emission factor associated
with onshore gas production (at standard conditions) c 9.184 × 10⁻⁷
t CH4/ Sm3 CSG
processed
Default CH4 molar percentage of coal seam gas processed c 78.8 mol%
a Refer to Table 1.1.
b Appendix C, DCCEE (2012b).
c Table 6-2, API (2009).
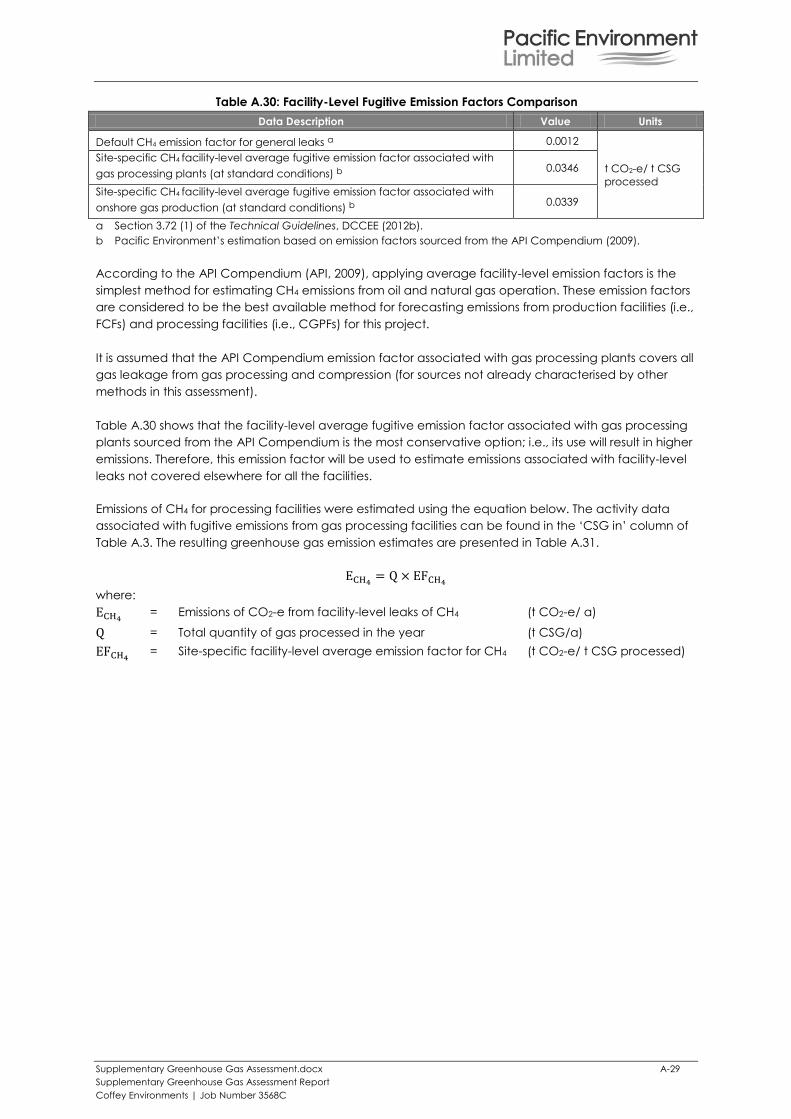
Supplementary Greenhouse Gas Assessment.docx A-29
Supplementary Greenhouse Gas Assessment Report
Coffey Environments | Job Number 3568C
Table A.30: Facility-Level Fugitive Emission Factors Comparison
Data Description Value Units
Default CH4 emission factor for general leaks a 0.0012
t CO2-e/ t CSG
processed
Site-specific CH4 facility-level average fugitive emission factor associated with
gas processing plants (at standard conditions) b 0.0346
Site-specific CH4 facility-level average fugitive emission factor associated with
onshore gas production (at standard conditions) b 0.0339
a Section 3.72 (1) of the Technical Guidelines, DCCEE (2012b).
b Pacific Environment’s estimation based on emission factors sourced from the API Compendium (2009).
According to the API Compendium (API, 2009), applying average facility-level emission factors is the
simplest method for estimating CH4 emissions from oil and natural gas operation. These emission factors
are considered to be the best available method for forecasting emissions from production facilities (i.e.,
FCFs) and processing facilities (i.e., CGPFs) for this project.
It is assumed that the API Compendium emission factor associated with gas processing plants covers all
gas leakage from gas processing and compression (for sources not already characterised by other
methods in this assessment).
Table A.30 shows that the facility-level average fugitive emission factor associated with gas processing
plants sourced from the API Compendium is the most conservative option; i.e., its use will result in higher
emissions. Therefore, this emission factor will be used to estimate emissions associated with facility-level
leaks not covered elsewhere for all the facilities.
Emissions of CH4 for processing facilities were estimated using the equation below. The activity data
associated with fugitive emissions from gas processing facilities can be found in the ‘CSG in’ column of
Table A.3. The resulting greenhouse gas emission estimates are presented in Table A.31.
where:
= Emissions of CO2-e from facility-level leaks of CH4 (t CO2-e/ a)
= Total quantity of gas processed in the year (t CSG/a)
= Site-specific facility-level average emission factor for CH4 (t CO2-e/ t CSG processed)
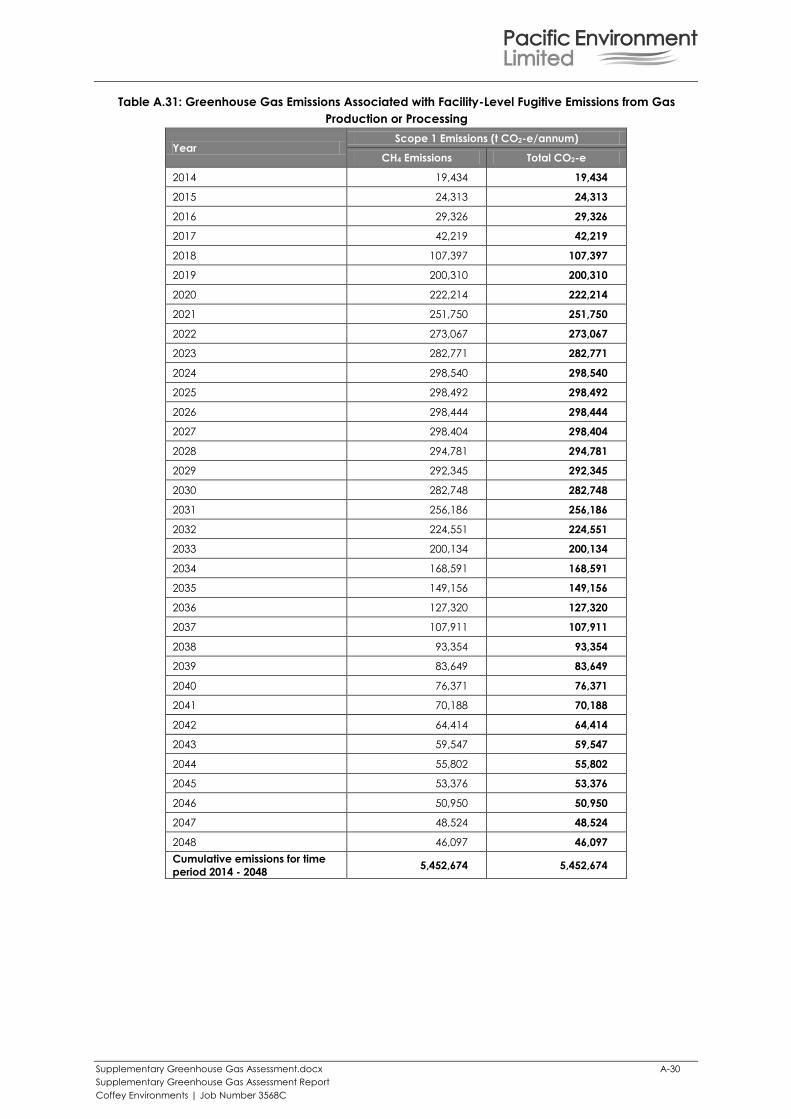
Supplementary Greenhouse Gas Assessment.docx A-30
Supplementary Greenhouse Gas Assessment Report
Coffey Environments | Job Number 3568C
Table A.31: Greenhouse Gas Emissions Associated with Facility-Level Fugitive Emissions from Gas
Production or Processing
Year Scope 1 Emissions (t CO2-e/annum)
CH4 Emissions Total CO2-e
2014 19,434 19,434
2015 24,313 24,313
2016 29,326 29,326
2017 42,219 42,219
2018 107,397 107,397
2019 200,310 200,310
2020 222,214 222,214
2021 251,750 251,750
2022 273,067 273,067
2023 282,771 282,771
2024 298,540 298,540
2025 298,492 298,492
2026 298,444 298,444
2027 298,404 298,404
2028 294,781 294,781
2029 292,345 292,345
2030 282,748 282,748
2031 256,186 256,186
2032 224,551 224,551
2033 200,134 200,134
2034 168,591 168,591
2035 149,156 149,156
2036 127,320 127,320
2037 107,911 107,911
2038 93,354 93,354
2039 83,649 83,649
2040 76,371 76,371
2041 70,188 70,188
2042 64,414 64,414
2043 59,547 59,547
2044 55,802 55,802
2045 53,376 53,376
2046 50,950 50,950
2047 48,524 48,524
2048 46,097 46,097
Cumulative emissions for time
period 2014 - 2048 5,452,674 5,452,674
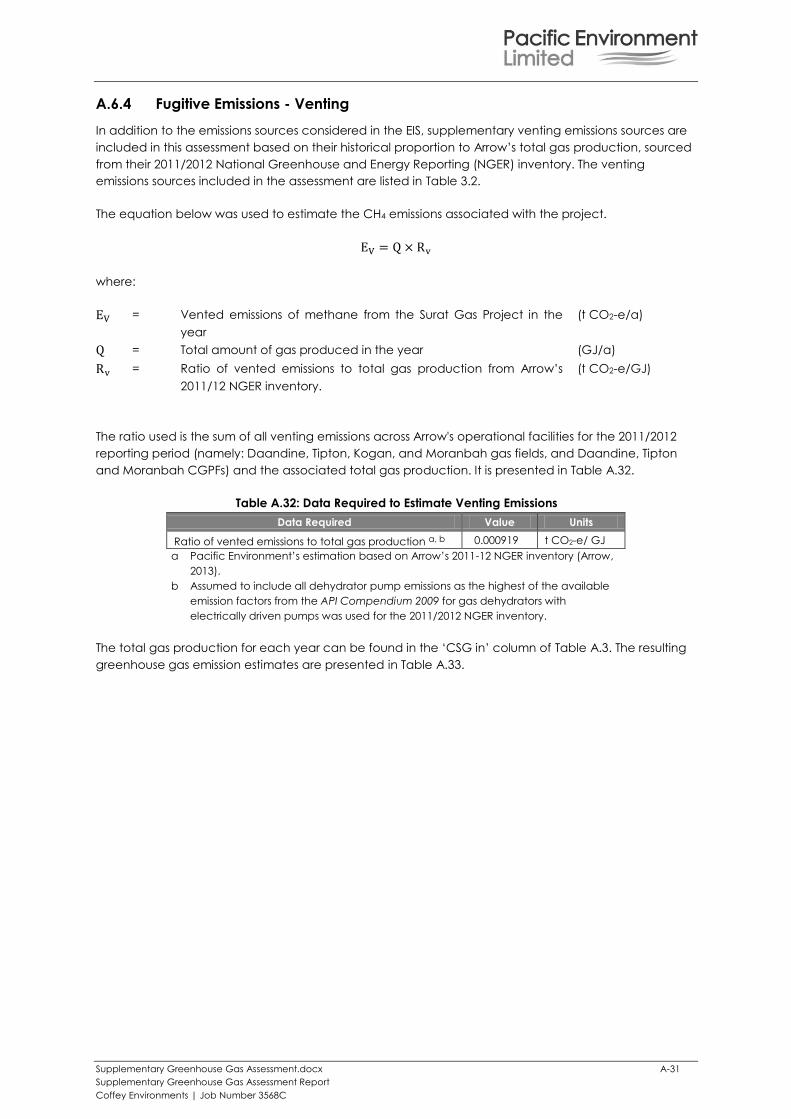
Supplementary Greenhouse Gas Assessment.docx A-31
Supplementary Greenhouse Gas Assessment Report
Coffey Environments | Job Number 3568C
A.6.4 Fugitive Emissions - Venting
In addition to the emissions sources considered in the EIS, supplementary venting emissions sources are
included in this assessment based on their historical proportion to Arrow’s total gas production, sourced
from their 2011/2012 National Greenhouse and Energy Reporting (NGER) inventory. The venting
emissions sources included in the assessment are listed in Table 3.2.
The equation below was used to estimate the CH4 emissions associated with the project.
where:
= Vented emissions of methane from the Surat Gas Project in the
year
(t CO2-e/a)
= Total amount of gas produced in the year (GJ/a)
= Ratio of vented emissions to total gas production from Arrow’s
2011/12 NGER inventory.
(t CO2-e/GJ)
The ratio used is the sum of all venting emissions across Arrow's operational facilities for the 2011/2012
reporting period (namely: Daandine, Tipton, Kogan, and Moranbah gas fields, and Daandine, Tipton
and Moranbah CGPFs) and the associated total gas production. It is presented in Table A.32.
Table A.32: Data Required to Estimate Venting Emissions
Data Required Value Units
Ratio of vented emissions to total gas production a, b 0.000919 t CO2-e/ GJ
a Pacific Environment’s estimation based on Arrow’s 2011-12 NGER inventory (Arrow,
2013).
b Assumed to include all dehydrator pump emissions as the highest of the available
emission factors from the API Compendium 2009 for gas dehydrators with
electrically driven pumps was used for the 2011/2012 NGER inventory.
The total gas production for each year can be found in the ‘CSG in’ column of Table A.3. The resulting
greenhouse gas emission estimates are presented in Table A.33.
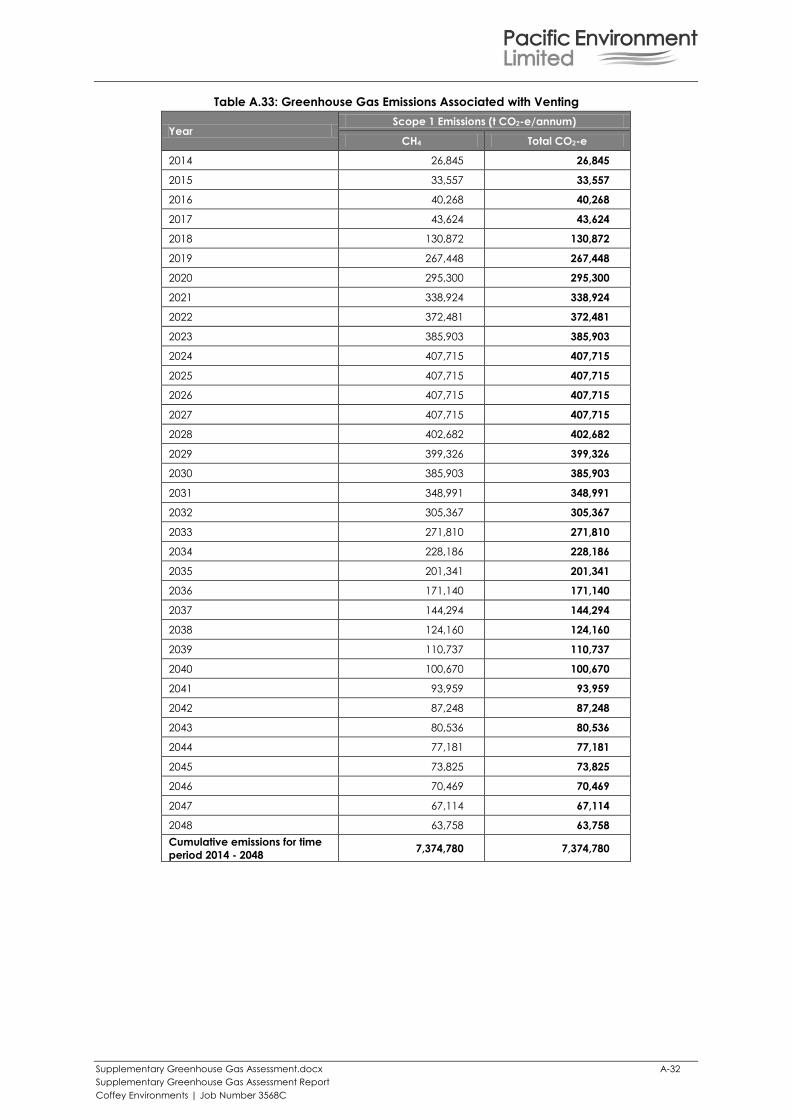
Supplementary Greenhouse Gas Assessment.docx A-32
Supplementary Greenhouse Gas Assessment Report
Coffey Environments | Job Number 3568C
Table A.33: Greenhouse Gas Emissions Associated with Venting
Year Scope 1 Emissions (t CO2-e/annum)
CH4 Total CO2-e
2014 26,845 26,845
2015 33,557 33,557
2016 40,268 40,268
2017 43,624 43,624
2018 130,872 130,872
2019 267,448 267,448
2020 295,300 295,300
2021 338,924 338,924
2022 372,481 372,481
2023 385,903 385,903
2024 407,715 407,715
2025 407,715 407,715
2026 407,715 407,715
2027 407,715 407,715
2028 402,682 402,682
2029 399,326 399,326
2030 385,903 385,903
2031 348,991 348,991
2032 305,367 305,367
2033 271,810 271,810
2034 228,186 228,186
2035 201,341 201,341
2036 171,140 171,140
2037 144,294 144,294
2038 124,160 124,160
2039 110,737 110,737
2040 100,670 100,670
2041 93,959 93,959
2042 87,248 87,248
2043 80,536 80,536
2044 77,181 77,181
2045 73,825 73,825
2046 70,469 70,469
2047 67,114 67,114
2048 63,758 63,758
Cumulative emissions for time
period 2014 - 2048 7,374,780 7,374,780
Supplementary Greenhouse Gas Assessment.docx A-33
Supplementary Greenhouse Gas Assessment Report
Coffey Environments | Job Number 3568C
A.7 SCOPE 2 EMISSIONS – OPERATION
As a permanent power supply option, electricity from the grid will be supplied to the CGPFs and the
brine treatment facility from where it will be distributed to wells and water transfer stations. FCFs will be
powered from a direct connection to the grid or via a CGPF. No electricity will be supplied from the
grid for construction and decommissioning activities. Construction and decommissioning power will be
supplied via diesel generators (refer to Section A.4.1).
The method to estimate Scope 2 emissions can be found in Chapter 7 of the Technical Guidelines
(DCCEE, 2012b). Only one method is currently available for the estimation of emissions from electricity
purchased from the grid. This method uses indirect emission factors based on the state, territory or
electricity grid corresponding to the facility of interest. It should be noted that these indirect emission
factors are intended to be updated each year.
Scope 2 emissions of CO2 associated with purchased electricity were estimated using Method 1
(Division 7.2, Method 1 – purchase of electricity from main electricity grid in a State or Territory of the
Technical Guidelines):
where:
= Scope 2 greenhouse gas emissions in the year (t CO2-e/a)
= Quantity of electricity purchased from the grid in the year (kWh/a)
= Default Scope 2 emission factor specific to State or Territory in which
the consumption occurs
(kg CO2-e/kWh)
The default energy content factor for electricity and the emission factor for CO2 were sourced from Part
7.2 (3) and Table 7.2 of the Technical Guidelines and are listed in Table A.34. The equation below was
used to estimate the total quantity of electricity consumed by the single wells in the year based on the
number of wells and CGPFs on-line. The same approach was used to estimate the total quantity of
electricity consumed by well pads. The activity data associated with electricity consumed are
presented in Table A.35 and Table A.36. The resulting greenhouse gas emission estimates are presented
in Table A.37.
where:
= Quantity of electricity purchased from the grid in the year (kWh/a)
= Electricity usage of single wells (kWh/a)
= Equivalent number of single wells powered by electricity during
the year
(wells/a)
= Electricity usage of multi-well pads (kWh/a)
= Equivalent number of multi-well pads powered by electricity
during the year
(wells/a)
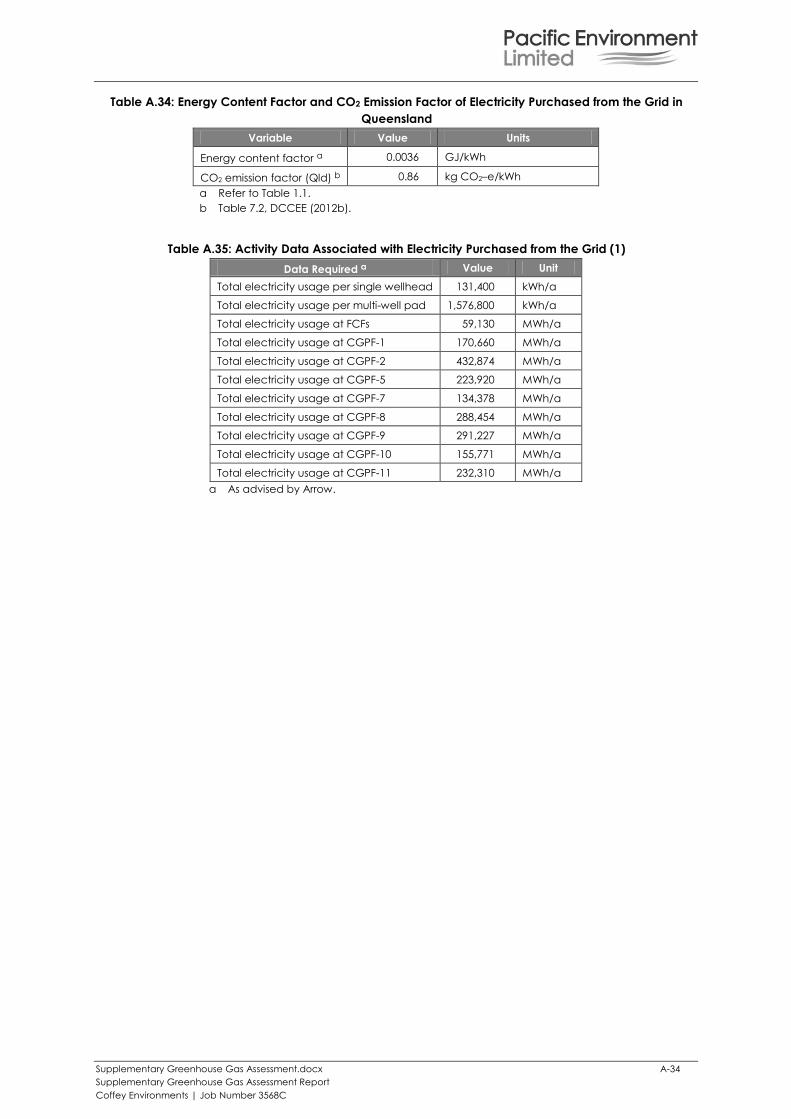
Supplementary Greenhouse Gas Assessment.docx A-34
Supplementary Greenhouse Gas Assessment Report
Coffey Environments | Job Number 3568C
Table A.34: Energy Content Factor and CO2 Emission Factor of Electricity Purchased from the Grid in
Queensland
Variable Value Units
Energy content factor a 0.0036 GJ/kWh
CO2 emission factor (Qld) b 0.86 kg CO2–e/kWh
a Refer to Table 1.1.
b Table 7.2, DCCEE (2012b).
Table A.35: Activity Data Associated with Electricity Purchased from the Grid (1)
Data Required a Value Unit
Total electricity usage per single wellhead 131,400 kWh/a
Total electricity usage per multi-well pad 1,576,800 kWh/a
Total electricity usage at FCFs 59,130 MWh/a
Total electricity usage at CGPF-1 170,660 MWh/a
Total electricity usage at CGPF-2 432,874 MWh/a
Total electricity usage at CGPF-5 223,920 MWh/a
Total electricity usage at CGPF-7 134,378 MWh/a
Total electricity usage at CGPF-8 288,454 MWh/a
Total electricity usage at CGPF-9 291,227 MWh/a
Total electricity usage at CGPF-10 155,771 MWh/a
Total electricity usage at CGPF-11 232,310 MWh/a
a As advised by Arrow.
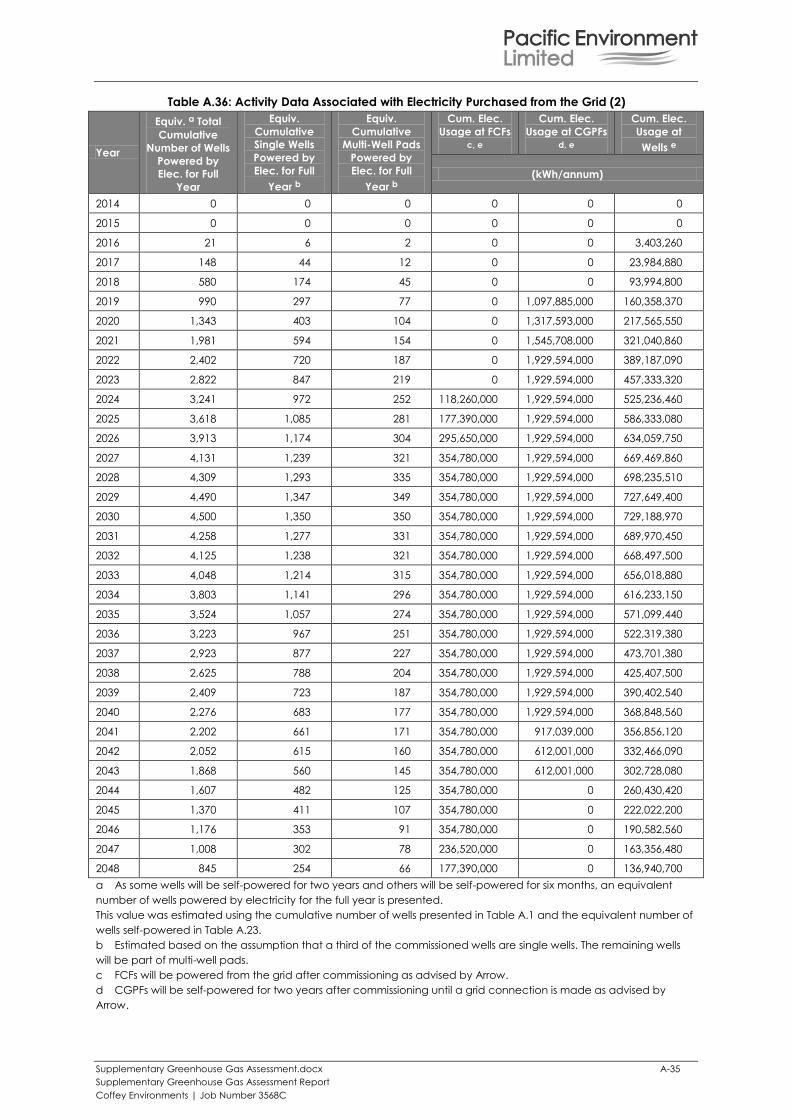
Supplementary Greenhouse Gas Assessment.docx A-35
Supplementary Greenhouse Gas Assessment Report
Coffey Environments | Job Number 3568C
Table A.36: Activity Data Associated with Electricity Purchased from the Grid (2)
Year
Equiv. a Total
Cumulative
Number of Wells
Powered by
Elec. for Full
Year
Equiv.
Cumulative
Single Wells
Powered by
Elec. for Full
Year b
Equiv.
Cumulative
Multi-Well Pads
Powered by
Elec. for Full
Year b
Cum. Elec.
Usage at FCFs c, e
Cum. Elec.
Usage at CGPFs d, e
Cum. Elec.
Usage at
Wells e
(kWh/annum)
2014 0 0 0 0 0 0
2015 0 0 0 0 0 0
2016 21 6 2 0 0 3,403,260
2017 148 44 12 0 0 23,984,880
2018 580 174 45 0 0 93,994,800
2019 990 297 77 0 1,097,885,000 160,358,370
2020 1,343 403 104 0 1,317,593,000 217,565,550
2021 1,981 594 154 0 1,545,708,000 321,040,860
2022 2,402 720 187 0 1,929,594,000 389,187,090
2023 2,822 847 219 0 1,929,594,000 457,333,320
2024 3,241 972 252 118,260,000 1,929,594,000 525,236,460
2025 3,618 1,085 281 177,390,000 1,929,594,000 586,333,080
2026 3,913 1,174 304 295,650,000 1,929,594,000 634,059,750
2027 4,131 1,239 321 354,780,000 1,929,594,000 669,469,860
2028 4,309 1,293 335 354,780,000 1,929,594,000 698,235,510
2029 4,490 1,347 349 354,780,000 1,929,594,000 727,649,400
2030 4,500 1,350 350 354,780,000 1,929,594,000 729,188,970
2031 4,258 1,277 331 354,780,000 1,929,594,000 689,970,450
2032 4,125 1,238 321 354,780,000 1,929,594,000 668,497,500
2033 4,048 1,214 315 354,780,000 1,929,594,000 656,018,880
2034 3,803 1,141 296 354,780,000 1,929,594,000 616,233,150
2035 3,524 1,057 274 354,780,000 1,929,594,000 571,099,440
2036 3,223 967 251 354,780,000 1,929,594,000 522,319,380
2037 2,923 877 227 354,780,000 1,929,594,000 473,701,380
2038 2,625 788 204 354,780,000 1,929,594,000 425,407,500
2039 2,409 723 187 354,780,000 1,929,594,000 390,402,540
2040 2,276 683 177 354,780,000 1,929,594,000 368,848,560
2041 2,202 661 171 354,780,000 917,039,000 356,856,120
2042 2,052 615 160 354,780,000 612,001,000 332,466,090
2043 1,868 560 145 354,780,000 612,001,000 302,728,080
2044 1,607 482 125 354,780,000 0 260,430,420
2045 1,370 411 107 354,780,000 0 222,022,200
2046 1,176 353 91 354,780,000 0 190,582,560
2047 1,008 302 78 236,520,000 0 163,356,480
2048 845 254 66 177,390,000 0 136,940,700
a As some wells will be self-powered for two years and others will be self-powered for six months, an equivalent
number of wells powered by electricity for the full year is presented.
This value was estimated using the cumulative number of wells presented in Table A.1 and the equivalent number of
wells self-powered in Table A.23.
b Estimated based on the assumption that a third of the commissioned wells are single wells. The remaining wells
will be part of multi-well pads.
c FCFs will be powered from the grid after commissioning as advised by Arrow.
d CGPFs will be self-powered for two years after commissioning until a grid connection is made as advised by
Arrow.
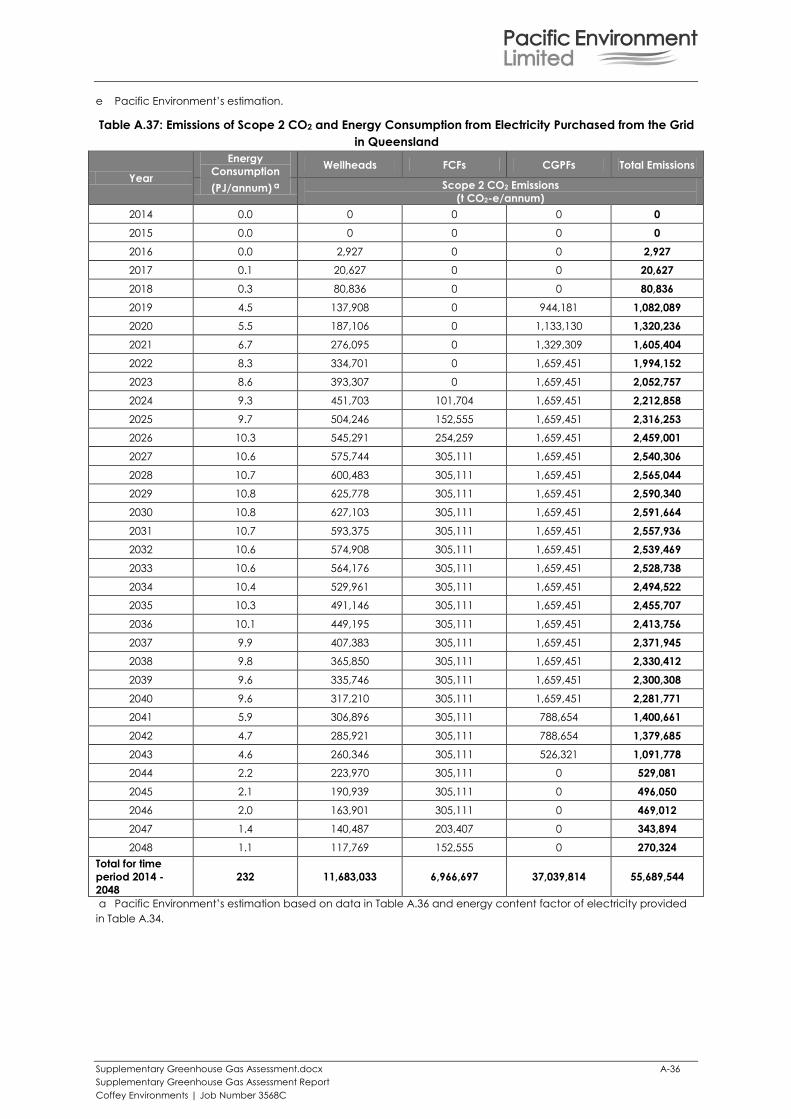
Supplementary Greenhouse Gas Assessment.docx A-36
Supplementary Greenhouse Gas Assessment Report
Coffey Environments | Job Number 3568C
e Pacific Environment’s estimation.
Table A.37: Emissions of Scope 2 CO2 and Energy Consumption from Electricity Purchased from the Grid
in Queensland
Year
Energy
Consumption Wellheads FCFs CGPFs Total Emissions
(PJ/annum) a Scope 2 CO2 Emissions
(t CO2-e/annum)
2014 0.0 0 0 0 0
2015 0.0 0 0 0 0
2016 0.0 2,927 0 0 2,927
2017 0.1 20,627 0 0 20,627
2018 0.3 80,836 0 0 80,836
2019 4.5 137,908 0 944,181 1,082,089
2020 5.5 187,106 0 1,133,130 1,320,236
2021 6.7 276,095 0 1,329,309 1,605,404
2022 8.3 334,701 0 1,659,451 1,994,152
2023 8.6 393,307 0 1,659,451 2,052,757
2024 9.3 451,703 101,704 1,659,451 2,212,858
2025 9.7 504,246 152,555 1,659,451 2,316,253
2026 10.3 545,291 254,259 1,659,451 2,459,001
2027 10.6 575,744 305,111 1,659,451 2,540,306
2028 10.7 600,483 305,111 1,659,451 2,565,044
2029 10.8 625,778 305,111 1,659,451 2,590,340
2030 10.8 627,103 305,111 1,659,451 2,591,664
2031 10.7 593,375 305,111 1,659,451 2,557,936
2032 10.6 574,908 305,111 1,659,451 2,539,469
2033 10.6 564,176 305,111 1,659,451 2,528,738
2034 10.4 529,961 305,111 1,659,451 2,494,522
2035 10.3 491,146 305,111 1,659,451 2,455,707
2036 10.1 449,195 305,111 1,659,451 2,413,756
2037 9.9 407,383 305,111 1,659,451 2,371,945
2038 9.8 365,850 305,111 1,659,451 2,330,412
2039 9.6 335,746 305,111 1,659,451 2,300,308
2040 9.6 317,210 305,111 1,659,451 2,281,771
2041 5.9 306,896 305,111 788,654 1,400,661
2042 4.7 285,921 305,111 788,654 1,379,685
2043 4.6 260,346 305,111 526,321 1,091,778
2044 2.2 223,970 305,111 0 529,081
2045 2.1 190,939 305,111 0 496,050
2046 2.0 163,901 305,111 0 469,012
2047 1.4 140,487 203,407 0 343,894
2048 1.1 117,769 152,555 0 270,324
Total for time
period 2014 -
2048
232 11,683,033 6,966,697 37,039,814 55,689,544
a Pacific Environment’s estimation based on data in Table A.36 and energy content factor of electricity provided
in Table A.34.
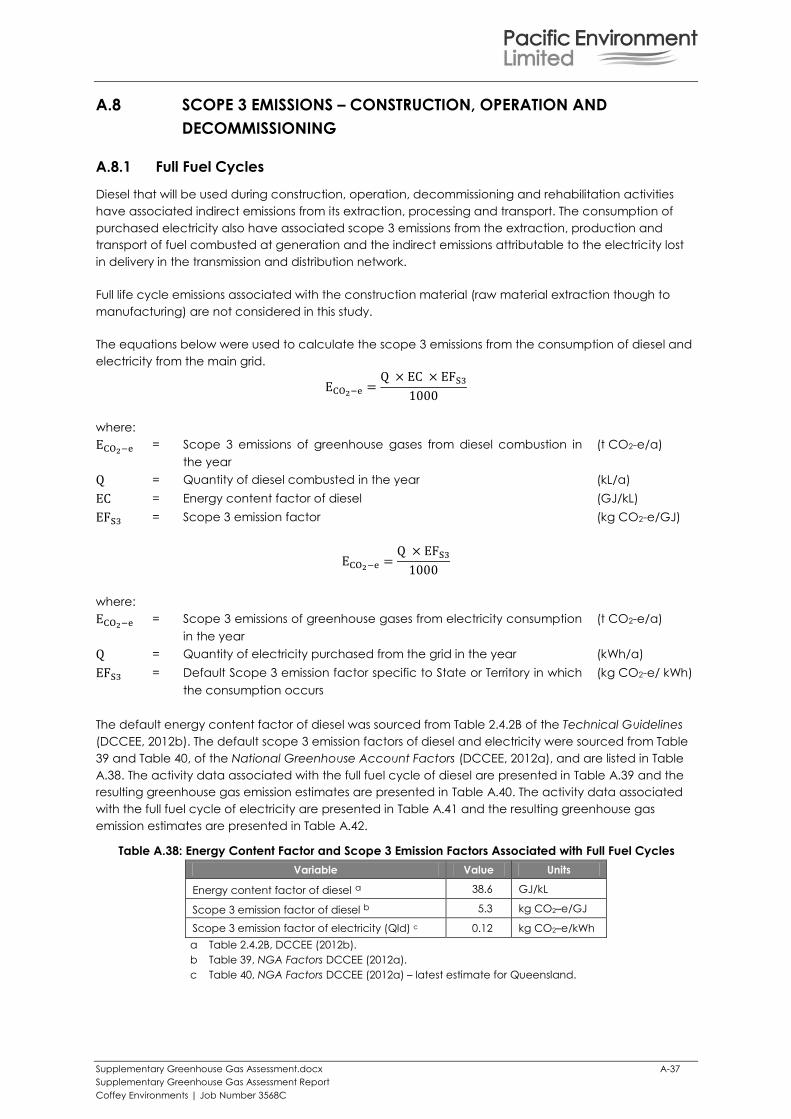
Supplementary Greenhouse Gas Assessment.docx A-37
Supplementary Greenhouse Gas Assessment Report
Coffey Environments | Job Number 3568C
A.8 SCOPE 3 EMISSIONS – CONSTRUCTION, OPERATION AND
DECOMMISSIONING
A.8.1 Full Fuel Cycles
Diesel that will be used during construction, operation, decommissioning and rehabilitation activities
have associated indirect emissions from its extraction, processing and transport. The consumption of
purchased electricity also have associated scope 3 emissions from the extraction, production and
transport of fuel combusted at generation and the indirect emissions attributable to the electricity lost
in delivery in the transmission and distribution network.
Full life cycle emissions associated with the construction material (raw material extraction though to
manufacturing) are not considered in this study.
The equations below were used to calculate the scope 3 emissions from the consumption of diesel and
electricity from the main grid.
where:
= Scope 3 emissions of greenhouse gases from diesel combustion in
the year
(t CO2-e/a)
= Quantity of diesel combusted in the year (kL/a)
= Energy content factor of diesel (GJ/kL)
= Scope 3 emission factor (kg CO2-e/GJ)
where:
= Scope 3 emissions of greenhouse gases from electricity consumption
in the year
(t CO2-e/a)
= Quantity of electricity purchased from the grid in the year (kWh/a)
= Default Scope 3 emission factor specific to State or Territory in which
the consumption occurs
(kg CO2-e/ kWh)
The default energy content factor of diesel was sourced from Table 2.4.2B of the Technical Guidelines
(DCCEE, 2012b). The default scope 3 emission factors of diesel and electricity were sourced from Table
39 and Table 40, of the National Greenhouse Account Factors (DCCEE, 2012a), and are listed in Table
A.38. The activity data associated with the full fuel cycle of diesel are presented in Table A.39 and the
resulting greenhouse gas emission estimates are presented in Table A.40. The activity data associated
with the full fuel cycle of electricity are presented in Table A.41 and the resulting greenhouse gas
emission estimates are presented in Table A.42.
Table A.38: Energy Content Factor and Scope 3 Emission Factors Associated with Full Fuel Cycles
Variable Value Units
Energy content factor of diesel a 38.6 GJ/kL
Scope 3 emission factor of diesel b 5.3 kg CO2–e/GJ
Scope 3 emission factor of electricity (Qld) c 0.12 kg CO2–e/kWh
a Table 2.4.2B, DCCEE (2012b).
b Table 39, NGA Factors DCCEE (2012a).
c Table 40, NGA Factors DCCEE (2012a) – latest estimate for Queensland.
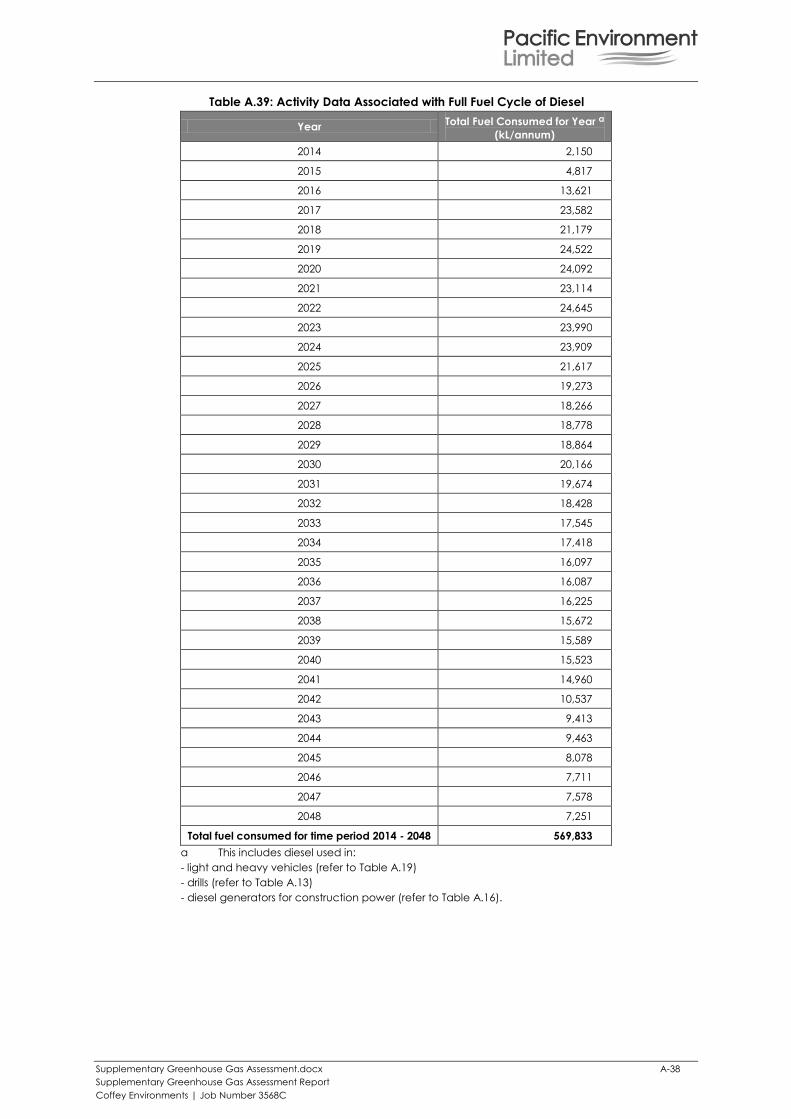
Supplementary Greenhouse Gas Assessment.docx A-38
Supplementary Greenhouse Gas Assessment Report
Coffey Environments | Job Number 3568C
Table A.39: Activity Data Associated with Full Fuel Cycle of Diesel
Year Total Fuel Consumed for Year a
(kL/annum)
2014 2,150
2015 4,817
2016 13,621
2017 23,582
2018 21,179
2019 24,522
2020 24,092
2021 23,114
2022 24,645
2023 23,990
2024 23,909
2025 21,617
2026 19,273
2027 18,266
2028 18,778
2029 18,864
2030 20,166
2031 19,674
2032 18,428
2033 17,545
2034 17,418
2035 16,097
2036 16,087
2037 16,225
2038 15,672
2039 15,589
2040 15,523
2041 14,960
2042 10,537
2043 9,413
2044 9,463
2045 8,078
2046 7,711
2047 7,578
2048 7,251
Total fuel consumed for time period 2014 - 2048 569,833
a This includes diesel used in:
- light and heavy vehicles (refer to Table A.19)
- drills (refer to Table A.13)
- diesel generators for construction power (refer to Table A.16).
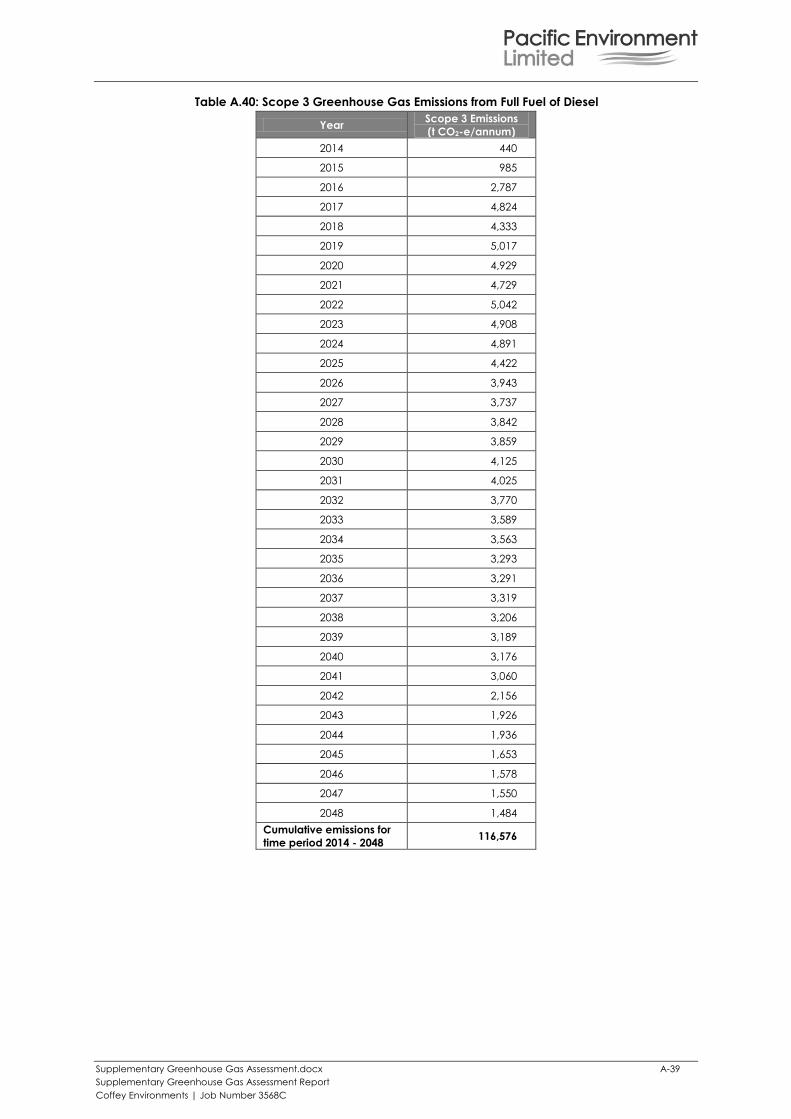
Supplementary Greenhouse Gas Assessment.docx A-39
Supplementary Greenhouse Gas Assessment Report
Coffey Environments | Job Number 3568C
Table A.40: Scope 3 Greenhouse Gas Emissions from Full Fuel of Diesel
Year Scope 3 Emissions
(t CO2-e/annum)
2014 440
2015 985
2016 2,787
2017 4,824
2018 4,333
2019 5,017
2020 4,929
2021 4,729
2022 5,042
2023 4,908
2024 4,891
2025 4,422
2026 3,943
2027 3,737
2028 3,842
2029 3,859
2030 4,125
2031 4,025
2032 3,770
2033 3,589
2034 3,563
2035 3,293
2036 3,291
2037 3,319
2038 3,206
2039 3,189
2040 3,176
2041 3,060
2042 2,156
2043 1,926
2044 1,936
2045 1,653
2046 1,578
2047 1,550
2048 1,484
Cumulative emissions for
time period 2014 - 2048 116,576
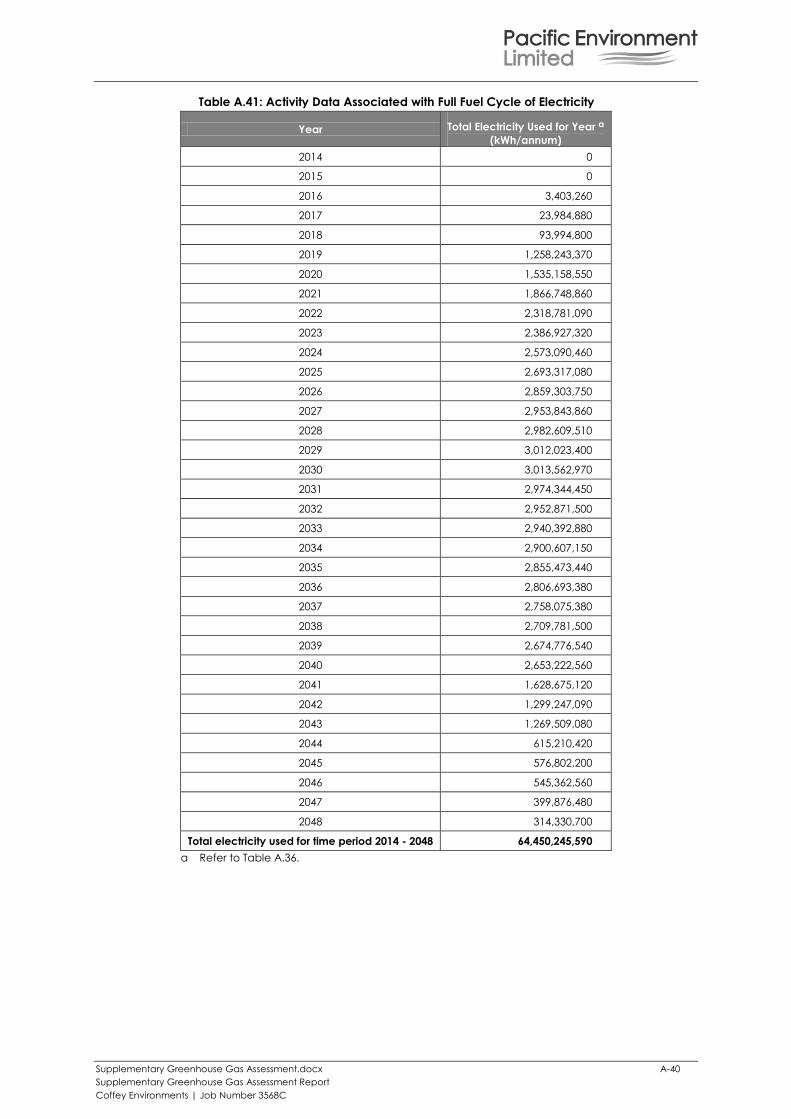
Supplementary Greenhouse Gas Assessment.docx A-40
Supplementary Greenhouse Gas Assessment Report
Coffey Environments | Job Number 3568C
Table A.41: Activity Data Associated with Full Fuel Cycle of Electricity
Year Total Electricity Used for Year a
(kWh/annum)
2014 0
2015 0
2016 3,403,260
2017 23,984,880
2018 93,994,800
2019 1,258,243,370
2020 1,535,158,550
2021 1,866,748,860
2022 2,318,781,090
2023 2,386,927,320
2024 2,573,090,460
2025 2,693,317,080
2026 2,859,303,750
2027 2,953,843,860
2028 2,982,609,510
2029 3,012,023,400
2030 3,013,562,970
2031 2,974,344,450
2032 2,952,871,500
2033 2,940,392,880
2034 2,900,607,150
2035 2,855,473,440
2036 2,806,693,380
2037 2,758,075,380
2038 2,709,781,500
2039 2,674,776,540
2040 2,653,222,560
2041 1,628,675,120
2042 1,299,247,090
2043 1,269,509,080
2044 615,210,420
2045 576,802,200
2046 545,362,560
2047 399,876,480
2048 314,330,700
Total electricity used for time period 2014 - 2048 64,450,245,590
a Refer to Table A.36.
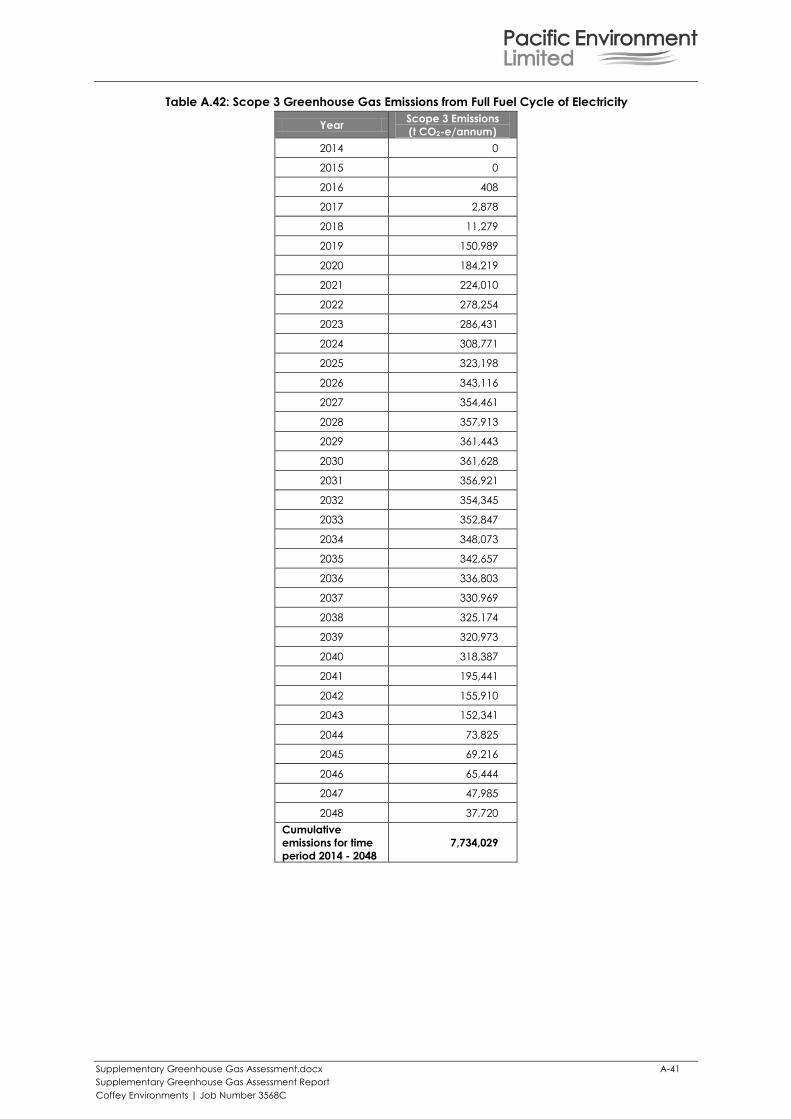
Supplementary Greenhouse Gas Assessment.docx A-41
Supplementary Greenhouse Gas Assessment Report
Coffey Environments | Job Number 3568C
Table A.42: Scope 3 Greenhouse Gas Emissions from Full Fuel Cycle of Electricity
Year Scope 3 Emissions
(t CO2-e/annum)
2014 0
2015 0
2016 408
2017 2,878
2018 11,279
2019 150,989
2020 184,219
2021 224,010
2022 278,254
2023 286,431
2024 308,771
2025 323,198
2026 343,116
2027 354,461
2028 357,913
2029 361,443
2030 361,628
2031 356,921
2032 354,345
2033 352,847
2034 348,073
2035 342,657
2036 336,803
2037 330,969
2038 325,174
2039 320,973
2040 318,387
2041 195,441
2042 155,910
2043 152,341
2044 73,825
2045 69,216
2046 65,444
2047 47,985
2048 37,720
Cumulative
emissions for time
period 2014 - 2048
7,734,029
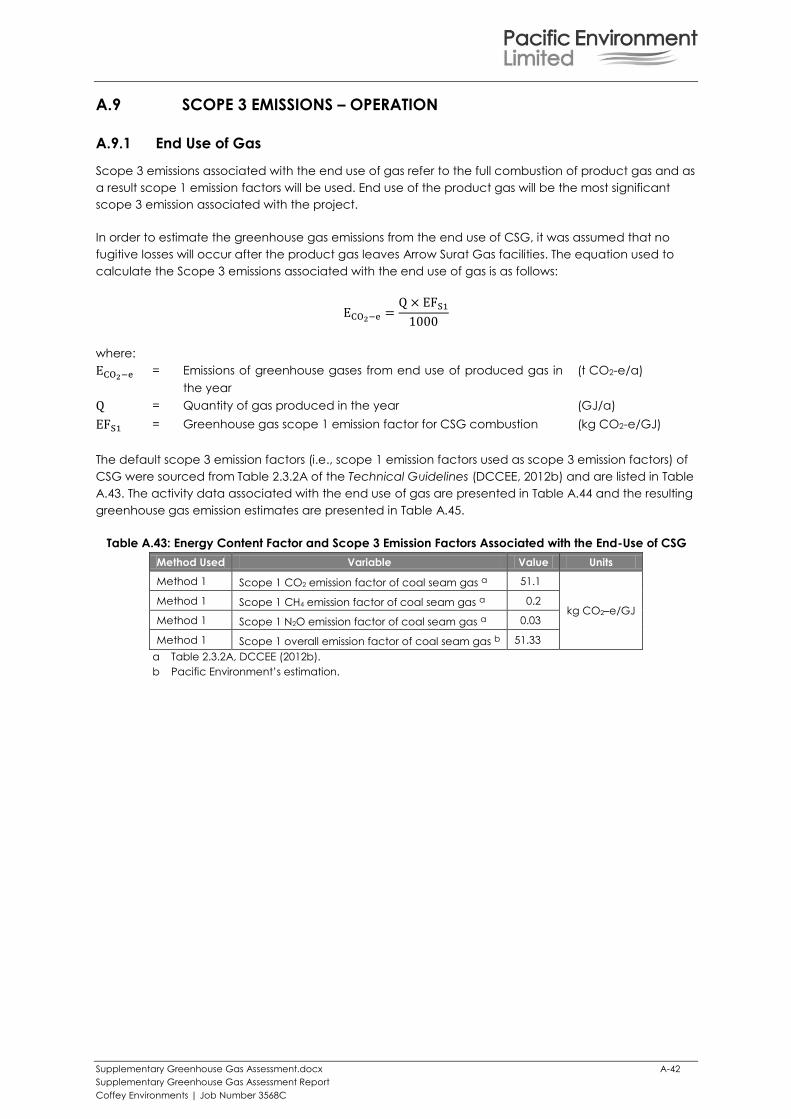
Supplementary Greenhouse Gas Assessment.docx A-42
Supplementary Greenhouse Gas Assessment Report
Coffey Environments | Job Number 3568C
A.9 SCOPE 3 EMISSIONS – OPERATION
A.9.1 End Use of Gas
Scope 3 emissions associated with the end use of gas refer to the full combustion of product gas and as
a result scope 1 emission factors will be used. End use of the product gas will be the most significant
scope 3 emission associated with the project.
In order to estimate the greenhouse gas emissions from the end use of CSG, it was assumed that no
fugitive losses will occur after the product gas leaves Arrow Surat Gas facilities. The equation used to
calculate the Scope 3 emissions associated with the end use of gas is as follows:
where:
= Emissions of greenhouse gases from end use of produced gas in
the year
(t CO2-e/a)
= Quantity of gas produced in the year (GJ/a)
= Greenhouse gas scope 1 emission factor for CSG combustion (kg CO2-e/GJ)
The default scope 3 emission factors (i.e., scope 1 emission factors used as scope 3 emission factors) of
CSG were sourced from Table 2.3.2A of the Technical Guidelines (DCCEE, 2012b) and are listed in Table
A.43. The activity data associated with the end use of gas are presented in Table A.44 and the resulting
greenhouse gas emission estimates are presented in Table A.45.
Table A.43: Energy Content Factor and Scope 3 Emission Factors Associated with the End-Use of CSG
Method Used Variable Value Units
Method 1 Scope 1 CO2 emission factor of coal seam gas a 51.1
kg CO2–e/GJ Method 1 Scope 1 CH4 emission factor of coal seam gas a 0.2
Method 1 Scope 1 N2O emission factor of coal seam gas a 0.03
Method 1 Scope 1 overall emission factor of coal seam gas b 51.33
a Table 2.3.2A, DCCEE (2012b).
b Pacific Environment’s estimation.
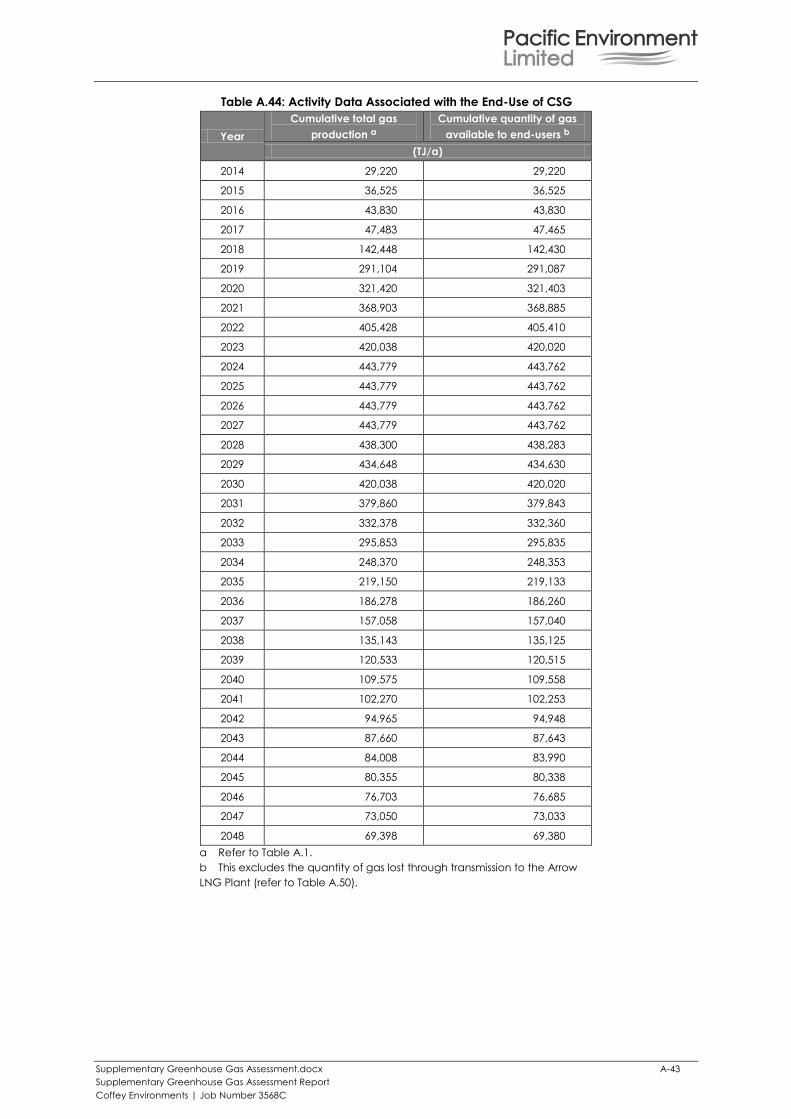
Supplementary Greenhouse Gas Assessment.docx A-43
Supplementary Greenhouse Gas Assessment Report
Coffey Environments | Job Number 3568C
Table A.44: Activity Data Associated with the End-Use of CSG
Year
Cumulative total gas
production a
Cumulative quantity of gas
available to end-users b
(TJ/a)
2014 29,220 29,220
2015 36,525 36,525
2016 43,830 43,830
2017 47,483 47,465
2018 142,448 142,430
2019 291,104 291,087
2020 321,420 321,403
2021 368,903 368,885
2022 405,428 405,410
2023 420,038 420,020
2024 443,779 443,762
2025 443,779 443,762
2026 443,779 443,762
2027 443,779 443,762
2028 438,300 438,283
2029 434,648 434,630
2030 420,038 420,020
2031 379,860 379,843
2032 332,378 332,360
2033 295,853 295,835
2034 248,370 248,353
2035 219,150 219,133
2036 186,278 186,260
2037 157,058 157,040
2038 135,143 135,125
2039 120,533 120,515
2040 109,575 109,558
2041 102,270 102,253
2042 94,965 94,948
2043 87,660 87,643
2044 84,008 83,990
2045 80,355 80,338
2046 76,703 76,685
2047 73,050 73,033
2048 69,398 69,380
a Refer to Table A.1.
b This excludes the quantity of gas lost through transmission to the Arrow
LNG Plant (refer to Table A.50).
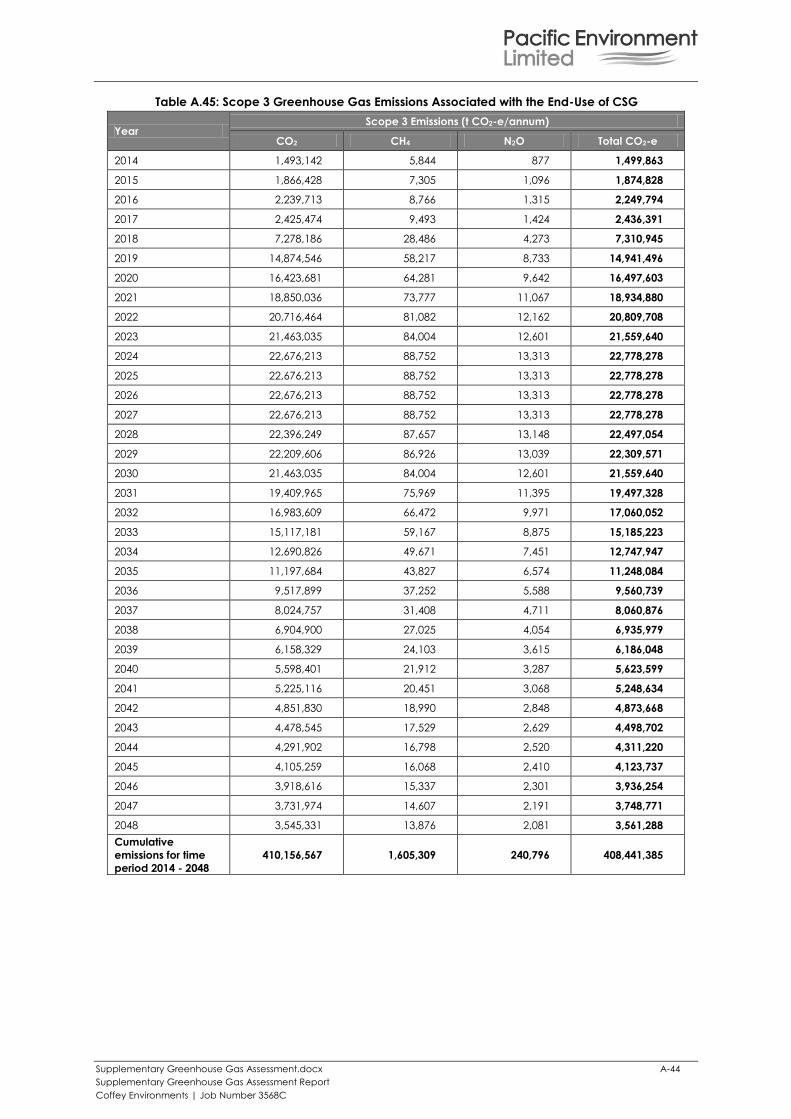
Supplementary Greenhouse Gas Assessment.docx A-44
Supplementary Greenhouse Gas Assessment Report
Coffey Environments | Job Number 3568C
Table A.45: Scope 3 Greenhouse Gas Emissions Associated with the End-Use of CSG
Year Scope 3 Emissions (t CO2-e/annum)
CO2 CH4 N2O Total CO2-e
2014 1,493,142 5,844 877 1,499,863
2015 1,866,428 7,305 1,096 1,874,828
2016 2,239,713 8,766 1,315 2,249,794
2017 2,425,474 9,493 1,424 2,436,391
2018 7,278,186 28,486 4,273 7,310,945
2019 14,874,546 58,217 8,733 14,941,496
2020 16,423,681 64,281 9,642 16,497,603
2021 18,850,036 73,777 11,067 18,934,880
2022 20,716,464 81,082 12,162 20,809,708
2023 21,463,035 84,004 12,601 21,559,640
2024 22,676,213 88,752 13,313 22,778,278
2025 22,676,213 88,752 13,313 22,778,278
2026 22,676,213 88,752 13,313 22,778,278
2027 22,676,213 88,752 13,313 22,778,278
2028 22,396,249 87,657 13,148 22,497,054
2029 22,209,606 86,926 13,039 22,309,571
2030 21,463,035 84,004 12,601 21,559,640
2031 19,409,965 75,969 11,395 19,497,328
2032 16,983,609 66,472 9,971 17,060,052
2033 15,117,181 59,167 8,875 15,185,223
2034 12,690,826 49,671 7,451 12,747,947
2035 11,197,684 43,827 6,574 11,248,084
2036 9,517,899 37,252 5,588 9,560,739
2037 8,024,757 31,408 4,711 8,060,876
2038 6,904,900 27,025 4,054 6,935,979
2039 6,158,329 24,103 3,615 6,186,048
2040 5,598,401 21,912 3,287 5,623,599
2041 5,225,116 20,451 3,068 5,248,634
2042 4,851,830 18,990 2,848 4,873,668
2043 4,478,545 17,529 2,629 4,498,702
2044 4,291,902 16,798 2,520 4,311,220
2045 4,105,259 16,068 2,410 4,123,737
2046 3,918,616 15,337 2,301 3,936,254
2047 3,731,974 14,607 2,191 3,748,771
2048 3,545,331 13,876 2,081 3,561,288
Cumulative
emissions for time
period 2014 - 2048
410,156,567 1,605,309 240,796 408,441,385
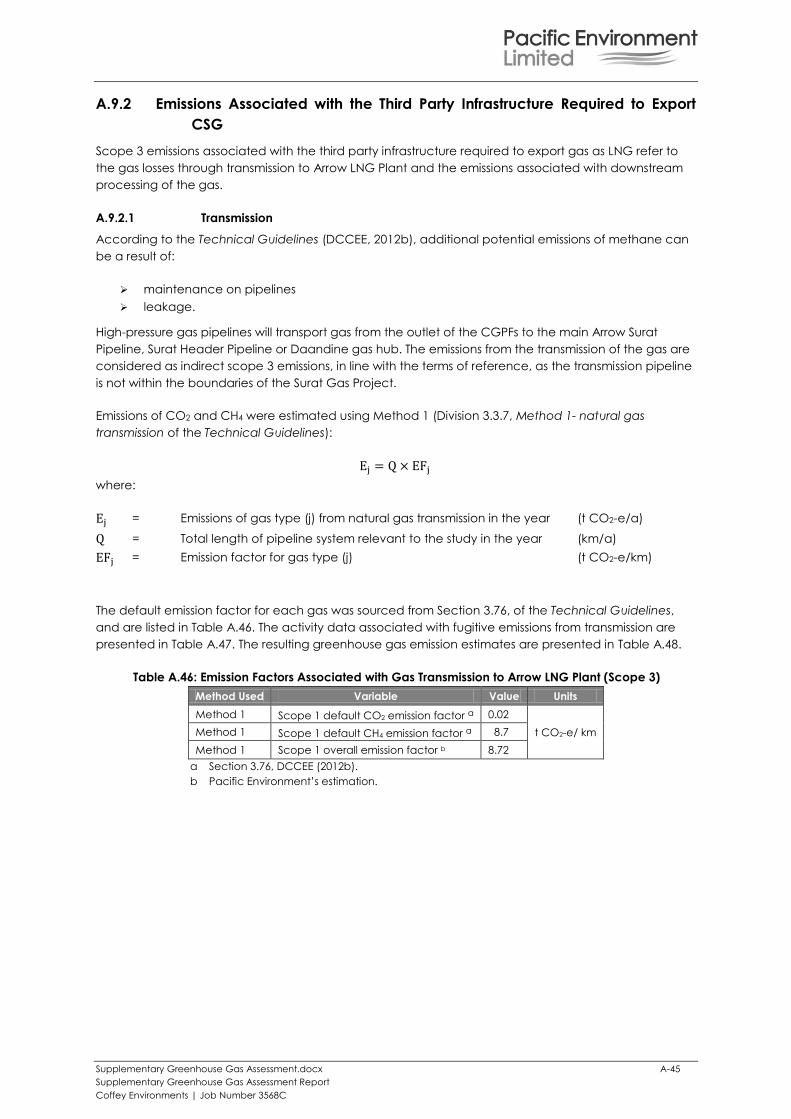
Supplementary Greenhouse Gas Assessment.docx A-45
Supplementary Greenhouse Gas Assessment Report
Coffey Environments | Job Number 3568C
A.9.2 Emissions Associated with the Third Party Infrastructure Required to Export
CSG
Scope 3 emissions associated with the third party infrastructure required to export gas as LNG refer to
the gas losses through transmission to Arrow LNG Plant and the emissions associated with downstream
processing of the gas.
A.9.2.1 Transmission
According to the Technical Guidelines (DCCEE, 2012b), additional potential emissions of methane can
be a result of:
maintenance on pipelines
leakage.
High-pressure gas pipelines will transport gas from the outlet of the CGPFs to the main Arrow Surat
Pipeline, Surat Header Pipeline or Daandine gas hub. The emissions from the transmission of the gas are
considered as indirect scope 3 emissions, in line with the terms of reference, as the transmission pipeline
is not within the boundaries of the Surat Gas Project.
Emissions of CO2 and CH4 were estimated using Method 1 (Division 3.3.7, Method 1- natural gas
transmission of the Technical Guidelines):
where:
= Emissions of gas type (j) from natural gas transmission in the year (t CO2-e/a)
= Total length of pipeline system relevant to the study in the year (km/a)
= Emission factor for gas type (j) (t CO2-e/km)
The default emission factor for each gas was sourced from Section 3.76, of the Technical Guidelines,
and are listed in Table A.46. The activity data associated with fugitive emissions from transmission are
presented in Table A.47. The resulting greenhouse gas emission estimates are presented in Table A.48.
Table A.46: Emission Factors Associated with Gas Transmission to Arrow LNG Plant (Scope 3)
Method Used Variable Value Units
Method 1 Scope 1 default CO2 emission factor a 0.02
t CO2-e/ km Method 1 Scope 1 default CH4 emission factor a 8.7
Method 1 Scope 1 overall emission factor b 8.72
a Section 3.76, DCCEE (2012b).
b Pacific Environment’s estimation.
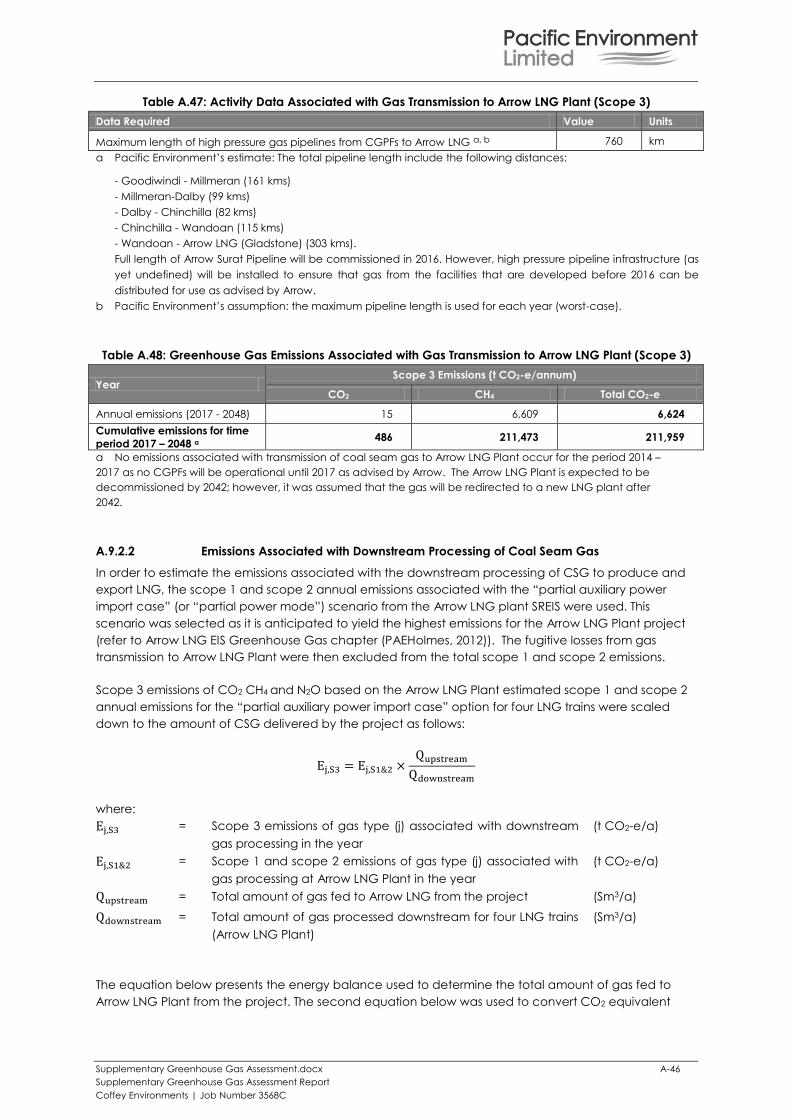
Supplementary Greenhouse Gas Assessment.docx A-46
Supplementary Greenhouse Gas Assessment Report
Coffey Environments | Job Number 3568C
Table A.47: Activity Data Associated with Gas Transmission to Arrow LNG Plant (Scope 3)
Data Required Value Units
Maximum length of high pressure gas pipelines from CGPFs to Arrow LNG a, b 760 km
a Pacific Environment’s estimate: The total pipeline length include the following distances:
- Goodiwindi - Millmeran (161 kms)
- Millmeran-Dalby (99 kms)
- Dalby - Chinchilla (82 kms)
- Chinchilla - Wandoan (115 kms)
- Wandoan - Arrow LNG (Gladstone) (303 kms).
Full length of Arrow Surat Pipeline will be commissioned in 2016. However, high pressure pipeline infrastructure (as
yet undefined) will be installed to ensure that gas from the facilities that are developed before 2016 can be
distributed for use as advised by Arrow.
b Pacific Environment’s assumption: the maximum pipeline length is used for each year (worst-case).
Table A.48: Greenhouse Gas Emissions Associated with Gas Transmission to Arrow LNG Plant (Scope 3)
Year Scope 3 Emissions (t CO2-e/annum)
CO2 CH4 Total CO2-e
Annual emissions (2017 - 2048) 15 6,609 6,624
Cumulative emissions for time
period 2017 – 2048 a 486 211,473 211,959
a No emissions associated with transmission of coal seam gas to Arrow LNG Plant occur for the period 2014 –
2017 as no CGPFs will be operational until 2017 as advised by Arrow. The Arrow LNG Plant is expected to be
decommissioned by 2042; however, it was assumed that the gas will be redirected to a new LNG plant after
2042.
A.9.2.2 Emissions Associated with Downstream Processing of Coal Seam Gas
In order to estimate the emissions associated with the downstream processing of CSG to produce and
export LNG, the scope 1 and scope 2 annual emissions associated with the “partial auxiliary power
import case” (or “partial power mode”) scenario from the Arrow LNG plant SREIS were used. This
scenario was selected as it is anticipated to yield the highest emissions for the Arrow LNG Plant project
(refer to Arrow LNG EIS Greenhouse Gas chapter (PAEHolmes, 2012)). The fugitive losses from gas
transmission to Arrow LNG Plant were then excluded from the total scope 1 and scope 2 emissions.
Scope 3 emissions of CO2 CH4 and N2O based on the Arrow LNG Plant estimated scope 1 and scope 2
annual emissions for the “partial auxiliary power import case” option for four LNG trains were scaled
down to the amount of CSG delivered by the project as follows:
where:
= Scope 3 emissions of gas type (j) associated with downstream
gas processing in the year
(t CO2-e/a)
= Scope 1 and scope 2 emissions of gas type (j) associated with
gas processing at Arrow LNG Plant in the year
(t CO2-e/a)
= Total amount of gas fed to Arrow LNG from the project (Sm3/a)
= Total amount of gas processed downstream for four LNG trains
(Arrow LNG Plant)
(Sm3/a)
The equation below presents the energy balance used to determine the total amount of gas fed to
Arrow LNG Plant from the project. The second equation below was used to convert CO2 equivalent
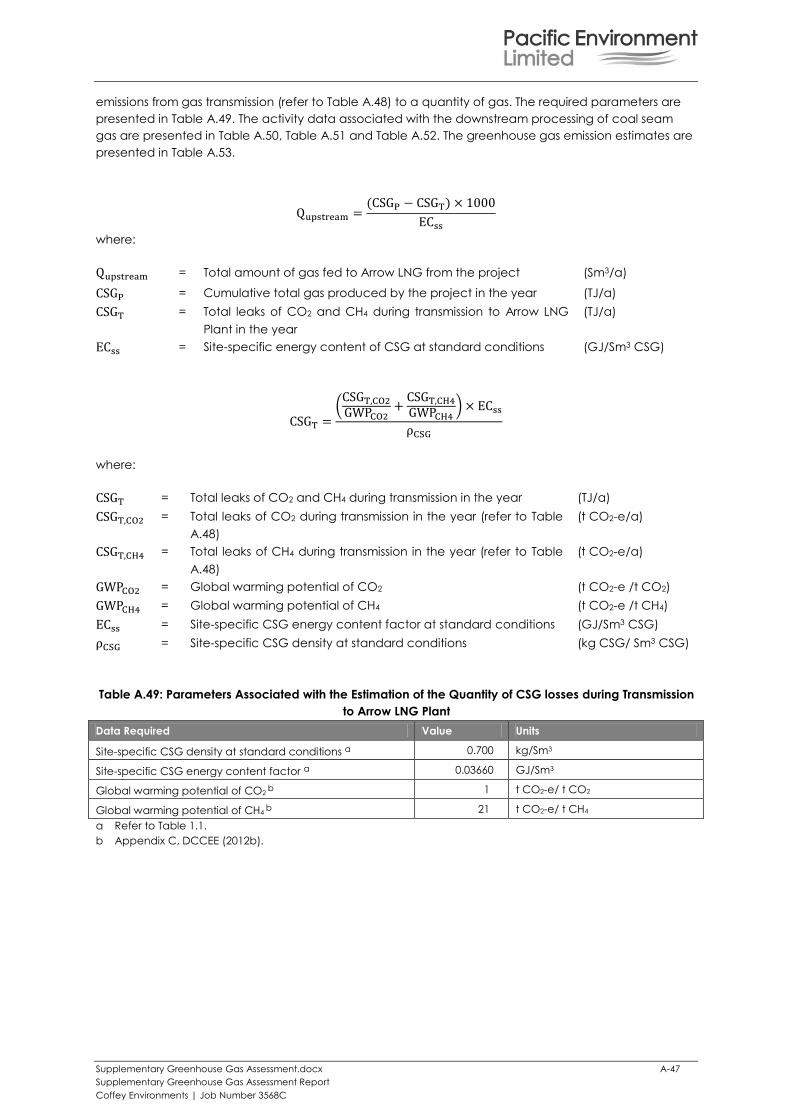
Supplementary Greenhouse Gas Assessment.docx A-47
Supplementary Greenhouse Gas Assessment Report
Coffey Environments | Job Number 3568C
emissions from gas transmission (refer to Table A.48) to a quantity of gas. The required parameters are
presented in Table A.49. The activity data associated with the downstream processing of coal seam
gas are presented in Table A.50, Table A.51 and Table A.52. The greenhouse gas emission estimates are
presented in Table A.53.
where:
= Total amount of gas fed to Arrow LNG from the project (Sm3/a)
= Cumulative total gas produced by the project in the year (TJ/a)
= Total leaks of CO2 and CH4 during transmission to Arrow LNG
Plant in the year
(TJ/a)
= Site-specific energy content of CSG at standard conditions (GJ/Sm3 CSG)
where:
= Total leaks of CO2 and CH4 during transmission in the year (TJ/a)
= Total leaks of CO2 during transmission in the year (refer to Table
A.48)
(t CO2-e/a)
= Total leaks of CH4 during transmission in the year (refer to Table
A.48)
(t CO2-e/a)
= Global warming potential of CO2 (t CO2-e /t CO2)
= Global warming potential of CH4 (t CO2-e /t CH4)
= Site-specific CSG energy content factor at standard conditions (GJ/Sm3 CSG)
= Site-specific CSG density at standard conditions (kg CSG/ Sm3 CSG)
Table A.49: Parameters Associated with the Estimation of the Quantity of CSG losses during Transmission
to Arrow LNG Plant
Data Required Value Units
Site-specific CSG density at standard conditions a 0.700 kg/Sm3
Site-specific CSG energy content factor a 0.03660 GJ/Sm3
Global warming potential of CO2 b 1 t CO2-e/ t CO2
Global warming potential of CH4 b 21 t CO2-e/ t CH4
a Refer to Table 1.1.
b Appendix C, DCCEE (2012b).
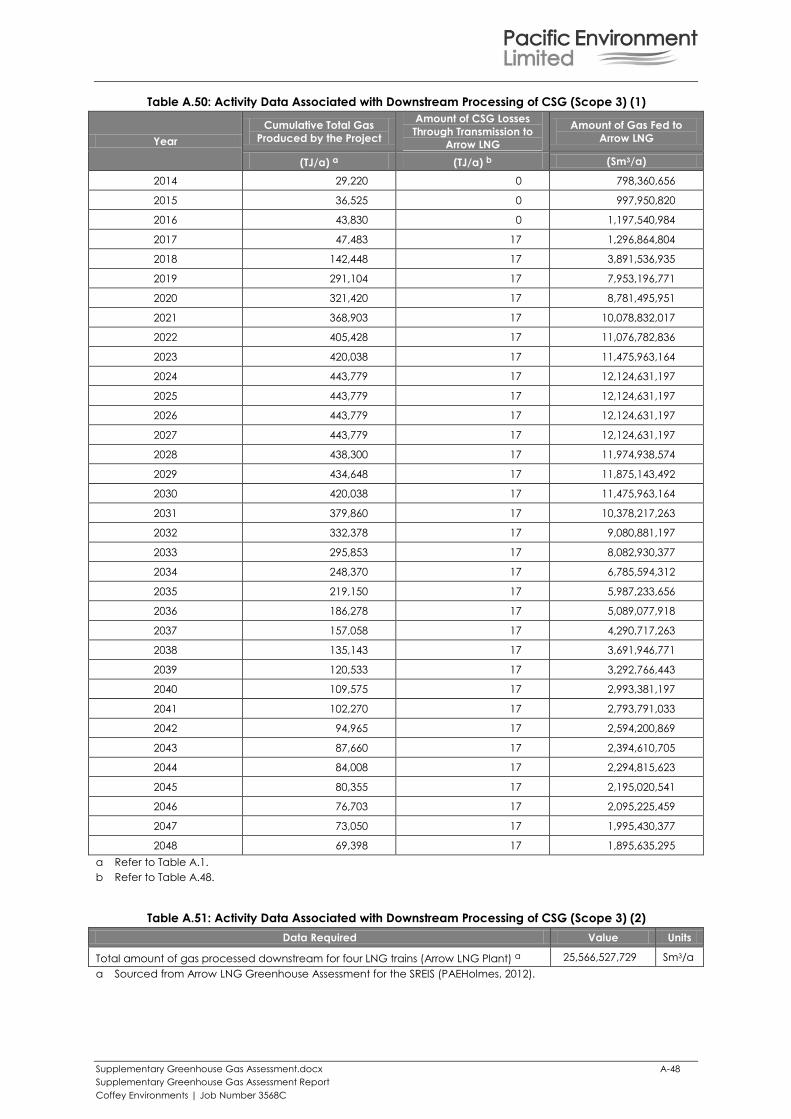
Supplementary Greenhouse Gas Assessment.docx A-48
Supplementary Greenhouse Gas Assessment Report
Coffey Environments | Job Number 3568C
Table A.50: Activity Data Associated with Downstream Processing of CSG (Scope 3) (1)
Year
Cumulative Total Gas
Produced by the Project
Amount of CSG Losses
Through Transmission to
Arrow LNG
Amount of Gas Fed to
Arrow LNG
(TJ/a) a (TJ/a) b (Sm3/a)
2014 29,220 0 798,360,656
2015 36,525 0 997,950,820
2016 43,830 0 1,197,540,984
2017 47,483 17 1,296,864,804
2018 142,448 17 3,891,536,935
2019 291,104 17 7,953,196,771
2020 321,420 17 8,781,495,951
2021 368,903 17 10,078,832,017
2022 405,428 17 11,076,782,836
2023 420,038 17 11,475,963,164
2024 443,779 17 12,124,631,197
2025 443,779 17 12,124,631,197
2026 443,779 17 12,124,631,197
2027 443,779 17 12,124,631,197
2028 438,300 17 11,974,938,574
2029 434,648 17 11,875,143,492
2030 420,038 17 11,475,963,164
2031 379,860 17 10,378,217,263
2032 332,378 17 9,080,881,197
2033 295,853 17 8,082,930,377
2034 248,370 17 6,785,594,312
2035 219,150 17 5,987,233,656
2036 186,278 17 5,089,077,918
2037 157,058 17 4,290,717,263
2038 135,143 17 3,691,946,771
2039 120,533 17 3,292,766,443
2040 109,575 17 2,993,381,197
2041 102,270 17 2,793,791,033
2042 94,965 17 2,594,200,869
2043 87,660 17 2,394,610,705
2044 84,008 17 2,294,815,623
2045 80,355 17 2,195,020,541
2046 76,703 17 2,095,225,459
2047 73,050 17 1,995,430,377
2048 69,398 17 1,895,635,295
a Refer to Table A.1.
b Refer to Table A.48.
Table A.51: Activity Data Associated with Downstream Processing of CSG (Scope 3) (2)
Data Required Value Units
Total amount of gas processed downstream for four LNG trains (Arrow LNG Plant) a 25,566,527,729 Sm3/a
a Sourced from Arrow LNG Greenhouse Assessment for the SREIS (PAEHolmes, 2012).
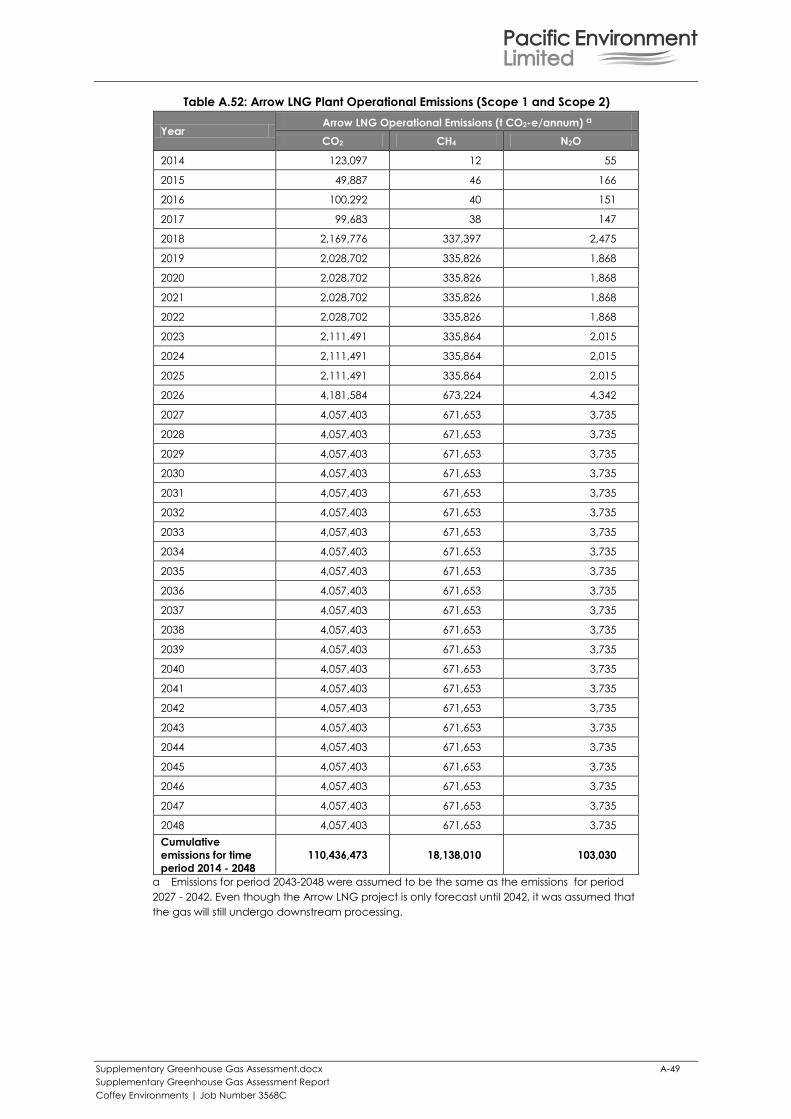
Supplementary Greenhouse Gas Assessment.docx A-49
Supplementary Greenhouse Gas Assessment Report
Coffey Environments | Job Number 3568C
Table A.52: Arrow LNG Plant Operational Emissions (Scope 1 and Scope 2)
Year Arrow LNG Operational Emissions (t CO2-e/annum) a
CO2 CH4 N2O
2014 123,097 12 55
2015 49,887 46 166
2016 100,292 40 151
2017 99,683 38 147
2018 2,169,776 337,397 2,475
2019 2,028,702 335,826 1,868
2020 2,028,702 335,826 1,868
2021 2,028,702 335,826 1,868
2022 2,028,702 335,826 1,868
2023 2,111,491 335,864 2,015
2024 2,111,491 335,864 2,015
2025 2,111,491 335,864 2,015
2026 4,181,584 673,224 4,342
2027 4,057,403 671,653 3,735
2028 4,057,403 671,653 3,735
2029 4,057,403 671,653 3,735
2030 4,057,403 671,653 3,735
2031 4,057,403 671,653 3,735
2032 4,057,403 671,653 3,735
2033 4,057,403 671,653 3,735
2034 4,057,403 671,653 3,735
2035 4,057,403 671,653 3,735
2036 4,057,403 671,653 3,735
2037 4,057,403 671,653 3,735
2038 4,057,403 671,653 3,735
2039 4,057,403 671,653 3,735
2040 4,057,403 671,653 3,735
2041 4,057,403 671,653 3,735
2042 4,057,403 671,653 3,735
2043 4,057,403 671,653 3,735
2044 4,057,403 671,653 3,735
2045 4,057,403 671,653 3,735
2046 4,057,403 671,653 3,735
2047 4,057,403 671,653 3,735
2048 4,057,403 671,653 3,735
Cumulative
emissions for time
period 2014 - 2048
110,436,473 18,138,010 103,030
a Emissions for period 2043-2048 were assumed to be the same as the emissions for period
2027 - 2042. Even though the Arrow LNG project is only forecast until 2042, it was assumed that
the gas will still undergo downstream processing.
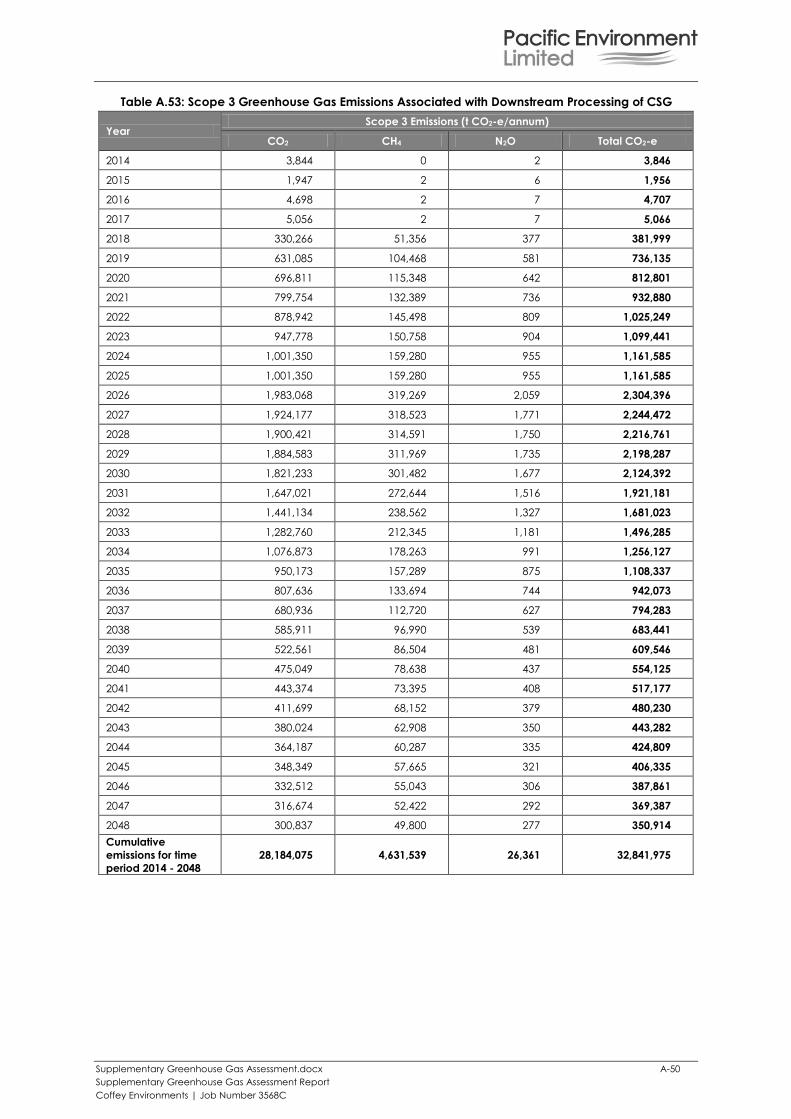
Supplementary Greenhouse Gas Assessment.docx A-50
Supplementary Greenhouse Gas Assessment Report
Coffey Environments | Job Number 3568C
Table A.53: Scope 3 Greenhouse Gas Emissions Associated with Downstream Processing of CSG
Year Scope 3 Emissions (t CO2-e/annum)
CO2 CH4 N2O Total CO2-e
2014 3,844 0 2 3,846
2015 1,947 2 6 1,956
2016 4,698 2 7 4,707
2017 5,056 2 7 5,066
2018 330,266 51,356 377 381,999
2019 631,085 104,468 581 736,135
2020 696,811 115,348 642 812,801
2021 799,754 132,389 736 932,880
2022 878,942 145,498 809 1,025,249
2023 947,778 150,758 904 1,099,441
2024 1,001,350 159,280 955 1,161,585
2025 1,001,350 159,280 955 1,161,585
2026 1,983,068 319,269 2,059 2,304,396
2027 1,924,177 318,523 1,771 2,244,472
2028 1,900,421 314,591 1,750 2,216,761
2029 1,884,583 311,969 1,735 2,198,287
2030 1,821,233 301,482 1,677 2,124,392
2031 1,647,021 272,644 1,516 1,921,181
2032 1,441,134 238,562 1,327 1,681,023
2033 1,282,760 212,345 1,181 1,496,285
2034 1,076,873 178,263 991 1,256,127
2035 950,173 157,289 875 1,108,337
2036 807,636 133,694 744 942,073
2037 680,936 112,720 627 794,283
2038 585,911 96,990 539 683,441
2039 522,561 86,504 481 609,546
2040 475,049 78,638 437 554,125
2041 443,374 73,395 408 517,177
2042 411,699 68,152 379 480,230
2043 380,024 62,908 350 443,282
2044 364,187 60,287 335 424,809
2045 348,349 57,665 321 406,335
2046 332,512 55,043 306 387,861
2047 316,674 52,422 292 369,387
2048 300,837 49,800 277 350,914
Cumulative
emissions for time
period 2014 - 2048
28,184,075 4,631,539 26,361 32,841,975