Greenhouse Gas and Energy Footprint (Life Cycle...
24
Greenhouse Gas and Energy Footprint (Life Cycle Assessment) of California Almond Production Project No.: 11-AIR8-Kendall Project Leader: Alissa Kendall Department of Civil and Environmental Engineering UC Davis One Shields Ave. Davis, CA 95616 530.752.5722 [email protected] Project Cooperators and Personnel: Elias Marvinney, Graduate Group in Horticulture and Agronomy, UC Davis Sonja Brodt, UC Sustainable Agriculture Research and Education Program, Agricultural Sustainability Institute, UC Davis Weiyuan Zhu, formerly with the Graduate Group in Soils and Biogeochemistry, UC Davis Juhong Yuan, Graduate Program in Civil and Environmental Engineering, UC Davis Almond Board of California - 1 - 2011.2012 Annual Research Report
Transcript of Greenhouse Gas and Energy Footprint (Life Cycle...

Greenhouse Gas and Energy Footprint (Life Cycle Assessment)
of California Almond Production Project No.: 11-AIR8-Kendall Project Leader: Alissa Kendall Department of Civil and Environmental Engineering UC Davis One Shields Ave. Davis, CA 95616 530.752.5722 [email protected] Project Cooperators and Personnel: Elias Marvinney, Graduate Group in Horticulture and Agronomy, UC Davis Sonja Brodt, UC Sustainable Agriculture Research and Education Program, Agricultural Sustainability Institute, UC Davis Weiyuan Zhu, formerly with the Graduate Group in Soils and Biogeochemistry, UC Davis Juhong Yuan, Graduate Program in Civil and Environmental Engineering, UC Davis
Almond Board of California - 1 - 2011.2012 Annual Research Report

Table of Contents 1. Objectives ................................................................................................................ 3 2. Interpretive Summary ............................................................................................... 3
2.1 Model Summary .................................................................................................. 3 2.2 Preliminary Model Results .................................................................................. 4
3. Materials and Methods ............................................................................................. 5 3.1 Life Cycle Assessment Methodology .................................................................. 5
3.1.1 Goal and Scope Definition ............................................................................ 6 3.1.2 System Definition and System Boundaries ................................................... 8 3.1.3 Functional Unit.............................................................................................. 8 3.1.4 Allocation ...................................................................................................... 8 3.1.5 Life Cycle Inventory (LCI) ........................................................................... 10
3.2 Data Sources and Models................................................................................. 10 3.2.1 UC Davis Cost Studies ............................................................................... 10 3.2.2 Survey and Interview .................................................................................. 11
3.2.2.1 Hulling and Shelling Operations ........................................................... 11 3.2.2.2 Biomass power from orchard biomass ................................................. 12
3.2.3 Irrigation Energy Model .............................................................................. 12 3.2.4 Combustion Emissions Model .................................................................... 12 3.2.5 Field Emissions Model ................................................................................ 13 3.2.6 Transportation Model .................................................................................. 13 3.2.7 Global Warming Potential ........................................................................... 13 3.2.8 Carbon Credits from Co-Products and Carbon Sequestration .................... 14 3.2.9 Life Cycle Assessment Model .................................................................... 15
4. Results and Discussion .......................................................................................... 16 4.1 Scenario Analysis ............................................................................................. 18
Appendix 1. OFFROAD Model and Equipment Emissions Calculations in the LCA Model ......................................................................................................................... 19 Appendix 2. N2O Emissions Estimation Method ........................................................ 21 6. References ............................................................................................................. 23
Almond Board of California - 2 - 2011.2012 Annual Research Report

1. Objectives: This project calculates the life cycle greenhouse gas (GHG) emissions and life cycle energy (or energy and carbon footprint) of California almond production from field production through hulling and shelling operations. The study was conducted in two parts – the first part characterized energy and emissions from nursery to farm-gate (harvested almonds) for one acre of almond orchard, and the second part from farm-gate through hulling and shelling operations. Calculating life cycle emissions and energy means that every phase of the life cycle is modeled, including nursery production of almond saplings, orchard establishment, field operations, chemical and material inputs to the orchard, field emissions, transportation, hulling and shelling, and the production of co-products and byproducts from the field (orchard biomass) and from processing (hulls, shells, and woody waste). At every life cycle stage the upstream impacts, which refers to the full supply chain energy and emissions, for all the inputs to the system, such as chemical manufacturing, fuel production, etc. are included. For part 1 of the analysis the following environmental flows are considered over a 25-year period, the assumed productive lifespan of a block of almond orchard: 1. Total GHG emissions – kilograms of carbon dioxide equivalent (CO2e) 2. Total energy inputs – megajoules (MJ) of fossil and renewable energy. 3. Biomass accumulation – mass of CO2e stored in almond tree biomass. 4. Carbon sequestration in orchard floor soil, though this is set to zero in the current
model. 5. Biomass removed from orchards and their fate. For part 2, annual energy and emissions were considered for a ‘typical’ hulling and shelling facility and the following environmental flows were quantified: 1. Transport of harvested almonds to hulling and shelling facilities 2. Hulling and shelling energy use 3. Hulling and shelling emissions from energy use 4. Production of hulls and shells, as well as other co-products of almond processing 2. Interpretive Summary: Since the last annual report a number of advancements to the energy and carbon footprint model have been made. The following list summarizes the most significant of those advancements: 1. Improved detail and precision in estimating irrigation water and energy use. 2. Improved detail and precision in calculating biopower generated from almond
orchard waste. 3. Inclusion of hulling and shelling operations in the modeling system boundary,
resulting in a new functional unit, 1 kg or 1 lb of almond kernel. 2.1 Model Summary This analysis uses a life cycle assessment (LCA) approach to assess net energy use and GHG emissions in almond production. The research was conducted in two stages: (1) orchard production of in-shell almonds, and (2) transport from the orchard, and
Almond Board of California - 3 - 2011.2012 Annual Research Report

hulling and shelling. The almond orchard production system is broken down into separate modules analyzing external or custom operations (nursery production, orchard clearing, and harvest), in-field operations (equipment use, soil GHG emissions), and material inputs to the orchard (fertilizer and pesticide quantities). The LCA model (Figure 1) accounts for the separate life cycle phases within each of these modules, such as raw material extraction, processing, and manufacturing of a product; transportation of the product; and on-farm use of the product. The model also accounts for the variations in field operations, material and fuel use, biomass accumulation, and almond yield on a year-to-year basis. Year 0 includes orchard clearing and land preparation; years 1 and 2 include almond sapling production, planting, and orchard establishment; years 3 to 6 include increasing inputs, tree growth, and increasing almond yields; and years 7 to 25 mark tree maturity, constant inputs (fertilizer and pesticides), and constant yields. Throughout the orchard life span a percent of tree die-off and replacement is accounted for as well. Data were collected from a variety of sources. The primary sources for direct material, chemical, and water inputs to cultivation, field operation types and times, and equipment types were UC Davis Department of Agricultural and Resource Economics (ARE) Cost and Return studies for almond production (Viveros, Freeman et al. 2003; Connell, Edstrom et al. 2006; Duncan, Verdegaal et al. 2006; Duncan, Verdegaal et al. 2006; Freeman, Viveros et al. 2006; Duncan, Verdegaal et al. 2011); surveys and interviews of growers, orchard managers, and custom operators; life cycle inventory databases (Ecoinvent Centre 2008; PE International 2009); geographic information systems (GIS) analysis; and various models for combustion (California Air Resources Board 2007) and field emissions. The sum of emissions and energy inputs for all of these components was calculated for each year of the orchard's lifespan. Emissions were separated by management category – pest management, nutrient management, and other management (which includes nursery sapling production, harvest, pruning, pollination, general maintenance, and irrigation) -- and also by input type. This differentiation allows identification of the major contributors to overall GHG and energy footprints. Energy use is presented as megajoules (MJ) or gigajoules (GJ = MJ×1000) per acre, and GHG emissions are presented in units of kg of CO2e per acre. CO2e is a summary indicator for GHG emissions. Other GHGs are normalized to CO2e using their respective global warming potentials (GWPs) from the Intergovernmental Panel on Climate Change (IPCC) (Intergovernmental Panel on Climate Change 2007). In this study the following GHGs are included: carbon dioxide (CO2), nitrous oxide (N2O), methane (CH4), and sulfur hexafluoride (SF6). 2.2 Preliminary Model Results Based on the current model, one acre of almond production is responsible for approximately 45,240 kg CO2e emissions and credits of 36,731 kg CO2e, resulting in net emissions of 8,509 kg CO2e. On an energy basis, one acre of almond production is responsible for approximately 668 GJ of energy use and 152 GJ of energy credits,
Almond Board of California - 4 - 2011.2012 Annual Research Report
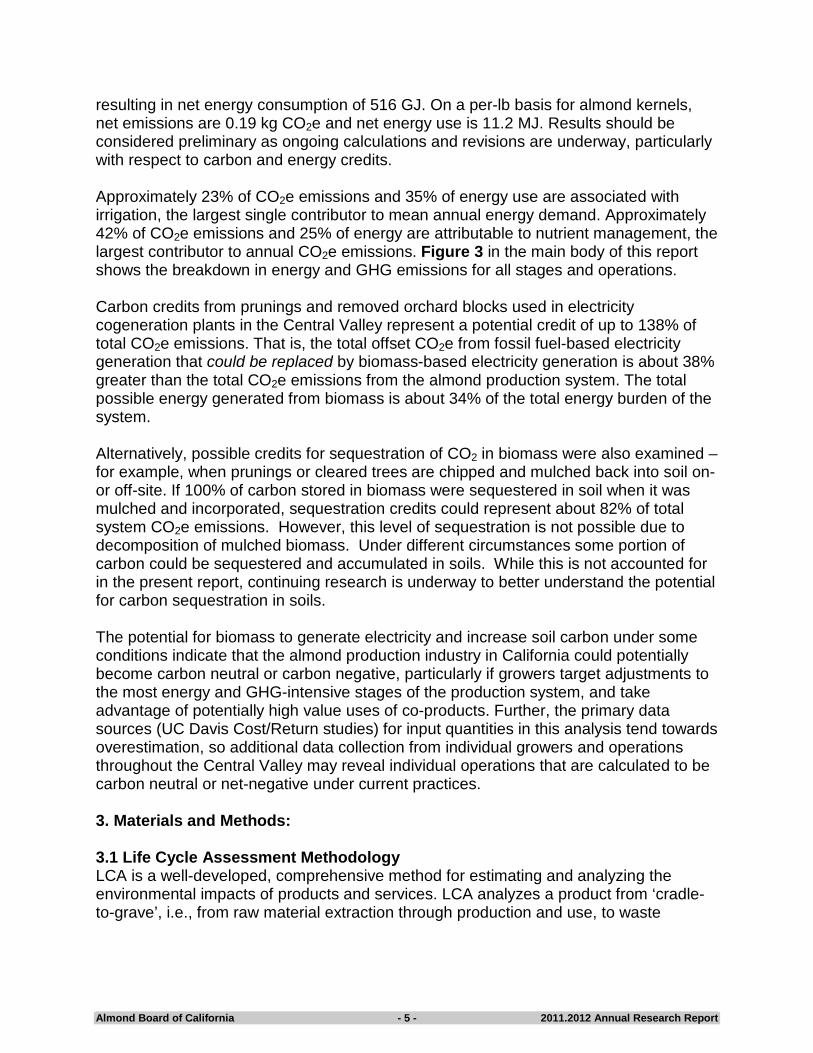
resulting in net energy consumption of 516 GJ. On a per-lb basis for almond kernels, net emissions are 0.19 kg CO2e and net energy use is 11.2 MJ. Results should be considered preliminary as ongoing calculations and revisions are underway, particularly with respect to carbon and energy credits. Approximately 23% of CO2e emissions and 35% of energy use are associated with irrigation, the largest single contributor to mean annual energy demand. Approximately 42% of CO2e emissions and 25% of energy are attributable to nutrient management, the largest contributor to annual CO2e emissions. Figure 3 in the main body of this report shows the breakdown in energy and GHG emissions for all stages and operations. Carbon credits from prunings and removed orchard blocks used in electricity cogeneration plants in the Central Valley represent a potential credit of up to 138% of total CO2e emissions. That is, the total offset CO2e from fossil fuel-based electricity generation that could be replaced by biomass-based electricity generation is about 38% greater than the total CO2e emissions from the almond production system. The total possible energy generated from biomass is about 34% of the total energy burden of the system. Alternatively, possible credits for sequestration of CO2 in biomass were also examined – for example, when prunings or cleared trees are chipped and mulched back into soil on- or off-site. If 100% of carbon stored in biomass were sequestered in soil when it was mulched and incorporated, sequestration credits could represent about 82% of total system CO2e emissions. However, this level of sequestration is not possible due to decomposition of mulched biomass. Under different circumstances some portion of carbon could be sequestered and accumulated in soils. While this is not accounted for in the present report, continuing research is underway to better understand the potential for carbon sequestration in soils. The potential for biomass to generate electricity and increase soil carbon under some conditions indicate that the almond production industry in California could potentially become carbon neutral or carbon negative, particularly if growers target adjustments to the most energy and GHG-intensive stages of the production system, and take advantage of potentially high value uses of co-products. Further, the primary data sources (UC Davis Cost/Return studies) for input quantities in this analysis tend towards overestimation, so additional data collection from individual growers and operations throughout the Central Valley may reveal individual operations that are calculated to be carbon neutral or net-negative under current practices. 3. Materials and Methods: 3.1 Life Cycle Assessment Methodology LCA is a well-developed, comprehensive method for estimating and analyzing the environmental impacts of products and services. LCA analyzes a product from ‘cradle-to-grave’, i.e., from raw material extraction through production and use, to waste
Almond Board of California - 5 - 2011.2012 Annual Research Report

management and disposal. Here, the analysis begins at the nursery that produces almond saplings and ends after hulling and shelling. We use a process-based LCA approach, which directly measures and tracks material and energy flows through each of the phases in the life cycle of the product. Our LCA methodology conforms to the standards of the International Organization for Standardization (ISO) 14040 series on LCA, with the exception of peer review. A peer reviewed journal article will be developed and serve as a surrogate for an ISO peer review process. A standard LCA framework consists of the following distinct steps: 1. Goal and scope definition, which includes defining the system boundary and
functional unit of analysis. 2. Life cycle inventory, which includes identification and quantification of all inputs at
each stage of the life cycle included within the system boundary. 3. Impact analysis - in this study, GHG emissions at each stage of the life cycle are
characterized using GWPs into CO2e. 4. Interpretation, which occurs throughout the analysis and in the discussion and
conclusions of the results. 3.1.1 Goal and scope definition The goal of this project was to establish a life cycle GHG emissions and energy inventory for CA almonds. In addition, we identified operations and inputs that contribute the most to total emissions over the almond production and processing life cycle; so-called ‘hotspots’. Finally, we estimated the potential credits to the almond production system for offsetting energy production from fossil fuels by generating biomass for electric power generation. For the nursery to farm-gate part of the study, the modeled system is one acre of representative almond orchard for the typical productive lifespan of an almond tree, 25 years. As described in the Interpretive Summary, the lifespan is divided into categories that reflect different input demand and growth: years 0 through 6 which include orchard clearing, land preparation, orchard establishment and tree growth and maturation (at year 7), years 7 through 25 where tree maturity and maximum yield are reached and treated identically in the model. The area of orchard modeled is assumed to be established on land previously occupied by an almond orchard, and will be replaced with almond orchard at the end of its productive lifespan. No changes in land use type are considered. Flood, drip, and microsprinkler irrigation systems are modeled. The second part of the study includes transport of harvested almonds to a hulling and shelling facility, and the hulling and shelling operations. Those operations are modeled based on process fuel and electricity use only. The study’s system boundary (Figure 1) includes (1) emissions from material and energy flows from external operations (fuel and agrochemical manufacture, orchard clearing, nursery tree production, and harvest), (2) combustion emissions from
Almond Board of California - 6 - 2011.2012 Annual Research Report

operations in the field, (3) soil emissions from fertilizer application, (4) emissions from the transport of materials and equipment to the orchard as well as transport of biomass to cogeneration plants, (5) transport of in-shell harvested almonds to hulling and shelling facility, (6) hulling and shelling operations.
Figure 1. LCA System Boundary and Flow Diagram for California Almond Production.
Almond Board of California - 7 - 2011.2012 Annual Research Report

3.1.2 System Definition and System Boundaries The inputs to the almond production system can be divided into two categories: energy and materials. To calculate life cycle energy use, the upstream burdens of producing the energy resource or fuel are included. The study ends at the hulling and shelling facility. Additional processing and distribution of almond products is not included. Equipment manufacturing and construction of buildings are excluded from the system boundary of this study as well, which is consistent with the treatment of long-term capital investments in other LCA studies. Agricultural equipment lasts a relatively long time, and may have multiple uses and so is unlikely to have a major impact on the results of this analysis; however, inclusion of equipment manufacturing may be analyzed in a future project. The end-of-life (recycling/disposal/reuse) of materials is included only for orchard biomass and hulls and shells, which may be directed either to cogeneration plants for production of electricity, used for mulch or fill, or as bedding or feed (for hulls and shells). The exclusion of packaging and packing disposal for inputs (i.e. pesticides, fertilizers, etc.) is not expected to be significant for the accuracy of the model. 3.1.3 Functional Unit The functional unit of this LCA is a mass of almond kernel, typically reported as one kilogram (kg) or one pound (lb). For practical reasons, orchard production is modeled based on a single acre of almond orchard assessed over a 26 year time horizon for all inputs and outputs. Orchard yield is based on reported units of mass (kg or lb) of almond kernels per acre, which is then adjusted to include mass of hulls and shells as well. Yield is not constant over the orchard lifespan: it is zero in years 0 through 2, increases from years 3 through 6, and remains stable from years 7 through 25. In turn, emissions per kilogram yield will not be constant year-to-year, so averaging over the orchard lifespan is required. The mass of almond kernels plus hulls and shells is the modeling input to the hulling and shelling operations model. After hulling and shelling operations the functional unit of mass (kg or lb) of almond kernel is reported. The functional unit can easily be converted to nutritional units, such as calories of food energy, grams of protein, or another measure of nutrition. This conversion allows comparison of the life cycle energy and emissions of almonds to other food products; however, these conversions are challenging since none is representative of all of the nutritional value of a particular food. We do not convert the functional unit to nutritional value in this report, nor do we compare results to other food products. 3.1.4 Allocation Allocation is the process by which environmental flows associated with a system are divided among various outputs from a single industrial process (i.e. co-products). The ISO14040 LCA standards (Technical Committee ISO/TC207- Environmental Management 2006) favor avoiding allocation calculations by subdividing the production system; assigning each production step or input to a particular co-product. This is rarely
Almond Board of California - 8 - 2011.2012 Annual Research Report
possible, especially for agricultural systems where inputs that benefit different parts of a plant cannot be clearly distinguished. Alternatively, allocation can be avoided by expanding the system boundaries to include all the co-products, though in practice this approach is implemented as ‘displacement’ or ‘substitution’. These terms refer to a process where the production system is credited with avoiding production or displacing substitutable products in the market. This process is often challenging for agricultural systems, since co-products usually substitute for other co-products (i.e. almond shells used as bedding substitute for rice hulls used as bedding). When neither subdivision nor substitution is viable, then the standards recommend allocation based on the physical properties of co-products, such as mass or energy content. Finally, economic allocation may be used as a last resort according to the ISO. However, some researchers have argued that economic allocation is the best approach, since it reflects the drivers for a business (Ekvall and Finnveden 2001; Guinée, Gorrée et al. 2002), and a physical basis of comparison may not properly reflect the purposes of a production system. For example if allocation is pursued on a mass-basis for almond orchard co-products the vast majority of the GHG and energy footprint would be assigned to orchard waste biomass, this would be true for energy-content based allocation as well. Such an allocation clearly does not reflect the primary economic driver of almond orchard production systems, the production of almonds. In this study, co-products from the orchard include orchard waste biomass, both non-productive trees and prunings. There are a number of potential fates for these materials including mulching and incorporation in the field, burning (though this is highly restricted), or removal and combustion for electricity. For the first two cases no carbon sequestration or co-product value is considered in the current model, in the last case where electricity is generated, co-products are handled using the displacement method. This is done by assuming that electricity generated from almond orchard waste displaces electricity from the average California grid electricity fuel mix. Economic allocation was used in two of the sub-modules of the almond production LCA model, nursery production and pollination. In both cases data limitations and practical limitations prevented the use of other methods for handling co-products. For almond sapling production, total nursery inputs and GHG emissions were allocated to almond saplings based on the percentage of total gross nursery income from almond sapling sales. In the case of pollination, a previous LCA of US honey production conducted by the PI’s research team (Kendall et al. 2012)) was used as a data source to infer the energy and emissions associated with pollination. The honey LCA examined beekeeping operations in the continental US and estimated total GHG and energy burdens associated with honey as a percentage of gross apiary income. The other major component of apiary income is derived from pollination services, and a similar economic allocation was made to estimate the GHG and energy burdens associated with pollination.
Almond Board of California - 9 - 2011.2012 Annual Research Report

Allocation of hulling and shelling operations to co-products (hulls and shells) were calculated using the displacement method based on the possible fates for their use which included feed, bedding, and electricity generation. At this stage of model development, however, only displacement for co-products used in electricity generation are accounted for. In the coming months other uses of hulls and shells will be accounted for as well. 3.1.5 Life Cycle Inventory (LCI) LCI data quantify energy and material inputs as well as emissions for inputs to the system. Most LCI data used in the model come from published academic literature, the Ecoinvent database (last updated in 2011), the GaBi Professional database (last updated in 2011), and the U.S. LCI database (last updated in 2011) accessed through the GaBi 4 software (Ecoinvent Centre 2008; PE International 2009). The Ecoinvent and GaBi databases are proprietary international databases that tally cradle-to-grave environmental impacts of a large array of commonly used and internationally traded industrial materials, products, and natural resources such as oil and gas. The U.S. LCI database is a similar, but open access database, created by the National Renewable Energy Laboratory, and focuses on materials and products produced in the U.S. U.S. data were used where available, but European datasets were used when no U.S. data were available; this was particularly true for pesticide production. Some error may be introduced due to this substitution as European manufacturing standards and regulations differ from those in the US, but it is unlikely to make a significant difference to the overall results of the study due to the relatively small contribution from pesticides to total results. LCI data for California-specific electricity production and truck freight transport were developed using datasets from the GaBi professional database and the appropriate fuel and technology mixes for the state of California. 3.2 Data Sources and Models 3.2.1 UC Davis Cost Studies UC Davis cost and returns studies for various commodities, including almonds, are generated by the UC Davis Department of Agriculture and Resource Economics (ARE) and UC Cooperative Extension. They involve collection of data from growers, orchard managers, and Cooperative Extension farm advisors through survey, interview, and focus groups. Ideally, they provide a picture of the typical nutrient, pesticide, fuel, and water inputs, equipment use patterns, and annual yields for an orchard system under a particular irrigation scheme (flood or microsprinkler) in a particular region (Sacramento Valley, San Joaquin Valley North, San Joaquin Valley South), and omit information on operations, equipment, and inputs associated with custom operations. The general process for generating cost and return studies is to enumerate all likely expenses that could theoretically be incurred in commodity production. In practice, not every grower uses all the listed inputs or processes in a given year; rather, they are only
Almond Board of California - 10 - 2011.2012 Annual Research Report

applied as needed. For this reason, UC Davis cost and return studies are likely to represent an overestimate of total inputs and energy use on a per-acre basis. Despite this likely overestimate, they are used in the current LCA model to provide baseline values for inputs and yields. We hope to refine the baseline values through continued data collection and interviews with growers and orchard managers. 3.2.2 Survey and Interview Additional data were obtained through surveys administered to growers and orchard managers, custom harvest operators, orchard clearing operators, nursery operators, and hulling and shelling facilities. In some cases, in-person interviews were conducted to collect data regarding specific aspects of an operation, particularly equipment use and the time needed for various tasks. Survey response rates have been low, though a sufficient number were obtained to include each of the above operations in this analysis. We expect to continue collecting data in the coming months. In some cases, such as nursery production, only a few operators exist within the state, and surveying even one or two of them captures a large segment of the industry. 3.2.2.1 Hulling and Shelling Operations Five hulling and shelling facilities were surveyed. They provided information on energy consumption during operations and the mass and fates of co-products. These data were used to generate a weighted mean value for energy and fuel use per kilogram almond kernel produced. The following co-product information was gathered in the surveys (Table 1): Table 1. Co-product annual mass and fate: Weighted average for 5 surveyed shelling and hulling operations
Co-Product Fate Mass (kg) % by Mass
Kernel Handler 24,330,652 31.6 In-shell Handler 1,902,324 2.5 Hulls Feed 37,984,437 49.3 Hash Feed 385,006 0.5 Shell Energy 10,992,532 14.3
Woody Biomass Energy 637,894 0.83
Table 2 shows the average direct energy consumption for hulling and shelling activities per kg of kernel produced. This is total facility energy, meaning that energy has not yet been allocated among almond kernel and other co-products.
Almond Board of California - 11 - 2011.2012 Annual Research Report

Table 2: Weighted average direct energy use in hulling and shelling operations
Electricity Propane Diesel Gasoline Total MJ per kg of kernel
produced* 0.55 0.023 0.011 0.0086 0.59
*note, this is unallocated - meaning this is total average energy used in the facility - co-product allocation is not included in the calculations
3.2.2.2 Biomass Power from Orchard Biomass Biomass removed from orchards can be used to generate electricity in one of the many biopower facilities in California. Assuming that 90% of biomass from orchard clearing is used for electricity production in biomass-fueled generation facilities (estimates obtained from interviews and literature search), our model estimates that approximately 156,776 MJ/ac of electricity can be produced over the 25 years of an almond orchards productive lifespan, avoiding up to 47052 kgCO2e/ac emissions from typical fossil-fuel power plants in California. These estimates represent likely electricity generation potential based on interviews of orchard industry representatives and published literature, and verification requires further analysis and data from individual biomass-fueled power facilities in California. Additional description of this process is provided in section 3.2.7, which discusses carbon credits from co-products. 3.2.3 Irrigation Energy Model Previously, irrigation was modeled very simply in our model. However, since the last report significantly more detail and precision has been developed. A geo-spatial model was created that maps irrigation systems and sources of irrigation water, and includes data on upstream energy required for irrigation water in different locations. Geospatial data on almond acreage throughout the Central Valley were overlaid with maps of the three main hydrologic regions of the Central Valley and the California Aqueduct system. Data on irrigation energy for groundwater pumping (Burt, Howes et al. 2003) and energy use at various aqueduct pumping stations (Klein and Krebs 2005) as well as data from the Almond Sustainability Program self-assessments on almond irrigation methods (SureHarvest Inc, unpublished data) were used to generate weighted mean electricity use for almond orchard irrigation throughout the Central Valley. The type of irrigation used was also updated. Separate models were generated for flood and microsprinkler irrigation systems in almond orchards. The results were combined to generate weighted mean values for system emissions and energy consumption, using Almond Sustainability Program data (as above). 3.2.4 Combustion Emissions Model Fuel combustion emissions were modeled using the OFFROAD software package developed by the California Air Resources Board (CARB). This software models fleet emissions by geographic region, and thus may introduce errors based on inaccurate fleet population estimates. For this reason, both the OFFROAD software and a “bottom-
Almond Board of California - 12 - 2011.2012 Annual Research Report
up” model derived from OFFROAD emissions factor data and equipment engine data were used to estimate hourly fuel consumption and emissions. OFFROAD based modeling was used to estimate emissions of CO2, N2O, and CH4 for equipment operation. Appendix 1 of this report includes detailed descriptions of the OFFROAD model and calculation methods used in the LCA model. 3.2.5 Field Emissions Model While a variety of emissions may occur from agricultural fields and soils, in this model only N2O emissions are tracked. The model allows for two types of N2O estimates which are referred to as Tier 1 and Tier 2 by the IPCC (Intergovernmental Panel on Climate Change 2006). Tier 1 IPCC methods are based on global average emissions factors that linearly relate the quantity of nitrogen applied to soils to N2O emissions, irrespective of climate, soil, irrigation, or crop types. Tier 2 methods are intended to better reflect the local conditions and require that region-specific emissions factors based on field testing or other data. We estimate Tier 2 N2O emissions from soils using relevant information based on California conditions and practices for N application rates, irrigation methods, climate and soil. Regional N2O emissions factors, with the irrigation method as a variable, were developed based on these factors. Additional descriptions of the N2O emissions estimation methods used in the model are available in Appendix 2. 3.2.6 Transportation Model Transport distances were obtained through personal communication with chemical manufacturing company representatives, material safety data sheets, and a grey literature search to determine where active ingredients and final formulations are manufactured. Shipping routes were calculated with Google Distance Calculator (Google Inc. and Daft Logic 2011) and primary literature (Kaluza 2010 ). The US freight rail network was mapped in Google Earth Pro, and distances by various routes to the main rail hubs of California were calculated. Average truck transport distances from rail hubs to almond orchards were also calculated in Google Earth Pro, as were average transport distances from nurseries, orchard clearers, and other custom operations. LCI data for fuel use and emissions due to various modes of freight transport were obtained from GaBi US databases (PE International 2009). 3.2.7 Global Warming Potential As described previously, GHG emissions are reported as CO2e emissions by multiplying the mass of a GHG by its GWP. The relative GWP values of the GHGs accounted for in this study (CO2, CH4, N2O, and SF6) are presented in Table 3. The GWPs vary for different time horizons due to the lifespan of individual GHGs in the atmosphere. The LCA model includes time horizons of 20 and 100 years (GWP20 and GWP100, respectively). Total GWP potential for each time horizon was calculated according to Equation 10.
Almond Board of California - 13 - 2011.2012 Annual Research Report

Equation 10. Global warming potential, where mx is total mass of a GHG “x” emitted, and GWPx is the IPCC value for global warming potential of the GHG “x” over time horizon “t”.
GWPtotal = ∑mx × GWPx, t Table 3. IPCC global warming potential values for common GHGs for 20 and 100 year time horizons (t=20 and t=100)
IPCC AR4 GWP Values (CO2 equivalents)
GWP20 GWP100 CO2 1 1 N2O 289 298 CH4 72 25 SF6 16300 22800
3.2.8 Carbon Credits from Co-Products The almond production system can potentially receive carbon credits if byproducts or co-products from the production system have economic use. For example, hulls typically become cattle feed, shells are used for bedding and electricity generation, and prunings and cleared trees may be used for electricity generation. Each of these secondary uses can offset the production of other materials or products (and their accompanying energy and GHG emissions) that would otherwise be required. Carbon sequestration in the soil and tree biomass may also be a source for credits to the production system. As a perennial cropping system, almond orchards accumulate significant woody biomass over their productive lifespan that will be removed either through orchard clearing or pruning activities. Data were collected for biomass removed from cleared orchards – a sample of clearing jobs from 62 different locations in the Central Valley and representing a total of more than 2000 acres was used in estimation of average biomass removed from an acre of almond orchard at the end of its productive life. Published values (Wallace 2007) were used to estimate average prunings removed per acre. A logistic tree growth model was applied to distribute biomass accumulation from year one through year 25, based on the above clearing data and data collected from nursery operators. The percent of clearing biomass going to cogeneration was set at 95%, based on data collected from clearing operators. The amount of prunings going to cogeneration was set at 50%, based on personal communication and published literature (Wallace 2007). Emissions from biomass transport from orchard to cogeneration plant were included in this calculation.
Almond Board of California - 14 - 2011.2012 Annual Research Report
Geospatial data for orchard acreage as well as biomass power plant location were used to determine the mean distance traveled in the Central Valley to deliver biomass to energy facilities. Travel distance and mass calculations for biomass removed from orchards and facility waste residue were used to generate transportation-related emissions. These were then subtracted from the potential credits from displaced average electricity generation using an LCI data for truck freight transport. LCI data for the typical California electricity generation mix and biomass energy content (California Biomass Collaborative 2005; Bioenergy Feedstock Information Network (BFIN) 2010) data were used to calculate the amount of fossil-fuel based energy production offset by the use of almond waste biomass for electricity generation. Most facilities in California directly combust biomass in boilers to generate electricity; however, two facilities use gasification systems. Unlike boiler-based systems, gasification technologies produce a high-carbon byproduct referred to as biochar, which has the potential to sequester carbon over long time horizons. Emissions data for these plants were used to infer the potential carbon contained in biochar, which may be applied to soils to increase soil carbon levels. However, the stability of the carbon in biochar once applied to soils is uncertain; if the carbon is emitted as CO2 then it cannot be considered as ‘sequestered’. This is an area of work where continued research is required before estimates of potential sequestration can be calculated with high confidence, so no long-term sequestration is included in the calculations. A range of potential biomass fates were used to calculate a maximum and minimum for potential co-product credits. These fates included in-field burning of orchard clearing and pruning waste biomass, mulch (incorporation of green biomass/chips into soil), and electricity generation at a biopower plant. For hulls and shells additional potential fates included use as cattle feed and livestock bedding for hulls and shells respectively. It is possible that mulched/chipped orchard waste incorporated into soils could lead to some long term sequestration of carbon; however, since long-term sequestration of carbon in soil is dependent on a complex system of variables including existing soil organic matter, soil type, agricultural practices, and method of incorporation, further investigation and analysis is necessary to quantify potential carbon sequestration. At this time no sequestration credits are considered. 3.2.9 Life Cycle Assessment Model The LCA model is developed in Microsoft Excel. The model is broken down by year, with data for equipment operation hours, equipment type, agrochemical input, and transportation miles entered by row. LCI data for production and transportation emissions as well as model outputs for combustion and field emissions are then calculated based on input mass, operation time, and transportation distance. Global warming potentials are calculated in separate columns from in-row emissions data. All results are then summed. We also disaggregated the results in the following two mutually exclusive ways: first by management category (pest management, nutrient
Almond Board of California - 15 - 2011.2012 Annual Research Report

management, other operations) in order to determine what areas of orchard management contribute the most to total emissions, and second by input type, namely energy (e.g. fuel and electricity) versus material (e.g. agrochemical) inputs. External operations (pollination, nursery production) were modeled elsewhere by similar means and emissions data added in the appropriate years. 4. Results and Discussion: This analysis quantified GHG emissions and energy use on a yearly basis for one acre of “typical” almond orchard and per pound of kernel produced (Table 4 and Figure 2). Improvements to the model since our last report include a weighted average for different irrigation types used throughout California almond orchards, and spatially explicit energy use for irrigation water delivery in different regions. This had significant effects on total energy use for almond production. Also important were the displacement and sequestration credits generated, this significantly changed the outcomes for CO2e emissions. Assumptions regarding energy and chemical inputs as well as model variables are essentially unchanged from the previous report. All results reported below were derived using GWP100.We will compare these results with those derived using GW20 in future publications. We found that over the 25 year productive lifespan of an acre of almond orchard, the mean GHG emissions are 45,240 kg CO2e/acre, reduced to 8,509 kg net CO2e/acre when carbon credits are accounted for. Table 4 includes outcomes for energy and emissions per acre (over 25 years) and pound of kernel. Table 4. Energy and Emissions for Almond Production (Nursery through Hulling)
Over 25-years per Acre Per lb of kernel
No Credits
With Credits
No Credits
With Credits
GHGs (kg CO2e) 45,240 8,509 1.03 0.19 Primary Energy (MJ) 667,777 515,694 15.2 11.8
Figure 3 shows the breakdown in energy and GHG emissions by operation. Approximately 23% of CO2e emissions and 35% of energy use are associated with irrigation, the largest single contributor to mean annual energy demand. Approximately 42% of CO2e emissions and 25% of energy are attributable to nutrient management, the largest contributor to annual CO2e emissions. This is due to the energy and fossil fuel intensive nature of fertilizer production, and N2O emissions from orchards induced by nitrogen fertilizer application. Figure 3 also shows that hulling and shelling do not play a large role in energy and GHG emission compared to orchard production, together comprising less than 4% of CO2e emissions and approximately 7% of energy consumption.
Almond Board of California - 16 - 2011.2012 Annual Research Report

Figure 3 provides an alternative illustration of GHG emissions (and credits) for the production system from year 0 until orchard removal. Figure 3 shown annual fluxes (emissions or sequestration/avoided emissions) for the orchard system. The accumulation and use of biomass for electricity generation moderates the net GHG emissions attributable to almond production.
GWP100 (CO2e) Energy Use (MJ)
Figure 2. Breakdown of GHG emissions and Energy Emissions by Operation
Figure 3. Annual GHG Emissions (in CO2e) for the Almond Orchard Production System
Almond Board of California - 17 - 2011.2012 Annual Research Report

4.1 Scenario Analysis We estimated best-case and worst-case scenarios for theoretical maximum carbon sequestration and offset potential (Figure 4). Worst case assumes 100% orchard clearing and pruning waste is burned in field and all processing waste is mulched (i.e., used as fill). Best case assumes 100% of waste from clearing, pruning, and processing is directed to energy facilities with biochar as a waste product, of which 50% is subject to long-term sequestration. For the current scenario the following assumptions are used: 1. Orchard woody biomass: 90% goes to energy production, 5% of orchard clearing
and pruning waste is mulched, and 5% burned. 2. Processing woody biomass: 90% goes to energy, and 10% mulched 3. Shells: 80% goes to energy, and 20% bedding. 4. Hulls: 100% goes to mulch. This will be updated as data become available for feed
offsets. 5. For all scenarios, no long-term soil carbon sequestration was considered. The only carbon credits generated are from offsets in electricity generation. These results show that energy production from almond waste biomass (prunings, cleared trees, hulls and shells) has the potential to further improve the environmental performance of almond production systems if more biomass was used in energy generation. Moreover, if some long-term sequestration does occur, such as from increasing soil carbon levels or durable uses of wood (i.e. in buildings and furniture) then additional sequestration credits might be achievable.
Figure 4. Possible GHG and energy credits from cogeneration and sequestration as percent of total energy and emissions.
Almond Board of California - 18 - 2011.2012 Annual Research Report

As this is an interim report, we expect calculations for carbon credits to change as our modeling of biomass uses improves (such as hulls used in feed) and as additional data is collected. However, Figure 4 clearly indicates that there may be a potential for almond production to be carbon neutral or even carbon negative if all carbon credits are taken advantage of. We hope to generate more complete findings with specific recommendations by the end of our project. 5. Research Effort - Recent Publications: Marvinney E., Kendall A., Brodt S., Zhu W. (2011). Greenhouse Gas and Energy Use
Footprint of California Almond and Pistachio Production. IERE LCA XI Conference: Instruments for Green Futures Markets. Chicago, IL.
Marvinney E., Kendall A., Brodt S., Zhu W. (2011). Life cycle assessment of energy and greenhouse gas emissions for California almond production. ISIE 6th International Conference on Industrial Ecology: Science, Systems and Sustainability. Berkeley, CA.
Marvinney E., Kendall A., Brodt S. (2011). Greenhouse gas footprint and environmental impacts of the California nut industry: an LCA approach. UC Davis, Interdisciplinary Graduate and Professional Symposium. Davis, CA.
Appendix 1. OFFROAD Model and Equipment Emissions Calculations in the LCA Model The bottom-up model was constructed in Microsoft Excel, using the following parameters obtained from OFFROAD databases for particular equipment and engine types: maximum engine horsepower, load factor, and emission factors (EFs). EFs in this model indicate emissions of a particular GHG per horse-power hour (g/hp*hr), or emission mass per unit energy, and were given for total hydrocarbons (THC), carbon monoxide (CO), nitrogen oxides (NOx), particulate matter (PM), and carbon dioxide (CO2). Further emissions factors for additional GHGs were derived according to equations 1 and 2 (California Air Resources Board 2007). This model also calculates hourly fuel consumption for different engine types, according to equations 3 and 4. Most of the variables and constants used in these equations were obtained from OFFROAD datasets, except for energy efficiency (EE), which was assigned a value of 0.30. Accepted values for combustion engine efficiency range from 0.30 – 0.35 (Oak Ridge National Laboratory 2011). The fuel consumption and emissions outputs of this bottom-up model were compared to values for emissions and fuel consumption based on the top-down population-based results of the published OFFROAD model, as well as to an alternative calculation based on fuel carbon content rather than fuel energy content. Values from all three models were checked against published data, grey literature, and personal communications dealing with fuel consumption and emissions, and the model output most closely matching accepted values was used. In most cases, this value was that obtained
Almond Board of California - 19 - 2011.2012 Annual Research Report

through bottom-up calculation based on energy content, or the official OFFROAD model output. Equation 1. OFFROAD emission factor for nitrous oxide (N2O). N2O is derived from engine NOx emissions. Equation 1 applies to gasoline engines only, because data for diesel engines were not yet available. Therefore, Equation 1 was used as an approximation for calculating diesel N2O emissions.
Equation 2. OFFROAD emission factor for methane (CH4). EFCH4 is derived as a fraction of total hydrocarbons (THC) and varies by fuel type. Fuel type coefficients (CFfuel) are given in Table 1.
Table A1. Fuel type coefficients for OFFROAD CH4 emission factor calculation. C2/C4 refers to 2- and 4-stroke natural gas, and G2 and G4 refer to 2- and 4-stroke gasoline, respectively.
Fuel Type Model Year CFfuel Diesel 0.0755 C2/C4 0.7664
G2 ≥2004 0.0572
1996-2004 0.0558 <=1995 0.0774
G4 ≥2004 0.0572
1996-2004 0.0558 <=1995 0.1132
Equation 3. OFFROAD emissions by engine activity. Equation 3 is used to calculate emissions from various engine and fuel types based on maximum horsepower (HP), hours of engine activity (t), and load factor (LF). Load factor is a unit-less ratio that describes the proportion of maximum HP translated to useable energy under field conditions. The LFs from the OFFROAD database are derived from population-level data and may not accurately reflect conditions in the orchard, and may be adjusted such that fuel consumption and emission values more closely match published data.
Equation 4. Hourly fuel consumption (HFC). Equation 4 is derived from the energy content of specific fuels (Efuel, Table 2) – by determining the amount of energy in fuel necessary to produce a given HP for 1 hour, accounting for engine efficiency (EE), load
Almond Board of California - 20 - 2011.2012 Annual Research Report

factor, and engine activity time (t). EE is estimated at 0.30 – typical range for internal combustion engines is from 0.30 – 0.35 (Oak Ridge National Laboratory 2011).
Table A2. Fuel energy content (Oak Ridge National Laboratory 2010)
Fuel Energy Content
BTU/ gallon MJ/ liter
Gasoline 115000 32 Diesel 130500 36.4
Appendix 2. N2O Emissions Estimation Method The IPCC methods divide N2O emission from managed soils into two parts, the direct and indirect emissions. The pathway of the direct N2O emission is the N2O released directly from the soils to which synthetic N fertilizer is added. The indirect emissions occur through the pathways of (i) volatilization of NH3 and NOX and the subsequent re-deposition of these gases and their products NH4
+ and NO3- to soils and waters; and (ii)
leaching and runoff of N, mainly as NO3-. For California almond orchards, as neither
leaching nor runoff is a major issue, we did not account for the second pathway. Hence our calculation includes the following two parts: (i) direct N2O emissions, (ii) indirect N2O emissions from volatilization, through NH3 and NOx (Figure A1). N2O is emitted from soils of almond orchards through the processes of nitrification and denitrification. In nitrification, N2O is produced as a gaseous intermediate while ammonium is oxidized to nitrate under aerobic conditions. In denitrification, N2O is produced as a by-product from a process where nitrate is reduced to nitrogen gas under anaerobic conditions (Intergovernmental Panel on Climate Change 2006). Two of the major drivers for soil N2O genesis are the availability of inorganic nitrogen (N) in the soil, and the soil aeration conditions (or soil moisture content). The former is mainly controlled by fertilization practices and the latter by irrigation and precipitation events. In the Central Valley, as precipitation is not common during the growing season, it contributes less to N2O genesis than irrigation. Hence fertilization and irrigation are closely related to N2O emissions from the soils of California almond orchards.
Almond Board of California - 21 - 2011.2012 Annual Research Report

Figure A1. Pathways of direct and indirect N2O emissions from California almond orchards The N2O emission factors (EFs) and emission rates (ER) of the three irrigation types are listed in Table A3 below. Table A3. N2O emission factors (EFs) and emission rate (ER) of the three irrigation types
Irrigation type
EF of direct N2O (uncertainty)
EFDirect
EF of indirect N2O through NH3
EFNH3
ER of indirect N2O through NOx
EFNOx
N2O-N/N applied N2O-N/N applied g N2O-N/ha/yr
Flood 0.3% (0.6%) 0.066%
8.6 Microsprinkler 0.25% (0.05%) 0%
Drip 0.63 (0.09%) 0.005%
The EFs of direct N2O for microsprinkler and drip irrigation systems were measured in the field by Alsina and Smart in 2010 (Alsina and Smart 2010). N2O was sampled from the wet area around the emitters of conventional drip and microsprinkler irrigation systems for four fertilization events during the growing season. No field data are available for estimating N2O emissions from fields that use flood irrigation. For the small portion of almond orchards that use flood irrigation, the EF for direct N2O was taken from the Intergovernmental Panel on Climate Change (2006). As the flood irrigation applied in almond orchards in California is intermittent, we adopted
Almond Board of California - 22 - 2011.2012 Annual Research Report
the EF for N2O emissions from N inputs to flooded rice because no flood irrigation emissions factors exist for orchards. The EFs of indirect N2O through NH3 were converted from the field-measured data (Krauter, Potter et al. 2000). Krauter et al. reported that the NH3 EFs of almond orchards for flood, buried drip and microsprinkler irrigations are 6.6%, 0.5%, and 0.0%, respectively. Assuming that 1% of the N in the volatized NH3 is eventually released as N2O in the soils and water of other ecosystems (Intergovernmental Panel on Climate Change 2006), we approximated that the indirect N2O EFs through NH3 for flood, drip and microsprinkler irrigations are 0.066%, 0.005% and 0%, respectively. The ER of indirect N2O through NOx was converted from field measured data (Matson, Firestone et al. 1997). Matson et al. reported that the weighted mean hourly NOx flux is 0.64 g N/ha/hr, measured from drip and flood irrigated almond orchards in San Joaquin Valley. Their measurements were taken within two weeks following four scheduled fertigations (Matson et al., 1997), capturing the peaks of soil NOx emissions during the growing season. Hence we assumed that this hourly NOx flux represented each of the 24 hours of the 14 days after the four fertigation events in that year, or 1344 hours per year. Thus we approximated that the NOx ER is 860 g N/ha/yr. Assuming that 1% of the N in the volatized NOx is eventually released as N2O in the soils and water of other ecosystems, we used 8.6 g N/ha/yr as the indirect N2O ER through NOx in our calculation for the generic condition of California almond orchards, regardless of the irrigation type. 6. References: Alsina, M. M. and D. R. Smart (2010). Direct N2O Emissions for Micro-Sprinkler and
Drip Irrigation Systems Davis, CA, University of California Davis. Bioenergy Feedstock Information Network (BFIN). (2010). from
https://bioenergy.ornl.gov/papers/misc/energy_conv.html. Burt, C., D. Howes, et al. (2003). California Agricultural Water Electrical Energy
Requirements December 2003. San Luis Obispo, CA, Irrigation Training and Research Center (ITCR), California Polytechnic State University.
California Air Resources Board (2007). OFFROAD2007. Mobile Source Emissions Inventory Program. Sacramento, CA.
California Biomass Collaborative (2005). Biomass in California: Challenges, Opportunities, and Potentials for Sustainable Management and Development. Sacramento, CA, California Energy Commission.
Connell, J. H., J. P. Edstrom, et al. (2006). Sample costs to establish an orchard and produce almonds: Sacramento Valley – 2006, low-volume sprinkler. Davis, CA, University of California Cooperative Extension.
Duncan, R. A., P. S. Verdegaal, et al. (2006). Sample costs to establish an orchard and produce almonds: San Joaquin Valley North – 2006, flood irrigation. Davis, CA, University of California Cooperative Extension.
Duncan, R. A., P. S. Verdegaal, et al. (2006). Sample costs to establish an orchard and produce almonds: San Joaquin Valley North – 2006, micro-sprinkler irrigation. Davis, CA, University of California Cooperative Extension.
Almond Board of California - 23 - 2011.2012 Annual Research Report

Duncan, R. A., P. S. Verdegaal, et al. (2011). Sample costs to establish an orchard and harvest almonds: San Joaquin Valley North – Microsprinkler Irrigation. . Davis, CA, University of California Cooperative Extension.
Ecoinvent Centre (2008). ecoinvent Data v2.0. Duebendorf, Switzerland, Swiss Centre for Life Cycle Assessment.
Ekvall, T. and G. r. Finnveden (2001). "Allocation in ISO 14041—a critical review." jOurnal of Cleaner Production 9: 197-208.
Freeman, M. A., M. A. Viveros, et al. (2006). Sample costs to establish an orchard and produce almonds: San Joaquin Valley South – 2008, micro-sprinkler irrigation. Davis, CA, University of California Cooperative Extension.
Google Inc. and Daft Logic. (2011, 2011). "Google Maps Distance Calculator." Retrieved Accessed 06/2011, from http://www.daftlogic.com/projects-google-maps-distance-calculator.htm.
Guinée, M. Gorrée, et al. (2002). Handbook on life cycle assessment: operational guide to the ISO standards.
Intergovernmental Panel on Climate Change (2006). Chapter 11: N2O emissions from managed soils and CO2 emissions from lime and urea application. 2006 IPCC Guidelines for National Greenhouse Gas Inventories, Volume 4: Agriculture, Forestry and Other Land Use. Cambridge.
Intergovernmental Panel on Climate Change (2007). IPCC Fourth Assessment Report: Climate Change 2007 - The Physical Science Basis Cambridge, Cambridge University Press.
Kaluza, P. (2010 ). The Complex Network of Global Cargo Ship Movements. Oldenburg, Germany, Institute for Chemistry and Biology of the Marine Environment.
Klein, G. and M. Krebs (2005). California’s Water – Energy Relationship. Sacramento, CA, California Energy Commission.
Krauter, C., C. Potter, et al. (2000). Ammonia emissions and fertilizer applications in California’s Central Valley. EPA conference report.
Matson, P., M. Firestone, et al. (1997). Agricultural systems in the San Joaquin Valley: development of emissions estimates for nitrogen oxides, California Air Resources Board and the California Environmental Protection Agency.
PE International (2009). GaBi 4 software-system and databases for life cycle engineering.
Technical Committee ISO/TC207- Environmental Management, S. S. L. C. A. (2006). ISO 14044 International Standard: Environmental management – Life cycle assessment – Principals and framework. Geneva, International Organization for Standardization.
Viveros, M. A., M. A. Freeman, et al. (2003). Sample costs to establish an orchard and produce almonds: San Joaquin Valley South - 2003: flood irrigation. Davis, CA, University of California Cooperative Extension.
Wallace, H. N. (2007). Feasibility of a California Energy Feedstock Cooperative. Davis, CA, California Center for Cooperative Development.
Almond Board of California - 24 - 2011.2012 Annual Research Report


![2013 PRODUCT FOOTPRINT REPORT MARCH 12, 2014 …Global Warming ("carbon footprint") [kg CO2-equiv.] : A measure of greenhouse gas emissions, such as CO2 and methane. These emissions](https://static.fdocuments.in/doc/165x107/60de4d1f5e4c5c44de6fdb55/2013-product-footprint-report-march-12-2014-global-warming-carbon-footprint.jpg)