APPENDIX D Air Quality and Greenhouse Gas Assessment ...
83
APPENDIX D Air Quality and Greenhouse Gas Assessment – Addendum
Transcript of APPENDIX D Air Quality and Greenhouse Gas Assessment ...

APPENDIX D
Air Quality and Greenhouse Gas Assessment – Addendum

Report
Wallarah 2 Coal Project Air Quality and Greenhouse Gas Assessment - Addendum
Wyong Areas Coal Joint Venture
Job ID. 20803
4 July 2016

Job ID 20803 | AQU-NW-004-20803 ii
Wallarah 2 Air Quality and Greenhouse Gas Assessment R4.docx
PROJECT NAME: Wallarah 2 Coal Project Air Quality and Greenhouse
Gas Assessment - Addendum
JOB ID: 20803
DOCUMENT CONTROL NUMBER AQU-NW-004-20803
PREPARED FOR: Wyong Areas Coal Joint Venture
APPROVED FOR RELEASE BY: Judith Cox
DISCLAIMER & COPYRIGHT: This report is subject to the copyright statement
located at www.pacific-environment.com © Pacific
Environment Operations Pty Ltd ABN 86 127 101 642
DOCUMENT CONTROL
VERSION DATE PREPARED BY REVIEWED BY
Final V4 04/07/2016 Liza McDonough
Judith Cox Judith Cox
Pacific Environment Operations Pty Ltd: ABN 86 127 101 642
BRISBANE
Level 1, 59 Melbourne Street, South Brisbane Qld 4101
PO Box 3306, South Brisbane Qld 4101
Ph: +61 7 3004 6400
Fax: +61 7 3844 5858
Unit 1, 22 Varley Street
Yeerongpilly, Qld 4105
Ph: +61 7 3004 6460
ADELAIDE
35 Edward Street, Norwood SA 5067
PO Box 3187, Norwood SA 5067
Ph: +61 8 8332 0960
Fax: +61 7 3844 5858
SYDNEY Suite 1, Level 1, 146 Arthur Street
North Sydney, NSW 2060
Ph: +61 2 9870 0900
Fax: +61 2 9870 0999
MELBOURNE
Level 10, 224 Queen Street
Melbourne Vic 3000
Ph: +61 3 9036 2637
Fax: +61 2 9870 0999
PERTH
Level 1, Suite 3
34 Queen Street, Perth WA 6000
Ph: +61 8 9481 4961
Fax: +61 2 9870 0999

Job ID 20803 | AQU-NW-004-20803 iii
Wallarah 2 Air Quality and Greenhouse Gas Assessment R4.docx
DISCLAIMER
Pacific Environment acts in all professional matters as a faithful advisor to the Client and exercises all
reasonable skill and care in the provision of its professional services.
Reports are commissioned by and prepared for the exclusive use of the Client. They are subject to and
issued in accordance with the agreement between the Client and Pacific Environment. Pacific
Environment is not responsible for any liability and accepts no responsibility whatsoever arising from the
misapplication or misinterpretation by third parties of the contents of its reports.
Except where expressly stated, Pacific Environment does not attempt to verify the accuracy, validity or
comprehensiveness of any information supplied to Pacific Environment for its reports.
Reports cannot be copied or reproduced in whole or part for any purpose without the prior written
agreement of Pacific Environment.
Where site inspections, testing or fieldwork have taken place, the report is based on the information
made available by the client or their nominees during the visit, visual observations and any subsequent
discussions with regulatory authorities. The validity and comprehensiveness of supplied information has
not been independently verified and, for the purposes of this report, it is assumed that the information
provided to Pacific Environment is both complete and accurate. It is further assumed that normal
activities were being undertaken at the site on the day of the site visit(s), unless explicitly stated
otherwise.

Job ID 20803 | AQU-NW-004-20803 iv
Wallarah 2 Air Quality and Greenhouse Gas Assessment R4.docx
EXECUTIVE SUMMARY
OVERVIEW
The Wyong Areas Coal Joint Venture (WACJV) is seeking development consent under Division 4.1 of
Part 4 of the Environmental Planning and Assessment Act 1979 (EP&A Act), for the Wallarah 2 Coal
Project (the Project). The Project has been subject to the assessment process under Division 4.1 of Part
4 of the EP&A Act, including a review by the Planning Assessment Commission (PAC). In June 2014, the
PAC concluded that ‘if the recommendations concerning improved strategies to avoid, mitigate or
manage the predicted impacts of the project are adopted, then there is merit in allowing the project
to proceed’.
Following the review by the PAC, the Tooheys Road Site was re-designed to avoid land use conflicts
with third parties. The changes to the design of the Tooheys Road Site (the Amendment) include:
Removal of the previously proposed rail loop;
Re-location of the rail spur and train load out facility to the eastern side of the Main Northern Rail
Line; and
A conveyor system to deliver product coal from the stockpile to the new train load out facility.
Whilst all other aspects of the Project are unchanged from the original proposal, this updated
assessment assesses emissions from all proposed operations (see Section 6.2).
To give effect to the proposed changes to the Project, WACJV is seeking an amendment to the
Development Application (DA) under clause 55 of the Environmental Planning and Assessment
Regulation 2000. This report forms part of the Amendment Document being prepared by Hansen Bailey
to support the application to amend the DA.
This report assesses the air quality and greenhouse gas emissions due to the all operations that form part
of the Project, and where necessary, recommends additional management and mitigation measures
to ameliorate these impacts.
MODIFIED EMISSIONS AND MODELLING
Fugitive dust emissions are expected during construction, and from coal handling and stockpiling at the
Tooheys Road site during operations. This air quality and greenhouse gas assessment (AQGHGA)
presents an update of the previous AQGHGA (PAEHolmes, 2012) Consistent with the previous
AQGHGA, emissions at the Buttonderry Site will occur from the ventilation shaft, and will include
particulate matter and potentially odour. The key pollutant assessed from the flaring of methane in the
previous assessment is oxides of nitrogen (NOx). As there has been no change to the ventilation shaft,
proposed flaring or use of on-site power generators, odour and NOx have not been reassessed.
Discrete receptor locations have been modelled using the same locations as the previous assessment,
with the addition of 10 further receptors in the proximity of the re-located rail spur. Meteorological data
used in the modelling has also been kept consistent with the previous assessment.
An Environmental Monitoring Program for the Project commenced in 1996 providing monthly averages
of dust fallout and 24-hour average TSP and PM10 concentrations. The monitoring data have been
updated and consistent with the previous assessment, the monitoring data collected for the Project has
been used as background concentrations for TSP, PM10 and dust deposition in the region in order to
perform a cumulative assessment. Annual average concentrations of dust deposition, TSP and PM10 -
remain generally below the relevant air quality goals.
Dispersion modelling has been used to predict ground level concentrations (glcs) of key pollutants
associated with the Project. Revised dust emissions during operations have been estimated by

Job ID 20803 | AQU-NW-004-20803 v
Wallarah 2 Air Quality and Greenhouse Gas Assessment R4.docx
analysing the activities taking place for the Project, including those associated with the proposed new
coal transport and load-out activities. Maximum annual predicted TSP, PM10, PM2.5 and dust deposition
concentrations are presented for a maximum production scenario of 5 Mtpa product coal, consistent
with the previous assessment.
The previous assessment determined the maximum 24-hour concentrations based on the modelling of
a maximum daily production scenario. For the purposes of this assessment, the maximum 24-hour
average concentrations have been estimated by calculating the ratio of the maximum 24-hour
average concentrations from the modelling of the maximum annual production scenario and the
maximum daily production scenarios and applying this to the results from this assessment from the
maximum annual production scenario. These ratios have been applied at all receptor sites for PM10
and PM2.5 under the current assessment.
The results of the dispersion modelling indicate that the predicted incremental glcs for PM10, PM2.5, TSP
and dust deposition at the closest residential receptors are all below the impact assessment criteria.
The highest predicted glcs occur at the closest residence to the north of the site (assessment location
P11).
The estimated emissions for construction are 84%, 48% and 22% of the emissions estimated to occur
during operation of the Project for TSP, PM10 and PM2.5 respectively. Therefore compliance with air
quality goals during the operation of the mine would represent compliance during construction.
A cumulative assessment, incorporating existing background levels, indicates that the Project is unlikely
to result in any additional exceedances of relevant impact assessment criteria at the neighbouring
receivers.
NOx emissions associated with the flaring of methane and use in power generation were calculated
during the previous air quality impact and greenhouse gas assessment (PAEHolmes, 2012). NOx
emissions from these sources will not change as a result of the Amendment and have therefore not
been reassessed.
GREENHOUSE GAS ASSESSMENT
A re-assessment of the GHG emissions associated with the revised Project indicates that average
annual scope 1 emissions would represent approximately 0.04% of Australia’s commitment under the
Kyoto Protocol (591.5 Mt CO2-e) and a very small portion of global greenhouse emissions.
The capture and flaring of methane (pre and post mining) will have significant benefits in terms of GHG
emission reductions, resulting in savings of approximately 8 Mt CO2-e or 54% of Scope 1 emissions, over
the Project duration.
AIR QUALITY & GREENHOUSE GAS MANAGEMENT AND MONITORING
The proposed dust management measures for the Project are based on recommendations outlined in
the EPA’s Best Practice Report.
The Project will develop an Energy and Greenhouse Strategy to address interim and long term energy
and greenhouse management plans and initiatives, including monitoring, reporting and continuous
improvement.
The existing monitoring network will be reviewed and augmented for the operation of the Project and
would be outlined in an Air Quality & Greenhouse Gas Management Plan for the Project. It is
recommended that post commissioning verification of the ventilation shaft emissions is conducted
once operational, to validate the assumptions presented in this report.

Job ID 20803 | AQU-NW-004-20803 vi
Wallarah 2 Air Quality and Greenhouse Gas Assessment R4.docx
CONTENTS
1 INTRODUCTION 1 1.1 Revised Layout 1
2 LOCAL SETTING 3
3 AIR QUALITY CRITERIA 7 3.1 Emissions to Air 7 3.2 Particulate Matter and Health Effects 8 3.3 Oxides of Nitrogen 8 3.4 NSW EPA Impact Assessment Criteria/NEPM Standards 8 3.5 NSW Department of Planning and Environment Voluntary Land Acquisition and Mitigation Policy 9 3.6 Other Legislative Requirements 9
3.6.1 NSW Action for Air 9 3.6.2 Protection of the Environment Operations (POEO) Act 1997 10 3.6.3 The Best Practice Report 10
4 EXISTING ENVIRONMENT 11 4.1 Meteorology 11
4.1.1 Local Climatic Conditions 11 4.1.2 Local Wind Data 12
4.2 Existing Ambient Air Quality 17 4.2.1 PM10 and TSP Concentrations 17 4.2.2 Dust Deposition 20 4.2.3 PM2.5 Concentrations 22
4.3 Existing Air Quality for Assessment Purposes 23
5 MODELLING APPROACH 24 5.1 Modelling System 24 5.2 Model Set Up 24 5.3 Dispersion Meteorology 24
6 EMISSIONS TO AIR 26 6.1 Construction Phase 26 6.2 Operation Phase 27
6.2.1 Ventilation Shaft 27 6.2.2 Flare and Gas Engine Emissions 27
6.3 Overview of Best Practice Dust Control 27
7 IMPACT ASSESSMENT 31 7.1 Annual Average Concentrations 33
7.1.1 Annual Average Incremental Ground Level PM10 Concentrations 33 7.1.2 Annual Average Incremental Ground Level PM2.5 Concentrations 34 7.1.3 Annual Average Incremental Ground Level TSP Concentrations 35 7.1.4 Annual Average Incremental Ground Level Dust Deposition Level 36
7.2 Maximum Incremental 24-hour Average Concentrations 37 7.2.1 Maximum 24-hour Average PM2.5 Concentrations 37
7.3 Cumulative Impact Assessment 39 7.3.1 24-Hour average PM10 39 7.3.2 Annual Average 42
7.4 Potential Impacts on Proposed Jilliby Subdivision 43
8 COAL TRANSPORTATION 44
9 GREENHOUSE GAS ASSESSMENT 47 9.1 Introduction 47 9.2 Greenhouse Gas Emission Estimates 47 9.3 GHG Benefits from Flaring and Beneficial Re-Use 47 9.4 Impact on the Environment 50

Job ID 20803 | AQU-NW-004-20803 vii
Wallarah 2 Air Quality and Greenhouse Gas Assessment R4.docx
9.5 Greenhouse Gas Emissions Intensity 52 9.6 Project Greenhouse Gas and Energy Reduction Measures 52
10 MANAGEMENT AND MONITORING 53 10.1 Construction Dust Management 53 10.2 Operational Dust Control 53 10.3 Monitoring 53
11 CONCLUSION 54
12 REFERENCES 55
APPENDIX A ASSESSMENT LOCATIONS AND LAND OWNERSHIP A-1
APPENDIX B MODEL SET UP B-1
APPENDIX C ESTIMATED EMISSIONS C-1
APPENDIX D ESTIMATION OF GREENHOUSE GAS EMISSIONS D-1 D.1 Fuel Consumption D-1 D.2 Electricity D-3 D.3 Fugitive Methane D-3 D.4 Vegetation Clearing D-4 D.5 Product Coal Transportation D-4 D.6 Energy Production from Product Coal D-5
List of Figures
Figure 1.1: Revised Project Layout – Tooheys Road Site 2
Figure 2.1: Local Setting, Relevant Receptor Locations and Monitoring Sites 5
Figure 2.2: Pseudo 3-D representation of regional topography within modelling domain 6
Figure 4.1: Annual and seasonal windroses for Tooheys Road weather station 16
Figure 4.2: 24-hour average and rolling annual 24-hour average PM10 concentrations for November
2006 to December 2015 18
Figure 4.3: Annual Average Dust Deposition (g/m2/month) 21
Figure 5.1: Annual and seasonal CALMET generated windroses for Wallarah (July 2010 to June 2011) 25
Figure 7.1: Incremental Annual Average PM10 Concentration - Maximum Annual Production 33
Figure 7.2: Incremental Annual Average PM2.5 Concentration – Maximum Annual Production 34
Figure 7.3: Incremental Annual Average TSP Concentration – Maximum Annual Production 35
Figure 7.4: Incremental Annual Average Dust Deposition – Maximum Annual Production 36
Figure 7.5: Maximum 24-hour average PM2.5 Concentration – Maximum Daily Production 38
Figure 7.6: Maximum 24-hour average PM10 Concentration – Maximum Daily Production 39
Figure 7.7: Predicted number of days over 24-Hour PM10 Concentration at worst impacted residences 41
Figure 9.1: GHG Intensity Comparison 52

Job ID 20803 | AQU-NW-004-20803 1
Wallarah 2 Air Quality and Greenhouse Gas Assessment R4.docx
1 INTRODUCTION
The Wyong Areas Coal Joint Venture (WACJV) is seeking development consent under Division 4.1 of
Part 4 of the Environmental Planning and Assessment Act 1979 (EP&A Act) for the Wallarah 2 Coal
Project (the Project). The key features of the Project include:
A deep underground longwall mine extracting up to 5 million tonnes per annum (Mtpa) of
export quality thermal coal;
The Tooheys Road Site between the M1 Motorway and the Motorway Link Road, which
includes a portal, coal handling facilities and stockpiles, water and gas management facilities,
small office buildings, workshop, rail spur, train load out bin and connections to the municipal
water and sewerage systems;
The Buttonderry Site near the intersection of Hue Hue Road and Sparks Road, which includes
administration offices, bathhouse, personnel access to the mine, ventilation shafts and water
management structures;
The Western Shaft Site in the Wyong State Forest, which includes a downcast ventilation shaft
and water management structures;
An inclined tunnel (or “drift”) from the surface at the Tooheys Road Site to the coal seam
beneath the Buttonderry Site;
Transportation of product coal to the Port of Newcastle by rail; and
An operational workforce of approximately 300 full time employees.
The Project has been subject to the assessment process under Division 4.1 of Part 4 of the EP&A Act,
including a review by the Planning Assessment Commission (PAC). In June 2014, the PAC concluded
that ‘if the recommendations concerning improved strategies to avoid, mitigate or manage the
predicted impacts of the project are adopted, then there is merit in allowing the project to proceed’.
Following the review by the PAC, the Tooheys Road Site was re-designed to avoid land use conflicts
with third parties. The changes to the Project include:
Removal of the previously proposed rail loop;
Re-location of the previously proposed rail spur to the eastern side of the Main Northern Rail Line;
Re-location of the train load out facility to the eastern side of the Main Northern Rail Line;
A conveyor system to deliver product coal from the stockpile to the new train load out facility; and
Realignment of the sewer connection
These proposed changes are referred to as the ‘Amendment’. All other aspects of the Project remain
identical to the original proposal.
To give effect to the proposed changes to the Project, WACJV is seeking an amendment to the
Development Application (DA) under clause 55 of the Environmental Planning and Assessment
Regulation 2000. This report forms part of the “Amendment to Development Application SSD-4974”
(Amendment Document) being prepared by Hansen Bailey to support the application to amend the
DA.
This report assesses the air quality impacts of the Amendment and all other activities of the Project as
defined above. Where necessary, it recommends additional management and mitigation measures to
ameliorate these impacts.
1.1 Revised Layout
The revised proposed layout of the Tooheys Road Site is shown in Figure 1.1.

Job Number 20803 | AQU-NW-004-20803 2
Wallarah 2 Air Quality and Greenhouse Gas Assessment R4.docx
Figure 1.1: Revised Project Layout – Tooheys Road Site

Job Number 20803 | AQU-NW-004-20803 3
Wallarah 2 Air Quality and Greenhouse Gas Assessment R4.docx
2 LOCAL SETTING
The closest township to the Project is Blue Haven which is located approximately 0.35 km to the east of
the closest Project Boundary (see Figure 2.1). The F3 Freeway and Main Northern Railway Line run north
– south, adjacent to the Project Boundary and forms part of the major road and rail network within the
region.
The largest proportion of the Project Boundary is the underground coal extraction area which is mostly
located beneath the Wyong State Forest and adjacent forested hills, including beneath part of the
Jilliby SCA which was created in 2003. In the east of the Project Area is Jilliby Creek which joins Wyong
River further to the south-east. Wyong River which borders the southern part of the underground coal
extraction area enters Tuggerah Lake, a large coastal saltwater lagoon on the Central Coast of NSW to
the southeast of the Project.
The Project’s three surface facilities are the Tooheys Road site, Buttonderry Site, and the Western
Ventilation Shaft site. The Tooheys Road site is located on the eastern side of the F3 Freeway and in the
vicinity of Wyong’s industrial estate. The new train load-out facility is located approximately 1.1 km north
of where the Motorway Link Road overpass crosses the Main Northern Rail Line.
The Buttonderry Site is located on the western side of the F3 Freeway and within a rural (non-urban
constrained land zone) residential area. The Wyong Waste Management Facility is located to the
immediate northeast of the Buttonderry Site.
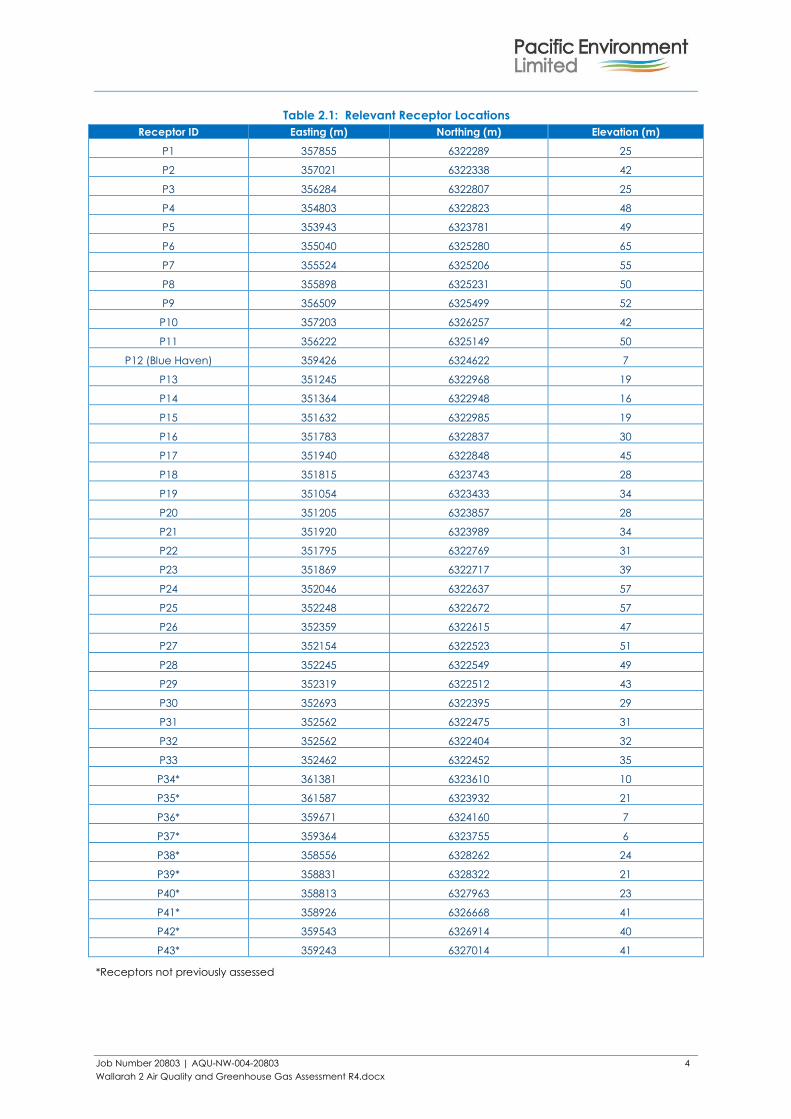
For the purposes of assessing impacts from the Project, discrete assessment locations are selected and
presented in Table 2.1 and Figure 2.1. These are based on the receptors previously assessed, with the
addition of a further 10 receptors (P33 to P43). These receptors represent assessment locations in close
proximity to the surface facilities for the Project. A list of the assessment locations are presented in
Appendix A.
Job Number 20803 | AQU-NW-004-20803 4
Wallarah 2 Air Quality and Greenhouse Gas Assessment R4.docx
Table 2.1: Relevant Receptor Locations
Receptor ID Easting (m) Northing (m) Elevation (m)
P1 357855 6322289 25
P2 357021 6322338 42
P3 356284 6322807 25
P4 354803 6322823 48
P5 353943 6323781 49
P6 355040 6325280 65
P7 355524 6325206 55
P8 355898 6325231 50
P9 356509 6325499 52
P10 357203 6326257 42
P11 356222 6325149 50
P12 (Blue Haven) 359426 6324622 7
P13 351245 6322968 19
P14 351364 6322948 16
P15 351632 6322985 19
P16 351783 6322837 30
P17 351940 6322848 45
P18 351815 6323743 28
P19 351054 6323433 34
P20 351205 6323857 28
P21 351920 6323989 34
P22 351795 6322769 31
P23 351869 6322717 39
P24 352046 6322637 57
P25 352248 6322672 57
P26 352359 6322615 47
P27 352154 6322523 51
P28 352245 6322549 49
P29 352319 6322512 43
P30 352693 6322395 29
P31 352562 6322475 31
P32 352562 6322404 32
P33 352462 6322452 35
P34* 361381 6323610 10
P35* 361587 6323932 21
P36* 359671 6324160 7
P37* 359364 6323755 6
P38* 358556 6328262 24
P39* 358831 6328322 21
P40* 358813 6327963 23
P41* 358926 6326668 41
P42* 359543 6326914 40
P43* 359243 6327014 41
*Receptors not previously assessed

Job Number 20803 | AQU-NW-004-20803 5
Wallarah 2 Air Quality and Greenhouse Gas Assessment R4.docx
Figure 2.1: Local Setting, Relevant Receptor Locations and Monitoring Sites

Job Number 20803 | AQU-NW-004-20803 6
Wallarah 2 Air Quality and Greenhouse Gas Assessment R4.docx
Figure 2.2 shows a pseudo three-dimensional (3D) representation of the local topography in the vicinity
of the Project. Vertical exaggeration is applied to emphasise terrain features.
Figure 2.2: Pseudo 3-D representation of regional topography within modelling domain

Job Number 20803 | AQU-NW-004-20803 7
Wallarah 2 Air Quality and Greenhouse Gas Assessment R4.docx
3 AIR QUALITY CRITERIA
3.1 Emissions to Air
The potential emissions to air from the Project which require reassessment due to the Amendment are
summarised as follows:
Project activities described in Section 6 have the potential to generate fugitive dust emissions,
particularly from conveying and stockpiling at the Tooheys Road Site. Fugitive dust emissions can
also be expected as a result of bulk earthworks and material handling during construction of the
Tooheys Road, Buttonderry and Western Ventilation Shaft sites.
Greenhouse gases (GHG) such as fugitive methane (CH4) and carbon dioxide (CO2) from the
combustion of fuel in combustion engines and indirect emissions from the combustion of coal have
been re-assessed in Section 9.
Changes to emissions from the Amended Project have been reassessed. These changes include:
Removal of the previously proposed rail loop;
Re-location of the rail spur and train load out facility to the eastern side of the Main Northern Rail
Line; and
A conveyor system to deliver product coal from the stockpile to the new train load out facility.
The following activities have not changed and have therefore not been reassessed:
Emissions from the ventilation shaft at the Buttonderry Site (mine ventilation air (MVA) will be
comprised of particulate matter, dilute methane, combustion emissions (from underground mining
equipment) and potentially other hydrocarbons, which may be odorous. The ventilation shaft
emissions are not expected to change as a result of the Amendment.
Combustion of diesel in mining equipment will result in emission of coarse and fine fractions of
particulate matter (PM10 and PM2.5), oxides of nitrogen (NOx), carbon monoxide (CO), sulfur dioxide
(SO2) and organic compounds. The mining fleet associated with an underground mine is relatively
small and emissions from diesel-powered equipment during both construction and operation would
not result in significant off-site concentrations. It is noted that, as with the previous assessment,
emissions of particulate matter from diesel consumption in mining equipment is accounted for in the
estimates of fugitive emissions for relevant sources (i.e. dozers).
The flaring of coal seam methane is a high-temperature oxidation process used to burn waste gases
containing methane. Emissions from flaring include unburned hydrocarbons, carbon monoxide
(CO) and oxides of nitrogen (NOx). In combustion, gaseous hydrocarbons react with atmospheric
oxygen to form carbon dioxide (CO2) and water. The quantities of hydrocarbon emissions
generated relate to the degree of combustion. Properly operated flares achieve at least 98%
combustion efficiency in the flare plume, meaning that hydrocarbon and CO emissions amount to
less than 2% of hydrocarbons in the gas stream (US EPA, 1995). Similarly, if operated efficiently, the
creation of smoke or particles from the flare should be minor. Therefore, the key pollutant from
flaring is oxides of nitrogen (NOx). NOx emissions from flaring have been modelled in the previous
assessment. As there is no change to the flaring of the coal seam gas, NOx emissions from this source
have not been reassessed.
Options are being considered for the potential beneficial re-use of methane in on-site power
generation. Emissions from the gas engines used in on-site power generation would include
particulate matter, NOx, CO and SO2. The emission rates for CO and SO2 are are lower than

Job Number 20803 | AQU-NW-004-20803 8
Wallarah 2 Air Quality and Greenhouse Gas Assessment R4.docx
emissions for NOx, however, the impact assessment criteria for CO and SO2 are higher than NOx
(NO2). Therefore, compliance with the NO2 criteria, demonstrates compliance with these other
criteria. NOx emissions from on-site power generation have been modelled in the previous
assessment. As there is no change to the number of gas engines to be used, NOx emissions from this
source have not been reassessed.
The following sections provide information on the air quality criteria used to re-assess the impact of dust
emitted from the Project site.
3.2 Particulate Matter and Health Effects
A discussion of Particulate Matter health effects has been provided in Section 4.2 of the previous
AQGHGA (PAEHolmes, 2012).
3.3 Oxides of Nitrogen
NOx emissions have been discussed and assessed in the previous AQGHGA (PAEHolmes, 2012). There
will be no change to the sources of NOx at the Project associated with the Amendment. Therefore NOx
has not been reassessed.
3.4 NSW EPA Impact Assessment Criteria/NEPM Standards
The air quality assessment criteria relevant for assessing impacts from air pollution have been discussed
in Section 4.4 of the previous AQGHGA (PAEHolmes, 2012). These criteria are health-based (i.e. they are
set at levels to protect against health effects) and for PM10 are consistent with the now superseded
National Environment Protection Measure for Ambient Air Quality (referred to as the Ambient Air-NEPM)
(NEPC, 1998a). However, the Approved Methods include other measures of air quality, namely dust
deposition and TSP which are not stated in the Ambient Air-NEPM.
In January 2016, the NEPC released an amended Ambient Air-NEPM (NEPC, 2016) to take into account
the latest scientific evidence about the health impacts of particles. The amendment changed the
‘advisory reporting standards’ status for annual average and 24-hour average PM2.5 (particulate matter
with an equivalent aerodynamic diameter of 2.5 µm or less) to ‘standards’, but in absence of any other
relevant standard/goal, the 2016 NEPM for PM2.5 standards have been used in this report for comparison
against dispersion modelling results.
Table 3.1 presents the air quality goals for pollutants that are relevant to this study. It is important to
note that the criteria are applied to the cumulative impacts due to the Project and other sources.
Table 3.1: NSW EPA Air Quality Standards/Goals for Particulate Matter Concentrations
Pollutant Standard Averaging Period Source
TSP 90 g/m3 Annual NSW DEC (2005) (assessment criteria)
PM10 50 g/m3 24-Hour NSW DEC (2005) (assessment criteria)
30 g/m3 Annual NSW DEC (2005) (assessment criteria)
PM2.5 25 µg/m3 24-Hour NEPC (2016)
8 µg/m3 Annual NEPC (2016)
Nitrogen Dioxide 246 µg/m3 1-Hour NSW DEC (2005) (assessment criteria)
62 µg/m3 Annual NSW DEC (2005) (assessment criteria) Notes: g/m3 – micrograms per cubic metre.
In addition to health impacts, airborne dust also has the potential to cause nuisance effects by
depositing on surfaces, including vegetation. Larger particles do not tend to remain suspended in the
atmosphere for long periods of time and will fall out relatively close to source. Dust deposition can soil

Job Number 20803 | AQU-NW-004-20803 9
Wallarah 2 Air Quality and Greenhouse Gas Assessment R4.docx
materials and generally degrade aesthetic elements of the environment, and are assessed for
nuisance or amenity impacts.
Table 3.2 shows the maximum acceptable increase in dust deposition over the existing dust levels from
an amenity perspective. These criteria for dust deposition levels are set to protect against nuisance
impacts (NSW DEC, 2005).
Table 3.2: EPA Criteria for Dust (Insoluble Solids) Fallout
Pollutant Averaging period Maximum increase in deposited
dust level
Maximum total deposited dust
level
Deposited dust Annual 2 g/m2/month 4 g/m2/month
Notes: g/m2/month – grams per square metre per month.
3.5 NSW Department of Planning and Environment Voluntary Land Acquisition and
Mitigation Policy
In December 2014, the NSW Department of Planning and Environment (DP&E) released a policy
relating to voluntary mitigation and land acquisition criteria for air quality and noise (DP&E, 2014).
The policy sets out voluntary mitigation and land acquisition rights where it is not possible to comply with
the EPA impact assessment criteria even with the implementation of all reasonable and feasible
avoidance and/or mitigation measures.
The voluntary mitigation and acquisition criteria are summarised in Table 3.3 and Table 3.4, respectively.
The Project has been assessed against these criteria, in addition to the EPA impact assessment criteria
discussed in Section 6.
Table 3.3: DP&E particulate matter mitigation criteria
Pollutant Criterion Averaging Period Application
TSP 90 g/m3 Annual mean Cumulative impact
PM10 50 g/m3 24-hour average Incremental impact(a)
30 g/m3 Annual mean Cumulative impact
Deposited dust 2 g/m2/month Annual mean Incremental impact(a)
4 g/m2/month Annual mean Cumulative impact Note:
(a) Zero allowable exceedances of the criterion over the life of the development.
Table 3.4: DP&E particulate matter acquisition criteria
Pollutant Criterion Averaging Period Application(a)
TSP 90 g/m3 Annual mean Cumulative impact
PM10 50 g/m3 24-hour average Incremental impact(b)
30 g/m3 Annual mean Cumulative impact
Deposited dust 2 g/m2/month Annual mean Incremental impact(b)
4 g/m2/month Annual mean Cumulative impact Notes:
(a) Voluntary acquisition rights apply where the Project contributes to exceedances of the acquisition criteria at any
residence or workplace on privately-owned land, or, on more than 25% of any privately-owned land, and a dwelling
could be built on that land under exiting planning controls. (b) Up to five allowable exceedances of the criterion over the life of the development.
Cumulative impact includes the impact of the Project and all other sources, whilst incremental impact
refers to the impact of the Project considered in isolation.
3.6 Other Legislative Requirements
3.6.1 NSW Action for Air
The NSW State Plan identifies cleaner air and progress on GHG reductions as priorities. In 1998, the NSW
Government implemented a 25 year air quality management plan, Action for Air, for Sydney,

Job Number 20803 | AQU-NW-004-20803 10
Wallarah 2 Air Quality and Greenhouse Gas Assessment R4.docx
Wollongong and the Lower Hunter (DECCW, 2009). Action for Air is a key strategy for implementing the
NSW State Plan’s cleaner air goals. Action for Air seeks to provide long-term ongoing emission
reductions. It does not target acute and extreme exceedances from events such as bushfires. The aims
of Action for Air include:
Meeting the national air quality standards for six pollutants as identified in the Ambient Air-NEPM;
and
Reducing the population’s exposure to air pollution, and the associated health costs.
The six pollutants in the Ambient Air-NEPM include CO, NO2, SO2, lead, ozone and PM10. The main
pollutants from the Project that are relevant to the Action for Air include PM10 and NO2. Action for Air
aims to reduce air emissions to enable compliance with the Ambient Air-NEPM targets to achieve the
aims described above, with a focus on motor vehicle emissions. Whilst the Project is not located within
the areas relevant to the Action for Air plan (i.e. Sydney, Wollongong and the Lower Hunter), the
Project generally addresses the aims of the Action for Air Plan in the following ways:
Potential mitigation measures have been reviewed, and a range of measures have been adopted
for the Project (see Section 10);
Air quality emissions potentially associated with the Project have been quantified (see Section 6);
and
Dispersion modelling has been conducted to predict the impact of these emissions on nearby
receivers, and assess the effect of the emissions on ambient concentrations which can then be
compared with the Ambient Air-NEPM goals (see Section 7).
3.6.2 Protection of the Environment Operations (POEO) Act 1997
Detail on the applicable emission to air concentration limits from scheduled activities under the
Protection of the Environment Operations (Clean Air) Regulations 2010 (POEO (Clean Air) Regulation)
(POEO, 2010) is provided in Section 4.6.2 of the previous AQGHGA (PAEHolmes, 2012).
3.6.3 The Best Practice Report
The NSW EPA commissioned the NSW Coal Mining Benchmarking Study: International Best Practice
Measures to Prevent and/or Minimise Emissions of Particulate Matter from Coal Mining (Donnelly et al.,
2011) (hereafter referred to as the Best Practice Report).
The Best Practice report provides guidance on controls for reducing emissions and is benchmarked on
the international best practice for the following activities:
Haul roads.
Wind erosion of exposed materials and stockpiles.
Bulldozing.
Blasting.
Drilling.
Draglines.
Loading and dumping overburden.
Loading and dumping ROM coal.
Monitoring, proactive and reactive management.
The full set of potential best practice control measures to be adopted by the Project, have been
summarised in Section 6.3.

Job Number 20803 | AQU-NW-004-20803 11
Wallarah 2 Air Quality and Greenhouse Gas Assessment R4.docx
4 EXISTING ENVIRONMENT
4.1 Meteorology
4.1.1 Local Climatic Conditions
The Bureau of Meteorology (BoM) collects climatic information in the vicinity of the Project. A range of
climatic information collected from the Norah Head Automated Weather Station (Norah Head AWS)
which is located approximately 10 km southeast of the Project is presented in Table 4.1. Temperature
and humidity data consist of monthly averages of 9 am and 3 pm readings. Monthly daily averages of
maximum and minimum temperatures are also provided. Rainfall data consist of mean monthly rainfall
and the average number of rain days per month.
The annual average maximum and minimum temperatures recorded at the Norah Head AWS are
22.1°C and 15.1°C respectively. On average, January and February are the hottest months, with
average maximum temperatures of 25.9°C. July is the coldest month, with average minimum
temperature of 9.7°C.
The annual average relative humidity reading collected at 9.00 am from the Norah Head station is 71%
and at 3.00 pm the annual average is 65%. The month with the highest relative humidity on average is
February with 9.00 am and 3.00 pm averages of 78% and 72% respectively. The month with the lowest
relative humidity is August with 9.00 am and 3.00 pm averages of 63% and 56% respectively.
Rainfall data collected at the Norah Head AWS shows that May is the wettest month, with an average
rainfall of 148 mm over 13.9 rain days. The average annual rainfall is 1,164.6 mm with an average of
144.6 rain days.
Table 4.1: Climate Averages for the Norah Head AWS for 1964-2016
Jan Feb Mar Apr May Jun Jul Aug Sep Oct Nov Dec Annual
9am Mean Dry-bulb and Wet-bulb Temperatures (ºC) and Relative Humidity (%)
Dry-bulb 22.3 22.4 21.1 19.3 16.2 13.7 12.8 14.5 17.2 19.3 20.0 21.6 18.4
Humidity 76.0 78.0 76.0 71.0 72.0 72.0 69.0 63.0 64.0 65.0 72.0 72.0 71.0
3pm Mean Dry-bulb and Wet-bulb Temperatures (ºC) and Relative Humidity (%)
Dry-bulb 24.0 24.2 23.3 21.2 18.9 16.7 16.1 17.4 19.0 20.3 21.5 23.1 20.5
Humidity 70.0 72.0 69.0 65.0 64.0 63.0 59.0 56.0 60.0 64.0 68.0 68.0 65.0
Daily Maximum Temperature (ºC)
Mean 25.9 25.9 24.9 22.8 20.1 18.0 17.2 18.8 21.0 22.7 23.6 24.8 22.1
Daily Minimum Temperature (o C)
Mean 19.6 19.9 18.7 15.8 13.1 11.0 9.7 10.5 12.8 14.9 16.8 18.4 15.1
Rainfall (mm)
Mean 86.8 109.9 106.7 136.7 148.0 143.6 88.5 71.6 64.0 54.7 97.4 68.0 1164.6
Rain days (Number)
Mean 12.3 12.0 12.9 13.6 13.9 13.7 11.3 9.0 11.4 10.4 12.9 11.2 144.6
Source: BOM (2016) Climate averages for Station: 061366; Commenced: 1989; Latitude: 33.28 °S; Longitude: 151.58 °E

Job Number 20803 | AQU-NW-004-20803 12
Wallarah 2 Air Quality and Greenhouse Gas Assessment R4.docx
4.1.2 Local Wind Data
Local meteorological data have been collected at the Tooheys Road Site since 2007. The
meteorological station was replaced during 2009 and site specific data were not available for 2009.
There were also periods from January to March of 2010 and 2013 where the weather station failed
and/or data was not available. The weather station has been operational since March 2013 with no
further outages.
Comparative statistics are shown in Table 4.2 and wind roses for each available year are presented in
Figure 4.1. Based on an analysis of data availability during the original assessment (PAEHolmes, 2012), a
period from July 2010 to June 2011 was chosen for modelling. To remain consistent with the previous
assessment, this period has been used for modelling under the current assessment
On an annual basis, Figure 4.1 shows winds to be mainly from the west, west-southwest and west-
northwest. The average annual percentage of calms across all years presented is high (winds less than
0.5 m/s) at 20% with a decrease from 2013 to 2015. This decrease can be attributed to a change in
wind speed and wind direction sensor after the upgrade of the entire meteorological station at the
Tooheys Road Site in 2013. The annual average wind speed is 1.6 m/s.
Table 4.2: Comparative Statistics for Meteorological Data
Period % Calms Average Wind Speed
(m/s)
% Data Recovery (a)
2007 29 1.7 60% – 70%
2008 31 1.6 62%
2009 - - 0%
2010 25 1.2 80%
2011 22 1.3 86%
2012 32 1.2 89%
2013 7 2.0 71%
2014 7 2.0 96%
2015 7 1.9 98%
July 2010 – June 2011 22 1.3 95% Note: (a) based on wind speed/direction

Job Number 20803 | AQU-NW-004-20803 13
Wallarah 2 Air Quality and Greenhouse Gas Assessment R4.docx
NNNNENNE
NENE
ENEENE
EE
ESEESE
SESE
SSESSESS
SSWSSW
SWSW
WSWWSW
WW
WNWWNW
NWNW
NNWNNW
4% 8% 12% 16% 20%
NNNNENNE
NENE
ENEENE
EE
ESEESE
SESE
SSESSESS
SSWSSW
SWSW
WSWWSW
WW
WNWWNW
NWNW
NNWNNW
4% 8% 12% 16% 20%
NNNNENNE
NENE
ENEENE
EE
ESEESE
SESE
SSESSESS
SSWSSW
SWSW
WSWWSW
WW
WNWWNW
NWNW
NNWNNW
4% 8% 12% 16% 20%
NNNNENNE
NENE
ENEENE
EE
ESEESE
SESE
SSESSESS
SSWSSW
SWSW
WSWWSW
WW
WNWWNW
NWNW
NNWNNW
4% 8% 12% 16% 20%
NNNNENNE
NENE
ENEENE
EE
ESEESE
SESE
SSESSESS
SSWSSW
SWSW
WSWWSW
WW
WNWWNW
NWNW
NNWNNW
4% 8% 12% 16% 20%Wind speed (m/s)
>0.5 - 1.5
>1.5 - 3
>3 - 4.5
>4.5 - 6
>6 - 7.5
>7.5
Annual and Seasonal windroses for Wallarah 2007
SpringWinter
AutumnSummer
AnnualCalms = 28.9%
Calms = 29.0% Calms = 33.4%
Calms = 23.9% Calms = 34.4%
NNNNENNE
NENE
ENEENE
EE
ESEESE
SESE
SSESSESS
SSWSSW
SWSW
WSWWSW
WW
WNWWNW
NWNW
NNWNNW
4% 8% 12% 16% 20%
NNNNENNE
NENE
ENEENE
EE
ESEESE
SESE
SSESSESS
SSWSSW
SWSW
WSWWSW
WW
WNWWNW
NWNW
NNWNNW
4% 8% 12% 16% 20%
NNNNENNE
NENE
ENEENE
EE
ESEESE
SESE
SSESSESS
SSWSSW
SWSW
WSWWSW
WW
WNWWNW
NWNW
NNWNNW
4% 8% 12% 16% 20%
NNNNENNE
NENE
ENEENE
EE
ESEESE
SESE
SSESSESS
SSWSSW
SWSW
WSWWSW
WW
WNWWNW
NWNW
NNWNNW
4% 8% 12% 16% 20%
NNNNENNE
NENE
ENEENE
EE
ESEESE
SESE
SSESSESS
SSWSSW
SWSW
WSWWSW
WW
WNWWNW
NWNW
NNWNNW
4% 8% 12% 16% 20%Wind speed (m/s)
>0.5 - 1.5
>1.5 - 3
>3 - 4.5
>4.5 - 6
>6 - 7.5
>7.5
Annual and Seasonal windroses for Wallarah 2008
SpringWinter
AutumnSummer
AnnualCalms = 30.8%
Calms = 26.1% Calms = 37.5%
Calms = 32.7% Calms = 25.8%
NNNNENNE
NENE
ENEENE
EE
ESEESE
SESE
SSESSESS
SSWSSW
SWSW
WSWWSW
WW
WNWWNW
NWNW
NNWNNW
4% 8% 12%
NNNNENNE
NENE
ENEENE
EE
ESEESE
SESE
SSESSESS
SSWSSW
SWSW
WSWWSW
WW
WNWWNW
NWNW
NNWNNW
4% 8% 12% 16% 20%
NNNNENNE
NENE
ENEENE
EE
ESEESE
SESE
SSESSESS
SSWSSW
SWSW
WSWWSW
WW
WNWWNW
NWNW
NNWNNW
4% 8% 12% 16% 20%
NNNNENNE
NENE
ENEENE
EE
ESEESE
SESE
SSESSESS
SSWSSW
SWSW
WSWWSW
WW
WNWWNW
NWNW
NNWNNW
4% 8% 12% 16%
NNNNENNE
NENE
ENEENE
EE
ESEESE
SESE
SSESSESS
SSWSSW
SWSW
WSWWSW
WW
WNWWNW
NWNW
NNWNNW
4% 8% 12% 16% 20%Wind speed (m/s)
>0.5 - 1.5
>1.5 - 3
>3 - 4.5
>4.5 - 6
>6 - 7.5
>7.5
Annual and seasonal windroses for Wallarah (2010)
SpringWinter
AutumnSummer
AnnualCalms = 25.3%
Calms = 20.4% Calms = 27.8%
Calms = 22.9% Calms = 26.4%

Job Number 20803 | AQU-NW-004-20803 14
Wallarah 2 Air Quality and Greenhouse Gas Assessment R4.docx
NNNNENNE
NENE
ENEENE
EE
ESEESE
SESE
SSESSESS
SSWSSW
SWSW
WSWWSW
WW
WNWWNW
NWNW
NNWNNW
4% 8% 12%
NNNNENNE
NENE
ENEENE
EE
ESEESE
SESE
SSESSESS
SSWSSW
SWSW
WSWWSW
WW
WNWWNW
NWNW
NNWNNW
4% 8% 12% 16% 20%
NNNNENNE
NENE
ENEENE
EE
ESEESE
SESE
SSESSESS
SSWSSW
SWSW
WSWWSW
WW
WNWWNW
NWNW
NNWNNW
4% 8% 12% 16%
NNNNENNE
NENE
ENEENE
EE
ESEESE
SESE
SSESSESS
SSWSSW
SWSW
WSWWSW
WW
WNWWNW
NWNW
NNWNNW
4% 8% 12%
NNNNENNE
NENE
ENEENE
EE
ESEESE
SESE
SSESSESS
SSWSSW
SWSW
WSWWSW
WW
WNWWNW
NWNW
NNWNNW
4% 8% 12%Wind speed (m/s)
>0.5 - 1.5
>1.5 - 3
>3 - 4.5
>4.5 - 6
>6 - 7.5
>7.5
Annual and seasonal windroses for Wallarah (2011)
SpringWinter
AutumnSummer
AnnualCalms = 21.7%
Calms = 21.0% Calms = 22.8%
Calms = 20.8% Calms = 22.0%

Job Number 20803 | AQU-NW-004-20803 15
Wallarah 2 Air Quality and Greenhouse Gas Assessment R4.docx

Job Number 20803 | AQU-NW-004-20803 16
Wallarah 2 Air Quality and Greenhouse Gas Assessment R4.docx
Figure 4.1: Annual and seasonal windroses for Tooheys Road weather station
NNNNENNE
NENE
ENEENE
EE
ESEESE
SESE
SSESSESS
SSWSSW
SWSW
WSWWSW
WW
WNWWNW
NWNW
NNWNNW
4% 8% 12% 16% 20%
NNNNENNE
NENE
ENEENE
EE
ESEESE
SESE
SSESSESS
SSWSSW
SWSW
WSWWSW
WW
WNWWNW
NWNW
NNWNNW
4% 8% 12% 16% 20%
NNNNENNE
NENE
ENEENE
EE
ESEESE
SESE
SSESSESS
SSWSSW
SWSW
WSWWSW
WW
WNWWNW
NWNW
NNWNNW
4% 8% 12% 16% 20%
NNNNENNE
NENE
ENEENE
EE
ESEESE
SESE
SSESSESS
SSWSSW
SWSW
WSWWSW
WW
WNWWNW
NWNW
NNWNNW
4% 8% 12% 16% 20%
NNNNENNE
NENE
ENEENE
EE
ESEESE
SESE
SSESSESS
SSWSSW
SWSW
WSWWSW
WW
WNWWNW
NWNW
NNWNNW
4% 8% 12% 16% 20%Wind speed (m/s)
>0.5 - 1.5
>1.5 - 3
>3 - 4.5
>4.5 - 6
>6 - 7.5
>7.5
Annual and seasonal windroses for Wallarah
July 2010 - June 2011
SpringWinter
AutumnSummer
AnnualCalms = 22.5%
Calms = 21.0% Calms = 22.8%
Calms = 19.8% Calms = 26.4%

Job Number 20803 | AQU-NW-004-20803 17
Wallarah 2 Air Quality and Greenhouse Gas Assessment R4.docx
4.2 Existing Ambient Air Quality
Air quality standards and goals refer to pollutant levels which include the contribution from proposed
projects as well as other sources. To fully assess impacts against all the relevant air quality standards
and goals it is necessary to have information or estimates on existing dust concentration and deposition
levels in the area in which the Project is likely to contribute to dust levels.
An Environmental Monitoring Program for the Project commenced in 1996 providing monthly averages
of dust deposition levels. Dust concentrations were also measured by high volume air samplers (HVAS).
Air monitoring was discontinued in early 2004 and recommenced in late 2006. All data presented are
based on data files provided by Wyong Areas Coal Joint Venture, however most data are also largely
summarised in reports by ERM (ERM, 2008, 2009, 2010, 2011, 2012 and 2013). Available data
commencing in 1999 from the two relevant HVAS and eight (later six) dust deposition gauges are
provided below.
The locations of the current monitoring sites in place for the mine operations are shown on Figure 2.1
and include:
Two HVASs measuring PM10 on a one day in six cycle;
Two HVASs measuring total suspended particles (TSP) on a one day in six cycle; and
Six dust deposition gauges.
The HVASs are located near each of the Tooheys Road and Buttonderry sites. Dust deposition gauges
are located near the Tooheys Road and Buttonderry sites and also representative of nearby residential
areas.
4.2.1 PM10 and TSP Concentrations
HVAS C is located at the Buttonderry Site and HVAS E at the Tooheys Road Site. The HVAS monitoring
results will include all background sources relevant to that location, including any contribution which
may occur from local activities. Concentrations of 24-hour PM10 above the goal of 50 µg/m3 are
measured on occasion, often associated with bushfires, dust storms or dry, hot conditions.
A summary of the monitoring data is presented in Table 4.3. There was a gap of monitoring data
collection between 2003 to 2006. HVAS C was damaged by lightning which caused data loss between
April 2015 to October 2015. Since the recommencement of monitoring in September 2006 to date
(December 2015) these data are 68% complete (HVAS C) and 77% - 79% complete (HVAS E). TSP data
are unavailable at HVAS C from April 2012 when the filter was swapped to HVAS C PM10.
Annual average concentrations of PM10 are generally below the relevant air quality goals for the
monitoring period. Exceedances of the annual average PM10 goal of 30 µg/m3 were recorded in 2002
and 2006. In 2002, the annual average PM10 concentration was based on data collected over
November and December only, a period impacted by bushfires. During 2006 a large number of nearby
regions all experienced an increased number of 24-hour PM10 exceedances which may be attributed to
bushfires towards the end of the year (DECC, 2007). The average annual PM10 over both monitoring sites
for the monitoring period is 17 µg/m3.
Table 4.3 also provides a summary of the annual average TSP concentration data collected at these
sites. Monitoring results show that from 1999 to 2015 there have been no recorded exceedances of the
EPA impact average assessment criterion for TSP of 90 µg/m3. The highest annual average TSP was 64
µg/m3 measured in 2002 by HVAS C and 61 µg/m3 also measured in 2002 by HVAS E. The average
annual TSP concentrations across both HVAS monitors over all monitoring data available is 33 µg/m3.

Job Number 20803 | AQU-NW-004-20803 18
Wallarah 2 Air Quality and Greenhouse Gas Assessment R4.docx
Figure 4.2: 24-hour average and rolling annual 24-hour average PM10 concentrations for November 2006
to December 2015

Job Number 20803 | AQU-NW-004-20803 19
Wallarah 2 Air Quality and Greenhouse Gas Assessment R4.docx
Table 4.3: Summary of PM10 and TSP concentrations (g/m3)
Year HVAS C HVAS E
PM10
Annual Ave
PM10
Maximum 24-
hour average
Days above
criteria (a)
TSP
Annual Ave
PM10
Annual Ave
PM10
Maximum 24-
hour average
Days above
criteria (a)
TSP
Annual Ave
Goal 30 (µg/m3) 50 (µg/m3) - 90 (µg/m3) 30 (µg/m3) 50 (µg/m3) - 90 (µg/m3)
1999 10 14 0 24 9 14 0 21
2000 11 30 0 20 12 66 1 26
2001 12 33 0 27 13 32 0 30
2002(b) 38 116 2 64 24 85 6 61
2003(b) 12 44 0 29 21 49 0 42
2006(b) 31 67 1 51 37 73 2 57
2007 13 29 0 19 17 41 0 33
2008 12 38 0 18 17 62 1 33
2009 19 154 1 30 28 156 4 50
2010 12 31 0 19 19 57 3 32
2011 11 28 0 18 16 53 2 29
2012 10 26 0 20(c) 15 45 0 30
2013 9 39 0 - 16 48 0 30
2014 13 40 0 - 19 71 1 36
2015 11 24 0 - 13 41 0 25
Average 15 - - 29 18 - - 36
Note: (a) HVAS monitors only recorded dust levels one day in six, so this does not represent all days above criteria.
(b) 2002 data are for November and December only. Gap in monitoring from 2003 to 2006, recommenced September 2006.
(c) Data for TSP available until 02/04/2012 when the filter was swapped from HVAS C TSP to HVAS C PM10.

Job Number 20803 | AQU-NW-004-20803 20
Wallarah 2 Air Quality and Greenhouse Gas Assessment R4.docx
4.2.2 Dust Deposition
Dust deposition data have been collected in the area surrounding the Project since September 1996.
The locations of the relevant dust deposition gauges are shown in Figure 2.1. Gauges D6, D10 and D20
are no longer in use. The data, from 1997, expressed as insoluble solids, are presented in Table 4.4.
Monitoring ceased in 2004 and recommenced in September 2006. For most years, less than a full year
of data was available, due to contamination of samples or monitoring for only parts of the year.
Annual average dust deposition levels recorded since September 2006 are shown in Figure 4.3. In
recent years there have been no exceedances of the EPA criterion of 4 g/m2/month. The average dust
deposition rate across all sites for the entire monitoring period is 1.6 g/m2/month.
Table 4.4: Dust Deposition Yearly Average (g/m2/month of insoluble solids)
Year D1 D3 D4 D5 D6 D8 D10 D11 D20
1997 - 1.2 0.8 1.1 1.5 - - - 2.6
1998 - 0.8 0.6 0.5 2.9 - - - 0.9
1999 1.6 0.8 0.8 0.6 2.7 0.2 - - 0.9
2000 1.3 0.9 0.7 0.7 1.9 4.8 1.0 1.4 1.0
2001 1.1 0.8 0.4 0.9 3.0 3.2 2.3 2.3 0.9
2002 2.2 1.6 - 0.8 2.3 1.2 1.9 2.9 5.2
2003 2.4 1.5 - 1.6 1.9 1.8 0.9 - 1.1
2004 3.5 1.6 - 1.5 1.9 2.3 1.7 - 1.1
2006
(from Sept) 2.0 1.5 1.1 1.1 - 1.6 - 1.9 -
2007 3.9 2.6 1.3 1.1 - 3.4 - 3.1 -
2008 1.4 1.0 0.7 0.8 - 3.9 - 2.2 -
2009 1.8 1.7 1.1 1.0 - 1.4 - 2.2 -
2010 2.2 0.7 0.8 0.5 - 0.8 - 2.5 -
2011 2.1 0.6 0.5 0.4 - 0.6 - 3.5 -
2012 2.4 0.7 0.9 0.6 - 1.7 - 2.6 -
2013 0.7 0.8 0.5 0.7 - 0.7 - 1.1 -
2014 1.1 0.7 0.6 0.8 - 0.7 - 1.1 -
2015 0.8 1.3 0.5 0.6 - 1.9 - 1.6 -
Average 1.9 1.2 0.8 0.9 2.3 1.9 1.6 2.2 1.7
Average over all sites =1.6

Job Number 20803 | AQU-NW-004-20803 21
Wallarah 2 Air Quality and Greenhouse Gas Assessment R4.docx
Figure 4.3: Annual Average Dust Deposition (g/m2/month)

Job Number 20803 | AQU-NW-004-20803 22
Wallarah 2 Air Quality and Greenhouse Gas Assessment R4.docx
4.2.3 PM2.5 Concentrations
The closest available PM2.5 monitoring locations are operated by the EPA at Beresfield and Wallsend,
located approximately 40 km – 50 km north of the site. Co-located monitors for PM10 and PM2.5 are
operated at these sites and the average recorded ratio of PM2.5/PM10 for both of these sites during 2014
was 0.4.
Applying this ratio to the average of the annual average PM10 concentration (16.5 µg/m3) recorded at
HVAS C and HVAS E (Table 4.3), the annual average PM2.5 concentration is estimated to be
approximately 7 µg/m3.
It is noted that the ratios of PM2.5/PM10 vary across different areas, usually a function of local industrial
activity, vehicle traffic, residential density and domestic wood burning. However, in the absence of
available recent local data, these ratios are adopted for use in this assessment.

Job Number 20803 | AQU-NW-004-20803 23
Wallarah 2 Air Quality and Greenhouse Gas Assessment R4.docx
4.3 Existing Air Quality for Assessment Purposes
The assessment of air quality impacts for the Project requires consideration of the contributions from
other local sources, including traffic along major transport routes, local power stations, domestic wood
fires, local unsealed roads and exposed areas.
The raw monitoring data collected for the Project provides an indication of background concentrations
for TSP, PM10 and dust deposition in the region. In the absence of monitoring data for PM2.5 an estimate
has been made based on ratios of PM2.5/PM10 measured at the closest available EPA monitoring sites.
In summary, for the purposes of assessing potential air quality impacts, the following existing air quality
levels are assumed.
annual average PM10 concentration of 17 µg/m3 (previously 18 µg/m3);
annual average PM2.5 concentration of 7 µg/m3 (previously 5 µg/m3);
annual average TSP concentration of 33 µg/m3 (previously 31 µg/m3);
annual average dust deposition of 1.6 g/m2/month (consistent with previous assessment);
24-hour PM10 concentrations – daily varying (consistent with previous assessment).

Job Number 20803 | AQU-NW-004-20803 24
Wallarah 2 Air Quality and Greenhouse Gas Assessment R4.docx
5 MODELLING APPROACH
This Air Quality Assessment has been conducted generally in accordance with the Approved Methods
(NSW DEC, 2005) and the approach is described in the following sections. Other than updating the
emission sources and the additional of some receptors to reflect the Amendment, no changes were
made to the approach compared with the previous AQGHGA (PAEHolmes, 2012).
5.1 Modelling System
The CALMET/CALPUFF modelling system was chosen for this study. CALMET is a meteorological pre-
processor that includes a wind field generator containing objective analysis and parameterised
treatments of slope flows, terrain effects and terrain blocking effects. The pre-processor produces fields
of wind components, air temperature, relative humidity, mixing height and other micro-meteorological
variables to produce the 3-D meteorological fields that are utilised in the CALPUFF dispersion model.
CALMET uses the meteorological inputs in combination with land use and geophysical information for
the modelling domain to predict gridded meteorological fields for the region. CALPUFF is a multi-layer,
multi-species non-steady state puff dispersion model that can simulate the effects of time and space
varying meteorological conditions on pollutant transport, transformation and removal (Scire et al.,
2000). The model contains algorithms for near-source effects such as building downwash, partial plume
penetration, sub-grid scale interactions as well as longer-range effects such as pollutant removal,
chemical transformation, vertical wind shear and coastal interaction effects. The model employs
dispersion equations based on a Gaussian distribution of pollutants across the puff and takes into
account the complex arrangement of emissions from point, area, volume, and line sources. In March
2011 the NSW EPA published generic guidance and optional settings for the CALPUFF modelling system
for inclusion in the Approved Methods (TRC, 2011). The model set up for this study has been conducted
in consideration of these guidelines.
5.2 Model Set Up
CALMET was run for a domain of 30 km x 30 km with a 250 m resolution, centred on the proposed
Tooheys Road Site. Observed hourly surface data were incorporated into the domain modelling,
including the Wallarah site data plus the BoM data from Cooranbong (located 15 km north) and Norah
Head (located 14 km southeast). Cloud amount and cloud heights were sourced from observations at
Williamtown RAAF base (located 60 km northeast) and included at the Cooranbong site. Any gaps in
the data were supplemented with data extracted from TAPM1. Further details on model set up are
provided in Appendix B.
5.3 Dispersion Meteorology
To compare winds predicted by the model with the measured data from the Wallarah AWS (Figure 4.1),
a CALMET windrose is presented in Figure 5.1. The CALMET windrose is extracted for a single point at the
approximate location of the Wallarah AWS. The CALMET wind rose displays similar characteristics to the
measured data at Wallarah AWS with dominant winds annually from west, west-southwest. The
percentage occurrence of calm conditions (defined as wind speeds less than 0.5m/s) are also a similar
magnitude between those recorded at Wallarah AWS and those predicted by CALMET for the same
time period.
1 The Air Pollution Model, or TAPM, is a three dimensional meteorological and air pollution model developed by the
CSIRO Division of Atmospheric Research. Detailed description of the TAPM model and its performance is provided in
(Hurley 2008; Hurley, Edwards et al. 2009).

Job Number 20803 | AQU-NW-004-20803 25
Wallarah 2 Air Quality and Greenhouse Gas Assessment R4.docx
Figure 5.1: Annual and seasonal CALMET generated windroses for Wallarah (July 2010 to June 2011)

Job Number 20803 | AQU-NW-004-20803 26
Wallarah 2 Air Quality and Greenhouse Gas Assessment R4.docx
6 EMISSIONS TO AIR
6.1 Construction Phase
During construction of the surface infrastructure, fugitive dust emissions can be expected from the
activities including:
Vegetation clearing/stripping;
Bulk earthworks and material handling;
Hauling along unsealed surfaces;
Crushing of drift material
Transfer of crushed material along conveyor
Wind erosion on exposed areas
An estimate of the amount of dust produced during the construction phase is presented in Table 6.1
and compared with the previous AQGHGA
The revised total estimated annual emissions during construction are less than 85% of the emissions
estimated to occur during operation of the Project (see Section 6.2) and therefore further assessment for
construction is not considered necessary. Compliance with air quality goals during the operation of the
mine is assumed to represent compliance during mine construction.
Notwithstanding the above, suitable dust mitigation measures would be implemented during the
construction phase to ensure that dust emissions are kept to a minimum, especially during adverse
meteorological conditions. These mitigation measures are discussed in Section 10.
Table 6.1: Estimated Dust Emissions– Construction
ACTIVITY
TSP PM10 PM2.5
Previous
Assessment
Current
Assessment
Previous
Assessment
Current
Assessment
Previous
Assessment
Current
Assessment
kg/y
Tooheys Road Site
Dozer clearing vegetation 16,066 11,583 3,882 2,799 1,687 1,216
Loading of excavated material to trucks 331 69 156 33 24 5
Hauling of excavated material by trucks 5,441 2,729 932 468 134 67
Hauling of drift material from drift to crusher by
truck - 3,431 - 588 - 84
CL - Processing - Crushing Station - 69 - 31 - 6
CL - Conveyor transfer of drift material from
crusher to rail spur - 87 - 41 - 5
Dumping of excavated material 331 156 156 74 24 11
FEL / Dozer Shaping 6,525 6,525 1,471 1,471 685 685
Wind erosion - exposed areas 24,528 24,528 12,264 12,264 1,840 1,840
Buttonderry Site
Dozer clearing vegetation 4,820 4,820 1,165 1,165 506 506
Loading of excavated material to trucks 33 33 16 16 2 2
Hauling of excavated material by trucks 547 1,316 94 225 13 32
Dumping of excavated material 33 33 16 16 2 2
FEL / Dozer Shaping 6,525 6,525 1,471 1,471 685 685
Wind erosion 14,016 14,016 7,008 7,008 1,051 1,051
Total Annual 79,195 75,919 28,632 27,669 6,653 6,198

Job Number 20803 | AQU-NW-004-20803 27
Wallarah 2 Air Quality and Greenhouse Gas Assessment R4.docx
6.2 Operation Phase
During operations, the Project will result in emissions of particulate matter, primarily from coal handling
activities at the Tooheys Road Site and the operation of upcast ventilation shafts at the Buttonderry Site.
Dust emissions during operations have been estimated by analysing the proposed activities for the
Project. The estimated dust emissions during the operational stage of the Project are presented in Table
6.2.
In estimating dust emissions, consideration has been given to best practice management (BPM) and
applicable controls have been applied to significant dust sources. An overview of BPM is provided in
Section 6.3.
Table 6.2: Estimated Annual Dust Emission
ACTIVITY
TSP PM10 PM2.5
Previous
Assessment
Current
Assessment
Previous
Assessment
Current
Assessment
Previous
Assessment
Current
Assessment
kg/y
Tooheys Road Site
CL - Conveyor transfer @ Portal 828 828 392 392 59 59
CL - Conveyor transfer to ROM
stockpile 828 248 392 118 59 18
CL - Loading ROM stockpile from
conveyor 828 828 392 392 59 59
CL - Active ROM Stockpiles (wind
erosion and maintenance -
assumes maintenance by
FEL/Dozer)
13,324 13,324 6,662 6,662 999 999
CL - Conveyor transfer to Crushing
Station 828 248 392 118 59 18
CL - Processing - Crushing Station - 450 - 405 - 75
CL - Conveyor transfer between
crusher and stockpile 828 124 392 118 59 18
CL - Conveyor transfer to Product
stockpile 828 248 392 118 59 18
CL - Loading Product stockpile from
conveyor gantry 828 828 392 392 59 59
CL - Active Product Stockpiles (wind
erosion and maintenance - assumes
maintenance by FEL/Dozer)
48,171 48,171 24,068 24,086 3,613 3,613
CL - Loading from Product Stockpile
to Conveyor - 828 - 392 - 59
CL - Unloading material at transfer
points - 124 - 59 - 9
Conveying from stockpiles to train
load out bin - 248 - 118 - 18
Transfer from conveyor to train load
out bin - 248 - 118 - 18
CL - Loading Trains from Train Load
Out Bin 828 828 392 392 59 59
Buttonderry Site
Ventilation Shaft 23,337 23,337 23,227 23,337 23,227 23,337
Total Annual 91,458 90,914 57,218 57,212 28,423 28,436
6.2.1 Ventilation Shaft
The assumptions and modelling parameters detailed in Section 7.2.1 of the previous AQGHGA remain
valid (PAEHolmes, 2012) as no changes have been made to the modelling of the ventilation shaft from
the previous assessment.
6.2.2 Flare and Gas Engine Emissions
The proposed flaring of methane and from gas engine emissions has not changed from the previous
assessment; therefore NOx emissions have not been reassessed.
6.3 Overview of Best Practice Dust Control
Table 6.3 provides an overview of the applicable BPM measures recommended by EPA and those
adopted for the assessment. As noted in Section 3.6.3, the assumptions are based on information
contained in the Best Practice Report (Donnelly et al., 2011).

Job Number 20803 | AQU-NW-004-20803 28
Wallarah 2 Air Quality and Greenhouse Gas Assessment R4.docx
When preparing the emission inventory for modelling the relevant percentage controls for the BPM
adopted are shown in Table 6.3. Many of the BPM are not relevant for Project as they apply to open
cut mining operations.

Job Number 20803 | AQU-NW-004-20803 29
Wallarah 2 Air Quality and Greenhouse Gas Assessment R4.docx
Table 6.3: Best Practice Dust Management
EPA best
practice Mining Activity Best Practice Control
Applied at
site
(Y/N/Other)
Comment
Control
Applied
in
Modelling Section Table
9.2 66 Hauling on
Unsealed
Roads
Vehicle
restrictions
Speed reduction from 75 km/h to 50 km/h N/A Not applicable to underground operations
Speed reduction from 65 km/h to 30 km/h N/A Not applicable to underground operations
Grader speed reduction from 16 km/h to 8
km/h
N/A Not applicable to underground operations
Surface
improvements
Pave the surface N/A Not applicable to underground operations
Low silt aggregate N/A Not applicable to underground operations
Oil and double chip surface N/A Not applicable to underground operations
Surface
treatments
Watering (standard procedure) N/A Level 2 watering applied
Watering Level 1 (2 L/m2/h) N/A Level 2 watering applied
Watering Level 2 (>2 L/m2/h) Y Applied during construction. No hauling during operation of the Project 75%
Watering grader routes N
Watering twice a day for industrial unpaved
road
N
Dust suppressants (please specify) N
Other Use of larger vehicles N/A Not applicable to underground operations
Conveyors N/A Not applicable to underground operations
9.3 71 Wind Erosion
on Exposed
Areas &
Overburden
Emplacements
Avoidance Minimise pre-strip Y Applied during construction. Not applicable during operation of the Project
Surface
stabilisation
Watering N/A Not applicable to underground operations
Chemical suppressants N/A Not applicable to underground operations
Paving and cleaning N/A Not applicable to underground operations
Application of gravel to stabilise disturbed
open areas
N/A Not applicable to underground operations
Rehabilitation goals Y Applied during construction. Not applicable during operation of the Project
Wind speed
reduction
Fencing, bunding, shelterbelts or in-pit
dump
N/A Not applicable to underground operations
Vegetative ground cover N/A Not applicable to underground operations
9.3 72 Wind Erosion
and
Maintenance -
Coal
Stockpiles
Avoidance Bypassing stockpiles N/A Not practical
Surface
stabilisation
Water sprays Y Fixed water sprays on stockpiles 50%
Chemical wetting agents N
Surface crusting agent N
Carry over wetting from load in N
Enclosure Silo with bag house N
Cover storage pile with a tarp during high
winds
N
Wind speed
reduction
Vegetative windbreaks N
Reduced pile height N
Wind screens/fences N
Pile shaping/orientation N
Erect 3-sided enclosure around storage
piles
N
9.4 76 Bulldozers on
OB
Minimise travel speeds and distance Y Applied during construction. Not applicable during operation of the Project
Travel routes and material kept moist Y Applied during construction. Not applicable during operation of the Project

Job Number 20803 | AQU-NW-004-20803 30
Wallarah 2 Air Quality and Greenhouse Gas Assessment R4.docx
EPA best
practice Mining
Activity Best Practice Control
Applied at
site
(Y/N/Other)
Comment
Control
Applied
in
Modelling Section Table
9.5 81 Blasting and
drilling
Blasting Delay shot to avoid unfavourable weather
conditions
N/A Not applicable to underground operations
Minimise area blasted N/A Not applicable to underground operations
82 Drilling Fabric filters N/A Not applicable to underground operations
Cyclone N/A Not applicable to underground operations
Water injection while drilling N/A Not applicable to underground operations
9.6 85 Draglines Minimise drop height N/A Not applicable to underground operations
Minimising drop height N/A Not applicable to underground operations
Modify activities in windy conditions N/A Not applicable to underground operations
Water sprays N/A Not applicable to underground operations
Minimise side casting N/A Not applicable to underground operations
9.7 90 Loading and
dumping
overburden
Excavator Minimise drop height Y Applied during construction. Not applicable during operation of the Project
Truck dumping Minimise drop height Y Applied during construction. Not applicable during operation of the Project
Water application Y Applied during construction. Not applicable during operation of the Project
Modify activities in windy conditions Y Applied during construction. Not applicable during operation of the Project
9.8 95 Loading and
dumping
ROM coal
Avoidance Bypass ROM stockpiles N
Truck or loader
dumping coal
Minimise drop height N/A Not applicable to underground operations
Water sprays on ROM pad N/A Not applicable to underground operations
Truck or loader
dumping to
ROM bin
Water sprays on ROM bin or ROM pad N/A Not applicable to underground operations
Three sided and roofed enclosure of ROM
bin
N/A Not applicable to underground operations
Three sided and roofed enclosure of ROM
bin + water sprays
N/A Not applicable to underground operations
Enclosure with control device N/A Not applicable to underground operations
9.9 96 Conveyors
and transfers
Conveyors Application of water at transfers Y 50%
Wind shielding - roof OR side wall N/A Higher level of control applied- roof AND side wall
Wind shielding - roof AND side wall Y 3/4 shielded conveyors proposed 70%
Belt cleaning and spillage minimisation Y No reduction applied to inventory
Transfers Enclosure Y 70%
9.10 97 Stacking and
reclaiming
product coal
Avoidance Bypass coal stockpiles N
Loading coal
stockpiles
Variable height stack Y
Boom tip water sprays Y
Telescopic chute with water sprays Y
Unloading
coal stockpiles
Bucket-wheel, portal or bridge reclaimer
with water application
N
9.11 - Train and
truck load out
and
transportation
Limit load size to ensure coal is below sidewalls Y No reduction applied to inventory
Maintain a consistent profile Y No reduction applied to inventory
Use bedliners to minimise seepage N
Cover load with tarpaulin N/A Not applicable to underground operations
Utilise truck wheel wash N/A Not applicable to underground operations

Job Number 20803 | AQU-NW-004-20803 31
Wallarah 2 Air Quality and Greenhouse Gas Assessment R4.docx
7 IMPACT ASSESSMENT
The results of the predictions for the Project are presented in the sections below. Per the emissions
detailed in Section 6.2, all activities from the Project have been assessed. The contour plots are
indicative of the concentrations that could potentially be reached under the conditions modelled. A
summary of the predicted pollutant concentrations at each of the assessment locations is presented in
Table 7.1. The assessment locations are detailed in Appendix A and shown in Figure 2.1.
The following sections discuss the results for each of the relevant pollutants and averaging periods.

Job Number 20803 | AQU-NW-004-20803 32
Wallarah 2 Air Quality and Greenhouse Gas Assessment R4.docx
Table 7.1: Predicted Incremental Ground Level Concentrations at Assessment Locations
Receptor
ID Easting Northing
PM2.5 PM10 TSP Dust deposition
24 hour
(max daily)
24 hour
(average daily) Annual
24 hour
(max daily)
24 hour
(average daily) Annual Annual Annual
Previous Current Previous Current Previous Current Previous Current Previous Current Previous Current Previous Current Previous Current
Units µg/m3 µg/m3 µg/m3 g/m2/month
Criteria N/A N/A N/A N/A N/A N/A N/A 2
P1 357855 6322289 0.37 0.38 0.32 0.32 0.03 0.03 1.74 2.22 1.35 1.72 0.1 0.2 0.2 0.2 0.02 0.01
P2 357021 6322338 0.83 0.81 0.64 0.62 0.04 0.05 3.80 4.07 3.00 3.21 0.2 0.2 0.2 0.3 0.01 0.01
P3 356284 6322807 1.14 1.14 0.83 0.82 0.08 0.09 6.04 6.64 4.84 5.32 0.4 0.5 0.6 0.7 0.03 0.03
P4 354803 6322823 0.69 0.68 0.49 0.49 0.07 0.07 3.45 3.96 2.71 3.11 0.2 0.3 0.3 0.4 0.06 0.06
P5 353943 6323781 0.65 0.64 0.47 0.46 0.05 0.05 3.32 3.70 2.62 2.91 0.1 0.1 0.2 0.2 0.03 0.02
P6 355040 6325280 0.75 0.75 0.67 0.67 0.06 0.06 3.27 3.86 2.55 3.01 0.2 0.2 0.2 0.3 0.02 0.02
P7 355524 6325206 1.10 1.08 0.81 0.79 0.09 0.09 5.85 6.21 4.61 4.90 0.4 0.4 0.5 0.6 0.04 0.04
P8 355898 6325231 2.28 2.06 1.58 1.43 0.15 0.14 12.97 12.71 9.44 9.25 0.7 0.8 1.0 1.1 0.06 0.06
P9 356509 6325499 2.85 2.93 2.05 2.11 0.22 0.22 13.66 16.33 10.91 13.04 1.1 1.3 1.5 1.9 0.09 0.09
P10 357203 6326257 1.34 1.31 0.98 0.95 0.08 0.08 5.99 7.05 4.67 5.50 0.4 0.5 0.4 0.6 0.03 0.03
P11 356222 6325149 5.02 4.89 3.78 3.68 0.30 0.28 27.16 29.53 22.14 24.08 1.6 1.7 2.4 2.6 0.14 0.13
P12 359426 6324622 0.63 0.66 0.46 0.48 0.06 0.06 2.88 3.77 2.30 3.01 0.3 0.4 0.3 0.5 0.04 0.05
P13 351245 6322968 0.96 0.96 0.94 0.94 0.08 0.08 1.37 1.50 1.20 1.31 0.1 0.1 0.1 0.1 0.01 0.01
P14 351364 6322948 0.99 0.99 0.97 0.97 0.10 0.10 1.67 1.80 1.48 1.59 0.1 0.1 0.1 0.1 0.02 0.02
P15 351632 6322985 1.56 1.57 1.54 1.55 0.19 0.19 2.37 2.54 2.15 2.30 0.2 0.2 0.2 0.2 0.03 0.03
P16 351783 6322837 3.33 3.23 3.33 3.23 0.32 0.32 3.33 3.28 3.32 3.26 0.3 0.3 0.3 0.4 0.05 0.05
P17 351940 6322848 4.92 5.22 4.92 5.22 0.46 0.47 4.87 5.22 4.87 5.22 0.5 0.5 0.5 0.5 0.06 0.06
P18 351815 6323743 3.71 3.68 3.71 3.68 0.15 0.15 3.54 3.67 3.54 3.67 0.2 0.2 0.2 0.2 0.02 0.02
P19 351054 6323433 0.79 0.79 0.78 0.78 0.07 0.07 1.01 1.10 0.90 0.97 0.1 0.1 0.1 0.1 0.01 0.01
P20 351205 6323857 0.76 0.74 0.76 0.74 0.07 0.07 1.20 1.32 1.01 1.11 0.1 0.1 0.1 0.1 0.01 0.01
P21 351920 6323989 0.93 0.99 0.93 0.99 0.10 0.10 1.62 1.83 1.27 1.43 0.1 0.1 0.1 0.1 0.01 0.01
P22 351795 6322769 3.26 3.06 3.26 3.05 0.28 0.28 3.21 3.05 3.21 3.05 0.3 0.3 0.3 0.3 0.04 0.04
P23 351869 6322717 2.30 2.46 2.30 2.46 0.23 0.24 2.26 2.46 2.26 2.46 0.2 0.3 0.2 0.3 0.03 0.03
P24 352046 6322637 2.72 2.73 2.72 2.73 0.20 0.20 2.68 2.72 2.68 2.72 0.2 0.2 0.2 0.3 0.02 0.02
P25 352248 6322672 2.07 2.10 2.07 2.10 0.16 0.17 2.00 2.09 2.00 2.09 0.2 0.2 0.2 0.2 0.03 0.03
P26 352359 6322615 1.84 1.85 1.84 1.85 0.13 0.13 1.77 1.84 1.77 1.84 0.2 0.2 0.2 0.2 0.03 0.03
P27 352154 6322523 1.46 1.47 1.45 1.47 0.11 0.11 1.42 1.48 1.42 1.48 0.1 0.2 0.1 0.2 0.02 0.02
P28 352245 6322549 1.25 1.29 1.25 1.29 0.11 0.11 1.27 1.37 1.21 1.30 0.1 0.1 0.1 0.2 0.02 0.02
P29 352319 6322512 1.22 1.24 1.22 1.24 0.09 0.10 1.23 1.30 1.16 1.23 0.1 0.1 0.1 0.2 0.02 0.02
P30 352693 6322395 0.78 0.77 0.78 0.77 0.08 0.08 1.30 1.65 1.01 1.28 0.1 0.1 0.1 0.2 0.02 0.01
P31 352562 6322475 0.96 0.97 0.96 0.97 0.09 0.09 1.18 1.48 0.91 1.15 0.1 0.1 0.1 0.2 0.02 0.02
P32 352562 6322404 0.94 0.95 0.94 0.95 0.08 0.08 1.23 1.55 0.95 1.20 0.1 0.1 0.1 0.1 0.01 0.01
P33 352462 6322452 1.15 1.17 1.15 1.17 0.08 0.08 1.13 1.20 1.10 1.17 0.1 0.1 0.1 0.1 0.02 0.02
P34* 361381 6323610 - 0.37 - 0.25 - 0.02 - 1.46 - 1.20 - 0.1 - 0.1 - 0.02
P35* 361587 6323932 - 0.36 - 0.24 - 0.02 - 1.55 - 1.27 - 0.1 - 0.1 - 0.02
P36* 359671 6324160 - 0.52 - 0.42 - 0.05 - 2.96 - 2.46 - 0.3 - 0.3 - 0.05
P37* 359364 6323755 - 0.58 - 0.48 - 0.05 - 3.35 - 2.75 - 0.3 - 0.4 - 0.05
P38* 358556 6328262 - 0.44 - 0.33 - 0.02 - 1.66 - 1.40 - 0.1 - 0.1 - 0.00
P39* 358831 6328322 - 0.28 - 0.28 - 0.02 - 1.44 - 1.18 - 0.1 - 0.1 - 0.00
P40* 358813 6327963 - 0.39 - 0.30 - 0.02 - 1.55 - 1.29 - 0.1 - 0.1 - 0.00
P41* 358926 6326668 - 0.53 - 0.42 - 0.04 - 2.15 - 1.77 - 0.2 - 0.2 - 0.01
P42* 359543 6326914 - 0.49 - 0.39 - 0.03 - 1.94 - 1.52 - 0.1 - 0.1 - 0.01
P43* 359243 6327014 - 0.38 - 0.38 - 0.03 - 1.73 - 1.36 - 0.1 - 0.1 - 0.01
*Receptor not previously assessed

Job Number 20803 | AQU-NW-004-20803 33
Wallarah 2 Air Quality and Greenhouse Gas Assessment R4.docx
7.1 Annual Average Concentrations
7.1.1 Annual Average Incremental Ground Level PM10 Concentrations
A contour plot of the predicted ground level concentrations (glcs) of PM10 due to the Project alone are
presented in Figure 7.1. Annual average PM10 predictions are presented for the maximum annual
production scenario. The relevant impact assessment criteria are shown by the red contour line. There
are no privately owned receivers that are predicted to experience glcs of PM10 above the assessment
criteria, due to emissions from the Project alone. The highest predicted glcs occur at the closest
residence to the north of the site (P11). At this location, under the current assessment, the predicted
annual average PM10 concentration is 1.7 µg/m3 compared to 1.6 µg/m3 under the previous
assessment.
Species:
PM10
Location:
Wyong
Scenario:
Maximum Annual Production
Percentile:
N/A
Averaging Time:
Annual
Model Used:
CALPUFF v8.1.0
Units:
µg/m3
Assessment Criterion:
N/A
Met Data:
CALMET
Plot:
L. McDonough
Figure 7.1: Incremental Annual Average PM10 Concentration - Maximum Annual Production

Job Number 20803 | AQU-NW-004-20803 34
Wallarah 2 Air Quality and Greenhouse Gas Assessment R4.docx
7.1.2 Annual Average Incremental Ground Level PM2.5 Concentrations
Contour plots for the predicted glcs of PM2.5 due to the Project alone are presented in Figure 7.2.
Annual average PM2.5 predictions are presented for the maximum annual production scenario.
There are no privately owned receivers that are predicted to experience glcs of PM2.5 above the
assessment criteria, due to emissions from the Project alone. The highest predicted glcs occur at the
closest residence to the south-west of the Buttonderry site (P17). At this location, the predicted
incremental annual average PM2.5 concentration is 0.47 µg/m3 compared to the 0.46 µg/m3 at the
same receptor under the previous assessment.
Species:
PM2.5
Location:
Wyong
Scenario:
Maximum Annual Production
Percentile:
N/A
Averaging Time:
Annual
Model Used:
CALPUFF v8.1.0
Units:
µg/m3
Assessment Criterion:
N/A
Met Data:
CALMET
Plot:
L. McDonough
Figure 7.2: Incremental Annual Average PM2.5 Concentration – Maximum Annual Production

Job Number 20803 | AQU-NW-004-20803 35
Wallarah 2 Air Quality and Greenhouse Gas Assessment R4.docx
7.1.3 Annual Average Incremental Ground Level TSP Concentrations
Contour plots for the predicted glcs of TSP due to the Project alone are presented in Figure 7.3. Annual
average TSP predictions are presented for the maximum annual production scenario.
There are no privately owned receivers that are predicted to experience glcs of TSP above the
assessment criteria, due to emissions from the Project alone. The highest predicted glcs occur at the
closest residence to the north of the site (P11). At this location, the predicted incremental annual
average TSP concentration is 2.6 µg/m3 compared to 2.4 µg/m3 at the same receptor under the
previous assessment.
Species:
TSP
Location:
Wyong
Scenario:
Maximum Annual Production
Percentile:
N/A
Averaging Time:
Annual
Model Used:
CALPUFF v8.1.0
Units:
µg/m3
Assessment Criterion:
N/A
Met Data:
CALMET
Plot:
L. McDonough
Figure 7.3: Incremental Annual Average TSP Concentration – Maximum Annual Production

Job Number 20803 | AQU-NW-004-20803 36
Wallarah 2 Air Quality and Greenhouse Gas Assessment R4.docx
7.1.4 Annual Average Incremental Ground Level Dust Deposition Level
Consistent with the previous assessment, deposited dust concentrations have been calculated by
combining the modelled results from the dry deposition portion of PM2.5, PM10 and TSP. These
concentrations have been added together to obtain total incremental dust deposition rates due to the
Project at each residence.
Contour plots for the predicted dust deposition levels due to the Project alone are presented in Figure
7.4. Annual average dust deposition predictions are presented for the maximum annual production
scenario. The relevant impact assessment criterion is shown by the red contour line.
There are no privately owned receivers that are predicted to experience dust deposition above the
assessment criteria, due to emissions from the Project alone. The highest predicted levels occur at the
closest residence to the north of the site (P11). At this location, the predicted incremental annual
average dust deposition under the current assessment is 0.13 g/m2/month compared to 0.14
g/m2/month at the same receptor under the previous assessment.
Species:
Dust Deposition
Location:
Wyong
Scenario:
Maximum Annual Production
Percentile:
N/A
Averaging Time:
Annual
Model Used:
CALPUFF v8.1.0
Units:
g/m2/month
Assessment Criterion:
2 g/m2/month (shown in red)
Met Data:
CALMET
Plot:
L. McDonough
Figure 7.4: Incremental Annual Average Dust Deposition – Maximum Annual Production

Job Number 20803 | AQU-NW-004-20803 37
Wallarah 2 Air Quality and Greenhouse Gas Assessment R4.docx
7.2 Maximum Incremental 24-hour Average Concentrations
The current assessment has modelled the annual average and corresponding maximum 24-hour
average concentrations at each receptor based on the maximum annual production scenario. In the
previous assessment the maximum 24-hour average concentrations were based on modelling a
maximum daily production scenario.
The ratio of maximum 24-hour average concentrations under a maximum annual production scenario
and a maximum daily production scenario was determined from the modelled results for the previous
assessment. In this assessment, the maximum 24-hour average concentrations under a maximum daily
production scenario were estimated by applying this ratio to the modelled results for the maximum
annual production scenario for this assessment.
These ratios have been applied at all receptor sites for PM10 and PM2.5 under the current assessment.
The maximum daily results are provided in Table 7.1.
7.2.1 Maximum 24-hour Average PM2.5 Concentrations
The contours for maximum 24-hour average PM2.5 concentrations are shown in Figure 7.5. Individual
results for each receptor are presented in Table 7.1. There are no privately owned receivers that are
predicted to experience glcs of PM2.5 above the assessment criteria, due to emissions from the Project
alone. The highest predicted levels occur at the closest residence to the north-west of the Buttonderry
Site (P17). At this location, the predicted incremental concentration due to maximum daily production
is 5.3 µg/m3 compared to 4.9 µg/m3 under the previous assessment.

Job Number 20803 | AQU-NW-004-20803 38
Wallarah 2 Air Quality and Greenhouse Gas Assessment R4.docx
Species:
PM2.5
Location:
Wyong
Scenario:
Maximum Daily Production
Percentile:
N/A
Averaging Time:
24 hour
Model Used:
CALPUFF v8.1.0
Units:
µg/m3
Assessment Criterion:
N/A
Met Data:
CALMET
Plot:
L. McDonough
Figure 7.5: Maximum 24-hour average PM2.5 Concentration – Maximum Daily Production
Contour results for the maximum 24-hour average PM10 concentrations are presented in Figure 7.6.
Results for individually assessed receptors are shown in Table 7.1. There are no privately owned receivers
that are predicted to experience glcs of PM10 above the assessment criteria, due to emissions from the
Project alone. The highest predicted levels occur at the closest residence to the north of the Tooheys
Road Site (P11). At this location, the predicted incremental concentration due to maximum daily
production is 29.5 µg/m3 compared to 27.2 µg/m3 under the previous assessment.

Job Number 20803 | AQU-NW-004-20803 39
Wallarah 2 Air Quality and Greenhouse Gas Assessment R4.docx
Species:
PM10
Location:
Wyong
Scenario:
Maximum Daily Production
Percentile:
N/A
Averaging Time:
24 hour
Model Used:
CALPUFF v8.1.0
Units:
µg/m3
Assessment Criterion:
N/A
Met Data:
CALMET
Plot:
L. McDonough
Figure 7.6: Maximum 24-hour average PM10 Concentration – Maximum Daily Production
7.3 Cumulative Impact Assessment
7.3.1 24-Hour average PM10
There are no available continuous 24-hour PM10 data for the area. HVAS data are available every sixth
day, however, this is insufficient to provide a representative background for each day of the model
simulation.
A statistical approach (using a Monte Carlo Simulation) is presented to investigate the potential for
cumulative 24-hour PM10 impacts. The approach takes all of the available background monitoring
data from HVAS C and HVAS E and randomly generates a daily 24-hour PM10. This random daily
background concentration is added to model predictions for each day of the year, at selected
receptor locations. The addition of the random background to the model predicted 24-hour PM10 is
repeated 250,000 times to generate a probability distribution of cumulative 24-hour PM10
concentrations. The Monte Carlo Simulation is run using the Oracle Crystal Ball software (version
11.1.1.2).
The process assumes that a randomly selected background value from the real dataset would have a
chance equal to that of any other background value from the dataset of occurring on the given future
day when the Project is operational. With sufficient repetition, this would yield a good statistical

Job Number 20803 | AQU-NW-004-20803 40
Wallarah 2 Air Quality and Greenhouse Gas Assessment R4.docx
estimate of the combined and independent effects of varying background and Project contributions
to total 24-hour PM10.
The results of the simulation are extracted and the predicted number of days that cumulative 24-hour
PM10 concentration would exceed certain 24-hour PM10 concentrations is determined for each
residence.
This is shown in Figure 7.7 for the worst impacted assessment location close to both the Buttonderry Site
(P17) and the Tooheys Road Site (P11). The plots show the cumulative 24-hour PM10 concentration
compared with the existing background, as discussed in Section 4.2.
As shown in Figure 7.7 there is a very low probability that cumulative 24-hour PM10 concentrations would
result in any additional days over 50 µg/m3 compared with those which would occur regardless due to
background in the absence of the Project.

Job Number 20803 | AQU-NW-004-20803 41
Wallarah 2 Air Quality and Greenhouse Gas Assessment R4.docx
Figure 7.7: Predicted number of days over 24-Hour PM10 Concentration at worst impacted residences

Job Number 20803 | AQU-NW-004-20803 42
Wallarah 2 Air Quality and Greenhouse Gas Assessment R4.docx
7.3.2 Annual Average
The predicted annual average pollutant concentrations at each of the sensitive receptors are added
to the adopted background levels calculated in Section 4.3, and are presented in Table 7.2.
There are no privately owned receivers that are predicted to exceed the annual average assessment
criteria when existing background concentrations are included.
Table 7.2: Predicted Cumulative Ground Level Concentrations at Receptor Locations
Receptor
ID Easting Northing
PM2.5 PM10 TSP Dust deposition
Annual Annual Annual Annual
Previous Current Previous Current Previous Current Previous Current
Units µg/m3 g/m2/month
Criteria 8 30 90 4 P1 357855 6322289 5.0 7.0 18.1 17.2 31.2 33.2 1.6 1.6
P2 357021 6322338 5.0 7.0 18.2 17.2 31.2 33.3 1.6 1.6
P3 356284 6322807 5.1 7.1 18.4 17.5 31.6 33.7 1.6 1.6
P4 354803 6322823 5.1 7.1 18.2 17.3 31.3 33.4 1.7 1.7
P5 353943 6323781 5.0 7.0 18.1 17.1 31.2 33.2 1.6 1.6
P6 355040 6325280 5.1 7.1 18.2 17.2 31.2 33.3 1.6 1.6
P7 355524 6325206 5.1 7.1 18.4 17.4 31.5 33.6 1.6 1.6
P8 355898 6325231 5.1 7.1 18.7 17.8 32.0 34.1 1.7 1.7
P9 356509 6325499 5.2 7.2 19.1 18.3 32.5 34.9 1.7 1.7
P10 357203 6326257 5.1 7.1 18.4 17.5 31.4 33.6 1.6 1.6
P11 356222 6325149 5.3 7.3 19.6 18.7 33.4 35.6 1.7 1.7
P12 359426 6324622 5.1 7.1 18.3 17.4 31.3 33.5 1.6 1.7
P13 351245 6322968 5.1 7.1 18.1 17.1 31.1 33.1 1.6 1.6
P14 351364 6322948 5.1 7.1 18.1 17.1 31.1 33.1 1.6 1.6
P15 351632 6322985 5.2 7.2 18.2 17.2 31.2 33.2 1.6 1.6
P16 351783 6322837 5.3 7.3 18.3 17.3 31.3 33.4 1.6 1.7
P17 351940 6322848 5.5 7.5 18.5 17.5 31.5 33.5 1.7 1.7
P18 351815 6323743 5.2 7.1 18.2 17.2 31.2 33.2 1.6 1.6
P19 351054 6323433 5.1 7.1 18.1 17.1 31.1 33.1 1.6 1.6
P20 351205 6323857 5.1 7.1 18.1 17.1 31.1 33.1 1.6 1.6
P21 351920 6323989 5.1 7.1 18.1 17.1 31.1 33.1 1.6 1.6
P22 351795 6322769 5.3 7.3 18.3 17.3 31.3 33.3 1.6 1.6
P23 351869 6322717 5.2 7.2 18.2 17.3 31.2 33.3 1.6 1.6
P24 352046 6322637 5.2 7.2 18.2 17.2 31.2 33.3 1.6 1.6
P25 352248 6322672 5.2 7.2 18.2 17.2 31.2 33.2 1.6 1.6
P26 352359 6322615 5.1 7.1 18.2 17.2 31.2 33.2 1.6 1.6
P27 352154 6322523 5.1 7.1 18.1 17.2 31.1 33.2 1.6 1.6
P28 352245 6322549 5.1 7.1 18.1 17.1 31.1 33.2 1.6 1.6
P29 352319 6322512 5.1 7.1 18.1 17.1 31.1 33.2 1.6 1.6
P30 352693 6322395 5.1 7.1 18.1 17.1 31.1 33.2 1.6 1.6
P31 352562 6322475 5.1 7.1 18.1 17.1 31.1 33.2 1.6 1.6
P32 352562 6322404 5.1 7.1 18.1 17.1 31.1 33.1 1.6 1.6
P33 352462 6322452 5.1 7.1 18.1 17.1 31.1 33.1 1.6 1.6
P34* 361381 6323610 - 7.0 - 17.1 - 33.1 - 1.6
P35* 361587 6323932 - 7.0 - 17.1 - 33.1 - 1.6
P36* 359671 6324160 - 7.0 - 17.3 - 33.3 - 1.7
P37* 359364 6323755 - 7.0 - 17.3 - 33.4 - 1.7
P38* 358556 6328262 - 7.0 - 17.1 - 33.1 - 1.6
P39* 358831 6328322 - 7.0 - 17.1 - 33.1 - 1.6
P40* 358813 6327963 - 7.0 - 17.1 - 33.1 - 1.6
P41* 358926 6326668 - 7.0 - 17.2 - 33.2 - 1.6
P42* 359543 6326914 - 7.0 - 17.1 - 33.1 - 1.6
P43* 359243 6327014 - 7.0 - 17.1 - 33.1 - 1.6
*Receptor not previously assessed

Job Number 20803 | AQU-NW-004-20803 43
Wallarah 2 Air Quality and Greenhouse Gas Assessment R4.docx
7.4 Potential Impacts on Proposed Jilliby Subdivision
The Jilliby Stage 2 Land Owners Action Group are proposing a rural residential subdivision immediately
west of the proposed Buttonderry Site. The subdivision would involve staged rezoning of approximately
400 hectares north of Sandra St, Jilliby.
Based on the modelling results presented in the sections above, it is not anticipated that the proposed
rezoning would result in any significant impact for future residential dwellings as part of the subdivision.
The expected air quality impacts on future residential dwellings are expected to be similar to the
predictions presented in Table 7.1 for assessment locations P13 to P21.

Job Number 20803 | AQU-NW-004-20803 44
Wallarah 2 Air Quality and Greenhouse Gas Assessment R4.docx
8 COAL TRANSPORTATION
The Amended Project will involve:
Removal of the previously proposed rail loop;
Re-location of the rail spur and train load out facility to the eastern side of the Main Northern
Rail Line; and
A conveyor system to deliver product coal from the stockpile to the new train load out facility
which will facilitate the transportation of coal by rail to the Port of Newcastle.
Dust emissions associated with train loading have been included as part of the modelling assessment of
mining operations as described in Section 6. Potential impacts from the fugitive dust emissions from
coal wagons and diesel emissions from engines during rail transportation have not been quantitatively
assessed within the modelling assessment and are discussed below.
To ensure fugitive dust emissions from coal transportation are kept to a minimum, KEPCO are
committed to water spraying of the coal surface during train loading, as well as best practice load
profiling. A study of dust emissions from rail transport at Duralie Coal mine found that the water spray
system in place at the train loading facility was very effective in controlling dust emissions from rail
transport, achieving 99% control of emissions (Katestone, 2012a).
Studies completed for the Australian Rail Track Corporation (ARTC) assessed particulate emissions from
coal trains (Environ, 2012 and Katestone, 2012b). Both studies investigated particulate matter (PM)
emissions from coal trains (loaded and unloaded) compared with emissions from passenger and freight
trains. The Environ study found that at one site, there was no statistical difference in concentrations
across all particulate size fractions for all train types. At the other site, it was concluded that
concentrations coinciding with loaded and unloaded coal train passes are statistically higher for PM10,
but not other size fractions, compared with concentrations recorded during passenger train passes.
There was no statistical difference between loaded coal train and unloaded coal trains.
The Katestone 2012b study concluded that loaded coal trains were not associated with a statistically
significant difference in PM10 and PM2.5 compared with concentrations when no train passed.
Unloaded coal trains were associated with a statistically significant difference in PM10 and PM2.5
compared with concentrations when no train passed.
A subsequent re-analysis of the data collected for Katestone 2012b (Ryan and Wand, 2014) found
evidence that that particulate levels were elevated when all train types passed by the monitoring
station, with the strongest correlation for loaded and unloaded coal trains, for all particle size fractions.
Ryan and Wand (2014) note that since coal dust is likely to be reflected in the larger particle counts (TSP
and PM10) this finding suggested that other contaminants such as diesel may be of more concern than
coal dust.
Subsequent to this, additional analysis was completed to incorporate further data in the form of
precipitation data from Cessnock and Maitland, and the number of locomotives pulling each train
(Ryan, 2015). The analysis showed that the number of locomotives had little influence on the increased
particulate levels associated with various types of trains passingb, which dispels, to some extent, the
hypothesis that diesel exhaust explains a large proportion of the observed increases in particulate levels
associated with train passings. The analysis did however show that particulate levels were significantly
influenced by whether or not it had rained the day previous to sample collection at Maitland (but very
b Ryan 2015 does state an important caveat from ARTC that the information on the number of locomotives per train is likely to have
been reported with some error.

Job Number 20803 | AQU-NW-004-20803 45
Wallarah 2 Air Quality and Greenhouse Gas Assessment R4.docx
little relationship to rainfall at Cessnock)c and this was the same irrespective of train type. Current day
rainfall at Maitland was not strongly associated with particulate levels, nor was rainfall at Cessnock. The
hypothesis here is that a key mechanism for the increased particulate levels is the resuspension by
passing trains of dust particles that had previously settled on the tracks and nearby ground. Particulate
levels are higher when any train is passing, as well as during the five minute period after the trains have
passed. The magnitude of the increase was found to be similar for freight, loaded coal and unloaded
coal trains, and roughly half that magnitude when passenger trains are passing.
For both studies (Environ, 2012 and Katestone, 2012b), PM concentrations were recorded at short
distances from the track and for short averaging periods to coincide with train passes, therefore no
quantification of impact at residential areas can be inferred from the studies. Notwithstanding this,
WACJV is committed to making sure exposed coal in loaded wagons is moistened when loaded to
minimise the potential for wind erosion.
To put the potential fugitive emissions from loaded coal trains into context, an estimate has been made
as to the levels of PM that may occur. Assuming a loaded train contains a maximum of 60 wagons,
each 16.1 m in length and 2 m in width, the total surface area of exposed coal would be just over
1,930 m2 (0.19 ha). Katestone (2012a) suggests that if the product coal is watered as it is loaded to
trains, then emissions can be controlled by up to 99%. Assuming a conservative control factor of 50%
(allowing time for the coal to dry somewhat en-route to Newcastle), and an emission factor of
0.1 kg/ha/h (USEPA, 1985), then the total windblown TSP emissions from loaded coal trains may be of
the order of 85 kg/y. Even if no control factor was assumed, windblown TSP emissions would amount to
approximately 170 kg/y (TSP), which constitutes less than 0.2 % of the total annual emissions for the
worst-case operational year (Year 5), as calculated in Section 6.2. Since these emissions would be
spread across a large area between the rail load-out and Newcastle, ground level concentrations due
to this source would therefore be extremely low. Emissions from loaded coal trains are not considered
further in this assessment.
In summary, the rail load-out facility would be designed such that:
■ The surface of the product coal will be sprayed with water prior to transportation
■ Load size will be limited to ensure that coal deposited into wagons is profiled such that it avoids
overfilling and spillage.
■ Loading will be such that a consistent profile is maintained.
As noted in Ryan and Wand (2014), the findings suggested that other contaminants, such as the
products of combustion due to the use of diesel in the locomotives, may be of more concern than coal
dust. Whilst it now appears (that the diesel emissions themselves are not a direct cause of the elevated
particulate levels measured (Ryan, 2015) , Australia currently has no national exhaust standards for new
or re-manufactured locomotives.
In order to start addressing this issue, the NSW EPA published a Diesel and Marine Emissions Strategy (the
Strategy) in January 2015 (NSW EPA, 2015). The Strategy has the objective to ‘progressively control and
reduce diesel and marine emissions from priority sectors – shipping, locomotives and non-road
equipment used by EPA- licensed activities’.
The Strategy sets out actions that the EPA has implemented and further steps it is taking to ensure that
NSW benefits from the availability of feasible and cost-effective approaches and technologies to
reduce non-road diesel and marine emissions. With respect to rail locomotives, the Strategy sets the
following goals:
■ Investigate feasibility and support adoption of new emissions controls for locomotives
c It is stated in Ryan 2015 that these results make sense as the Maitland meteorological station is quite close to the particulate
monitoring site.

Job Number 20803 | AQU-NW-004-20803 46
Wallarah 2 Air Quality and Greenhouse Gas Assessment R4.docx
■ Update the NSW regulatory framework to ensure accountability of diesel locomotive operators
for improved emissions performance.
Table 8.1 presents a summary of the goals, associated milestones, the original timing for
implementation, and the status at April 2016.
Table 8.1: Strategy overview for locomotives
Focus area Goals Milestones Timing per NSW EPA,
2015 Status at April 2016
Rail –
locomotives
and rail
construction
Investigate
feasibility and
support adoption
of new emissions
control
technology for
locomotives.
Update NSW
regulatory
framework to
ensue
accountability of
diesel locomotive
operators for
improved
emissions
performance.
Proposed
change to
Schedule 1 of
POEO Act.
2nd quarter
2015
Consultation draft of an
amendment expected
to be exhibited on the
EPA website in early
2016.
Pilot locomotive
emission
upgrade
program
Complete by 3rd
quarter 2015
Preliminary work
completed, Stage 2
due end April 2016
Licensing of
rolling stock
operators and
of rail
construction
activities as
separate
scheduled
activities
Expected to
commence 4th
quarter 2015
Consultation draft of an
amendment expected
to be exhibited on the
EPA website in early
2016.
In September 2015, the Hon. Mark Speakman MP, Minister for the Environment, requested the NSW
Chief Scientist & Engineer, Professor Mary O'Kane, to undertake a review of rail coal dust emissions
management practices in the NSW coal chain in line. The first phase was completed in November 2015
with the release of an Initial Report (NSW Chief Scientist & Engineer, 2015). This first phase focussed on
scoping the problem and understanding the issues, including community concerns, scientific
knowledge, initiatives in NSW and other jurisdictions, and gaps in knowledge. The Initial Review
concluded that whilst it was evident that there has been a substantial amount of work over of number
of years in the Hunter rail corridor to both measure and reduce dust and particulates, the available
studies only provide partial information about specific issues, and no existing studies (or set of studies)
can definitely determine if there is a problem. It was identified that the gaps in knowledge exist around
localised emissions in or near the rail corridor. Whilst studies indicate that there are increased levels of
dust in the rail corridor when some trains pass, there is insufficient knowledge around the composition of
the dust, the source of the dust, the quality and concentration, and the dispersion of this dust from the
rail corridor. The next phase of the Review has been focussing on how to better understand these
unknowns. The final report is stated as being due on 31 March 2016. However, at the time of writing it
had not yet been published.

Job Number 20803 | AQU-NW-004-20803 47
Wallarah 2 Air Quality and Greenhouse Gas Assessment R4.docx
9 GREENHOUSE GAS ASSESSMENT
9.1 Introduction
Greenhouse gas (GHG) emissions have been estimated based on the methods outlined in the following
documents:
The World Resources Institute/World Business Council for Sustainable Development
(WRI/WBCSD) Greenhouse Gas Protocol The Greenhouse Gas Protocol – A Corporate
Accounting and Reporting Standard Revised Edition (WRI/WBCSD, 2004) (GHG Protocol).
National Greenhouse and Energy Reporting (Measurement) Determination 2008.
The Commonwealth Department of Climate Change and Energy Efficiency (DCCEE) National
Greenhouse Accounts (NGA) Factors August 2015 (DCCEE, 2015).
The GHG Protocol establishes an international standard for accounting and reporting of GHG emissions.
The GHG Protocol has been adopted by the International Standard Organisation, endorsed by GHG
initiatives (such as the Carbon Disclosure Project) and is compatible with existing GHG trading schemes.
Three ‘scopes’ of emissions (scope 1, scope 2 and scope 3) are defined for GHG accounting and
reporting purposes, as described below. This terminology has been adopted in Australian GHG
reporting and measurement methods and has been employed in this assessment. The ‘scope’ of an
emission is relative to the reporting entity. Indirect scope 2 and scope 3 emissions will be reportable as
direct emissions from another facility.
A discussion of the types of activities associated with Scope 1, Scope 2 and Scope 3 emissions are
detailed in Section 10.1 of the previous AQGHGA (PAEHolmes, 2012).
9.2 Greenhouse Gas Emission Estimates
Emissions of carbon dioxide (CO2) and CH4 would be the most significant GHGs for the Project. These
gases are formed and released during the combustion of fuels used on site and from fugitive emissions
occurring during the mining process, due to the liberation of CH4 from coal seams.
Inventories of GHG emissions can be calculated using published emission factors. Different gases have
different greenhouse warming effects (referred to as global warming potentials) and emission factors
take into account the global warming potentials of the gases created during combustion. The
estimated emissions are referred to in terms of carbon dioxide equivalent (CO2-e) emissions by applying
the relevant global warming potential. The GHG assessment has been conducted using the National
Greenhouse Account (NGA) Factors, published by the DCCEE (2015).
Project-related GHG sources included in the assessment are detailed in Section 10.2 of the previous
AQGHGA (PAEHolmes, 2012)
A summary of the annual GHG emissions is provided in Table 9.1. Scope 1 emissions over the 28 years
assessed remain very similar with to the previous AQGHGA (PAEHolmes, 2012). Scope 2 emissions have
slightly increased from the previous assessment due to the addition of four conveyor motors which has
led to an increase in electricity use. Scope 3 emissions have largely decreased slightly aside from a
slight increase in emissions due to energy production.
Full details of all calculations are provided in Appendix D.
9.3 GHG Benefits from Flaring and Beneficial Re-Use
Consistent with the previous project design, a proportion of the gas (approximately 35%) will be
released via the mine ventilation system (as MVA) as described above. However, the capture and

Job Number 20803 | AQU-NW-004-20803 48
Wallarah 2 Air Quality and Greenhouse Gas Assessment R4.docx
flaring of the remaining CH4 (pre and post mining) will have significant benefits in terms of reducing
GHG emissions.
When compared to 100% fugitive emissions of CH4, the flaring scenario results in a GHG saving of
approximately 5.5 Mt CO2-e over 28 years (8 Mt CO2-e over the potential 38 year mine life) or 54% of
Scope 1 emissions.
Additional GHG savings would be realised through the use of onsite power generation. Further details
of this are provided in Section 10.3 of the previous AQGHGA (PAEHolmes, 2012).

Job Number 20803 | AQU-NW-004-20803 49
Wallarah 2 Air Quality and Greenhouse Gas Assessment R4.docx
Table 9.1: Summary of Annual Greenhouse Gas Emissions
Scope 1 Emissions
(t CO2-e)
Scope 2 Emissions
(t CO2-e)
Scope 3 Emissions
(t CO2-e)
Year Diesel Fugitive
MVA Flaring Total Electricity Diesel Electricity
Energy
Production Rail Total
Year 1 4,803 0 0 4,803 3,881 247 554 0 0 802
Year 2 4,803 0 0 4,803 3,881 247 554 0 0 802
Year 3 91 6,014 1,844 7,949 5,516 5 788 438,712 249 439,754
Year 4 294 19,503 5,980 25,778 9,185 15 1,312 1,422,716 806 1,424,850
Year 5 913 60,514 18,556 79,983 20,337 47 2,905 4,414,387 2,502 4,419,841
Year 6 1,994 132,172 40,530 174,696 39,824 103 5,689 9,641,754 5,464 9,653,010
Year 7 1,654 109,645 33,622 144,921 33,698 85 4,814 7,998,442 4,533 8,007,874
Year 8 1,972 130,677 40,071 172,720 39,418 102 5,631 9,532,696 5,402 9,543,831
Year 9 2,287 151,607 46,489 200,384 45,110 118 6,444 11,059,513 6,268 11,072,343
Year 10 2,050 135,876 41,665 179,591 40,832 106 5,833 9,911,921 5,617 9,923,477
Year 11 2,293 151,947 46,593 200,833 45,202 118 6,457 11,084,299 6,282 11,097,156
Year 12 2,353 155,956 47,823 206,132 46,292 121 6,613 11,376,774 6,447 11,389,956
Year 13 2,366 156,840 48,094 207,300 46,533 122 6,648 11,441,218 6,484 11,454,471
Year 14 2,126 140,904 43,207 186,238 42,199 109 6,028 10,278,754 5,825 10,290,717
Year 15 2,152 142,603 43,728 188,483 42,661 111 6,094 10,402,684 5,895 10,414,785
Year 16 2,050 135,876 41,665 179,591 40,832 106 5,833 9,911,921 5,617 9,923,477
Year 17 2,563 169,887 52,095 224,545 50,081 132 7,154 12,393,000 7,023 12,407,310
Year 18 2,563 169,887 52,095 224,545 50,081 132 7,154 12,393,000 7,023 12,407,310
Year 19 2,563 169,887 52,095 224,545 50,081 132 7,154 12,393,000 7,023 12,407,310
Year 20 2,467 163,499 50,136 216,102 48,344 127 6,906 11,927,023 6,759 11,940,816
Year 21 2,514 166,625 51,094 220,234 49,194 129 7,028 12,155,054 6,888 12,169,100
Year 22 2,461 163,092 50,011 215,563 48,233 127 6,890 11,897,280 6,742 11,911,039
Year 23 2,297 152,219 46,677 201,192 45,276 118 6,468 11,104,128 6,293 11,117,007
Year 24 2,222 147,258 45,156 194,636 43,927 114 6,275 10,742,252 6,088 10,754,730
Year 25 2,162 143,317 43,947 189,426 42,855 111 6,122 10,454,735 5,925 10,466,893
Year 26 2,184 144,744 44,385 191,312 43,243 112 6,178 10,558,836 5,984 10,571,110
Year 27 2,115 140,191 42,989 185,294 42,005 109 6,001 10,226,704 5,796 10,238,609
Year 28 2,185 144,846 44,416 191,447 43,271 113 6,182 10,566,272 5,988 10,578,554
Total 62,497 3,505,584 1,074,963 4,643,044 1,061,990 3,219 151,713 255,727,076 144,924 256,026,932

Job Number 20803 | AQU-NW-004-20803 50
Wallarah 2 Air Quality and Greenhouse Gas Assessment R4.docx
9.4 Impact on the Environment
According to the Intergovernmental Panel on Climate Change’s (IPCC) Fifth Assessment Report, global
surface temperature has increased by 0.89ºC ± 0.2ºC during the 100 years ending 2012 (IPCC, 2013).
The IPCC has determined “most of the observed increase in globally averaged temperatures since the
mid-twentieth century is very likely due to the observed increase in anthropogenic greenhouse gas
concentrations”. “Very likely” is defined by the IPCC as greater than 90% probability of occurrence
(IPCC, 2013).
Climate change projections specific to Australia have been determined by the CSIRO and the
Australian Bureau of Meteorology (BoM), based on global emissions scenarios predicted by the latest
IPCC assessment (CSIRO, 2015a). These projections supersede those released by CSIRO and the BoM in
2007. Although the findings are similar to those of the 2007 projections, the range of emissions scenarios
is broader than those used for the 2007 projections. The latest projections begin with concentration
levels, rather than socio-economic assumptions followed by inferred emissions.
The projected changes have been prepared for four Representative Concentration Pathways (RCPs),
which represent the following scenarios of emissions of greenhouse gases, aerosols and land-use
change:
RCP8.5 (high emissions) - represents a future with little curbing of emissions, with CO2
concentrations continuing to rapidly rise, reaching 940 parts per million (ppm) by 2100.
RCP6.0 (intermediate emissions) - represents lower emissions, achieved by application of some
mitigation strategies and technologies. This scenario results in the CO2 concentration rising less
rapidly than RCP8.5, but still reaching 660 ppm by 2100.
RCP4.5 (intermediate emissions) - represents a similar scenario to RCP6.0, but emissions peak
earlier (around 2040), and the CO2 concentration reaches 540 ppm in 2100.
RCP2.6 (low emissions) - assumes a very strong emissions reductions from a peak at around
2020 to reach a CO2 concentration at about 420 ppm by 2100. This pathway would require
early participation from all emitters, including developing countries, as well as the application
of technologies for actively removing carbon dioxide from the atmosphere.
For climate change projections, a regionalisation scheme using natural resource management regional
boundaries has been used to divide Australia up into 8 clusters and 15 sub-clusters. For the projections
described above, Table 9.2 presents the changes in annual temperature relative to the 1986-2005
period for the Central Coast sub-cluster where the Project is located.
Table 9.2: Projected Changes in Annual Temperature (relative to the 1986-2005 period)
2030 – RCP2.6
(low emissions
scenario)
2030 – RCP4.5
(intermediate
emissions scenario)
2030 – RCP8.5
(high emissions
scenario)
2090 – RCP2.6
(low emissions
scenario)
290 – RCP4.5
(intermediate
emissions
scenario)
2090 – RCP8.5
(high emissions
scenario)
Temperature (°C)
0.9 (0.6 to 1.2) 1 (0.6 to 1.3) 1.1 (0.7 to 1.5) 1.1 (0.6 to 1.8) 2.1 (1.4 to 2.7) 4.2 (3 to 5.4)
Notes: The table gives the median (50th percentile) change with the 10th and 90th percentile range given within brackets.
RCP6.0 is not included due to a smaller sample of model simulations available compared to the other RCPs. (CSIRO,
2015a).
Source: CSIRO (2015b) Climate Change in Australia – Projections for Australia’s NRM Regions – Central Slopes Cluster Report,
Commonwealth Scientific and Industrial Research Organisation.
The CSIRO also details projected changes to other meteorological parameters (for example rainfall,
potential evaporation, wind speed, relative humidity and solar radiation) and the predicted changes
to the prevalence of extreme weather events (for example droughts, bush fires and cyclones).
The potential social and economic impacts of climate change to Australia are detailed in the Garnaut
Climate Change Review (Garnaut, 2008), which draws on IPCC assessment work and the CSIRO

Job Number 20803 | AQU-NW-004-20803 51
Wallarah 2 Air Quality and Greenhouse Gas Assessment R4.docx
climate projections. The Garnaut review details the negative and positive impacts associated with
predicted climate change with respect to:
Agricultural productivity.
Water supply infrastructure.
Urban water supplies.
Buildings in coastal settlements.
Temperature related deaths.
Ecosystems and biodiversity.
Geopolitical stability and the Asia Pacific region.
The Project’s contribution to projected climate change, and the associated impacts, would be in
proportion with its contribution to global GHG emissions. Average annual scope 1 emissions from the
Project (0.5 Mt CO2-e) would represent approximately 0.1% of Australia’s commitment under the
original Kyoto Protocol (591.5 Mt CO2-e) and a very small portion of global GHG emissions, given that
Australia contributed approximately 1.12% of global GHG emissions in 2012 (PBL Netherlands
Environmental Assessment Agency, 2015).
A comparison of predicted annual GHG emissions from the Project with global, Australian and NSW
emissions inventories are presented in Table 9.3.
Table 9.3: Comparison of Greenhouse Gas Emissions
Geographic
coverage
Source
coverage
Timescale Emissions
Mt CO2-e
Reference
Project Scope 1 only Average annual 0.2 This report.
Global Consumption
of fossil fuels
Total since
industrialisation
1750 - 1994
865,000 IPCC (2007a). Figure 7.3 converted from
Carbon unit basis to CO2 basis. Error is
stated greater than ±20%.
Global CO2-e
emissions
2014 35,700 PBL Netherlands Environmental Assessment
Agency, 2015
Australia 1990 Base 1990 547.7 United Nations Framework on Climate
Change – Kyoto Protocol base year data
http://unfccc.int/ghg_data/kp_data_unfcc
c/base_year_data/items/4354.php
Australia Kyoto target Average annual
2008 - 2012
591.5 Based on 1990 net emissions multiplied by
108% Australia’s Kyoto emissions target.
Australia Total 2013 538.0 Taken from the National Greenhouse Gas
Inventory 2013
http://www.environment.gov.au/system/file
s/resources/7d7f7ef6-e028-462e-b15c-
ede14e222e65/files/national-inventory-
report-2013-vol1.pdf
NSW Total 2013 151.5 Taken from the State and Territory National
Greenhouse Gas Inventory (2013)
http://www.environment.gov.au/system/file
s/resources/9e33b185-1fb6-44b7-9d72-
6979f3427b94/files/state-territory-
inventories-2013.pdf
The commitment from the Australian Government to reduce GHG emissions is proposed to be
achieved through the introduction of the Australian Government’s Direct Action Plan. The centrepiece
of the plan is Emissions Reduction Fund which will provide incentives for emissions reduction activities
across the Australian economy. The legislation to establish the Emissions Reduction Fund came into
effect in December 2014.

Job Number 20803 | AQU-NW-004-20803 52
Wallarah 2 Air Quality and Greenhouse Gas Assessment R4.docx
9.5 Greenhouse Gas Emissions Intensity
The estimated GHG emissions intensity of the Project is approximately 0.045 t CO2-e/t ROM coal (scope
1 emissions only). The estimated emissions intensity of the Project is similar to the majority of
underground coal mines in Australia (0.05 t CO2-e/t coal) (scope 1 emissions only) (Deslandes, 1999).
Figure 9.1 (derived from Deslandes, 1999) shows the GHG intensity of the Project compared to other
Australian coal mines.
Figure 9.1: GHG Intensity Comparison
It is noted that the Project will not have a coal washery and associated reject emplacement, resulting
in reduced demand for electricity and diesel.
9.6 Project Greenhouse Gas and Energy Reduction Measures
As proposed under the previous assessment, the Project will develop an Energy and Greenhouse
Strategy within 2 years after the commencement of longwall coal extraction. Further details regarding
the Strategy are provided in Section 10.6 of the previous AQGHGA (PAEHolmes, 2012).

Job Number 20803 | AQU-NW-004-20803 53
Wallarah 2 Air Quality and Greenhouse Gas Assessment R4.docx
10 MANAGEMENT AND MONITORING
10.1 Construction Dust Management
The principal emissions from the construction phase of the Project will be dust and particulate matter,
occurring from the following activities:
Vegetation clearing and earthmoving during site preparation and access road construction;
Excavation of portal and ventilation shafts and stockpiling of excavated material;
Excavated material handling, shaping, and bund construction;
Movement of heavy plant and machinery within the site;
Graders / scrapers working access road construction; and
Wind erosion from exposed surfaces.
Procedures for controlling dust impacts during construction have been discussed in Section 11.1.1 to
Section 11.1.4 of the previous AQGHGA (PAEHolmes, 2012).
10.2 Operational Dust Control
Sources of emissions during operation of the Project are described in Section 6.2 and Table 6.3.
Based on the predicted impacts from the Project, the proposed management measures, developed in
accordance with the NSW EPA best practice document ‘NSW Coal Mining Benchmarking Study:
International Best Practice Measures to Prevent and/or Minimise Emissions of Particulate Matter from
Coal Mining‘ (Donnelly et al., 2011), are considered feasible and reasonable.
10.3 Monitoring
A discussion of the proposed monitoring activities to occur is provided in Section 11.3 of the previous
AQGHGA (PAEHolmes, 2012).

Job Number 20803 | AQU-NW-004-20803 54
Wallarah 2 Air Quality and Greenhouse Gas Assessment R4.docx
11 CONCLUSION
Pacific Environment has completed an Air Quality and Greenhouse Gas Assessment for the Amended
Project in accordance with the requirements as identified throughout the planning approvals process.
The key air quality issues assessed are emissions of dust during the operation of the Project. During
construction, fugitive dust emissions can also be expected, however the total estimated TSP emissions
are less than 85% of the emissions estimated to occur during operation of the Project. Therefore
compliance with air quality goals during the operation of the mine is assumed to represent compliance
during mine construction.
Dispersion modelling was conducted for a maximum annual production scenario to predict the ground
level concentrations for all relevant pollutants. Maximum daily emissions at each receiver assessed
were estimated using the ratios from the maximum daily production scenario and maximum annual
production scenarios at each receptor obtained from the previous modelling (PAEHolmes, 2012). This
ratio was applied to the modelled results from the maximum production scenario at each receptor
under the current modelling to assess the glcs resulting from maximum daily production.
The results of the modelling indicate that the predicted incremental PM10, PM2.5, TSP and dust
deposition at the closest residential receptors are all below the impact assessment criteria. The highest
predicted glcs occur at the closest residence to the north of the Tooheys Road Site (P11) and the
receptor closest to the Buttonderry Site (P17).
A cumulative assessment, incorporating existing background levels, indicates that the Project is unlikely
to result in any additional exceedances of relevant impact assessment criteria at the neighbouring
receivers.
Emissions to air associated with the flaring of methane and use in power generation would not change
from the previous assessment (see Section 7.3 of the Air Quality and Greenhouse Gas Assessment
(PAEHolmes, 2012). Additionally, odour impacts are not expected to significantly change as a result of
the Amendment.
An assessment of the GHG emissions associated with the Project indicates that average annual scope
1 emissions would represent approximately 0.04% of Australia’s commitment under the Kyoto Protocol
(591.5 Mt CO2-e) and a very small portion of global greenhouse emissions.

Job Number 20803 | AQU-NW-004-20803 55
Wallarah 2 Air Quality and Greenhouse Gas Assessment R4.docx
12 REFERENCES
Aust N, Watkiss P, Boulter P and Bawden K (2013). Methodology for valuing the health impacts of
changes in particle emissions – Final Report. PAEHolmes Report 6695.
Boulter P and Kulkarni K (2013). “Final Report – Volume 1: Main Report. Economic Analysis to Inform the
National Plan for Clean Air (Particles)”. Prepared by Pacific Environment Limited and Marsden Jacob
Associates for NEPC Service Corporation, August 2013.
Bureau of Meteorology (2016) Climate averages for Station: 061366
www.bom.gov.au/climate/averages/tables/cw_061366.shtml (accessed 04 April 2016).
Chow, J.C. (1995) Measurement methods to determine compliance with ambient air quality standards
for suspended particles, J. Air & Waste Manage. Assoc. 45, 320-382, May 1995.
CSIRO (2015a). “Climate Change in Australia – Climate Change Projections, Technical Report”.
CSIRO (2015b). “Technical Report, Climate Change in Australia, Projections for Australia’s Natural
Resource Management Regions”.
DECCW (2009). ”Action for Air: 2009 Update”. Available from
http://www.environment.nsw.gov.au/resources/air/actionforair/09712ActionforAir.pdf (accessed 15
April 2016).
DCCEE (2015) “National Greenhouse Account (NGA) Factors”. Published by the Department of Climate
Change and Energy Efficiency. http://www.climatechange.gov.au/
DECC (2007)”New South Wales Annual Compliance Report 2006”. Available at
www.scew.gov.au/system/files/resources/0389f889-e0a7-4ad4-7dc9-51d20958f481/files/aaq-mntrpt-
2006-nsw-report-final.pdf. Accessed April 15 2016.
DECCW (2009)”Action for Air: 2009 Update”.
Deslandes (1999) “Energy/Greenhouse Benchmarking Study of Coal Mining Industry, a study
undertaken for Mineral Resources and Energy Program, Australian Geological Survey Organisation &
Energy Efficiency Best Practice Program”. Department of Industry, Science and Resources.
Donnelly, S.-J., Balch, A., Wiebe, A., Shaw, N., Welchman, S., Schloss, A., Castillo, E., Henville, K., Vernon,
A., Planner, J. (2011) “NSW Coal Mining Benchmarking Study: International Best Practice Measures to
Prevent and / or Minimise Emissions of Particulate Matter from Coal Mining” Prepared by Katestone
Environmental Pty Ltd for Office of Environment and Heritage June 2011.
DP&E (2014). “Voluntary Land Acquisition and Mitigation Policy for State Significant Mining, Petroleum
and Extractive Industry Development” NSW Government 15 December 2014.
Environ (2012). “Pollution Reduction Program (PRP) 4 - Particulate Emissions from Coal Trains”. Available
from www.artc.com.au/library/particulate_report_final.pdf (accessed 11 April 2016).
ERM (2008) Wallarah 2 Coal Project Monitoring Summary May 2006 to December 2007 - Wyong Areas
Joint Venture, January 2008.
ERM (2009) Wallarah 2 Coal Project Monitoring Summary January 2008 to December 2008 - Wyong
Areas Joint Venture, February 2009.
ERM (2010) Wallarah 2 Coal Project Monitoring Summary January 2009 to December 2009 - Wyong
Areas Joint Venture, May 2010.

Job Number 20803 | AQU-NW-004-20803 56
Wallarah 2 Air Quality and Greenhouse Gas Assessment R4.docx
ERM (2011) Wallarah 2 Coal Project Monitoring Summary January to December 2010 - Wyong Areas
Joint Venture, February 2011.
ERM (2012) Wallarah 2 Coal Project Monitoring Summary January to December 2011 - Wyong Areas
Joint Venture, March 2012.
ERM (2013) Wallarah 2 Coal Project Monitoring Summary January to December 2011- Wyong Areas
Joint Venture, February 2013.
Garnaut, R (2008) “The Garnaut Climate Change Review”. Cambridge University Press.
GeoGas (2002) “Draft Report on Greenhouse Gas Emission Assessment, Wyong Project”. Prepared for
Coal Operations Australia, Report No.: 2002-193 / January 2002).
Golder Associates (2013). “Exposure Assessment and Risk Characterisation to Inform Recommendations
for Updating Ambient Air Quality Standards for PM2.5, PM10, O3, NO2, SO2”. Golder Associates Report
Number 127643066-001-R-Rev0.
Hansen Bailey (2013) Wallarah 2 Coal Project – Air Quality and Greenhouse Gas Assessment.
Hurley, P. (2008) TAPM V4. Part 1: Technical Description, CSIRO Marine and Atmospheric Research
Paper.
Hurley, P., M. Edwards, et al. (2009) "Evaluation of TAPM V4 for Several Meteorological and Air Pollution
Datasets." Air Quality and Climate Change 43(3): 19.
IPCC (2007a) “Summary for Policymakers. In: Climate Change 2007: The Physical Science Basis.
Contribution of Working Group I to the Fourth Assessment Report of the Intergovernmental Panel on
Climate Change”. Solomon, S., D. Qin, M. Manning, Z. Chen, M. Marquis, K.B. Averyt, M.Tignor and H.L.
Miller (eds.). Cambridge University Press, Cambridge, United Kingdom and New York, NY, USA.
IPCC (2007b) “Climate Change 2007: Synthesis Report”. An Assessment of the Intergovernmental Panel
on Climate Change.
IPCC (2013) “Working Group I Contribution to the IPCC Fifth Assessment Report Clime Change 2013: The
Physical Science Basis: Final Draft Underlying Scientific-Technical Assessment”. Prepared by the IPCC, 30
September 2013.
Jalaludin B and Cowie C (2012). “Health Risk Assessment – Preliminary Work to Identify Concentration-
Response Functions for Selected Ambient Air Pollutants”. Report prepared for EPA Victoria. Respiratory
and Environmental Epidemiology, Woolcock Institute of Medical Research. 30 June 2012.
Katestone (2012a). “Duralie Extension Project Study of Rail Dust Emissions from Rail Transport”. Prepared
for Duralie Coal Pty Ltd by Katestone Environmental Pty Ltd, February 2012). Available from
http://www.gloucestercoal.com.au/documents/community_environment/duralie/Duralie%20Extension
%20Project%20Study%20of%20Dust%20Emissions%20from%20Rail%20Transport.pdf (accessed 11 April
2016.
Katestone (2012b). “Pollution Reduction Program 4.2 - Particulate Emissions from Coal Trains”. Available
from http://www.artc.com.au/library/Work%20Program%20PRP%204.2.pdf (accessed 3 February 2015)
Liberal Party of Australia (2010) “Direct Action Plan”.

Job Number 20803 | AQU-NW-004-20803 57
Wallarah 2 Air Quality and Greenhouse Gas Assessment R4.docx
NEPC (1998) "Final Impact Statement for the Ambient Air Quality National Environment Protection
Measure" National Environment Protection Council Service Corporation, Level 5, 81 Flinders Street,
Adelaide SA 5000.
NEPC (1998a) Ambient Air – National Environment Protection Measures for Ambient Air Quality National
Environment Protection Council, Canberra
NEPC (2016) Ambient Air – National Environment Protection Measures (Ambient Air Quality) Measure as
amended. 25 February 2016.
NERDDC (1988) “Air pollution from surface coal mining: Volume 2 Emission factors and model
refinement”, National Energy Research and Demonstration Council, Project 921.
NSW Chief Scientist & Engineer (2015) “Initial Report on the Independent Review of Rail Coal Dust
Emissions Management Practices in the NSW Coal Chain”. November 2015.
NSW Department of Planning and Environment (2015) “Guidelines for the economic assessment of
mining and coal seam gas proposals – Draft for consultation”. October 2015. Available at:
http://planspolicies.planning.nsw.gov.au/index.pl?action=view_job&job_id=7312.
NSW DEC (2005) “Approved Methods for the Modelling and Assessment of Air Pollutants in NSW”,
August 2005.
NSW EPA (1998). Action for Air – The NSW Government’s 25-Year Air Quality Management Plan NSW
Environment Protection Authority, Sydney
NSW EPA (2015) “Diesel and Marine Emissions Strategy”, January 2015.
PAEHolmes (2012) Wallarah 2 Coal Project Environmental Impact Statement, Appendix L Air Quality and
Greenhouse Gas Assessment. Available from
https://majorprojects.affinitylive.com/public/4dff928b67638f15c2ace2f3a025b5de/13.%20Wallarah%202
%20Coal%20Project%20EIS%20-%20Appendix%20L%20-%20Air%20Quality%20Impact%20Assessment.pdf.
Accessed April 14, 2016.
PBL Netherlands Environmental Assessment Agency (2013). “Trends in Global CO2 Emissions. 2013
Report”. Available from http://edgar.jrc.ec.europa.eu/news_docs/pbl-2013-trends-in-global-co2-
emissions-2013-report-1148.pdf (accessed 11 April 2016).
POEO (2010). Protection of the Environment Operations (Clean Air) Regulation 2010. Available from
http://www.legislation.nsw.gov.au/maintop/view/inforce/subordleg+428+2010+cd+0+N (accessed 15
April 2016).
Queensland Rail Network Access (2002) “Comparison of Greenhouse Gas Emissions by Australian
Intermodal Rail and Road Transport”.
Robe, F (2009) Flare Modelling CASANZ 2009 Conference Joint Odour and Modelling Workshop – Perth
September 6, 2009. TRC Atmospheric Study Group.
Ryan (2015) “Additional Analysis of ARTC Data on Particulate Emissions in the Rail Corridor”. Prepared
on behalf of access UTS for Environmental Protection Authority. August 2015.
Ryan, L and Wand, M (2014). Re-analysis of ARTC data on Particulate Emissions from Coal Trains,
prepared by Prof, Louise Ryan and Prof Matthew Wand, on behalf of UTS, 25 February 2014.
Scire, J.S., D.G. Strimaitis and R.J. Yamartino (2000) A User’s Guide for the CALPUFF Dispersion Model
(Version 5), Earth Tech, Inc., Concord, MA
http://edgar.jrc.ec.europa.eu/news_docs/pbl-2013-trends-in-global-co2-emissions-2013-report-1148.pdf

Job Number 20803 | AQU-NW-004-20803 58
Wallarah 2 Air Quality and Greenhouse Gas Assessment R4.docx
TRC (2011) “Generic Guidance and Optimum Model Settings for the CALPUFF Modelling System for
Inclusion into the “Approved Methods for Modelling and Assessment of Air Pollutants in NSW, Australia”,
prepared for NSW DECCW, Sydney Australia.
US EPA (1985) “Compilation of Air Pollutant Emission Factors”, AP-42, Fourth Edition United States
Environmental Protection Agency, Office of Air and Radiation Office of Air Quality Planning and
Standards, Research Triangle Park, North Carolina 27711.
US EPA (1995) “Compilation of Air Pollutant Emission Factors”, AP-42, Fourth Edition United States
Environmental Protection Agency, Office of Air and Radiation Office of Air Quality Planning and
Standards, Research Triangle Park, North Carolina 27711.
World Resources Institute/World Business Council for Sustainable Development (2004) “The Greenhouse

Job Number 20803 | AQU-NW-004-20803 A-1
Wallarah 2 Air Quality and Greenhouse Gas Assessment R4.docx
Appendix A ASSESSMENT LOCATIONS AND LAND OWNERSHIP

Job Number 20803 | AQU-NW-004-20803 A-2
Wallarah 2 Air Quality and Greenhouse Gas Assessment R4.docx
Assessment
Location ID Easting Northing Owner Name
1 357855 6322289 STEVEN BARRY MCKEOGH & SIEW TING MCKEOGH
2 357021 6322338 ARTHUR ROBERT MUNROE & SUSAN JOAN MUNRO
3 356284 6322807 JT & KE HUTCHINSON
4 354803 6322823 STANDARD INDUSTRIES PTY LIMITED
5 353943 6323781 DELCARE CONSTRUCTIONS PTY LIMITED
6 355040 6325280 WYONG COAL PTY LIMITED
7 355524 6325206 BJ & KR DRAKE
8 355898 6325231 N & A IORDANIDIS
9 356509 6325499 DJC SUAREZ
10 357203 6326257 NORMAN JAMES HAWKINS & ADA MARIE HAWKINS
11 356222 6325149 KR DRAKE
12 351245 6322968 AT ETHELL
13 359426 6324622 N/A Representative of Bluehaven Residential Area
14 351364 6322948 ZS MUSLU
15 351632 6322985 C TOHAMY & MUSLIM COMMUNITY CO-OPERATIVE (AUSTRALIA) LTD
16 351783 6322837 S WONG & S LIN & PH LEE
17 351940 6322848 LA & R ATCHISON
18 351815 6323743 EM DUNN
19 351054 6323433 KG & KA MACDONALD
20 351205 6323857 MJ BAULCH
21 351920 6323989 F & EM MERCIECA
22 351795 6322769 CJ CAMPBELL & EI HINSON
23 351869 6322717 J EDINGTON
24 352046 6322637 RW & CP & BW IKIN
25 352248 6322672 WYONG COAL PTY LIMITED
26 352359 6322615 WYONG COAL PTY LIMITED
27 352154 6322523 CJ & L BAUERHUIT
28 352245 6322549 JF & AP RITCHIE
29 352319 6322512 ME & JE WALTERS
30 352693 6322395 HELI-AUST LAND HOLDINGS PTY LTD
31 352562 6322475 B & B MITROVIC
32 352562 6322404 J & R DIMIS
33 352462 6322452 RO & AE HOLLAND
34 361381 6323610 NORTHLAKES HIGH SCHOOL
35 361587 6323932 NORTHLAKES PUBLIC SCHOOL
36 359671 6324160 36 TURNER CLOSE, BLUE HAVEN
37 359364 6323755 109 BIRDWOOD DR, BLUE HAVEN
38 358556 6328262 WYEE PUBLIC SCHOOL
39 358831 6328322 WYEE UNION CHURCH
40 358813 6327963 SEVENTH-DAY ADVENTIST CHURCH WYEE
41 358926 6326668 555 BUSHELLS RIDGE ROAD, BUSHELLS RIDGE
42 359543 6326914 259 WYEE ROAD, WYEE
43 359243 6327014 16 GOSFORD ROAD, WYEE

Job Number 20803 | AQU-NW-004-20803 B-1
Wallarah 2 Air Quality and Greenhouse Gas Assessment R4.docx
Appendix B MODEL SET UP

Job Number 20803 | AQU-NW-004-20803 B-2
Wallarah 2 Air Quality and Greenhouse Gas Assessment R4.docx
Model Set Up
TAPM (v 4.0.4)
Number of grids (spacing) 4 (30 km, 10 km, 3 km, 1 km)
Number of grid points 43 x 43 x 35
Year of analysis Jul 2010 – Jun 2011
Centre of analysis (local coordinates) 354890, 6323821
CALMET (v. 6.42)
Meteorological grid domain 30 km x 30 km
Meteorological grid resolution 250 m
Input data
Surface station data from Wallarah, Cooranbong, Norah Head
and cloud cover and height from Williamtown.
Prognostic 3D.dat extracted from TAPM at 1 km grid
CALMET Model Options used
Flag Descriptor Default Value Used
IEXTRP Extrapolate surface
wind observations to
upper layers
Similarity theory Similarity theory
BIAS (NZ) Relative weight given
to vertically
extrapolated surface
observations versus
upper air data
NZ * 0 -1, -0.5, -0.25, 0, 0, 0, 0
TERRAD Radius of influence of
terrain
No default (typically
5- 15km)
6 km
RMAX1 and RMAX2 Maximum radius of
influence over land
for observations in
layer 1 and aloft
No Default 2.5 km
R1 and R2 Distance from
observations in layer 1
and aloft at which
observations and
Step 1 wind fields are
weighted equally
No Default 2.5 km

Job Number 20803 | AQU-NW-004-20803 B-3
Wallarah 2 Air Quality and Greenhouse Gas Assessment R4.docx
CALPUFF Model Options used
Flag Flag Descriptor Value Used Value Description
MCHEM Chemical
Transformation
0 Not modelled
MDRY Dry Deposition 1 Yes for PM
MTRANS Transitional plume rise
allowed?
1 Yes
MTIP Stack tip downwash? 1 Yes
MRISE Method to compute
plume rise
1 Briggs plume rise
MSHEAR Vertical wind Shear 0 Vertical wind shear not modelled
MPARTL Partial plume
penetration of
elevated inversion?
1 Yes
MSPLIT Puff Splitting 0 No puff splitting
MSLUG Near field modelled
as slugs
0 Not used
MDISP Dispersion
Coefficients
2 Based on micrometeorology
MPDF Probability density
function used for
dispersion under
convective conditions
0 No
MROUGH PG sigma y,z adjusted
for z
0 No
MCTADJ Terrain adjustment
method
3 Partial Plume Adjustment
MBDW Method for building
downwash
1 ISC method

Job Number 20803 | AQU-NW-004-20803 C-1
Wallarah 2 Air Quality and Greenhouse Gas Assessment R4.docx
Appendix C ESTIMATED EMISSIONS

Job Number 20803 | AQU-NW-004-20803 C-2
Wallarah 2 Air Quality and Greenhouse Gas Assessment R4.docx
Wallarah 2 Coal Project
Estimated emissions are presented for all significant dust generating activities associated with the
construction and operation of the Project.
Fugitive dust emissions can be expected during construction from the following activities:
excavation of material for the box cut, ventilation shafts and ROM stockpile area;
loading of material to trucks and transport within site;
dozers on excavated material; and
graders working road construction.
Fugitive dust emissions can be expected during operation from the following activities:
loading stockpile from conveyor;
wind erosion and maintenance on stockpiles; and
upcast ventilation shafts.
Loading / dumping waste rock
Each tonne of material loaded will generate a quantity of particulate matter that will depend on the
wind speed and the moisture content according to the US EPA emission factor equation (US EPA, 1985
and updates) shown below:
𝐸 (𝑘𝑔/𝑡) = 𝑘 × 0.0016 × ((
𝑈2.2
)1.3
(𝑀2
)1.4 )
Where:
K = 0.74 for TSP, 0.35 for PM10 and 0.053 for PM2.5
U – wind speed (m/s)
M – moisture content (%)
The moisture content of waste material is assumed to be 5% and the wind speed of 1.3 m/s is taken from
the measured wind at the Wallarah AWS for the period July 2010 – June 2011.
Hauling material / coal on unsealed surfaces
The emission estimate of wheel generated dust associated with hauling at the pit top areas (i.e. for
hauling of waste rock material during construction is based the US EPA AP42 emission equation for
unpaved surfaces at industrial sites (US EPA, 1985 and updates) shown below:
𝐸 (𝑘𝑔/𝑉𝐾𝑇) = 0.2819 × 𝑘 × [ × (𝑠/12)^0.7 × ((𝑊 × 1.1023)/3)^0.45]

Job Number 20803 | AQU-NW-004-20803 C-3
Wallarah 2 Air Quality and Greenhouse Gas Assessment R4.docx
Where:
k = 4.9 for TSP, 1.5 for PM10 and 0.015 for PM2.5
s = silt content of road surface
W = mean vehicle weight
The silt content (s) for the haulage routes is assumed to be 4%.
The mean vehicle weight used in the emissions estimates is an average of the loaded and unloaded
gross vehicle mass, to account for one empty trip and one loaded trip. Haul trucks carrying waste
during construction are assumed to have a payload of 136 t and a tare weight of 181 t.
Dozers working on waste rock
Emissions from dozers on waste have been calculated using the US EPA emission factor equation (US
EPA, 1985 and updates).
𝐸(𝑘𝑔/ℎ𝑟) = 𝑘 ×𝑠1.2
𝑀1.3
Where:
k = 2.6 for TSP, 0.3375 for PM10 and 0.0273 for PM2.5
s = silt content (assumed to be 10%)
M = moisture content (assumed to be 2%).
Active Stockpiles – Wind Erosion and Maintenance
The following US EPA (1985 and updates) emission factor equation has been used for wind erosion.
𝐸𝑇𝑆𝑃 (𝑘𝑔/ℎ𝑎/ℎ𝑟) = 1.8 𝑥 𝑈 Where:
U= mean wind speed (m/s) and is taken as 1.3 m/s from the Wallarah meteorological site.
For PM10 this is multiplied by a factor of 0.5 and for 0.075 for PM2.5.

Job Number 20803 | AQU-NW-004-20803 C-4
Wallarah 2 Air Quality and Greenhouse Gas Assessment R4.docx
Estimated emissions of TSP during Operations
Estimated emissions of PM10 during Operations
ACTIVITY - Operations (Annual)
TSP Emission
kg/year Intensity units
Emission
factor units
Variable
1 units
Variable
2 units
Variable
3 units Variable 4 units Variable 5 units
Variable
6 units Assumptions
Tooheys Road Site
CL - Conveyor transfer @ Portal 828 5,000,000 t/y 0.0002 kg/t 0.50 average of (wind speed/2.2)^1.3 5 moisture content in % % controlIntensity assumed for max production year. Moisture content of coal as per
2009 EA.
CL - Conveyor transfer to ROM stockpile 248 5,000,000 t/y 0.0002 kg/t 0.50 average of (wind speed/2.2)^1.3 5 moisture content in % 70 % control 70% control to reflect two sides and a roof.
CL - Loading ROM stockpile from conveyor 828 5,000,000 t/y 0.0002 kg/t 0.50 average of (wind speed/2.2)^1.3 5 moisture content in % % controlIntensity assumed for max production year. Moisture content of coal as per
2009 EA
CL - Active ROM Stockpiles (wind erosion and
maintenance - assumes maintenance by FEL/Dozer) 13,324 1.3 ha 2.34 kg/ha/hr 8760 h/y 1.3 average wind speed m/s 50 % control
Area of stockpile taken supplied DXF. Control assumed for fixed water
sprays.
CL - Conveyor transfer to Crushing Station 248 5,000,000 t/y 0.0002 kg/t 0.50 average of (wind speed/2.2)^1.3 5 moisture content in % 70 % controlIntensity assumed for max production year. Moisture content of coal as per
2009 EA. 70% control to reflect 3 enclosed sides.
CL - Processing - Crushing Station 450 5000000 t/y 0.0006 kg/t 70 % controlIntensity assumed for max production year. Moisture content of coal as per
2009 EA. 70% control to reflect 3 enclosed sides.
CL - Conveyor transfer between crusher and stockpile 124 5,000,000 t/y 0.0002 kg/t 0.50 average of (wind speed/2.2)^1.3 5 moisture content in % 70 % controlIntensity assumed for max production year. Moisture content of coal as per
2009 EA. 70% control to reflect 3 enclosed sides.
CL - Conveyor transfer to Product stockpile 248 5,000,000 t/y 0.0002 kg/t 0.50 average of (wind speed/2.2)^1.4 5 moisture content in % 70 % control70% control to reflect two sides and a roof plus 50% control from water
sprays
CL - Loading Product stockpile from conveyor gantry 828 5,000,000 t/y 0.0002 kg/t 0.50 average of (wind speed/2.2)^1.3 5 moisture content in % % controlIntensity assumed for max production year. Moisture content of coal as per
2008 EA
CL - Active Product Stockpiles (wind erosion and
maintenance - assumes maintenance by FEL/Dozer) 48,171 4.7 ha 2.34 kg/ha/hr 8760 h/y 1.3 average wind speed m/s 50 % control
Area of stockpile taken supplied DXF. Control assumed for fixed water
sprays.
CL - Loading from Product Stockpile to Conveyor 828.2902849 5000000 t/y 0.00016566 kg/t 0.50463 average of (wind speed/2.2)^1.3 5 moisture content in % % controlIntensity assumed for max production year. Moisture content of coal as per
2008 EA
CL - Unloading material at transfer points 124.2435427 5000000 t/y 0.00016566 kg/t 0.50463 average of (wind speed/2.2)^1.3 5 moisture content in % 85 % controlIntensity assumed for max production year. Moisture content of coal as per
2008 EA. Control assumed for fully enclosed transfer points and the use of
Conveying from stockpiles to train load out bin 248.4870855 5000000 t/y 0.00016566 kg/t 0.50463 average of (wind speed/2.2)^1.3 5 moisture content in % 70 % controlIntensity assumed for max production year. Moisture content of coal as per
2008 EA. 70% control to reflect 2 sides and a roof.
Transfer from conveyor to train load out bin 248.4870855 5000000 t/y 0.00016566 kg/t 0.50463 average of (wind speed/2.2)^1.3 5 moisture content in % 70 % controlIntensity assumed for max production year. Moisture content of coal as per
2008 EA; 70% control for enclosure
CL - Loading Trains from Train Load Out Bin 828 5,000,000 t/y 0.0002 kg/t 0.50 average of (wind speed/2.2)^1.3 5 moisture content in % % controlIntensity assumed for max production year. Moisture content of coal as per
2008 EA. No controls for stockpile loading
Buttonderry Site
Ventilation Shaft 23,337 11,668 10^6 m3/yr 2.0000TSP Conc.
(mg/m3)8760 h/y 3600 s/hour 370
Flow Rate
(m3/s)% control
Flow rate take from 2008 EA. Particulate concentration for Vent Shaft
taken from measurements at Tasman Underground Mine (HAS, 2007)
Total Annual TSP (kg) 90,914
ACTIVITY - Operations (Annual)
PM10 Emission
kg/year Intensity units
Emission
factor units
Variable
1 units
Variable
2 units
Variable
3 units Variable 4 units Variable 5 units
Variable
6 units Assumptions
Tooheys Road Site
CL - Conveyor transfer @ Portal 392 5,000,000 t/y 0.0001 kg/t 0.50 average of (wind speed/2.2)^1.2 5 moisture content in % % controlIntensity assumed for max production year. Moisture content of coal as per
2009 EA.
CL - Conveyor transfer to ROM stockpile 118 5,000,000 t/y 0.0001 kg/t 0.50 average of (wind speed/2.2)^1.3 5 moisture content in % 70 % control 70% control to reflect two sides and a roof.
CL - Loading ROM stockpile from conveyor 392 5,000,000 t/y 0.0001 kg/t 0.50 average of (wind speed/2.2)^1.3 5 moisture content in % % controlIntensity assumed for max production year. Moisture content of coal as per
2009 EA
CL - Active ROM Stockpiles (wind erosion and
maintenance - assumes maintenance by FEL/Dozer) 6,662 1.3 ha 1.17 kg/ha/hr 8760 h/y 1.3 average wind speed m/s 50 % control
Area of stockpile taken supplied DXF. Control assumed for fixed water
sprays.
CL - Conveyor transfer to Crushing Station 118 5,000,000 t/y 0.0001 kg/t 0.50 average of (wind speed/2.2)^1.3 5 moisture content in % 70 % controlIntensity assumed for max production year. Moisture content of coal as per
2009 EA. 70% control to reflect 3 enclosed sides.
CL - Processing - Crushing Station 405 5,000,000 t/y 0.00027 kg/t 70 % control70% ontrol assumed for full enclosure of crushing station. Wet supression
emission factor used as water controls will be used.
CL - Conveyor transfer between crusher and stockpile 118 5,000,000 t/y 0.0001 kg/t 0.50 average of (wind speed/2.2)^1.2 5 moisture content in % 70 % controlIntensity assumed for max production year. Moisture content of coal as per
2009 EA. 70% control to reflect 3 enclosed sides.
CL - Conveyor transfer to Product stockpile 118 5,000,000 t/y 0.0001 kg/t 0.50 average of (wind speed/2.2)^1.3 5 moisture content in % 70 % control 70% control to reflect two sides and a roof.
CL - Loading Product stockpile from conveyor gantry 392 5,000,000 t/y 0.0001 kg/t 0.50 average of (wind speed/2.2)^1.3 5 moisture content in % % controlIntensity assumed for max production year. Moisture content of coal as per
2008 EA
CL - Active Product Stockpiles (wind erosion and
maintenance - assumes maintenance by FEL/Dozer) 24,086 4.7 ha 1.17 kg/ha/hr 8760 h/y 1.3 average wind speed m/s 50 % control
Area of stockpile taken supplied DXF. Control assumed for fixed water
sprays.
CL - Loading from Product Stockpile to Conveyor 392 5,000,000 t/y 0.0001 kg/t 0.50 average of (wind speed/2.2)^1.3 5 moisture content in % % controlIntensity assumed for max production year. Moisture content of coal as per
2008 EA
CL - Unloading material at transfer points 59 5,000,000 t/y 0.0001 kg/t 0.50 average of (wind speed/2.2)^1.3 5 moisture content in % 85 % controlIntensity assumed for max production year. Moisture content of coal as per
2008 EA. 70% control assumed for fully enclosed transfer points.
Conveying from stockpiles to train load out bin 118 5,000,000 t/y 0.0001 kg/t 0.50 average of (wind speed/2.2)^1.3 5 moisture content in % 70 % controlIntensity assumed for max production year. Moisture content of coal as per
2008 EA. 70% control to reflect 2 sides and a roof.
Transfer from conveyor to train load out bin 118 5,000,000 t/y 0.0001 kg/t 0.50 average of (wind speed/2.2)^1.3 5 moisture content in % 70 % controlIntensity assumed for max production year. Moisture content of coal as per
2008 EA
CL - Loading Trains from Train Load Out Bin 392 5,000,000 t/y 0.0001 kg/t 0.50 average of (wind speed/2.2)^1.3 5 moisture content in % % controlIntensity assumed for max production year. Moisture content of coal as per
2008 EA. No controls for stockpile loading
Buttonderry Site
Ventilation Shaft 23,337 11,668 10^6 m3/yr 2.0000TSP Conc.
(mg/m3)8760 h/y 3600 s/hour 370
Flow Rate
(m3/s)% control
Flow rate take from 2008 EA. Particulate concentration for Vent Shaft
taken from measurements at Tasman Underground Mine (HAS, 2007)
Total Annual PM10 (kg) 57,212

Job Number 20803 | AQU-NW-004-20803 C-5
Wallarah 2 Air Quality and Greenhouse Gas Assessment R4.docx
Estimated emissions of PM2.5 during Operations
Estimated emissions of TSP during Construction
ACTIVITY - Operations (Annual) PM2.5 Emission kg/year Intensity units
Emission
factor units
Variable
1 units Variable 2 units Variable 3 units Variable 4 units Variable 5 units
Variable
6 units Assumptions
Source
type
Tooheys Road Site
CL - Conveyor transfer @ Portal 59 5,000,000 t/y 0.000012 kg/t 0.50 average of (wind speed/2.2)^1.3 5 moisture content in % % controlIntensity assumed for max production year. Moisture content of coal as per
2009 EA.1
CL - Conveyor transfer to ROM stockpile 18 5,000,000 t/y 0.000012 kg/t 0.50 average of (wind speed/2.2)^1.3 5 moisture content in % 70 % control 70% control to reflect 3 enclosed sides. 2
CL - Loading ROM stockpile from conveyor 59 5,000,000 t/y 0.000012 kg/t 0.50 average of (wind speed/2.2)^1.3 5 moisture content in % % controlIntensity assumed for max production year. Moisture content of coal as per
2009 EA2
CL - Active ROM Stockpiles (wind erosion and maintenance - assumes
maintenance by FEL/Dozer) 999 1.3 ha 0.1755 kg/ha/hr 8760 h/y 1.3 average wind speed m/s 50 % control
Area of stockpile taken supplied DXF. Control assumed for fixed water
sprays.2
CL - Conveyor transfer to Crushing Station 18 5,000,000 t/y 0.000012 kg/t 0.50 average of (wind speed/2.2)^1.3 5 moisture content in % 70 % controlIntensity assumed for max production year. Moisture content of coal as per
2009 EA. 70% control to reflect 3 enclosed sides.2
CL - Processing - Crushing Station 75 5,000,000 t/y 0.00005 kg/t 70 % control70% ontrol assumed for full enclosure of crushing station. Wet supression
emission factor used as water controls will be used.1
CL - Conveyor transfer between crusher and stockpile 18 5,000,000 t/y 0.000012 kg/t 0.50 average of (wind speed/2.2)^1.3 5 moisture content in % 70 % controlIntensity assumed for max production year. Moisture content of coal as per
2009 EA. 70% control to reflect 3 enclosed sides.1
CL - Conveyor transfer to Product stockpile 18 5,000,000 t/y 0.000012 kg/t 0.50 average of (wind speed/2.2)^1.3 5 moisture content in % 70 % control 70% control to reflect 3 enclosed sides. 2
CL - Loading Product stockpile from conveyor gantry 59 5,000,000 t/y 0.000012 kg/t 0.50 average of (wind speed/2.2)^1.3 5 moisture content in % % controlIntensity assumed for max production year. Moisture content of coal as per
2008 EA2
CL - Active Product Stockpiles (wind erosion and maintenance -
assumes maintenance by FEL/Dozer) 3,613 4.7 ha 0.1755 kg/ha/hr 8760 h/y 1.3 average wind speed m/s 50 % control
Area of stockpile taken supplied DXF. Control assumed for fixed water
sprays.2
CL - Loading from Product Stockpile to Conveyor 59.32349338 5000000 t/y 1.1865E-05 kg/t 0.50463 average of (wind speed/2.2)^1.3 5 moisture content in % % controlIntensity assumed for max production year. Moisture content of coal as per
2008 EA2
CL - Unloading material at transfer points 8.898524007 5000000 t/y 1.1865E-05 kg/t 0.50463 average of (wind speed/2.2)^1.3 5 moisture content in % 85 % controlIntensity assumed for max production year. Moisture content of coal as per
2008 EA. 70% control assumed for fully enclosed transfer points.2
Conveying from stockpiles to train load out bin 17.79704801 5000000 t/y 1.1865E-05 kg/t 0.50463 average of (wind speed/2.2)^1.3 5 moisture content in % 70 % controlIntensity assumed for max production year. Moisture content of coal as per
2008 EA. 70% control to reflect 2 sides and a roof.2
Transfer from conveyor to train load out bin 17.79704801 5000000 t/y 1.1865E-05 kg/t 0.50463 average of (wind speed/2.2)^1.3 5 moisture content in % 70 % controlIntensity assumed for max production year. Moisture content of coal as per
2008 EA2
CL - Loading Trains from Train Load Out Bin 59 5,000,000 t/y 0.000012 kg/t 0.50 average of (wind speed/2.2)^1.3 5 moisture content in % % controlIntensity assumed for max production year. Moisture content of coal as per
2008 EA. No controls for stockpile loading2
Buttonderry Site
Ventilation Shaft 23,337 11,668 10^6 m3/yr 2.0000TSP Conc.
(mg/m3)8760 h/y 3600 s/hour 370
Flow Rate
(m3/s)% control
Flow rate take from 2008 EA. Particulate concentration for Vent Shaft
taken from measurements at Tasman Underground Mine (HAS, 2007)1
Total Annual PM2.5 (kg) 28,436
ACTIVITY - Construction
TSP Emission
kg/year Intensity units
Emission
factor units
Variable
1 units
Variable
2 units
Variable
3 units Variable 4 units Variable 5 units
Variable
6 units Assumptions
Source
type
Tooheys Road Site
Dozer clearing vegetation 11,583 692 h/y 16.74 kg/h 10 silt content in % 2 moisture content in % 1
Loading of excavated material to trucks 69 304,550 t/y 0.0002 kg/t 0.50 average of (wind speed/2.2)^1.3 4 moisture content in % 2
Hauling of excavated material to trucks 2,729 304,550 t/y 0.036 kg/t 28 t/truck load 38 Vehicle gross mass (t) 0.5km/return
trip2.0 kg/VKT 4
% silt
conten75 % control 1
Hauling of drift material from drift to crusher by truck 3,431 382,883 t/y 0.036 kg/t 28 t/truck load 38 Vehicle gross mass (t) 0.5km/return
trip0.3 kg/VKT 4
% silt
conten75 % control 2
CL - Processing - Crushing Station 69 382,883 t/y 0.0006 kg/t 70 % control 1
CL - Conveyor transfer of drift material from crusher to rail
spur 87 382,883 t/y 0.0002 kg/t 0.50 average of (wind speed/2.2)^1.2 4 moisture content in % % control 1
Dumping of excavated material 156 687,433 t/y 0.0002 kg/t 0.50 average of (wind speed/2.2)^1.3 4 moisture content in % 2
FEL / Dozer Shaping 6,525 960 t/y 6.8 kg/h 10 silt content in % 4 moisture content in % 1
Wind erosion - exposed areas 24,528 7 ha 0.4 kg/ha/hr 3
Buttonderry Site
Dozer clearing vegetation 4,820 288 h/y 16.74 kg/h 10 silt content in % 2 moisture content in % 1
Loading of excavated material to trucks 33 146,850 t 0.0002 kg/t 0.50 average of (wind speed/2.2)^1.3 4 moisture content in % 2
Hauling of excavated material to trucks 1,316 146,850 t/y 0.036 kg/t 28 t/truck load 38 Vehicle gross mass (t) 0.5km/return
trip2.0 kg/VKT 4
% silt
conten75 % control 1
Dumping of excavated material 33 146,850 t 0.0002 kg/t 0.50 average of (wind speed/2.2)^1.3 4 moisture content in % 2
FEL / Dozer Shaping 6,525 960 t/y 6.8 kg/h 10 silt content in % 4 moisture content in % 1
Wind erosion 14,016 4 ha 0.4 kg/ha/hr 3
Total Annual TSP (kg) 75,919
As per previous assessment - generally retained assumption from 2008 EA:
- amounts of excavated material
- dozer hours
- moisture contents
- trip distances
Updated the following:
- hauling emission equation
-topsoil silt content
- updated truck payload and vehicle gross mass based on CAT785. Drift
material will now go from drift to crusher and conveyed to rail spur (per
Andrew Wu email 8/3/16)

Job Number 20803 | AQU-NW-004-20803 D-1
Wallarah 2 Air Quality and Greenhouse Gas Assessment R4.docx
Appendix D ESTIMATION OF GREENHOUSE GAS EMISSIONS

Job Number 20803 | AQU-NW-004-20803 D-1
Wallarah 2 Air Quality and Greenhouse Gas Assessment R4.docx
D.1 FUEL CONSUMPTION
GHG emissions from diesel consumption were estimated using the following equation:
𝐸𝐶𝑂2−𝑒 =𝑄 × 𝐸𝐹
1000
where:
ECO2-e = Emissions of GHG from diesel combustion (t CO2-e)1
Q = Estimated combustion of diesel (GJ)2
EF = Emission factor (scope 1 or scope 3) for diesel combustion (kg CO2-e/GJ)3
1 tCO2-e = tonnes of carbon dioxide equivalent. 2 GJ = gigajoules. 3 kg CO2-e/GJ = kilograms of carbon dioxide equivalents per gigajoule.
The quantity of diesel consumed (Q) in each year is based on a diesel intensity rate of 0.19 L diesel/t
ROM). Diesel consumption during construction (Year 1 and Year 2) is based on the assumption that
1780 kl/year is required. The quantity of diesel consumed in gigajoules (GJ) (Q) is then calculated using
an energy content factor for diesel of 38.6 gigajoules per kilolitre (GJ/kL).
GHG emission factors and energy content for diesel were sourced from the NGA Factors (DCCEE, 2015).
The estimated annual and Project total GHG emissions from diesel usage are presented in Table D.1.

Job Number 20803 | AQU-NW-004-20803 D-2
Wallarah 2 Air Quality and Greenhouse Gas Assessment R4.docx
Table D.1: Estimated CO2-e (tonnes) for diesel consumption
Year Diesel (kL) Emissions (t CO2-e)
Scope 1 Scope 3 Total
Year 1 1,780 4,803 247 5,050
Year 2 1,780 4,803 247 5,050
Year 3 34 91 5 95
Year 4 109 294 15 309
Year 5 338 913 47 960
Year 6 739 1,994 103 2,097
Year 7 613 1,654 85 1,740
Year 8 731 1,972 102 2,073
Year 9 848 2,287 118 2,405
Year 10 760 2,050 106 2,156
Year 11 850 2,293 118 2,411
Year 12 872 2,353 121 2,474
Year 13 877 2,366 122 2,488
Year 14 788 2,126 109 2,235
Year 15 797 2,152 111 2,262
Year 16 760 2,050 106 2,156
Year 17 950 2,563 132 2,695
Year 18 950 2,563 132 2,695
Year 19 950 2,563 132 2,695
Year 20 914 2,467 127 2,594
Year 21 932 2,514 129 2,643
Year 22 912 2,461 127 2,587
Year 23 851 2,297 118 2,415
Year 24 823 2,222 114 2,336
Year 25 801 2,162 111 2,274
Year 26 809 2,184 112 2,296
Year 27 784 2,115 109 2,224
Year 28 810 2,185 113 2,298
Total 23,163 62,497 3,219 65,716

Job Number 20803 | AQU-NW-004-20803 D-3
Wallarah 2 Air Quality and Greenhouse Gas Assessment R4.docx
D.2 ELECTRICITY
GHG emissions from electricity usage were estimated using the following equation:
𝐸𝐶𝑂2−𝑒 =𝑄 × 𝐸𝐹
1000
where:
ECO2-e = Emissions of GHG from electricity usage (tCO2-e/annum)
Q = Estimated electricity usage (kWh/annum)1
EF = Emission factor (Scope 2 or Scope 3) for electricity usage (kgCO2-e/kWh)2
1 kWh/annum = kilowatt hours per annum 2 kgCO2-e/kWh = kilograms of carbon dioxide equivalents per kilowatt hour
The quantity of electricity used each year is based on an intensity rate of 11 kWh/tpa ROM. GHG
emission factors were sourced from the NGA Factors (DCCEE, 2015). The estimated annual and Project
total GHG emissions from electricity usage are presented in Table D.2.
TableD.2: Estimated CO2-e (tonnes) for electricity
Year Electricity (kWhr) Emissions (t CO2-e)
Scope 2 Scope 3 Total
Year 1 4,620,000 3,881 554 4,435
Year 2 4,620,000 3,881 554 4,435
Year 3 6,567,000 5,516 788 6,304
Year 4 10,934,000 9,185 1,312 10,497
Year 5 24,211,000 20,337 2,905 23,243
Year 6 47,410,000 39,824 5,689 45,514
Year 7 40,117,000 33,698 4,814 38,512
Year 8 46,926,000 39,418 5,631 45,049
Year 9 53,702,000 45,110 6,444 51,554
Year 10 48,609,000 40,832 5,833 46,665
Year 11 53,812,000 45,202 6,457 51,660
Year 12 55,110,000 46,292 6,613 52,906
Year 13 55,396,000 46,533 6,648 53,180
Year 14 50,237,000 42,199 6,028 48,228
Year 15 50,787,000 42,661 6,094 48,756
Year 16 48,609,000 40,832 5,833 46,665
Year 17 59,620,000 50,081 7,154 57,235
Year 18 59,620,000 50,081 7,154 57,235
Year 19 59,620,000 50,081 7,154 57,235
Year 20 57,552,000 48,344 6,906 55,250
Year 21 58,564,000 49,194 7,028 56,221
Year 22 57,420,000 48,233 6,890 55,123
Year 23 53,900,000 45,276 6,468 51,744
Year 24 52,294,000 43,927 6,275 50,202
Year 25 51,018,000 42,855 6,122 48,977
Year 26 51,480,000 43,243 6,178 49,421
Year 27 50,006,000 42,005 6,001 48,006
Year 28 51,513,000 43,271 6,182 49,452
Total 1,264,274,000 1,061,990 151,713 1,213,703
D.3 FUGITIVE METHANE
Emissions from fugitive CH4 were estimated using the following equation:
𝐸𝑐𝑜2−𝑒 = 𝑄 × 𝐸𝐹

Job Number 20803 | AQU-NW-004-20803 D-4
Wallarah 2 Air Quality and Greenhouse Gas Assessment R4.docx
where:
ECO2-e = Emissions of GHG from fugitive CH4 (t CO2-e/annum)
Q = ROM coal extracted during the year (t)
EF = Scope 1 emission factor (t CO2-e/tonne)
A site specific emission factor (EF) of 0.1 t CO2-e/tonne has been determined based on gas content
testing (GeoGas, 2002). The measured average gas content of 7.6 m3/t (GeoGas, 2002) was converted
to CO2-e based on the National Greenhouse and Energy Reporting System (NGERS) methodology
(Division 3.2.2, Subdivision 3.2.2.2 Method 4) (DCC, 2014).
It is assumed that of the total measured gas content, approximately 35% would be emitted via mine
ventilation air. The remaining 65% (pre drainage and post drainage) would be flared. The estimated
annual and Project total GHG emissions from fugitive CH4 are presented in Table D.3.
Table D.3: Estimated CO2-e (tonnes) for fugitive methane and flaring
Year ROM (tpa) Scope 1 Emissions (t CO2-e)
(tpa) Flaring (Pre and Post Drainage) Fugitive (MVA)
Year 1 0 0 0
Year 2 0 0 0
Year 3 177,000 1,844 6,014
Year 4 574,000 5,980 19,503
Year 5 1,781,000 18,556 60,514
Year 6 3,890,000 40,530 132,172
Year 7 3,227,000 33,622 109,645
Year 8 3,846,000 40,071 130,677
Year 9 4,462,000 46,489 151,607
Year 10 3,999,000 41,665 135,876
Year 11 4,472,000 46,593 151,947
Year 12 4,590,000 47,823 155,956
Year 13 4,616,000 48,094 156,840
Year 14 4,147,000 43,207 140,904
Year 15 4,197,000 43,728 142,603
Year 16 3,999,000 41,665 135,876
Year 17 5,000,000 52,095 169,887
Year 18 5,000,000 52,095 169,887
Year 19 5,000,000 52,095 169,887
Year 20 4,812,000 50,136 163,499
Year 21 4,904,000 51,094 166,625
Year 22 4,800,000 50,011 163,092
Year 23 4,480,000 46,677 152,219
Year 24 4,334,000 45,156 147,258
Year 25 4,218,000 43,947 143,317
Year 26 4,260,000 44,385 144,744
Year 27 4,126,000 42,989 140,191
Year 28 4,263,000 44,416 144,846
Total 103,174,000 1,074,963 3,505,584
D.4 VEGETATION CLEARING
There is minimal vegetation stripping required for the Project (restricted to small areas around the
surface infrastructure) and there GHG emissions due to vegetation clearance have not been
calculated. This is consistent with the previous assessment.
D.5 PRODUCT COAL TRANSPORTATION
The scope 3 emissions associated with product coal transportation have been estimated based on all
product coal being transported to Newcastle for export by rail. Emissions associated with product coal
transportation have been estimated based on an emission factor for loaded trains of 12.3 grams per
net tonne per kilometre (QR Network Access, 2002). Emission factors were not available for unloaded
trains so the factor for loaded trains is conservatively applied for the return trip.

Job Number 20803 | AQU-NW-004-20803 D-5
Wallarah 2 Air Quality and Greenhouse Gas Assessment R4.docx
The return rail trip to the port of Newcastle is estimated to be 120 km. The total estimated GHG
emissions from rail transport of product coal are provided in Table D.4.
Table D.4: Estimated CO2-e (tonnes) for product coal transportation
Year Product Coal (tpa) Scope 3 Emissions (t CO2-e)
Year 1 0 0
Year 2 0 0
Year 3 177,000 249
Year 4 574,000 806
Year 5 1,781,000 2,502
Year 6 3,890,000 5,464
Year 7 3,227,000 4,533
Year 8 3,846,000 5,402
Year 9 4,462,000 6,268
Year 10 3,999,000 5,617
Year 11 4,472,000 6,282
Year 12 4,590,000 6,447
Year 13 4,616,000 6,484
Year 14 4,147,000 5,825
Year 15 4,197,000 5,895
Year 16 3,999,000 5,617
Year 17 5,000,000 7,023
Year 18 5,000,000 7,023
Year 19 5,000,000 7,023
Year 20 4,812,000 6,759
Year 21 4,904,000 6,888
Year 22 4,800,000 6,742
Year 23 4,480,000 6,293
Year 24 4,334,000 6,088
Year 25 4,218,000 5,925
Year 26 4,260,000 5,984
Year 27 4,126,000 5,796
Year 28 4,263,000 5,988
Total 103,174,000 144,924
Consistent with the previous assessment, emissions from the shipping of product coal are not included in
this assessment due to the difficulties in emission estimates, including uncertainty in export markets and
limited data on emission factors and/or fuel consumption for ocean going vessels.
D.6 ENERGY PRODUCTION FROM PRODUCT COAL
The scope 3 emissions associated with the combustion of product coal were estimated using the
following equation:
𝐸𝐶𝑂2−𝑒 =𝑄 × 𝐸𝐶 × 𝐸𝐹
1000
Where:
ECO2-e = Emissions of GHG from coal combustion (t CO2-e)
Q = Quantity of product coal burnt (GJ)
EC = Energy Content Factor for black / coking coal (GJ/t)1
EF = Emission factor for black / coking coal combustion (kg CO2-e/GJ) 1 GJ/t = gigajoules per tonne
The quantity of thermal saleable coal is based on the production rate in tpa. This is converted to GJ
using an energy content factor for black coal of 27 GJ/t. The GHG emission factor and energy content
for coal were sourced from the NGA Factors (DCCEE, 2015).
The emissions associated with the use of the product coal are presented in Table D.5.

Job Number 20803 | AQU-NW-004-20803 D-6
Wallarah 2 Air Quality and Greenhouse Gas Assessment R4.docx
Table D.5: Scope 3 emissions for energy production from product coal
Year Product Coal (tpa) Scope 3 Emissions (t CO2-e)
Year 1 0 0
Year 2 0 0
Year 3 177,000 438,712
Year 4 574,000 1,422,716
Year 5 1,781,000 4,414,387
Year 6 3,890,000 9,641,754
Year 7 3,227,000 7,998,442
Year 8 3,846,000 9,532,696
Year 9 4,462,000 11,059,513
Year 10 3,999,000 9,911,921
Year 11 4,472,000 11,084,299
Year 12 4,590,000 11,376,774
Year 13 4,616,000 11,441,218
Year 14 4,147,000 10,278,754
Year 15 4,197,000 10,402,684
Year 16 3,999,000 9,911,921
Year 17 5,000,000 12,393,000
Year 18 5,000,000 12,393,000
Year 19 5,000,000 12,393,000
Year 20 4,812,000 11,927,023
Year 21 4,904,000 12,155,054
Year 22 4,800,000 11,897,280
Year 23 4,480,000 11,104,128
Year 24 4,334,000 10,742,252
Year 25 4,218,000 10,454,735
Year 26 4,260,000 10,558,836
Year 27 4,126,000 10,226,704
Year 28 4,263,000 10,566,272
103,174,000 255,727,076