Summary of FY2013 Third Quarter Earnings Results of FY2013 Third Quarter Earnings Results January...
34
Summary of FY2013 Third Quarter Earnings Results January 31, 2014 The English version is a translation of the original Japanese version. Please note that if there is any discrepancy, the Japanese version will take priority. Electric Power Development Co., Ltd.
Transcript of Summary of FY2013 Third Quarter Earnings Results of FY2013 Third Quarter Earnings Results January...

Summary of FY2013 Third Quarter Earnings Results
January 31, 2014
The English version is a translation of the original Japanese version.
Please note that if there is any discrepancy, the Japanese version will take priority.
Electric Power Development Co., Ltd.

Forward Looking Statements
1
The following contains statements that constitute forward-looking statements, plans for
the future, management targets, etc. relating to the Company and/or the J-POWER
group. These are based on current assumptions of future events, and there exist
possibilities that such assumptions are objectively incorrect and actual results may differ
from those in the statements as a result of various factors.
Furthermore, information and data other than those concerning the Company and its
subsidiaries/affiliates are quoted from public information, and the Company has not
verified and will not warrant its accuracy or dependency.
※Display of Figures
All figures are consolidated unless stated otherwise.
Amounts less than 100 million yen and electric power sales volume less than 100 million kWh shown in the consolidated financial data have been rounded down. Consequently, the sum of the individual amounts may not necessarily agree with figures shown in total columns.

Contents
I. Summary of FY2013 Third Quarter Earnings Results
Summary of FY2013 Third Quarter Earnings Results ・・・ 4
Key Data ・・・ 5
FY2013 Third Quarter Earnings Results (Main Factors for Change) ・・・ 7
Revenue / Expenditure Comparison ・・・ 8
Balance Sheet ・・・ 9
II. Summary of FY2013 Earnings Forecast
Summary of FY2013 Earnings Forecast ・・・ 11
Key Data ・・・ 12
FY2013 Earnings Forecast (Main Factors for Change) ・・・ 13
Overseas Power Generation Business: Earnings Contribution Forecast ・・・ 14
Appendix
2

3
I. Summary of FY2013 Third Quarter
Earnings Results

Summary of FY2013 Third Quarter Earnings Results
4
(Unit: bil l ion yen)
FY2012 FY2013
3rd Quarter 3rd Quarter
(Apr.-Dec.) (Apr.-Dec.)
Operating Revenue 487.7 519.5 31.7 6.5 %
Operating Income 54.1 50.8 (3.2) (6.0) %
Ordinary Income 47.9 41.9 (5.9) (12.5) %
Net Income 32.6 30.2 (2.3) (7.1) %
FY2012 FY2013
3rd Quarter 3rd Quarter
(Apr.-Dec.) (Apr.-Dec.)
Operating Revenue 444.5 438.5 (6.0) (1.4) %
Operating Income 49.9 40.6 (9.3) (18.6) %
Ordinary Income 39.4 33.7 (5.6) (14.3) %
Net Income 27.2 24.3 (2.9) (10.7) %
Consolidated
Non-consolidated
Year-on-year change
Year-on-year change

Key Data (Electric Power Sales)
5
Electric Power Sales for each Quarter
*1 “Other Business” is composed of three business segments: “Electric Power-Related Business,” “Overseas Business” and “Other Business.”
*2 Electric power sales volume of overseas consolidated subsidiaries (Electric power sales volume of equity method affiliated companies is not included.)
[Hydroelectric (Wholesale Electric Power)]
[Thermal (Wholesale Electric Power)]
10.3
16.714.4 12.8
11.0
16.213.7
60%
96%
82%75%
64%93%
79%
0%
25%
50%
75%
100%
-
10.0
20.0
30.0
40.0
1st Quarter
(Apr.-Jun.)
2nd Quarter
(Jul.-Sep.)
3rd Quarter
(Oct.-Dec.)
4th Quarter
(Jan.-Mar.)
(TWh)
Electric Power Sales in FY2012 Electric Power sales in FY2013Load factor in FY2012 (right) Load factor in FY2013 (right)
2.8 2.5 1.6
2.0 2.2 2.52.0
110%
86%102%
114%
91%
91%
120%
0%
40%
80%
120%
160%
-
2.5
5.0
7.5
10.0
1st Quarter(Apr.-Jun.)
2nd Quarter(Jul.-Sep.)
3rd Quarter(Oct.-Dec.)
4th Quarter(Jan.-Mar.)
(TWh)
Electric Power Sales in FY2012 Electric Power Sales in FY2013
Water supply rate in FY2012 (right) Water supply rate in FY2013 (right)
Electric Power Sales (TWh)
Electric Power Business 50.0 49.3
Hydroelectric (Wholesale Electric Power) 6.9 6.8
Thermal (Wholesale Electric Power) 41.5 40.9
Other Electric Power Business 1.5 1.5
Other Business*¹ - 2.3
Overseas Business*² - 2.3
Water supply rate (Wholesale Electric Power) 100% 97%
Load factor (Wholesale Electric Power) 80% 79%
(3) points
(1) point
0.0 5.6%
2.3 -
2.3 -
(0.6) (1.3)%
(0.1) (2.3)%
(0.5) (1.3)%
FY2012
3rd Quarter
(Apr.-Dec.)
FY2013
3rd Quarter
(Apr.-Dec.)
Year-on-year
change

Key Data (Operating Revenue)
6
*1 “Other Business” is composed of three business segments: “Electric Power-Related Business,” “Overseas Business” and “Other Business.”
*2 Sales of overseas consolidated subsidiaries, overseas consulting business and others
Operating Revenue (Billion yen) 487.7 519.5
Electric Power Business 454.9 456.7
Hydroelectric (Wholesale Electric Power) 80.4 80.3
Thermal (Wholesale Electric Power) 313.9 310.6
Other Electric Power Business 20.0 25.5
Other Business*¹ 32.8 62.8
Overseas Business*² 0.9 26.7
79.95 99.36
2.52 3.11
30.83 31.39
5.5 27.6%
30.0 91.4%
25.7 -
1.7 0.4%
(0.0) (0.1)%
(3.3) (1.1)%
FY2012
3rd Quarter
(Apr.-Dec.)
FY2013
3rd Quarter
(Apr.-Dec.)
Year-on-year
change
31.7 6.5%
Foreign exchange rate at the end of 3Q (THB/US$)
Average foreign exchange rate (Yen/US$)
Foreign exchange rate at the end of 3Q (Yen/THB)

FY2013 Third Quarter Earnings Results (Main Factors for Change)
7
Non-consolidated operating income (- 9.3 billion yen)
Income of subsidiaries, etc. (+ 6.0 billion yen)
Increase in equity income of affiliates (+ 5.4 billion yen)
Increase in interest expenses and foreign exchange losses, etc.
Consolidated ordinary income (- 5.9 billion yen)
Consolidated net income (- 2.3 billion yen)
Extraordinary income (insurance income) (+ 2.3 billion yen)
Decrease in corporate tax and minority interests, etc.
Consolidated operating income (- 3.2 billion yen)
Decrease in personnel expenses (amortization expenses of actuarial differences
in pension accounting)
Increase in facilities maintenance costs
Impact of suspension* of thermal power plant operations, etc.
Others
Increase in Other Electric Power Business Increase in Overseas Business, etc.
* Operation of No.2 Unit at Takehara Thermal Power Plant was suspended from October 19 through November 30, 2013 due to a steam leak from the boiler, and from December 20, 2013 through January 16, 2014 due to a malfunction in the boiler circulation pump.
Revenue / Expenditure Comparison
8
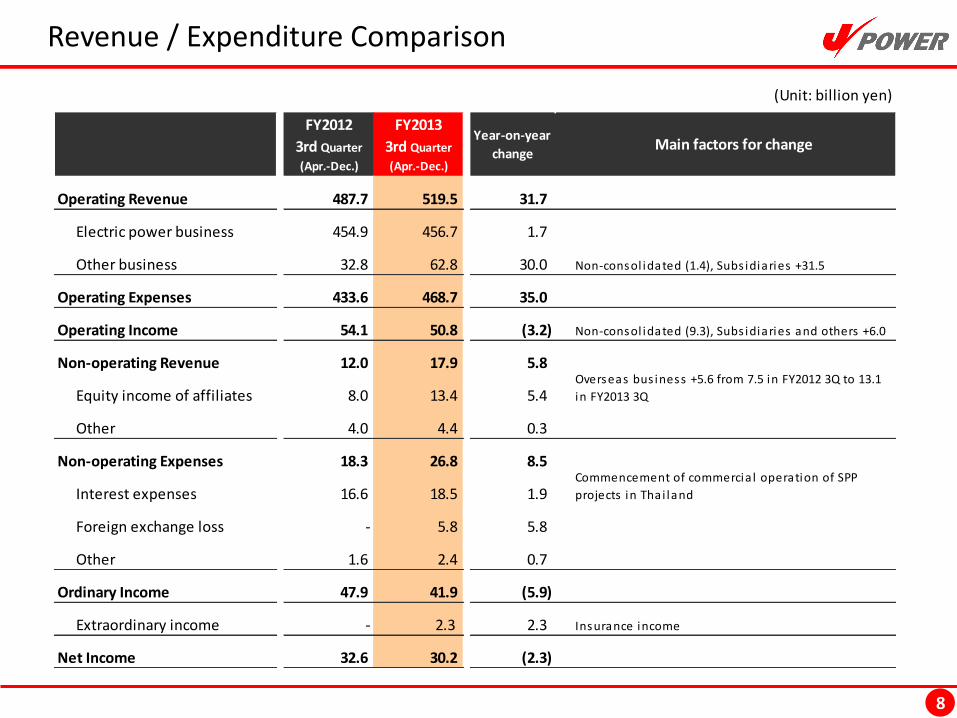
(Unit: billion yen)
Operating Revenue 487.7 519.5 31.7
Electric power business 454.9 456.7 1.7
Other business 32.8 62.8 30.0 Non-consol idated (1.4), Subs idiaries +31.5
Operating Expenses 433.6 468.7 35.0
Operating Income 54.1 50.8 (3.2)
Non-operating Revenue 12.0 17.9 5.8
Equity income of affiliates 8.0 13.4 5.4
Other 4.0 4.4 0.3
Non-operating Expenses 18.3 26.8 8.5
Interest expenses 16.6 18.5 1.9
Foreign exchange loss - 5.8 5.8
Other 1.6 2.4 0.7
Ordinary Income 47.9 41.9 (5.9)
Extraordinary income - 2.3 2.3
Net Income 32.6 30.2 (2.3)
FY2012
3rd Quarter
(Apr.-Dec.)
FY2013
3rd Quarter
(Apr.-Dec.)
Year-on-year
changeMain factors for change
Commencement of commercia l operation of SPP
projects in Thai land
Non-consol idated (9.3), Subs idiaries and others +6.0
Overseas bus iness +5.6 from 7.5 in FY2012 3Q to 13.1
in FY2013 3Q
Insurance income

Balance Sheet
9
(Unit: billion yen)
Noncurrent Assets 1,975.2 2,116.5 141.3
Electric utility plant and equipment 1,058.8 1,025.7 (33.0)
Other noncurrent assets 118.8 211.5 92.6
Construction in progress 464.6 509.7 45.1
Nuclear fuel 59.7 68.9 9.1
Investments and other assets 273.0 300.5 27.4
Current Assets 194.7 222.1 27.3
Total Assets 2,169.9 2,338.6 168.7
Interest-bearing debt 1,523.0 1,617.3 94.2
Others 192.9 212.3 19.4
Total Liabilities 1,716.0 1,829.7 113.7
Shareholders' equity 460.6 480.4 19.7
Accumulated other comprehensive
income(6.7) 25.8 32.5
Minority interests (0.0) 2.6 2.6
Total Net Assets 453.8 508.8 54.9
D/E ratio (x) 3.4 3.2
Shareholders' equity ratio 20.9% 21.6%
FY2012
End of FY
FY2013
End of 3Q
Change
from prior
year end
Main factors for change
Foreign currency trans lation adjustment +17.0, Valuation
di fference on avai lable-for-sa le securi ties +7.8, Deferred ga ins
or losses on hedges +7.6
Non-consol idated (33.6)
Subs idiaries +92.4
Non-consol idated (28.6), Subs idiaries and others +16.4
Long-term investment +40.1, Deferred tax assets (5.4), Others (7.2)
Non-consol idated +20.5, Subs idiaries +73.7
[ Long-term loans +96.3, Commercia l paper (3.9)]
Increase in reta ined earnings

10
II. Summary of FY2013 Earnings Forecast

Summary of FY2013 Earnings Forecast
11 * Prior forecast was released on October 31, 2013.
(Unit: billion yen)
FY2013 FY2013
Operating Revenue 656.0 706.0 49.9 7.6% 702.0 4.0
Operating Income 54.5 60.0 5.4 10.0% 59.0 1.0
Ordinary Income 44.8 43.0 (1.8) (4.1)% 45.0 (2.0)
Net Income 29.8 30.0 0.1 0.6% 33.0 (3.0)
FY2013 FY2013
Operating Revenue 586.9 583.0 (3.9) (0.7)% 581.0 2.0
Operating Income 43.3 43.0 (0.3) (0.8)% 43.0 -
Ordinary Income 28.8 35.0 6.1 21.4% 29.0 6.0
Net Income 18.5 27.0 8.4 45.2% 21.0 6.0
Consolidated
Non-consolidated
FY2012
Result
Comparison with
FY2012 ResultCurrent
Forecast
Prior
Forecast*
FY2012
Result
Comparison with
FY2012 ResultCurrent
Forecast
Prior
Forecast*
Comparison
with Prior
Forecast*
Comparison
with Prior
Forecast*
Interim Year end Annual35 yen 35 yen (Forecast) 70 yen (Forecast)
Cash dividends per share in FY2013

Key Data
12
*1 “Other Businesses” is composed of “Electric Power-Related Business,” “Overseas Business” and “Other Business”
*2 Electric power sales volume of overseas consolidated
subsidiaries (Does not include electric power sales volume of affiliated companies accounted for by the equity method)
*3 Sales of Overseas Business (For example, sales of overseas
consolidated subsidiaries and overseas consulting business) *4 Prior forecast was released on October 31, 2013
Water supply rate 102% 97% 94%
Load factor 78% 79% 79%
Foreign exchange rate at term end
Yen/US$ 86.58 105 approx. 100
Yen/THB 2.82 3.2 approx. 3.1
THB/US$ 30.63 32.8 approx. 31
Average foreign exchange rate
Yen/US$ 82.91 approx. 100 approx. 100
FY2012 ResultFY2013 Current
Forecast
FY2013 Initial
Forecast*⁴
Electric Power Sales (TWh)
Electric Power Business 65.6 65.4 64.8 0.5
Hydroelectric (Wholesale Electric Power) 9.0 8.6 8.4 0.2
Thermal (Wholesale Electric Power) 54.3 54.3 54.1 0.2
Other Electric Power Business 2.2 2.3 2.2 0.0
Other Business*¹ - 3.6 3.6 -
Overseas Business*² - 3.6 3.6 -
Operating Revenue (Billion yen) 656.0 706.0 702.0 4.0
Electric Power Business 605.3 607.0 605.0 2.0
Hydroelectric (Wholesale Electric Power) 106.6 105.0 105.0 -
Thermal (Wholesale Electric Power) 413.9 412.0 411.0 1.0
Other Electric Power Business 30.7 37.0 36.0 1.0
Other Business*¹ 50.7 99.0 97.0 2.0
Overseas Business*³ 1.6 43.0 43.0 -
FY2013 Prior
Forecast*⁴
(0.3) (3.9)%
FY2012 ResultFY2013 Current
Forecast
Comparison with
FY2012 Result
0.0 0.1%
0.1 6.0%
Comparison with
Prior Forecast*⁴
(0.1) (0.3)%
-
3.6 -
49.9 7.6%
1.6 0.3%
3.6
(1.6) (1.6)%
(1.9) (0.5)%
6.2 20.5%
48.2 95.2%
41.3 -

43.0
(1.0)
(11.0 )
(2.0)
(2.0)
±0.0
- 10.0 20.0 30.0 40.0 50.0
FY2013OrdinaryIncome
(Forecast)
FY2012OrdinaryIncome(Result)
7. Foreign exchange losses
(2.0)
±0.0
- 10.0 20.0
FY2013OrdinaryIncome
FY2012OrdinaryIncome
13
FY2013 Earnings Forecast (Main Factors for Change)
Increase/
Decrease
-
-
-
-
+1.0
+1.5
(5.0)
+0.5
(2.0)
(Unit: billion yen)
2. Increase in maintenance costs of
hydroelectric power facilities
7. Increase in equity income
+6.0
+4.5
+3.5
6. Increase in profits of subsidiaries
1. Decrease in personnel expenses
4 and 5. Impact from suspension of
thermal power plant operations, etc.
3. Increase in other expenses
7. Others
[Current forecast] [Prior forecast]
+3.5
+8.0
(10.0)
+5.0
44.8
45.0
Note: For a description of the foreign exchange losses, please refer to the news release dated January 31, 2014, “Posting of Non-operating Expenses (Foreign Exchange Losses) in a Subsidiary.”
44.8
* Prior forecast was released on October 31, 2013.
4. Elimination of the impact in the previous fiscal year
5. Impact from suspension in the current fiscal year, etc.
7. Equity income, other non-operating items
(4.5) (Note)

Overseas Power Generation Business: Earnings Contribution Forecast
14
3Q (As of Sep. 2013) 4Q (As of Dec. 2013)
Yen/US$ 97.75 105
Yen/THB 3.11 3.2
THB/US$ 31.39 32.8
Equity equivalent income* for nine months ended Dec. 31, 2013 was 13.7 billion yen.
Equity equivalent income* in the overseas power generation business for FY2013 is expected to be approximately 16.6 billion yen. (Approximately 5.1 billion yen increase from initial forecast)
Equity Equivalent Income*
of Overseas Power Generation Business
* Equity equivalent income:The total of equity income of affiliates and consolidated project income. Out of which consolidated project income is the total of income after tax for each consolidated project company in commercial operation multiplied by capital investment ratio of the company. The sum of equity income of affiliates and consolidated project income do not correspond to segment data.
7.8
11.3 9.3 9.2
11.0 13.1
Approx. 16.1
0.6
Approx. 0.5
-
5
10
15
20
FY2008 FY2009 FY2010 FY2011 FY2012 FY20133Q
FY2013(Forecast)
(Billion yen)
Equity income of affiliates
Consolidated project income
Recent Status of Overseas New Projects
Foreign exchange rate in FY2013
Thailand
・All 7SPP projects began commercial operation by October 2013.
・Construction of both the Nong Saeng and U-Thai projects is proceeding on schedule.
Indonesia
・The start of construction has been delayed since
acquisition of the power plant site is not completed.
・The deadline for setting up financing under the long-term power purchase agreement extended to October 2014.
Note: To indicate the actual status of project income on a consolidated
basis, foreign exchange gains and losses are deducted. Foreign exchange
gains and losses consist primarily of valuation gains and losses on foreign
currency-denominated debt, with such losses amounting to 0.6 billion yen in
3Q. Actual equity equivalent income in 3Q, including foreign exchange
losses, was 0 billion yen.
Note

15
APPENDIX

APPENDIX Contents
16
The Ohma Nuclear Power Project ・・・17
Measures for Reinforcing Safety at the Ohma Nuclear Power Plant ・・・18
Earthquake and Tsunami Evaluation at the Ohma Nuclear Power Plant ・・・20
Overseas Power Generation Business Owned Capacity ・・・21
Projects in Thailand by Consolidated Subsidiaries ・・・22
Statements of Income ・・・24
Non-consolidated: Revenues and Expenses ・・・25
Segment Information ・・・26
Cash Flow ・・・27
Financial Data ・・・28
Monthly Electric Sales ・・・29

The Ohma Nuclear Power Project
17
In October 2012, we resumed construction of the Ohma Nuclear Power Plant that had been suspended after the Great East Japan Earthquake of March 2011.
J-POWER is committed to building a safe power plant by making a company-wide effort in the steady implementation of safety enhancement measures which takes into account the latest developments in the field and the New Safety Standard for Nuclear Power Stations set forth by the Nuclear Regulation Authority.
Location Ohma-machi, Shimokita-gun, Aomori Prefecture
Capacity 1,383MW
Type of nuclear reactor
Advanced Boiling Water Reactor (ABWR)
Fuel Enriched uranium and uranium-plutonium mixed oxide (MOX)
Commencement of operations
To be determined
Tokyo
The Pacific Ocean
The Japan
Sea
Status of construction (December 2013)
Aomori
Hokkaido
Overview of the Project
Process (Results)
Construction Commenced in May
March Construction work suspended due to Great East Japan Earthquake Disaster
Construction Resumed in October
(Year)
April Obtained permission to install nuclear reactor
Construction site
2008 2009 2010 2011 2012 2013 2014

Measures for Reinforcing Safety at the Ohma Nuclear Power Plant
18
建設状況 (2013年1月現在)
For the Ohma Nuclear Power Plant, in addition to previous safety enhancement measures, we are complying with the New Safety Standard for Nuclear Power Stations (effective July 8, 2013), and implementing further safety enhancement measures to further improve safety of the power plant.
We are reviewing active implementation of superior safety technologies and will appropriately incorporate necessary measures towards building a safe power plant.
Measures for Reinforcing Safety that are being Planned*
* Already announced on July 24, 2013
Design Basis
① Facility protection in the case of a tsunami (installation of seawall, waterproofing modification of doors in exterior walls, height extension of oil fences and improvement in the watertightness of important rooms for safety purposes)
② Implementation of impact assessments of tornadoes and other natural phenomena on the nuclear power plant ③ Enhanced fire protection measures (use of fire retardant cables, installation of firewalls, and other measures) ④ Installation of power panels on upper floor for locational dispersion ⑤ Enhanced reliability of passive component (such as ventilation filters) that are crucial to safety ⑥ Implementation of impact assessments of internal flooding on the safety system
Severe Accident and Terrorism Countermeasures
⑦ Deployment of portable power pumps and fire engines for cooling the reactor, containment vessel and spent fuel storage pool ⑧ Reinforcement of alternative water injection equipment for cooling the reactor, containment vessel and spent fuel storage pool ⑨ Installation of filtered containment venting system to prevent overpressurization on the containment vessel ⑩ Installation of hydrogen detection units and hydrogen discharge venting units to prevent hydrogen explosion at the reactor building ⑪ Deployment of water spraying facilities to spray water on the reactor building and other facilities ⑫ Secure inventory of spares of seawater pump electric motors, etc. and deployment of alternative seawater pumps and other equipments to ensure
heat removal functionality for the reactor and containment vessel ⑬ Deployment of power supply vehicles, installation of emergency power generators ( fuel tanks and power cables), increased capacity of storage
batteries and enhancement of permanent DC power source to secure power supply ⑭ Installation of water storage tanks and reinforcement of water tanks to secure water source ⑮ Installation of a seismic isolation building which houses the emergency response office to respond as necessary in an emergency ⑯ Reinforcement of communications systems for making contact within and outside of the power plant in the event of an emergency ⑰ Installation of materials and equipment warehouse, provision of high-level radiation protection suits and other materials and equipment, and
deployment of heavy equipment for debris removal ⑱ Installation of specified severe accident response facility to respond to intentional crash of aircrafts and other such events
Aside from the above measures, we will be reinforcing links and collaboration between businesses operating in Aomori prefecture* to further ensure disaster prevention. * Tohoku Electric Power Company, Tokyo Electric Power Company, J-POWER, Japan Nuclear Fuel Limited and Recyclable-Fuel Storage Company

P
PP P
Design Basis
Severe Accident and Terrorism Countermeasures
③ Enhanced fire protection
⑧ Reinforcement of alternativewater injection equipment
⑩ Installation of interior hydrogen detection unitsand reactor building hydrogen discharge venting units
⑱ Installation of specified severe accident response facility
⑤ Enhanced reliability of passive component
⑫ Deployment of alternative seawater pump, etc.
⑬ Increased capacity of storage batteriesEnhancement of permanent DC power source
② Impact assessments of tornadoes,volcanic eruptions and external fires, etc.
⑥ Internal flooding impact assessments
⑪ Deployment of water spraying facilities
⑫Secure inventory of spares of seawater pump electric motors, etc.
④ Installation of power panels on upper floor
①Installation of seawall
T.P. :The average sea level in Tokyo Bay
① Waterproofing modification of doors in exterior walls
⑨Installation of filtered containmentventing system
①Improvement in the watertightness ofimportant rooms for safety purposes
①Height extension of oil fences around the oil tanks
⑦Deployment of portable power pumps and fire engines
⑭Installation of waterstorage tanks and reinforcement of water tanks
⑬Deployment of power supply vehiclesInstallation of emergency power generators
⑯ Reinforcement of communications systems
⑮Installation of a seismicisolation building
⑰ Installation of materials and equipment warehouse
Provision of high-level radiation protection suits and other materials and equipment Deployment of heavy equipment for debris removal
Seawall height(T.P.+15m)
Ground level of compound (T.P. +12m)Estimated maximum height of potential tsunami (T.P.+4.4m)
Emergency Diesel Generator
Seawater pump
Turbinegenerator
Spent fuelstorage pool
Reactorcontainment
vessel
Nuclear reactor
FirewallFire retardant
cable
Filter
Powerpanel
Reactor building
Storagebattery
Powerpanel
Filtered vent
Transformer
Oil
Distance of 100m or more from reactor building
Water Source
Water Source
Elevated ground (T.P. +20m or higher)
500kVSwitching
yard facilities
66kV Switching
yard facilities
Back-uptransformer
Measures for Reinforcing Safety at the Ohma Nuclear Power Plant (continued)
19
建設状況 (2013年1月現在)
Overview Diagram of Measures for Reinforcing Safety that are being Planned*
* Already announced on July 24, 2013

After obtaining the permit, we are continuing independently engage in obtaining exhaustive data from research and analysis using the latest technologies and methods to further improve reliability related to earthquake and tsunami evaluations.
In the future, we will pay close attention to trends in new safety standards and deliberations by the Nuclear Regulation Authority and carry out appropriate reviews, investigations, analysis and evaluations.
Earthquake Researched impacting earthquakes in the past within a 250km radius
from the site. 30km radius range from the site: Implemented detailed geological
surveys centered on the active faults since the late Pleistocene period (after ca. 120 to 130 thousand years ago)
Based on research results, designed nuclear reactor facilities that considers safety margins against datum design basis earthquake Ss, which is set with consideration to uncertainty.
Tsunami Site elevation is 12m above sea level
〔After the Great East Japan Earthquake〕 As part of measures for reinforcing safety, implemented further Tsunami countermeasures such as seawalls that is 3m in height, and waterproofing of doors in exterior walls in main buildings
Earthquake and Tsunami Evaluation at the Ohma Nuclear Power Plant
20
Construction site
Approx. 30km
[Research that is in progress or completed]
• Microtopography surveys, marine terrace surface surveys, airborne gravity surveys, marine sonic prospecting of western Shimokita Peninsula
• Tsunami sediment investigation of the northwestern coast of western Shimokita Peninsula and the western coast of Tsugaru Peninsula • Geological surveys within the site and near the site (seismic exploration, core drilling, trenching, etc.)
Ohma Nuclear Power Plant has undergone detailed geological surveys based on the earthquake-proof design guidelines that were revised in September 2006*1 and have obtained a nuclear reactor installation permit in April 2008. Construction work commenced in May of that year.
*1 The earthquake in Southern Hyogo prefecture in 1995 was the impetus for revision of he Earthquake-proof Design Inspection Guidelines related to Nuclear Reactor Facilities for Power Plants (Earthquake-proof Design Guidelines) and safety standards were enhanced as of September 2006.
Hokkaido
Aomori
The Simokita Peninsula
The Pacific Ocean
The Japan
Sea
Estimated maximum height of potential tsunami +4.4m above sea level*2
Tsunami from the Tohoku Pacific Ocean Earthquake (Ohma Port) +0.9m above sea level
The Tsugaru Peninsula
*2 A value based on numerical analysis of a tsunami assumption with the gravest impact to a power plant (with its wave source in the eastern fringes of the Japan Sea). This assumption was derived by reviewing tsunamis that are assumed to have occurred in the Eastern fringes of the Japan sea, along the Japan Trench or off the coast of Chile. This value also includes uncertainty factors.
Active faults researched by the company

Overseas Power Generation Business Owned Capacity
21
[Owned capacity (As of December 2013)]
Countries/ Resions
In operations Under development
Total
Thailand 1,608 2,880 4,488
USA 1,438 - 1,438
China 905 - 905
Other areas 692 680 1,372
Total 4,643 3, 560 8,203
(Unit: MW)
-
2,000
4,000
6,000
8,000
FY2008 FY2009 FY2010 FY2011 FY2012 FY20133Q
FY2013Forecast
FY2014Forecast
FY2015Forecast
(MW) Thailand USA China Other area
Project name Output capacity
Ownership Owned capacity
Nong Saeng 1,600 90% 1,440
U-Thai 1,600 90% 1,440
Central Java 2,000 34% 680
Total 5,200 - 3,560
[Overseas projects under development (As of December 2013)] (Unit: MW)

Projects in Thailand by Consolidated Subsidiaries
22
Overview Development
7 SPP*1 • Projects based on the SPP Program*1 of the Thai Government • Development of seven 100MW-class cogeneration power plants • Sale of electricity to EGAT*3 and customers in the vicinity for a
period of 25 years (steam and cold water also provided to nearby customers)
• J-POWER holds a 90% stake in 6 plants and a 67.5% stake *4 in a plant.
11/2009 Signed the PPAs
10/2010 Signed the loan agreements
01/2013 COD*5of the first of the seven projects
10/2013 COD*5of the last of the seven projects
Nong Seang IPP • After startup of operations, the plants will sell electricity to EGAT*3 for a period of 25 years.
12/2007 Awarded in an international tender
10/2008 Signed the PPA
11/2011 Signed the loan agreements
06/2014 COD*5 of the 1st block
12/2014 COD*5 of the 2nd block
U-Thai IPP 12/2007 Awarded in an international tender
10/2008 Signed the PPA
11/2012 Signed the loan agreements
06/2015 COD*5 of the 1st block
12/2015 COD*5 of the 2nd block
Capacity: 790MW (110MW x 5) (120MW x 2)
Type: CCGT*2
Capacity: 1,600MW (800MW x 2 units)
Type: CCGT*2
Capacity: 1,600MW (800MW x 2 units)
Type: CCGT*2
J-POWER Local partner
Gulf JP Co., Ltd.
Project Company
PTT*6
EPC contractor Lenders
EGAT*3
90% 10%
100%
PPA Gas supply agreement
EPC contract Loan agreement
*1 SPP (Small Power Producers) program: The long-term power purchase scheme established by the Thai Government. This scheme promotes cogeneration systems, renewable energy, and so forth, and aims at reducing the import and use of fuel oil. EGAT guarantees the purchase of electricity generated from eligible suppliers up to 90MW of capacity.
*2 CCGT: Combined Cycle Gas Turbine *3 EGAT (Electricity Generating Authority of Thailand): State-owned electric power utility in Thailand *4 As for NLL project of 7 SPP Projects, a part of its stake was sold to an operating company of its industrial park on January 2013. *5 COD: Commercial operation date *6 PTT: State-owned gas and oil company in Thailand

NK2 (Oct. 2013, in operation)
CRN (Jul. 2013, in operation) NLL (May 2013, in operation) NNK (Apr. 2013, in operation)
TLC (Mar. 2013, in operation) KP2 (Feb.2013, in operation)
KP1 (Jan.2013, in operation) U-Thai IPP (2015, 30%)
Nong Saeng IPP (2014, 95%)
23 Note: Particulars in parentheses: (Start of operation, status or approximate rate of construction progress as of December 2013)
Projects in Thailand by Consolidated Subsidiaries(continued)
Bangkok

Statements of Income
24
(Unit: 100 mill ion yen)
FY2009 FY2010 FY2011 FY2012FY2012
3Q
FY2013
3Q
Operating revenues 5,844 6,359 6,546 6,560 4,877 5,195
Electric power operating revenues 5,302 5,844 6,097 6,053 4,549 4,567
Other operating revenues 541 515 448 507 328 628
Operating expenses 5,355 5,653 6,048 6,014 4,336 4,687
Operating income 489 705 498 545 541 508
Non-operating revenues 187 149 153 175 120 179
Equity income of affiliates 117 90 95 117 80 134
Others 70 58 57 58 40 44
Non-operating expenses 259 292 285 273 183 268
Interest expenses 230 223 220 223 166 185
Others 28 68 65 49 16 82
Ordinary income 416 563 366 448 479 419
Extraordinary income - 16 - - - 23
Extraordinary loss - 191 33 - - -
Net income 291 195 161 298 326 302

Non-consolidated: Revenues and Expenses
25
(Unit: 100 mill ion yen)
FY2009 FY2010 FY2011 FY2012FY2012
3Q
FY2013
3QYOY change
Operating revenues 5,304 5,832 5,999 5,869 4,445 4,385 (60)
Electric power operating revenues 5,186 5,738 5,905 5,772 4,370 4,324 (46)
Hydroelectric 1,089 1,081 1,084 1,066 804 803 (0)
Thermal 3,496 4,064 4,244 4,139 3,139 3,106 (33)
Transmission and others 599 592 576 566 426 414 (12)
Incidental business 117 93 94 97 74 60 (14)
Operating expenses 4,895 5,205 5,576 5,436 3,946 3,978 32
Electric power operating expenses 4,790 5,133 5,490 5,347 3,877 3,925 47
Personnel costs 361 312 344 340 249 221 (27)
Amortization of the actuarial difference 34 (22) 17 5 3 (23) (27)
Fuel costs 1,739 2,099 2,384 2,384 1,793 1,885 91
Repair and maintenance costs 453 506 542 564 377 414 37
Depreciation and amortization costs 1,155 1,060 1,004 894 667 606 (60)
Others 1,079 1,154 1,213 1,162 788 795 7
Incidental business 104 71 86 88 68 53 (14)
Operating income 409 626 423 433 499 406 (93)

26
Segment Information
* Elimination includes elimination of intersegment sales
“Electric Power Business” Wholesale power business: J-POWER’s hydroelectric, thermal power and transmission business Other electric power businesses: Wind power business (subsidiaries) , IPP business and others “Electric Power-Related Businesses” These focus on peripheral businesses essential for the operation of power plants and transmission facilities, such as designing, executing,
inspecting and maintaining power facilities. Intra-group transactions account for a large portion of this segment. “Overseas Businesses” Overseas power generation businesses, overseas engineering and consulting businesses “Other Businesses” Diversified businesses such as telecommunication, environmental and the sale of coal
(Unit: 100 mill ion yen)
Electric power
Electric
power
-related
Overseas Other Subtotal Elimination* Consolidated
Sales 4,579 2,493 267 153 7,493 (2,298) 5,195
Sales to customers 4,567 216 267 145 5,195 - 5,195
Ordinary income 317 42 39 7 405 13 419
Sales 4,571 2,359 9 166 7,106 (2,228) 4,877
Sales to customers 4,549 171 9 147 4,877 - 4,877
Ordinary income 382 30 41 7 460 18 479
Sales8 134 257 (13) 387 (69) 317
Sales to customers 17 45 257 (2) 317 - 317
Ordinary income (64) 11 (1) 0 (54) (5) (59)
FY2013
3Q
FY2012
3Q
year-on-year
change

Cash Flow
27 * Non-consolidated capital expenditure: Increase in tangible and intangible noncurrent assets
(Unit: 100 mill ion yen)
FY2009 FY2010 FY2011 FY2012FY2012
3Q
FY2013
3Q
Operatging activities 1,691 1,512 1,258 1,197 726 833
Income before income taxes
and minority interests 421 387 332 451 482 444
(reference) Non-consolidateed
depreciation and amortization 1,155 1,060 1,004 894 667 606
Investing activities (1,295) (1,246) (1,368) (1,703) (1,334) (1,257)
Capital expenditure
for subsidiaries (135) (302) (642) (1,002) (894) (788)
(reference)
Non-consolidated CAPEX* (979) (737) (684) (662) (396) (658)
Free cash flow 396 265 (109) (505) (607) (423)

Financial Data
28
*1 Non-consolidated capital expenditure: Increase in tangible and intangible noncurrent assets
*2 Number of shares issued at the end of the fiscal year (excluding treasury stock)
(Unit: 100 mill ion yen)
FY2009 FY2010 FY2011 FY2012FY2012
3Q
FY2013
3Q
(PL) Operating revenues 5,844 6,359 6,546 6,560 4,877 5,195
Operating income 489 705 498 545 541 508
Ordinary income 416 563 366 448 479 419
Net income 291 195 161 298 326 302
(BS) Total assets 20,240 20,123 20,163 21,699 21,201 23,386
Construction in progress 3,097 3,016 3,804 4,646 4,323 5,097
Shareholders' equity 4,126 4,157 4,073 4,539 4,300 5,062
Net assets 4,149 4,148 4,061 4,538 4,300 5,088
Interest-bearing debts 14,525 14,290 14,357 15,230 15,099 16,173
(CF) Investing activities (1,295) (1,246) (1,368) (1,703) (1,334) (1,257)
Free cash flow 396 265 (109) (505) (607) (423)
(Ref) Non-consolidated CAPEX*1 (979) (737) (684) (662) (396) (658)
(Ref) Non-consolidated depreciation 1,155 1,060 1,004 894 667 606
ROA (%) 2.1 2.8 1.8 2.1 - -
ROA (ROA excl. Construction in progress) (%) 2.5 3.3 2.2 2.7 - -
ROE (%) 7.4 4.7 3.9 6.9 - -
EPS (¥) 194.26 130.51 107.39 198.65 217.30 201.82
BPS (¥) 2,750.20 2,770.77 2,714.94 3,024.98 2,866.09 3,373.99
Shareholders' equity ratio (%) 20.4 20.7 20.2 20.9 20.3 21.6
D/E ratio 3.5 3.4 3.5 3.4 3.5 3.2
Number of shares issued*2 (thousand) 150,053 150,053 150,052 150,052 150,052 150,051

Monthly Electricity Sales: Wholesales Electric Power Business (Thermal Power)
29
Apr. 2013 - Dec. 2013 Results (cumulative)
Load factor ⇒ 79%
Electricity sales ⇒ 40.9B kWh
Apr. 2012 - Dec. 2012 Results (cumulative)
Load factor ⇒ 80%
Electricity sales ⇒ 41.5B kWh
FY2012 Results (cumulative): Load factor 78%, Electricity sales 54.3B kWh
2,659
3,257
4,425
5,584 5,692 5,461 5,026 4,843
4,550
4,549 4,405 3,877
3,466 3,345
4,203
5,329 5,718
5,153
4,584 4,177
4,973 47% 56%
78%
95%97%
96%
85% 85%
77%
77%83%
66%61%
57%
75%
91%
98%
91%
78%
73%
84%
0%
20%
40%
60%
80%
100%
0
2,000
4,000
6,000
8,000
10,000
Apr. May Jun. Jul. Aug. Sep. Oct. Nov. Dec. Jan. Feb. Mar.
FY2012 Electricity sales FY2013 Electricity sales FY2012 Load factor (Right) FY2013 Load factor (Right)

Monthly Electricity Sales: Wholesales Electric Power Business (Hydroelectric Power)
30
Apr. 2013 - Dec. 2013 Results (cumulative)
Water supply rate ⇒ 97%
Electricity sales ⇒ 6.8B kWh
Apr. 2012 - Dec. 2012 Results (cumulative)
Water supply rate ⇒ 100%
Electricity sales ⇒ 6.9B kWh
FY2012 Results (cumulative): Water supply rate 102%, Electricity sales 9.0B kWh
830 1,066
908
1,079
781 647 569 521 591 653 652 730
784 669
830 915
764 827
711 656 677
117%108%
103%95%
76%83% 81%
120%109%
105%
120% 118%
93%86%
96%
80% 69%
125%
138%
114%
102%
0%
50%
100%
150%
200%
0
1,000
2,000
3,000
4,000
Apr. May Jun. Jul. Aug. Sep. Oct. Nov. Dec. Jan. Feb. Mar.
FY2012 Electricity sales FY2013 Electricity sales FY2012 Water supply rate (Right) FY2013 Water supply rate (Right)

Apr. May Jun. Jul. Aug. Sep. Oct. Nov. Dec. Jan. Feb. Mar.
Year-on-year (Hydro) 94% 63% 91% 85% 98% 128% 125% 126% 115%
Year-on-year (Thermal Power) 130% 103% 95% 95% 100% 94% 91% 86% 109%
Year-on-year Total 122% 93% 94% 94% 100% 98% 95% 90% 110%
0%
50%
100%
150%
200%
Wholesales Electric Power Business: Changes in Monthly Electricity Sales
31
Apr. - Dec.
98%
99%
99%
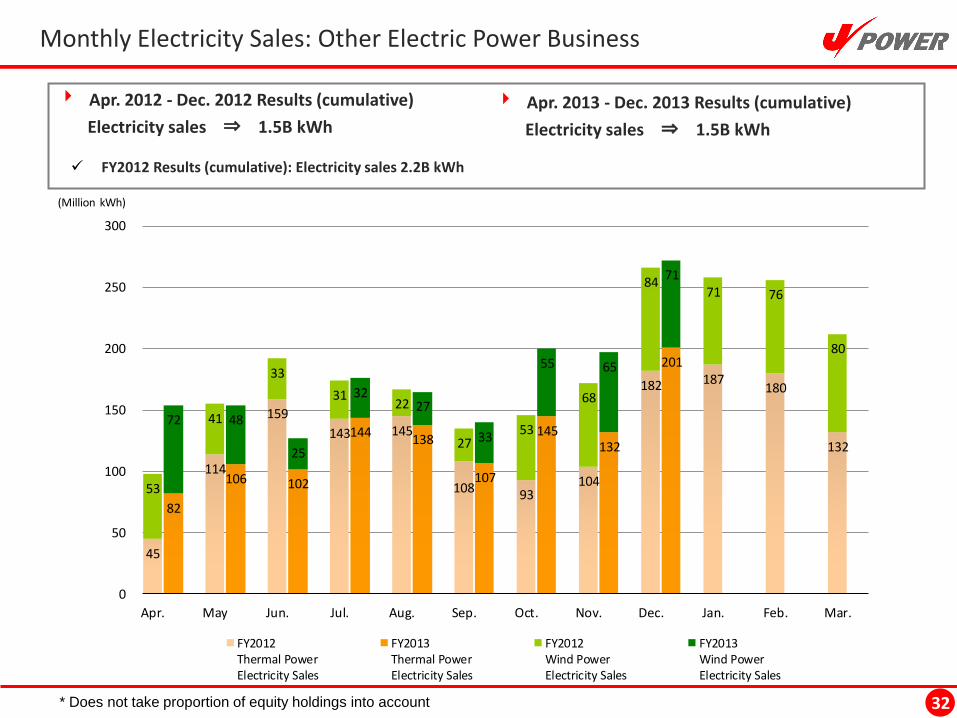
Monthly Electricity Sales: Other Electric Power Business
32
Apr. 2012 - Dec. 2012 Results (cumulative)
Electricity sales ⇒ 1.5B kWh
Apr. 2013 - Dec. 2013 Results (cumulative)
Electricity sales ⇒ 1.5B kWh
FY2012 Results (cumulative): Electricity sales 2.2B kWh
* Does not take proportion of equity holdings into account
45
114
159
143 145
108 93104
182 187180
132
82
106 102
144138
107
145132
201
53
41
33
3122
2753
68
8471 76
80
72 48
25
3227
33
55 65
71
0
50
100
150
200
250
300
Apr. May Jun. Jul. Aug. Sep. Oct. Nov. Dec. Jan. Feb. Mar.
(Million kWh)
FY2012Thermal PowerElectricity Sales
FY2013Thermal PowerElectricity Sales
FY2012Wind PowerElectricity Sales
FY2013Wind PowerElectricity Sales

33
http://www.jpower.co.jp/
電源開発株式会社