Quarter 2021 Earnings Presentation
34
Contents 3 Q3 Key Highlights 4 Q3 Results Overview 11 Loans 16 Deposits, Liquidity, Securities, Interest Rate Sensitivity & Capital 21 Credit Quality 24 Key Takeaways and Management Outlook 26 Appendix 3 rd Quarter 2021 Earnings Presentation | NASDAQ: SFNC
Transcript of Quarter 2021 Earnings Presentation

Contents
3 Q3 Key Highlights
4 Q3 Results Overview
11 Loans
16 Deposits, Liquidity, Securities, Interest Rate Sensitivity & Capital
21 Credit Quality
24 Key Takeaways and Management Outlook
26 Appendix
3rd Quarter 2021 Earnings Presentation
| NASDAQ: SFNC

2
Forward-Looking Statements and Non-GAAP Financial MeasuresForward-Looking Statements. Certain statements by Simmons First National Corporation (the “Company”, which where appropriate includes the Company’s wholly-owned bankingsubsidiary, Simmons Bank) contained in this presentation may not be based on historical facts and should be considered "forward-looking statements" within the meaning of the PrivateSecurities Litigation Reform Act of 1995. These forward-looking statements may be identified by reference to a future period(s) or by the use of forward-looking terminology, such as"anticipate," "estimate," "expect," "foresee,“ “project,” "may," "might," "will," "would," "could,“ “likely” or "intend," future or conditional verb tenses, and variations or negatives of such terms.These forward-looking statements include, without limitation, those relating to the Company’s future growth; revenue; expenses (including interest expense and non-interest expenses); assets;loan demand; asset quality; profitability; earnings; critical accounting policies; accretion; net interest margin; noninterest revenue; market conditions related to and impact of the Company'scommon stock repurchase program; adequacy of the allowance for loan losses; income tax deductions; credit quality; level of credit losses from lending commitments; net interest revenue;interest rate sensitivity; loan loss experience; liquidity; capital resources; market risk; the expected benefits, milestones, or costs associated with the Company’s merger and acquisition strategyand activity; the Company’s ability to recruit and retain key employees; the ability of the Company to manage the impact of the COVID-19 pandemic; the impacts of the Company’s and itscustomers participation in the Paycheck Protection Program (“PPP”); increases in the Company’s security portfolio; legal and regulatory limitations and compliance and competition; anticipatedloan principal reductions; fees associated with the PPP; plans for investments in securities; statements on the slide titled “Key Takeaways and Management Outlook”; the charges, gains, andsavings associated with completed and future branch closures and branch sales; expectations and projections regarding the Company’s COVID-19 loan modification program; and projecteddividends.
Readers are cautioned not to place undue reliance on the forward-looking statements contained in this presentation in that actual results could differ materially from those indicated in orimplied by such forward-looking statements, due to a variety of factors. These factors include, but are not limited to, changes in the Company's operating or expansion strategy; the availabilityof and costs associated with obtaining adequate and timely sources of liquidity; the ability to maintain credit quality; the effect of steps the Company takes in response to the COVID-19pandemic; the severity and duration of the pandemic, including the effectiveness of “booster” vaccination efforts and developments with respect to COVID-19 variants; the pace of recoverywhen the pandemic subsides and the heightened impact it has on many of the risks described herein; the effects of the pandemic on, among other things, the Company’s operations, liquidity,and credit quality; general market and economic conditions; unemployment; possible adverse rulings, judgments, settlements and other outcomes of pending or future litigation (includinglitigation arising from the Company’s participation in and administration of programs related to the COVID-19 pandemic); the ability of the Company to collect amounts due under loanagreements; changes in consumer preferences and loan demand; effectiveness of the Company's interest rate risk management strategies; laws and regulations affecting financial institutions ingeneral or relating to taxes; the effect of pending or future legislation; the ability of the Company to repurchase its common stock on favorable terms; the ability of the Company to successfullyimplement its acquisition and branch strategy and integrate acquired institutions; changes in interest rates, deposit flows, real estate values, and capital markets; inflation; customeracceptance of the Company's products and services; changes or disruptions in technology and IT systems (including cyber threats, attacks and events); changes in accounting principles relatingto loan loss recognition (current expected credit losses, or CECL); the benefits associated with the Company’s early retirement program and branch closures and sales; and other risk factors.Other relevant risk factors may be detailed from time to time in the Company's press releases and filings with the U.S. Securities and Exchange Commission, including, without limitation, theCompany’s Form 10-K for the year ended December 31, 2020. Any forward-looking statement speaks only as of the date of this presentation, and the Company undertakes no obligation toupdate these forward-looking statements to reflect events or circumstances that occur after the date of this presentation. Annualized, pro forma, projected and estimated numbers are usedfor illustrative purpose only, are not forecasts and may not reflect actual results.
Non-GAAP Financial Measures. This presentation contains financial information determined by methods other than in accordance with U.S. generally accepted accounting principles (GAAP).The Company's management uses these non-GAAP financial measures in their analysis of the Company's performance. These measures adjust GAAP performance measures to, among otherthings, include the tax benefit associated with revenue items that are tax-exempt, as well as exclude from income available to common shareholders, non-interest income, and non-interestexpense certain income and expenses related to significant non-core activities, such as merger-related expenses, expenses related to the Company’s early retirement program, gain on sale ofbranches, and net branch right-sizing expenses. In addition, the Company also presents certain figures based on tangible common stockholders’ equity, tangible assets, and tangible book value,which exclude goodwill and other intangible assets. The Company further presents certain figures that are exclusive of the impact of PPP loans. The Company’s management believes that thesenon-GAAP financial measure are useful to investors because they, among other things, present the results of the Company’s ongoing operations without the effect of mergers or other items notcentral to the Company’s ongoing business, as well as normalize for tax effects. Management, therefore, believes presentations of these non-GAAP financial measures provide usefulsupplemental information that is essential to a proper understanding of the operating results of the Company's core businesses, and management uses these non-GAAP measures to assess theperformance of the Company’s core businesses as related to prior financial periods. These non-GAAP disclosures should not be viewed as a substitute for operating results determined inaccordance with GAAP, nor are they necessarily comparable to non-GAAP performance measures that may be presented by other companies. Where non-GAAP financial measures are used, thecomparable GAAP financial measure, as well as the reconciliation to the comparable GAAP financial measure, can be found in the appendix to this presentation.

(1) Non-GAAP measures that management believes aids in the discussion of results. See Appendix for Non-GAAP reconciliation
(2) Market conditions and our capital needs will drive the decisions regarding additional, future stock repurchases.
Q3 21 Highlights
3
1
2
3
4
5
Strong capital position and ability toorganically generate capital allows us toreturn excess capital to shareholders (2)
CET1 ratio at 14.26%
+171 bps vs Sept-20
Shares repurchased
1.8M in Q3 21
Simultaneously completed closing andconversion of Landmark CommunityBank and Triumph Bank in October
From date of announcementto closing and conversion
~4 months
Commitment to maintaining a strongcredit culture evidenced by creditmetrics at historically low levels
NPL ratio declines
16 bps vs Jun-21
NPL coverage increases to
341%
Strong loan originations coupled with4th consecutive quarterly increase incommercial loan pipeline
Solid results reflect our ability to focuson fundamentals while strategicallynavigating challenging environment
EPS of $0.74 up
23% vs Q3 20
EPS up $0.05 vs 2Q21
ROE 10.42%ROTE (1) 17.43%
Loan production of
$1.5B in Q3 21
Commercial loan pipeline
+15% vs Jun-21

Q3 21 Results Overview
4
5
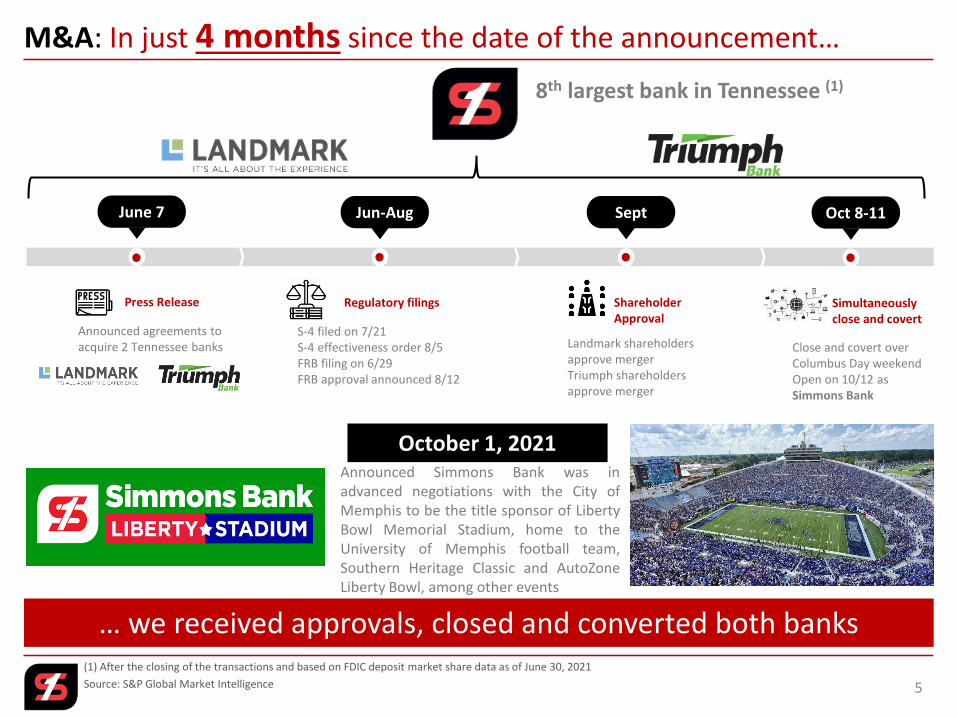
M&A: In just 4 months since the date of the announcement…
June 7
Press Release
Announced agreements to acquire 2 Tennessee banks
Jun-Aug
Regulatory filings
S-4 filed on 7/21S-4 effectiveness order 8/5FRB filing on 6/29FRB approval announced 8/12
Sept
Shareholder Approval
Landmark shareholders approve mergerTriumph shareholders approve merger
Oct 8-11
Simultaneously close and covert
Close and covert over Columbus Day weekendOpen on 10/12 as Simmons Bank
(1) After the closing of the transactions and based on FDIC deposit market share data as of June 30, 2021
Source: S&P Global Market Intelligence
… we received approvals, closed and converted both banks
October 1, 2021
8th largest bank in Tennessee (1)
Announced Simmons Bank was inadvanced negotiations with the City ofMemphis to be the title sponsor of LibertyBowl Memorial Stadium, home to theUniversity of Memphis football team,Southern Heritage Classic and AutoZoneLiberty Bowl, among other events
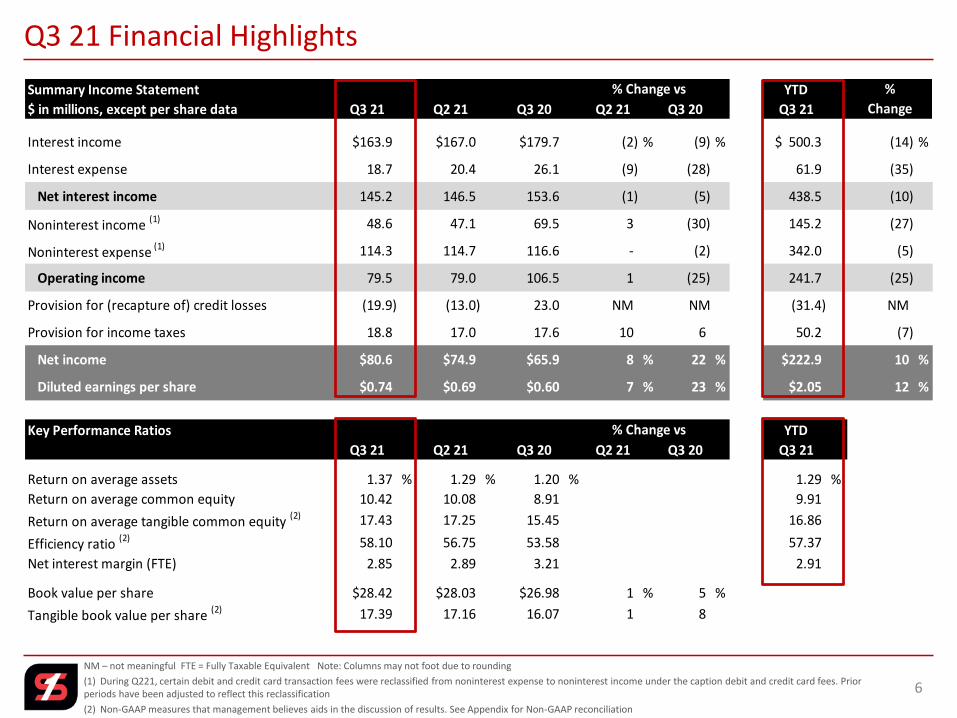
Summary Income Statement YTD
$ in millions, except per share data Q3 21 Q2 21 Q3 20 Q2 21 Q3 20 Q3 21
Interest income $163.9 $167.0 $179.7 (2) % (9) % $ 500.3 (14) %
Interest expense 18.7 20.4 26.1 (9) (28) 61.9 (35)
Net interest income 145.2 146.5 153.6 (1) (5) 438.5 (10)
Noninterest income (1) 48.6 47.1 69.5 3 (30) 145.2 (27)
Noninterest expense (1) 114.3 114.7 116.6 - (2) 342.0 (5)
Operating income 79.5 79.0 106.5 1 (25) 241.7 (25)
Provision for (recapture of) credit losses (19.9) (13.0) 23.0 NM NM (31.4) NM
Provision for income taxes 18.8 17.0 17.6 10 6 50.2 (7)
Net income $80.6 $74.9 $65.9 8 % 22 % $222.9 10 %
Diluted earnings per share $0.74 $0.69 $0.60 7 % 23 % $2.05 12 %
Key Performance Ratios YTD
Q3 21 Q2 21 Q3 20 Q2 21 Q3 20 Q3 21
Return on average assets 1.37 % 1.29 % 1.20 % 1.29 %
Return on average common equity 10.42 10.08 8.91 9.91
Return on average tangible common equity (2) 17.43 17.25 15.45 16.86
Efficiency ratio (2) 58.10 56.75 53.58 57.37
Net interest margin (FTE) 2.85 2.89 3.21 2.91
Book value per share $28.42 $28.03 $26.98 1 % 5 %
Tangible book value per share (2) 17.39 17.16 16.07 1 8
% Change vs
% Change vs
%
Change
NM – not meaningful FTE = Fully Taxable Equivalent Note: Columns may not foot due to rounding
(1) During Q221, certain debit and credit card transaction fees were reclassified from noninterest expense to noninterest income under the caption debit and credit card fees. Prior periods have been adjusted to reflect this reclassification
(2) Non-GAAP measures that management believes aids in the discussion of results. See Appendix for Non-GAAP reconciliation
6
Q3 21 Financial Highlights

$147.5 $149.4 $144.2 $145.5 $146.1
$156.5$158.4
$150.8 $151.1 $150.2
Q3 20 Q4 20 Q1 21 Q2 21 Q3 21CORE NII (1) Net Interest Income
(1) Non-GAAP measure that management believes aids in the discussion of results. See Appendix for Non-GAAP reconciliation
FTE – fully taxable equivalent
Net Interest Income and Margin
7
Net Interest Income$ in millions; Fully Taxable Equivalent
Net Interest Income Evolution$ in millions; Fully Taxable Equivalent
Q2 21 Δ in PPP Contribution
Δ in Accretion Contribution
Δ in Interest Income (FTE) ex PPP & Accretion
Δ in Interest Expense Q3 21
Net Interest MarginFully taxable equivalent
Loan & Deposits Yield/RatesFully taxable equivalent (%)
3.21 3.22
2.99 2.89 2.853.02
3.042.86
2.78 2.77
Q3 20 Q4 20 Q1 21 Q2 21 Q3 21Net Interest Margin (%) Core Net Interest Margin (1) (%)
4.54 4.74 4.75 4.73 4.76
4.29 4.47 4.53 4.54 4.61
0.39 0.34 0.30 0.24 0.20
Q3 20 Q4 20 Q1 21 Q2 21 Q3 21Loan Yield Core Loan Yield (1) Cost of Deposits
(1) During 2021, certain debit and credit card transaction fees were reclassified from noninterest expense to noninterest income under the caption debit and credit card fees. Prior periods have been adjusted to reflect this reclassification
(2) Non-GAAP measure that management believes aids in the discussion of results. See Appendix for Non-GAAP reconciliation
FTE – full-time equivalent
8
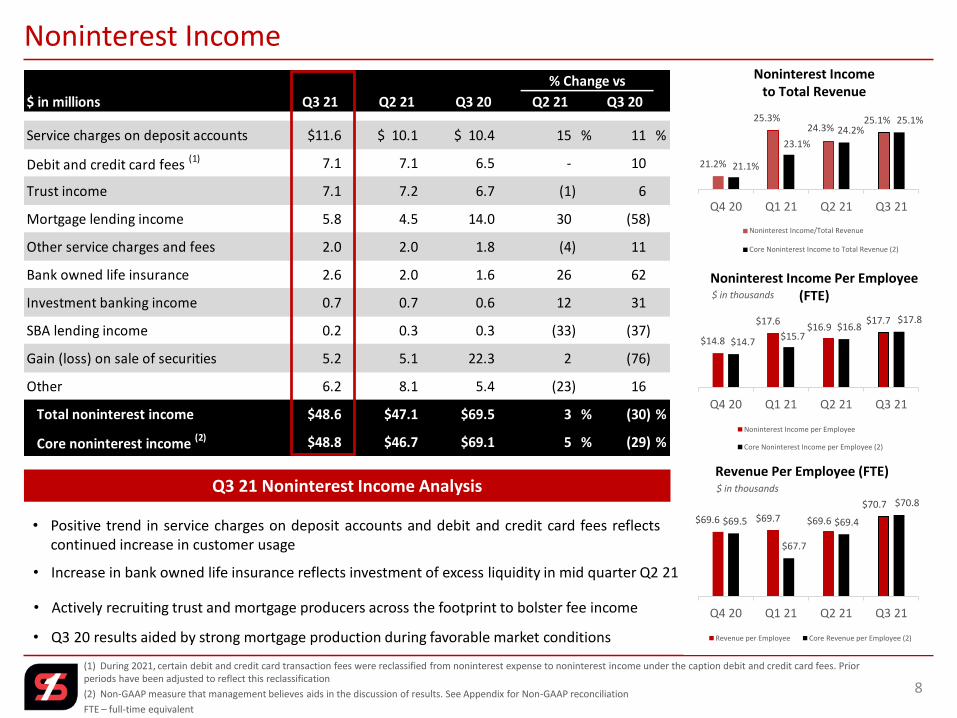
Noninterest Income
21.2%
25.3%24.3%
25.1%
21.1%
23.1%
24.2%25.1%
Q4 20 Q1 21 Q2 21 Q3 21
Noninterest Income/Total Revenue
Core Noninterest Income to Total Revenue (2)
Noninterest Income to Total Revenue
$14.8
$17.6$16.9
$17.7
$14.7$15.7
$16.8$17.8
Q4 20 Q1 21 Q2 21 Q3 21
Noninterest Income per Employee
Core Noninterest Income per Employee (2)
Noninterest Income Per Employee (FTE)
$69.6 $69.7 $69.6
$70.7
$69.5
$67.7
$69.4
$70.8
Q4 20 Q1 21 Q2 21 Q3 21
Revenue per Employee Core Revenue per Employee (2)
Revenue Per Employee (FTE)
$ in millions Q3 21 Q2 21 Q3 20 Q2 21 Q3 20
Service charges on deposit accounts $11.6 $ 10.1 $ 10.4 15 % 11 %
Debit and credit card fees (1) 7.1 7.1 6.5 - 10
Trust income 7.1 7.2 6.7 (1) 6
Mortgage lending income 5.8 4.5 14.0 30 (58)
Other service charges and fees 2.0 2.0 1.8 (4) 11
Bank owned life insurance 2.6 2.0 1.6 26 62
Investment banking income 0.7 0.7 0.6 12 31
SBA lending income 0.2 0.3 0.3 (33) (37)
Gain (loss) on sale of securities 5.2 5.1 22.3 2 (76)
Other 6.2 8.1 5.4 (23) 16
Total noninterest income $48.6 $47.1 $69.5 3 % (30) %
Core noninterest income (2) $48.8 $46.7 $69.1 5 % (29) %
% Change vs
• Positive trend in service charges on deposit accounts and debit and credit card fees reflectscontinued increase in customer usage
Q3 21 Noninterest Income Analysis
• Increase in bank owned life insurance reflects investment of excess liquidity in mid quarter Q2 21
• Actively recruiting trust and mortgage producers across the footprint to bolster fee income
• Q3 20 results aided by strong mortgage production during favorable market conditions
$ in thousands
$ in thousands
2.12% 2.14%
2.30%
1.99% 1.97% 1.97%
2.04%2.07% 2.07%
1.97% 1.95%
2.00%
Q2 20 Q3 20 Q4 20 Q1 21 Q2 21 Q3 21
Noninterest Expense Core Noninterest Expense (2)
(1) During Q221, certain debit and credit card transaction fees were reclassified from noninterest expense to noninterest income under the caption debit and credit card fees. Prior periods have been restated to reflect this change
(2) Non-GAAP measure that management believes aids in the discussion of results. See Appendix for Non-GAAP reconciliation9
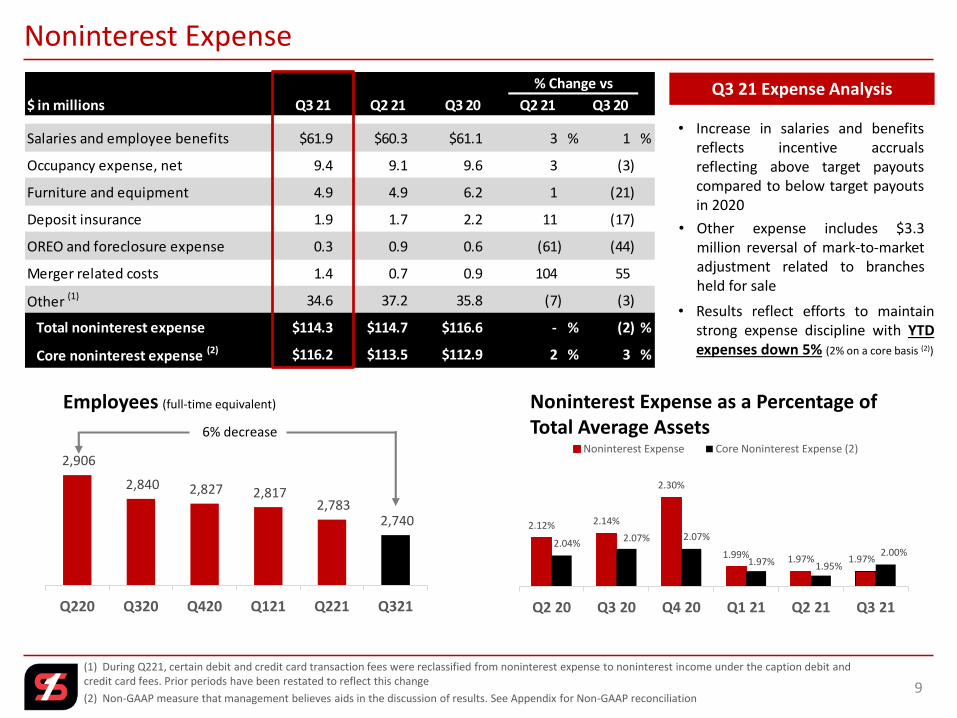
Noninterest Expense
2,906
2,840 2,827 2,817 2,783
2,740
Q220 Q320 Q420 Q121 Q221 Q321
Employees (full-time equivalent)
6% decrease
Noninterest Expense as a Percentage of Total Average Assets
$ in millions Q3 21 Q2 21 Q3 20 Q2 21 Q3 20
Salaries and employee benefits $61.9 $60.3 $61.1 3 % 1 %
Occupancy expense, net 9.4 9.1 9.6 3 (3)
Furniture and equipment 4.9 4.9 6.2 1 (21)
Deposit insurance 1.9 1.7 2.2 11 (17)
OREO and foreclosure expense 0.3 0.9 0.6 (61) (44)
Merger related costs 1.4 0.7 0.9 104 55
Other (1) 34.6 37.2 35.8 (7) (3)
Total noninterest expense $114.3 $114.7 $116.6 - % (2) %
Core noninterest expense (2) $116.2 $113.5 $112.9 2 % 3 %
% Change vs
• Increase in salaries and benefitsreflects incentive accrualsreflecting above target payoutscompared to below target payoutsin 2020
• Other expense includes $3.3million reversal of mark-to-marketadjustment related to branchesheld for sale
Q3 21 Expense Analysis
• Results reflect efforts to maintainstrong expense discipline with YTDexpenses down 5% (2% on a core basis (2))
Q3 20 Q4 20 Q3 21
Q3 20 Q4 20 Q3 21
Branch Transactions Digital Transactions
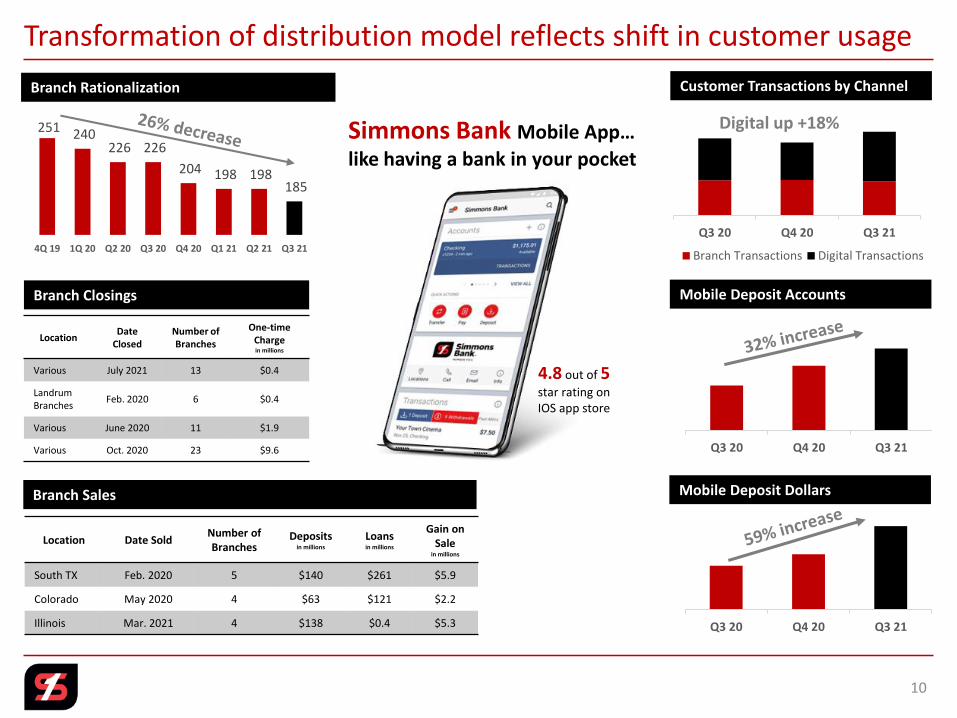
Transformation of distribution model reflects shift in customer usage
Branch Rationalization
251 240 226 226
204 198 198 185
4Q 19 1Q 20 Q2 20 Q3 20 Q4 20 Q1 21 Q2 21 Q3 21
LocationDate
ClosedNumber ofBranches
One-timeChargein millions
Various July 2021 13 $0.4
Landrum Branches
Feb. 2020 6 $0.4
Various June 2020 11 $1.9
Various Oct. 2020 23 $9.6
Branch Closings
Location Date SoldNumber ofBranches
Depositsin millions
Loansin millions
Gain on Sale
in millions
South TX Feb. 2020 5 $140 $261 $5.9
Colorado May 2020 4 $63 $121 $2.2
Illinois Mar. 2021 4 $138 $0.4 $5.3
Branch Sales
Customer Transactions by Channel
Digital up +18%
Mobile Deposit Accounts
Q3 20 Q4 20 Q3 21
Mobile Deposit Dollars
Simmons Bank Mobile App…
like having a bank in your pocket
4.8 out of 5star rating on IOS app store
10

LOANS
11

Loan Portfolio: Elevated loan origination volume in the quarter…
12
PPP – Paycheck Protection Program
Loan Portfolio Waterfall$ in millions
Total loansat 6/30/21
Originations/Advances
PPP Forgiveness
Paydowns/Payoffs &
Other
Total loansat 9/30/21
… offset by PPP forgiveness, planned run-off and paydowns
$ in millions
OriginalBalance
9/30/21Balance
6/30/21 Balance
$Change
# ofLoans
Originated
Net FeesRemaining
PPP Phase I $ 976 $ 22 $ 141 $ (119) 8,208 $ 0.2
PPP Phase II 319 190 300 (110) 5,219 8.3
Total $ 1,295 $ 212 $ 441 $ (229) 13,427 $ 8.5
Paycheck Protection Program
ADDITIONAL INFORMATION▪ $46M planned run-off in Energy portfolio▪ $32M decrease in Mortgage Warehouse▪ $124M increase in unfunded commitments▪ Actively added new loan producers in 2021:
• 29 commercial and community bankers• 8 mortgage loan officers• 15 wealth management associates

Commercial loan pipeline increases for the 4th consecutive quarter…
13
(1) Quarterly amounts adjusted for branches sold in South Texas and Colorado during 2020 and Illinois in 2021
… suggesting loan demand is trending in a positive direction
Commercial Loan Pipeline by Category (1)
$ in millions
$641 $219 $192 $247 $487 $340 $503
$220
$90 $112 $250
$408
$484
$483
$291
$72 $70
$177
$285
$467
$493
4.70%
4.10%
4.37%
4.12% 3.81% 3.77%
3.47%
0.00%
0.50%
1.00%
1.50%
2.00%
2.50%
3.00%
3.50%
4.00%
4.50%
5.00%
$0
$200
$400
$600
$800
$1,000
$1,200
$1,400
$1,600
Q1 20 Q2 20 Q3 20 Q4 20 Q1 21 Q2 21 Q3 21
Opportunity Proposal Ready to Close Rate - Ready to Close
$1,152
$381 $374
$674
$1,180$1,291
$1,480

Mortgage Loan Volume – Closed and Pipeline
14
$ in millions
$126 $224 $243 $181 $183 $319 $408 $399 $326 $274 $242
$77
$92 $86
$51 $145
$239
$307 $214
$166
$120 $97
Q1 19 Q2 19 Q3 19 Q4 19 Q1 20 Q2 20 Q3 20 Q4 20 Q1 21 Q2 21 Q3 21
Mortgage Closed Loan Volume Mortgage Pipeline Volume
Mortgage originations in Q3: 61% purchase 39% refinance
Mortgage Loan Volume – Closed in 2019
$774 Million
Mortgage Loan Volume – Closed in 2020
$1.3 Billion
Mortgage Loan Volume –Closed YTD 2021
$842 Million
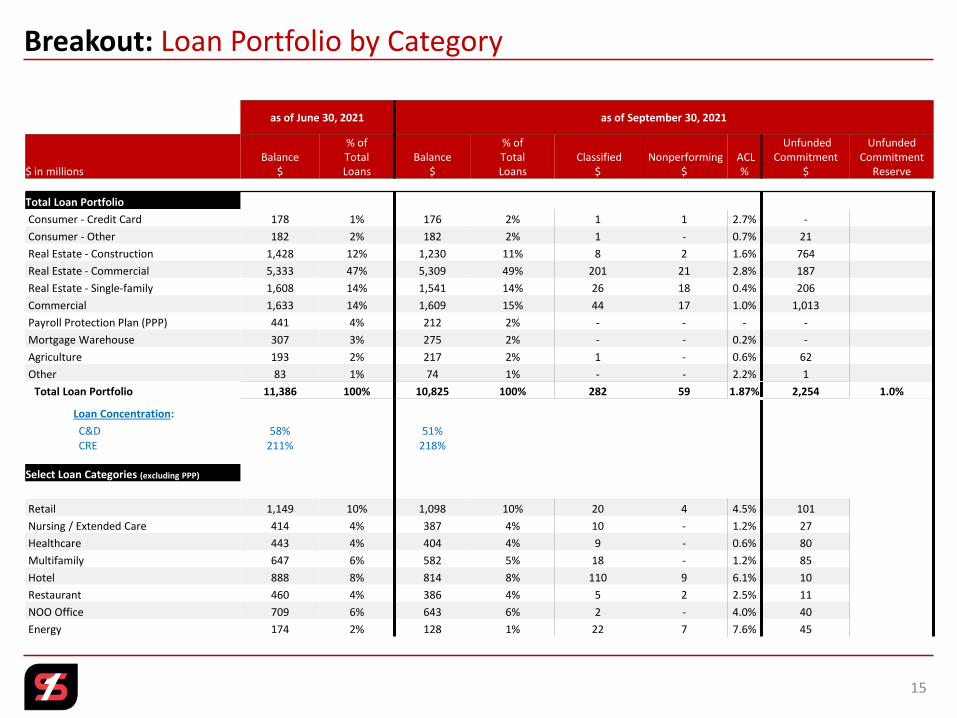
Breakout: Loan Portfolio by Category
15
as of June 30, 2021 as of September 30, 2021
$ in millionsBalance
$
% ofTotalLoans
Balance$
% ofTotalLoans
Classified$
Nonperforming$
ACL%
UnfundedCommitment
$
UnfundedCommitment
Reserve
Total Loan Portfolio
Consumer - Credit Card 178 1% 176 2% 1 1 2.7% -
Consumer - Other 182 2% 182 2% 1 - 0.7% 21
Real Estate - Construction 1,428 12% 1,230 11% 8 2 1.6% 764
Real Estate - Commercial 5,333 47% 5,309 49% 201 21 2.8% 187
Real Estate - Single-family 1,608 14% 1,541 14% 26 18 0.4% 206
Commercial 1,633 14% 1,609 15% 44 17 1.0% 1,013
Payroll Protection Plan (PPP) 441 4% 212 2% - - - -
Mortgage Warehouse 307 3% 275 2% - - 0.2% -
Agriculture 193 2% 217 2% 1 - 0.6% 62
Other 83 1% 74 1% - - 2.2% 1
Total Loan Portfolio 11,386 100% 10,825 100% 282 59 1.87% 2,254 1.0%
Loan Concentration:
C&D 58% 51%CRE 211% 218%
Select Loan Categories (excluding PPP)
Retail 1,149 10% 1,098 10% 20 4 4.5% 101
Nursing / Extended Care 414 4% 387 4% 10 - 1.2% 27
Healthcare 443 4% 404 4% 9 - 0.6% 80
Multifamily 647 6% 582 5% 18 - 1.2% 85
Hotel 888 8% 814 8% 110 9 6.1% 10
Restaurant 460 4% 386 4% 5 2 2.5% 11
NOO Office 709 6% 643 6% 2 - 4.0% 40
Energy 174 2% 128 1% 22 7 7.6% 45

DEPOSITS, LIQUIDITY, SECURITIES, INTEREST RATE SENSITIVITY AND CAPITAL
16
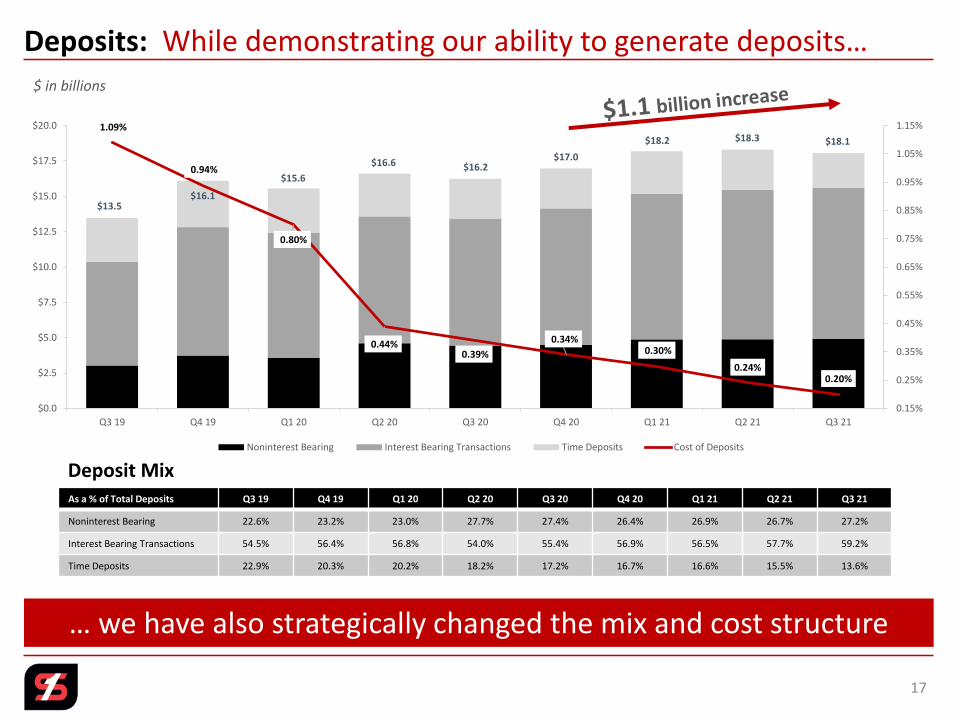
Deposits: While demonstrating our ability to generate deposits…
17
… we have also strategically changed the mix and cost structure
$ in billions
1.09%
0.94%
0.80%
0.44% 0.39%
0.34% 0.30%
0.24%0.20%
0.15%
0.25%
0.35%
0.45%
0.55%
0.65%
0.75%
0.85%
0.95%
1.05%
1.15%
$0.0
$2.5
$5.0
$7.5
$10.0
$12.5
$15.0
$17.5
$20.0
Q3 19 Q4 19 Q1 20 Q2 20 Q3 20 Q4 20 Q1 21 Q2 21 Q3 21
Noninterest Bearing Interest Bearing Transactions Time Deposits Cost of Deposits
$13.5$16.1
$15.6
$16.6 $16.2$17.0
$18.2 $18.3 $18.1
As a % of Total Deposits Q3 19 Q4 19 Q1 20 Q2 20 Q3 20 Q4 20 Q1 21 Q2 21 Q3 21
Noninterest Bearing 22.6% 23.2% 23.0% 27.7% 27.4% 26.4% 26.9% 26.7% 27.2%
Interest Bearing Transactions 54.5% 56.4% 56.8% 54.0% 55.4% 56.9% 56.5% 57.7% 59.2%
Time Deposits 22.9% 20.3% 20.2% 18.2% 17.2% 16.7% 16.6% 15.5% 13.6%
Deposit Mix

18
FTE – fully taxable equivalent
Cash and Cash Equivalents$ in millions
Securities Portfolio Summary$ in millions
Liquidity, Securities and Interest Rate Sensitivity
As of 9/30/21Par
ValueYield(FTE)
Effective Duration
AFS HTM
Fixed Rate
MBS $2,938 1.24% 3.76 98% 2%
Municipal 2,702 2.68% 8.11 56% 44%
Treasury/Agency 495 1.76% 6.11 52% 48%
Corporate 395 2.90% 5.94 96% 4%
Other 114 1.52% 4.48 100% -
Variable Rate 1,502 0.36% 1.00 100% -
Total $8,146 1.68% 4.96 81% 19%
$0
$500
$1,000
$1,500
$2,000
$2,500
$3,000
$3,500
$4,000
$4,500
Q1 19 Q2 19 Q3 19 Q4 19 Q1 20 Q2 20 Q3 20 Q4 20 Q1 21 Q2 21 Q3 21
Cash & Cash Equivalents Short-Term Variable Rate Securities
$546
$1,052
$1,792
$2,600
$4,103
• Net securities purchases totaling $904 million inthe quarter, including the redeployment of excesscash into variable rate securities ($226 million)
• Reclassified $502 million of securities from AFS toHTM
Q3 21 Summary
• Approximately $3.3 billion of liquidity includingcash and cash equivalents and variable ratesecurities at 9/30/21
• Securities portfolio effective duration, net of swap,at 4.3 at 9/30/21
• Entered into $1 billion matched swap on fixed ratesecurities
Interest Rate SensitivityOver the next 12 months
-2.0%
3.0%
6.7%
Down 100 bps Up 100 bps Up 200 bps
$710$585
$2,577
$3,527 $3,606
$3,286

9.8% 10.2%
10.9%
13.4%
14.3%
2017 2018 2019 2020 Q3 21
WELL
CAPITALIZED
8.0%
9.8% 10.2%
10.9%
13.4%
14.3%
2017 2018 2019 2020 Q3 21
11.4%
13.4% 13.7%
16.8% 17.4%
2017 2018 2019 2020 Q3 21
9.2%
8.8%
9.6%
9.1% 9.1%
2017 2018 2019 2020 Q3 21
(1) As of December 31, except where otherwise stated
(2) Non-GAAP measure that management believes aids in the discussion of results. See Appendix for Non-GAAP reconciliation 19
WELL
CAPITALIZED
5.0%
9.2%Excluding PPP Loans (2)
Tier 1 Leverage Ratio (1) CET1 Capital Ratio (1)
WELL
CAPITALIZED
6.5%
Tier 1 Risk-Based Capital Ratio (1) Total Risk-Based Capital Ratio (1)
WELL
CAPITALIZED
10.0%
Strong Capital Position: Disciplined capital management process…
… has allowed us to effectively manage our risk profile while also well-positioning us to take advantage of future growth opportunities …

$22.65 $24.33
$26.30 $27.53 $27.04
$28.03 $28.42
2017 2018 2019 2020 Q1 21 Q2 21 Q3 21
(1) As of December 31, except where otherwise stated
(2) Non-GAAP measure that management believes aids in the discussion of results. See Appendix for Non-GAAP reconciliation
(3) Based on October 13, 2021 closing stock price of $30.31
(4) Market conditions and our capital needs will drive the decisions regarding additional, future stock repurchases.
* Represents the annualized cash dividend rate based on the current quarterly cash dividend on the Company’s Class A common stock ($0.18 *4). The future payment of dividends is not guaranteed and is subject to various factors, including approval by the Company’s board of directors
… without losing focus on creating long-term shareholder value …
Book Value Per Common Share(1)
25% increase
$12.34
$14.18
$15.89 $16.56 $16.13
$17.16 $17.39
2017 2018 2019 2020 Q1 21 Q2 21 Q3 21
Tangible Book Value Per Common Share (1) (2)
41% increase
… and returning excess capital through cash dividends and share repurchases
$0.20 $0.22
$0.24 $0.27
$0.29 $0.31
$0.34 $0.37
$0.38 $0.38 $0.38 $0.38 $0.40
$0.42 $0.44
$0.46 $0.48
$0.50
$0.60
$0.64
$0.68
$0.72
2000 2001 2002 2003 2004 2005 2006 2007 2008 2009 2010 2011 2012 2013 2014 2015 2016 2017 2018 2019 2020 2021*
$10.1
$93.3
$0.0 $0.0
$20.0
$3.1 $0.0
$51.4
Q4 19 Q1 20 Q2 20 Q3 20 Q4 20 Q1 21 Q2 21 Q3 21
Suspended Plan
Proven Dividend Record
Share Repurchase Program (4)
112 consecutive years
30-35% targeted payout ratio
2.3% dividend yield (3)
Q3 Share Repurchase Summary
1.8 million shares repurchased in the quarter$28.48 weighted average price$98.5 million remaining capacity
20
Q3 21 Credit Quality
21

Source: S&P Global Market Intelligence 2016-2020 (which metrics are as of December 31 of the relevant year)
(1) ALLL for 2016 – 2019 and ACL 2020 – 2021 Q3
(2) YTD annualized net charge-offs22
Nonperforming loans / Loans ACL/ALLL(1) / Loans (%) and ACL/ALLL ($)
Nonperforming Assets / Assets
Credit Quality: Commitment to strong underwriting standards …
… is reflected in asset quality metrics trending toward historically low levels
1.68%
0.81%0.67% 0.65%
0.96%
0.55%
2016 2017 2018 2019 2020 Q3 21
$ in millions
$36 $42 $57 $68 $238 $203
0.66%
0.39%0.48% 0.46%
1.85% 1.87%
0.00%
0.20%
0.40%
0.60%
0.80%
1.00%
1.20%
1.40%
1.60%
1.80%
2.00%
$0
$25
$50
$75
$100
$125
$150
$175
$200
$225
$250
2016 2017 2018 2019 2020 Q3 21
1.45%
0.83%0.64%
0.55%0.64%
0.31%
2016 2017 2018 2019 2020 Q3 21
Quarterly Trend 9/30/21 06/30/21 Change
NPL / Loans 0.55% 0.71% (16) bps
Nonperforming Loans (in millions) $59.4 $80.9 ($21.5)
NPA / Assets 0.31% 0.42% (11) bps
Nonperforming Assets (in millions) $72.9 $97.2 ($24.3)
Past Due 30+ Days / Loans 0.09% 0.16% (7) bps
Net Charge-offs (2) / Loans (YTD) 0.06% 0.01% +5 bps
Credit Card Portfolio Net Charge-off Ratio(2) (YTD)
1.38% 1.58% (20) bps
ACL / Loans 1.87% 2.00% (13) bps

ACL = Allowance for Credit Losses on Loans
(1) Non-GAAP measure that management believes aids in the discussion of results. See Appendix for Non-GAAP reconciliation 23
Reserve for Unfunded Commitments
Allowance for Credit Losses (ACL): Reflects continued improvement…
… in credit quality trends and expected Moody’s economic scenarios
$ in millions
ACLLoan
Discount
TotalLoan
Coverage
ACL /Loans
ACL/Loans excluding PPP (1)
ACL as of 12/31/20 $ 238.0 $ 0 $ 238.0 1.85% 1.98%
Q1 21 Provision 0.0 0.0
Q1 21 Net charge-offs (2.9) (2.9)
ACL as of 3/31/21 $ 235.1 $ 0 $ 235.1 1.93% 2.06%
Q2 21 Recapture of Provision (10.0) (10.0)
Q2 21 Net recoveries 2.1 2.1
ACL as of 6/30/21 $ 227.2 $ 0 $ 227.2 2.00% 2.08%
Q3 21 Recapture of Provision (19.9) (19.9)
Q3 21 Net Charge-offs (4.8) (4.8)
ACL as of 9/30/21 $ 202.5 $ 0 $ 202.5 1.87% 1.91%
Allowance for Credit Losses on Loans and Loan Coverage
$ in millionsas of
9/30/20as of
12/31/20As of
3/31/21As of
6/30/21As of
9/30/21
Unfunded Commitments $2,344 $2,051 $2,039 $2,130 $2,254
Reserve $24.4 $22.4 $22.4 $22.4 $22.4
Reserve / Unfunded Balance 1.0% 1.1% 1.1% 1.1% 1.0%
ACL Methodology as of 9/30/21:▪ Quantitative allocation: 0.80%
Moody’s September 2021 scenarios with management’s weighting: S1 (22%) / Baseline (64%) / S2 (14%)
▪ Qualitative allocation: 1.07%▪ Total ACL / Loans: 1.87%

Key Takeaways and Management Outlook
24

Key Takeaways and Management Outlook
25
1 Effectively managing the current economic environment without sacrificing future growth potential
2 Committed to maintaining a strong credit culture and capital position that reflects our risk profile while returning excess capital to shareholders
3 Reinvesting in our franchise by enhancing our growth profile via M&A, adding revenue producing associates and boosting technology capabilities
Management Outlook
Net interest margin: continue to be impacted by excess liquidity but poised to benefit from balance sheet growth and rising ratesCore Noninterest Income/Expense: expect core noninterest income/expense in line with current trends while meeting previously conveyed cost savings guidance with respect to Landmark and Triumph acquisitions Provision Expense: will reflect changes in Moody’s forecast as well as organic and acquired loan growth

APPENDIX
26

27
Non-GAAP ReconciliationsQ3 Q2 Q3 YTD
$ in thousands 2017 2018 2019 2020 2020 2021 2021 2021
Calculation of Return on Tangible Common Equity
Net income available to common stockholders $ 92,940 $ 215,713 $ 237,828 $ 254,852 $ 65,885 $ 74,911 $ 80,561 $ 222,879
Amortization of intangibles, net of taxes ______4,659 ______8,132 ______8,720 ______9,968 ______2,483 ______2,462 ______2,460 _______7,392 Total income available to common stockholders (non-GAAP) $ 97,599 $ 223,845 $ 246,548 $ 264,820 $ 68,368 $ 77,373 $ 83,021 $ 230,271
Average common stockholders' equity $ 1,390,815 $ 2,157,097 $ 2,396,024 $ 2,921,039 $ 2,942,045 $ 2,980,609 $ 3,067,205 $ 3,007,181 Average intangible assets:
Goodwill (455,453) (845,308) (921,635) (1,065,190) (1,064,893) (1,075,305) (1,075,305) (1,075,305)
Other intangibles ____(68,896) ____(97,820) ___(104,000) ___(118,812) ___(116,385) (105,785) (102,576) ____(106,043)
Total average intangibles ___(524,349) ___(943,128) __(1,025,635) __(1,184,002) __(1,181,278) __(1,181,090) __(1,177,881) __(1,181,348)
Average tangible common stockholders' equity (non-GAAP) $ 866,466 $ 1,213,969 $ 1,370,389 $ 1,737,037 $ 1,760,767 $ 1,799,519 $ 1,889,324 $ 1,825,833
Return on average common equity 6.68% 10.00% 9.93% 8.72% 8.91% 10.08% 10.42% 9.91%Return on tangible common equity (non-GAAP) 11.26% 18.44% 17.99% 15.25% 15.45% 17.25% 17.43% 16.86%

FTE – full-time equivalent
28
Non-GAAP Reconciliations
Q3 Q4 Q1 Q2 Q3
$ in thousands 2020 2020 2021 2021 2021
Calculation of Core Noninterest Income to Revenue
Net Interest Income $ 153,610 $ 154,960 $ 146,681 $ 146,533 $ 145,237
Noninterest income 69,479 _____41,761 ___49,549 ____47,115 48,550
Total Revenue (GAAP) $ 223,089 $ 196,721 $ 196,230 $ 193,648 $ 193,787
Noninterest Income (GAAP) $ 69,479 $ 41,761 $ 49,549 $ 47,115 $ 48,550
Non-core Items (non-GAAP) (370) _____(275) ___(5,477) _____(445) 239
Core Noninterest Income (non-GAAP) $ 69,109 $ 41,486 $ 44,072 $ 46,670 $ 48,789
Net Interest Income $ 153,610 $ 154,960 $ 146,681 $ 146,533 $ 145,237
Core Noninterest Income (non-GAAP) 69,109 41,486 ___44,072 _____46,670 48,789
Core Total Revenue (non-GAAP) $ 222,719 $ 196,446 $ 190,753 $ 193,203 $ 194,026
Noninterest Income / Revenue (GAAP) 31.1% 21.2% 25.3% 24.3% 25.1%
Core Noninterest Income / Revenue (non-GAAP) 31.0% 21.1% 23.1% 24.2% 25.1%
Calculation of Total Revenue and Noninterest Income per Employee (FTE)
Employees (FTE) 2,827 2,817 2,783 2,740
Total Revenue per Employee (FTE) $ 69.6 $ 69.7 $ 69.6 $ 70.7
Core total Revenue per Employee (FTE) (non-GAAP) $ 69.5 $ 67.7 $ 69.4 $ 70.8
Noninterest Income per Employee (FTE) $ 14.8 $ 17.6 $ 16.9 $ 17.7
Core Noninterest Income per Employee (FTE) (non-GAAP) $ 14.7 $ 15.7 $ 16.8 $ 17.8

(1) Effective tax rate of 26.135%for 1018 – 2021 and 39.225% for 2017, adjusted for non-deductible merger-related costs and deferred tax items on P&C
(2) Efficiency ratio is core noninterest expense before foreclosed property expense and amortization of intangibles as a percent of net interest income (fully taxable equivalent) and noninterest revenues, excluding gains and losses from securities transactions and non-core items
29
Non-GAAP Reconciliations
Q3 Q4 Q1 Q2 Q3
$ in thousands 2017 2018 2019 2020 2020 2020 2021 2021 2021
Calculation of Efficiency Ratio
Noninterest expense $ 309,988 $ 387,993 $ 456,283 $ 487,585 $ 116,577 $ 125,840 $ 113,002 $ 114,657 $114,333
Non-core non-interest expense adjustment (27,357) (6,118) (42,972) (21,529) (3,690) (12,489) (858) (1,154) 1,879
Other real estate and foreclosure expense adjustment (3,042) (4,240) (3,282) (1,706) (600) (545) (343) (863) (339)
Amortization of intangibles adjustment ______(7,666) ____(11,009) ____(11,805) _____(13,495) (3,362) ______(3,351) (3,344) (3,333) (3,331)
Efficiency ratio numerator $ 271,923 $ 366,626 $ 398,224 $ 450,855 $ 108,925 $ 109,455 $ 108,457 $ 109,307 $ 112,542
Net interest income $ 354,930 $ 552,552 $ 601,753 $ 639,734 $ 153,610 $ 154,960 $ 146,6814 $ 146,533 $ 145,237
Noninterest income 136,374 139,660 200,202 242,618 69,479 41,761 49,549 47,115 48,550
Non-core noninterest income adjustment (3,972) - - (8,738) (370) (275) (5,477) (445) 239
Fully tax-equivalent adjustment⁽¹⁾ 7,723 5,297 7,322 11,001 2,864 3,482 4,163 4,548 4,941
(Gain) loss on sale of securities ______1,059) ________(61) _____(13,314) _____(54,806) (22,305) (16) (5,471) (5,127) (5,248)
Efficiency ratio denominator $ 493,996 $ 697,448 $ 795,463 $ 829,809 $ 203,278 $ 199,912 $ 189,445 $ 192,624 $ 193,719
Efficiency ratio⁽²⁾ 55.05% 52.57% 50.03% 54.33% 53.58% 54.75% 57.25% 56.75% 58.10%
Calculation of Core Noninterest Expense
Noninterest expense (GAAP) $ 115,461 $ 116,577 $ 125,840 $ 113,002 $ 114,657 $ 114,333
Merger related costs (1,830) (902) (731) (233) (686) (1,401)
Branch Right sizing (1,721) (442) (11,696) (625) (468) 3,280
Early retirement program (493) (2,346) (62) - - -
Core noninterest expense (non-GAAP) $ 111,417 $ 112,887 $ 113,351 $ 112,144 $ 113,503 $ 116,212
Calculation of Noninterest Expense to Average Assets
Noninterest expense (GAAP) $ 115,461 $ 116,577 $ 125,840 $ 113,002 $ 114,657 $ 114,333
Core noninterest expense (non-GAAP) $ 111,417 $ 112,887 $ 113,352 $ 112,144 $ 113,503 $ 116,212
Average total assets $21,822,273 $21,765,321 $21,852,094 $22,738,821 $23,257,921 $23,255,541
Noninterest expense to average total assets 2.12% 2.14% 2.30% 1.99% 1.97% 1.97%Core noninterest expense to average total assets (non-GAAP) 2.04% 2.07% 2.07% 1.97% 1.95% 2.00%
Q2 Q3 Q4 Q1 Q2 Q3
$ in thousands 2020 2020 2020 2021 2021 2021

30
Non-GAAP Reconciliations
Q3 Q4 Q1 Q2 Q3$ in thousands 2020 2020 2021 2021 2021
Calculation of Core Net Interest MarginNet interest income $ 153,610 $ 154,960 $ 146,681 $ 146,533 $ 145,237Fully tax-equivalent adjustment 2,864 3,482 4,163 _______4,548 4,941
Fully tax-equivalent net interest income 156,474 158,442 150,844 151,081 150,178
Total accretable yield (8,948) (8,999) (6,630) ______(5,619) (4,122)Core net interest income (non-GAAP) $ 147,526 $ 149,443 $ 144,214 $ 145,462 $ 146,056
PPP loan and excess liquidity interest income (non-GAAP) (6,131) (6,983) ______(12,257) (9,445) (10,064)Core net interest income adjusted for PPP loans and liquidity (non-GAAP) $ 150,343 $ 151,459 $ 138,587 $ 141,636 $140,114
Average earning assets $ 19,415,314 $ 19,573,651 $ 20,484,908 $ 20,959,642 $ 20,901,992Average PPP loan balance and excess liquidty (2,359,928) (2,837,125) (3,617,567) (2,659,831) (1,475,098Average earning assets adjusted for PPP loans and liquidity (non-GAAP) $ 17,055,386 $ 16,736,526 $ 16,867,341 $ 18,299,811 $ 19,426,894
Net interest margin 3.21% 3.22% 2.99% 2.89% 2.85%Core net interest margin (non-GAAP) 3.02% 3.04% 2.86% 2.78% 2.77%Core net interest margin adjusted for PPP loans and liquidity (non-GAAP) 3.51% 3.60% 3.33% 3.10% 2.86%
Calculation of Adjusted Pre-Tax, Pre-Provision (PTPP) EarningsNet income available to common shareholders $ 65,885 $ 52,955 $ 67,407 $ 74,911 $ 80,561 Provision for income taxes 17,633 10,970 14,363 17,018 18,770Provision for credit losses 22,981 6,943 1,445 (12,951) (19,890)(Gain) loss on sale of securities (22,305) (16) (5,471) (5,127) (5,248)Net pre-tax non-core items ________3,320 _______12,214 _______(4,619) _________709 (1,640)
Pre-tax, pre-provision (PTTP) earnings $ 87,514 $ 83,066 $ 73,125 $ 74,560 $ 72,553

31
Non-GAAP Reconciliations
$ in thousands, except per share and share count 2017 2018 2019 2020
Calculation of Book Value and Tangible Book Value per Share
Total common stockholders' equity $ 2,084,564 $ 2,246,434 $ 2,988,157 $ 2,975,889
Intangible assets:
Goodwill (842,651) (845,687) (1,055,520) (1,075,305)
Other intangible assets (106,071) (91,334) (127,340) (111,110)
Total intangibles (948,722) (937,021) (1,182,860) (1,186,415)
Tangible common stockholders' equity (non-GAAP) $ 1,135,842 $ 1,309,413 $ 1,805,297 $ 1,789,474
Shares of common stock outstanding 92,029,118 92,347,643 113,628,601 108,077,662
Book value per common share $ 22.65 $ 24.33 $ 26.30 $ 27.53
Tangible book value per common share (non-GAAP) $ 12.34 $ 14.18 $ 15.89 $ 16.56
Q3 Q1 Q2 Q3
$ in thousands, except per share and share count 2020 2021 2021 2021
Calculation of Book Value and Tangible Book Value per Share
Total common stockholders' equity $ 2,941,474 $ 2,930,008 $ 3,038,599 $ 3,029,764
Intangible assets:
Goodwill (1,075,305) (1,075,305) (1,075,305) (1,0745,305)
Other intangible assets (114,460) (107,091) (103,759) (100,428)
Total intangibles (1,189,765) (1,182,396) (1,179,064) (1,175,733)
Tangible common stockholders' equity (non-GAAP) $ 1,751,709 $ 1,747,612 $ 1,859,535 $ 1,854,031
Shares of common stock outstanding 109,023,781 108,345,732 108,386,669 106,603,231
Book value per common share $ 26.98 $ 27.04 $ 28.03 $ 28.42
Tangible book value per common share (non-GAAP) $ 16.07 $ 16.13 $ 17.16 $ 17.39

32
Non-GAAP Reconciliations
Q3 Q4 Q1 Q2 Q3
$ in thousands 2020 2020 2021 2021 2021
Calculation of Core Loan YieldLoan interest income (FTE) $ 163,379 $ 160,306 $ 146,601 $ 138,987 $ 132,399Total accretable yield (8,948) (8,999) (6,630) ______(5,619) (4,122)
Core loan interest income (non-GAAP) 154,431 151,307 $ 139,971 $ 133,368 $ 128,277PPP loan interest income (5,782) (6,457) (11,652) ______(8,958) (9,614)Core loan interest income excluding PPP loans (non-GAAP) $ 148,649 $ 144,850 $ 128,319 $ 124,410 $ 118,663
Average loan balance $ 14,315,014 $ 13,457,077 $ 12,518,300 $ 11,783,839 $ 11,030,438Average PPP loan balance (non-GAAP) (967,152) (937,544) (891,070) ____(707,296) (359,828)
Core loan interest income excluding PPP loans (non-GAAP) $ 13,347,862 $ 12,519,533 $ 11,627,230 $ 11,076,543 $ 10,670,610
Core loan yield (non-GAAP) 4.29% 4.47% 4.53% 4.54% 4.61%
Core loan yield excluding PPP loans (non-GAAP) 4.43% 4.60% 4.48% 4.51% 4.41%
Calculation of Loan Yield Adjusted for PPP LoansLoan interest income (FTE) $ 163,379 $ 160,306 $ 146,601 $ 138,987 $ 132,399PPP loan interest income (5,782) (6,457) (11,652) _______(8,958) (9,614)Loan interest income excluding PPP loans (non-GAAP) $ 157,597 $ 153,849 $ 134,949 $ 130,029 $ 122,785
Average loan balance $ 14,315,014 $ 13,457,077 $ 12,518,300 $ 11,783,839 $ 11,030,438
Average PPP loan balance (967,152) (937,544) (891,070) _____(707,296) (359,828)Average loan balance excluding PPP loans (non-GAAP) $ 13,347,862 $ 12,519,533 $ 11,627,230 $ 11,076,543 $ 10,670,610
Loan yield 4.54% 4.74% 4.75% 4.73% 4.76%Loan yield excluding PPP loans (non-GAAP) 4.70% 4.89% 4.71% 4.71% 4.61%
Calculation of Allowance for Credit Losses to Total LoansAllowance for credit losses (GAAP) $ 238,050 $ 235,116 $ 227,239 $ 202,508
Total loans (GAAP) $ 12,900,897 $ 12,195,873 $ 11,386,352 $ 10,825,227PPP loan balance (904,673) (797,629) (441,353) (212,087)Total loans excluding PPP loans (non-GAAP) $ 11,996,224 $ 11,398,244 $ 10,944,999 $ 10,613,140
Allowance for credit losses to total loans 1.85% 1.93% 2.00% 1.87%Allowance for credit losses to total loans excluding PPP (non-GAAP) 1.98% 2.06% 2.08% 1.91%

Non-GAAP Reconciliations
33
Q3 Q4 Q1 Q2 Q3
$ in thousands 2020 2020 2021 2021 2021
Calculation of Regulatory Tier 1 Leverage Ratio Excluding Average PPP Loans
Total Tier 1 capital $ 1,868,173 $ 1,884,563 $ 1,939,868 $ 2,000,023 $ 2,012,059
Adjusted average assets for leverage ratio $ 20,652,454 $ 20,765,127 $ 21,668,406 $ 22,244,118 $ 22,199,822
Average PPP loans (967,152) (937,544) (891,070) (707,296) (359,828)
Adjusted average assets excluding average PPP loans (non-GAAP) $ 19,685,302 $ 19,827,583 $ 20,777,336 $ 21,536,822 $ 21,839,994
Tier 1 leverage ratio 9.05% 9.08% 8.95% 8.99% 9.06%
Tier 1 leverage ratio excluding average PPP loans (non-GAAP) 9.49% 9.50% 9.34% 9.29% 9.21%

Contents
3 Q3 Key Highlights
4 Q3 Results Overview
11 Loans
16 Deposits, Liquidity, Securities, Interest Rate Sensitivity & Capital
21 Credit Quality
24 Key Takeaways and Management Outlook
26 Appendix
3rd Quarter 2021 Earnings Presentation
| NASDAQ: SFNC