Financial Results of FY2013 Third Quarter Results of FY2013 Third Quarter Sumitomo Chemical Co.,...
13
Sumitomo Chemical Co., Ltd. January 31, 2014 Financial Results of FY2013 Third Quarter Sumitomo Chemical Co., Ltd.
Transcript of Financial Results of FY2013 Third Quarter Results of FY2013 Third Quarter Sumitomo Chemical Co.,...

Sumitomo Chemical Co., Ltd.
January 31, 2014
Financial Results of
FY2013 Third Quarter
Sumitomo Chemical Co., Ltd.

Sumitomo Chemical Co., Ltd.
(Cautionary Statement) Statements made in this material with respect to Sumitomo Chemical’s current plans, estimates, strategies and
beliefs that are not historical facts are forward-looking statements about the future performance of Sumitomo
Chemical. These statements are based on management’s assumptions and beliefs in light of the information
currently available to it, and involve risks and uncertainties. The important factors that could cause actual
results to differ materially from those discussed in the forward-looking statements include, but are not limited to,
general economic conditions in Sumitomo Chemical’s markets; demand for, and competitive pricing pressure on,
Sumitomo Chemical’s products in the marketplace; Sumitomo Chemical’s ability to continue to win acceptance
for its products in these highly competitive markets; and movements of currency exchange rates.
Sumitomo Chemical Co., Ltd.

Sumitomo Chemical Co., Ltd.
Financial Summary・・・・・・・・・・・・・・・・・・・・ ・・
Net Sales by Business Segments・・・・・・・・・
Operating Income by Business Segments・
Extraordinary Gains / Losses・・・・・・・・・・・・・
Consolidated Balance Sheets・・・・・・・・・・・・
Consolidated Statements of Cash Flows・
Major Subsidiaries・・・・・・・・・・・・・・・・・・・・・・・・
(Reference: Segment Information)
Net Sales by Business Segments
(Quarterly)・・・・・・・・・・・・・・・・・・・・・・・・・・・・・・
Operating Income by Business Segments
(Quarterly)・・・・・・・・・・・・・・・・・・・・・・・・・・・・・・
Consolidated Financial Results of FY2013 Third Quarter
1
2
3
4
5
6
7
9
10
Contents
Sumitomo Chemical Co., Ltd.

Sumitomo Chemical Co., Ltd.
Financial Summary
1
Unit; billions of yen
FY2012
3rd Quarter
(year to date)
FY2013
3rd Quarter
(year to date)
Difference Ratio
Net Sales 1,422.3 1,606.3 183.9 12.9%
Operating Income 36.8 71.2 34.4 93.4%
(Equity in earnings of affiliates,
included in ordinary income)(6.0) (-0.4) (-6.4) -
(Net gain on foreign currency transactions,
included in ordinary income)(1.7) (6.2) (4.4) 259.0%
Ordinary Income 37.6 72.6 35.0 93.2%
(Extraordinary Gain / Loss) (-7.9) (-9.6) (-1.6) -
(Income taxes) (-58.3) (-23.6) (34.7) -
(Minority interests in income) (-12.1) (-14.9) (-2.9) -
Net Income -40.7 24.6 65.2 -
ROE -8.8% 4.4%
Exchange Rate (yen/USD) 79.95 99.36
Naphtha Price (yen/KL) 55,400 65,600

Sumitomo Chemical Co., Ltd.
Net Sales by Business Segments
2
Unit; billions of yen
FY2012
3rd Quarter
(year to date)
FY2013
3rd Quarter
(year to date)
Difference Ratio
Sales
Price
Variance
Shipping
Volume
Variance
Foreign
Currency
Conversion
Variance
Basic Chemicals 193.7 205.2 11.5 6.0% 14.0 -11.7 9.2
Petrochemicals 505.5 571.4 65.9 13.0% 46.5 -35.0 54.4
IT-related Chemicals 221.3 273.5 52.2 23.6% -26.5 21.3 57.5
Health & Crop Sciences 170.2 207.2 36.9 21.7% -2.5 17.4 22.0
Pharmaceuticals 292.4 307.9 15.5 5.3% 0 -7.7 23.2
Others & Adjustments 39.2 41.0 1.8 4.6% 0 1.8 0
Total 1,422.3 1,606.3 183.9 12.9% 31.5 -13.9 166.3
Overseas Operations 756.2 922.0 165.9 21.9%
Overseas Ratio 53.2% 57.4%

Sumitomo Chemical Co., Ltd.
Operating Income by Business Segments
3
Unit; billions of yen
FY2012
3rd Quarter
(year to date)
FY2013
3rd Quarter
(year to date)
Basic Chemicals -4.8 -7.5 -2.7 0 0 -2.7 -2.7
Petrochemicals -1.7 5.4 7.1 6.5 3.0 -2.4 7.1
IT-related Chemicals 7.2 29.2 22.0 -17.0 16.0 23.0 22.0
Health & Crop Sciences 8.9 14.7 5.7 -6.0 -3.5 15.2 5.7
Pharmaceuticals 37.3 39.2 2.0 0 7.5 -5.5 2.0
Others & Adjustments -10.2 -9.8 0.4 0 0 0.4 0.4
Total 36.8 71.2 34.4 -16.5 23.0 27.9 34.4
Total
Operating Income
DifferencePrice
Variance
Cost
Variance
Shipping
Volume
Variance
and Other

Sumitomo Chemical Co., Ltd.
Extraordinary Gains / Losses
4
Unit; billions of yen
FY2012
3rd Quarter
(year to date)
FY2013
3rd Quarter
(year to date)
Difference
- 3.3 3.3
- 2.1 2.1
- 1.7 1.7
- 1.1 1.1
1.5 - -1.5
Extraordinary Gains 1.5 8.1 6.6
6.5 9.0 2.6
3.0 7.7 4.7
Loss on valuation of investment securities - 1.0 1.0
Extraordinary Losses 9.4 17.7 8.2
Extraordinary Gains / Losses -7.9 -9.6 -1.6
Gain on sale of investment securities
Gain on negative goodwill
Gain on sale of property, plant and equipment
Fair value adjustment of contingent consideration
Restructuring charges
Impairment loss
Gain on step acquisitions

Sumitomo Chemical Co., Ltd.
Consolidated Balance Sheets
5
Unit; billions of yen
31-Mar-13 31-Dec-13 Difference 31-Mar-13 31-Dec-13 Difference
Current Assets 1,108.8 1,259.8 151.0 Liabilities 1,724.6 1,909.7 185.1
Cash and cash equivalents 126.9 162.7 35.8Trade notes and accounts
payable256.1 281.3 25.1
Trade notes and accounts
receivable404.3 411.3 6.9 Interest-bearing liabilities 1,060.6 1,195.6 135.1
Inventories 410.5 453.2 42.7 Others 407.9 432.8 24.9
Others 167.1 232.6 65.6 Net Assets 747.5 914.2 166.7
Non-current Assets 1,363.3 1,564.1 200.8 Shareholders' equity 524.5 536.8 12.3
Property, plant and equipment 640.2 750.1 109.9Accumulated other
comprehensive income-28.0 85.8 113.9
Intangible assets 185.1 199.4 14.3 Minority interests 251.0 291.5 40.5
Investment and other assets 537.9 614.5 76.6
Total 2,472.1 2,823.9 351.8 Total 2,472.1 2,823.9 351.8
Shareholders' equity ratio 20.1% 22.1% 2.0%

Sumitomo Chemical Co., Ltd.
Consolidated Statements of Cash Flows
6
Unit; billions of yen
FY2012
3rd Quarter
(year to date)
FY2013
3rd Quarter
(year to date)
Difference
Cash flows from operating activities 70.0 94.0 23.9
Cash flows from investing activities -138.1 -124.4 13.7
Free cash flows -68.1 -30.4 37.7
Cash flows from financing activities 42.8 57.3 14.5
-0.4 18.3 18.7
-25.7 45.2 70.9
122.5 162.7 40.2
Effect of exchange rate changes on cash and
cash equivalents
Net change in cash and cash equivalents
Cash and cash equivalents
(as of December 31)

Sumitomo Chemical Co., Ltd.
Major Subsidiaries
7
FY2012
3rd Quarter
(year to date)
FY2013
3rd Quarter
(year to date)
The Polyolefin Company
(Singapore)
(millions of USD)
Petrochemical Corporation of
Singapore
(millions of USD)
Rabigh Refining and Petrochemical
Company
(millions of SAR)
Dongwoo Fine-Chem
(billions of KRW)
Valent U.S.A. and Subsidiaries
(millions of USD)
1,737 1,577Increased due to higher sales volume
and other factors
408 541Increased due to higher sales volume
and other factors
2,605 2,637 Improved due to better margins
46,345 36,925
Decreased due to low capacity
utilization as a result of the blackout
incident and other factors
Company
Net Sales
Profit Trends
1,006 998 Improved due to better margins

Sumitomo Chemical Co., Ltd.
(Reference : Segment Information)
8

Sumitomo Chemical Co., Ltd.
Net Sales by Business Segments (Quarterly)
9
Unit; billions of yen
1Q 2Q 3Q 4Q 1Q 2Q 3Q 1st Half2nd Half
(estimated)
Basic Chemicals 66.6 66.3 60.8 69.8 66.8 70.1 68.3 136.9 143.1
Petrochemicals 177.5 165.7 162.3 188.3 177.4 191.5 202.5 368.9 421.1
IT-related Chemicals 70.3 73.8 77.2 78.7 86.1 95.7 91.7 181.8 198.2
Health & Crop
Sciences67.2 52.6 50.5 92.3 76.0 63.5 67.7 139.5 180.5
Pharmaceuticals 96.8 97.4 98.2 86.2 97.6 99.6 110.7 197.2 212.8
Others & Adjustments 11.7 15.6 11.9 14.8 11.7 14.8 14.5 26.4 23.6
Total 490.0 471.4 460.9 530.2 515.5 535.3 555.4 1,050.8 1,179.2
FY2012 FY2013FY2013
(estimated)
Sumitomo Chemical Co., Ltd.
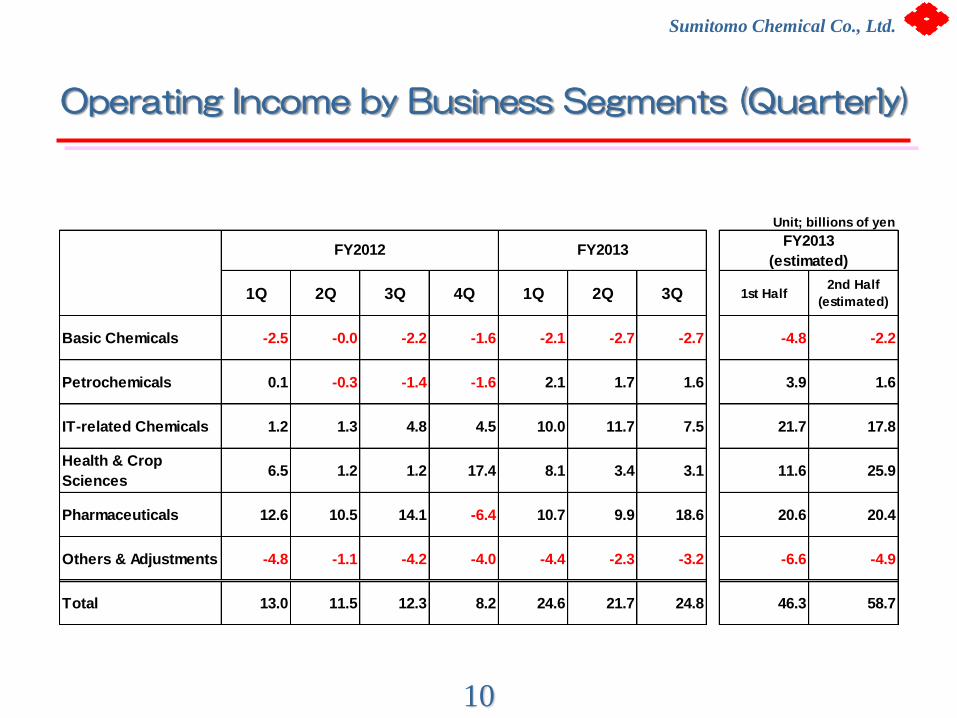
Operating Income by Business Segments (Quarterly)
10
Unit; billions of yen
1Q 2Q 3Q 4Q 1Q 2Q 3Q 1st Half2nd Half
(estimated)
Basic Chemicals -2.5 -0.0 -2.2 -1.6 -2.1 -2.7 -2.7 -4.8 -2.2
Petrochemicals 0.1 -0.3 -1.4 -1.6 2.1 1.7 1.6 3.9 1.6
IT-related Chemicals 1.2 1.3 4.8 4.5 10.0 11.7 7.5 21.7 17.8
Health & Crop
Sciences6.5 1.2 1.2 17.4 8.1 3.4 3.1 11.6 25.9
Pharmaceuticals 12.6 10.5 14.1 -6.4 10.7 9.9 18.6 20.6 20.4
Others & Adjustments -4.8 -1.1 -4.2 -4.0 -4.4 -2.3 -3.2 -6.6 -4.9
Total 13.0 11.5 12.3 8.2 24.6 21.7 24.8 46.3 58.7
FY2012FY2013
(estimated)FY2013


![First Quarter of Fiscal 2013 Earnings Review › enjapanhp › ... · First Quarter of Fiscal 2013 Earnings Review August 9,2012 en-japan Inc. ... [1Q FY2013 Results] Consolidated](https://static.fdocuments.in/doc/165x107/5f0d89a17e708231d43ada50/first-quarter-of-fiscal-2013-earnings-review-a-enjapanhp-a-first-quarter.jpg)