Student Achievement Snapshot November 2012 Rich Pepe – Director of C&I Freehold Borough School...
13
Student Achievement Snapshot November 2012 Rich Pepe – Director of C&I Freehold Borough School District
-
Upload
byron-paul -
Category
Documents
-
view
214 -
download
0
Transcript of Student Achievement Snapshot November 2012 Rich Pepe – Director of C&I Freehold Borough School...

Student Achievement Snapshot
November 2012
Rich Pepe – Director of C&IFreehold Borough School District

A New Approach to ReviewingStudent Achievement Data• ESEA Waiver => No more…
– AYP– SINI / DINI
• Annual Progress Targets– FLC: Met!– PAE: Met!– FIS: Met!
• Student Growth Percentiles– Student SGP– Teacher SGP– School SGP


Step 5: 95% Confidence Interval
A confidence interval (CI) is a statistical method to minimize the risk of falsely identifying any marginal school as not meeting the Progress Target, a confidence interval at 95% probability is applied to the actual results for the total population as well as each student subgroup for each content area as an additional criteria in meeting Progress Targets.
To calculate a confidence interval using actual test results for the total and each subgroup, perform the following computations:1. Calculate the Percent Proficient (p).2. Calculate CI. The factor for 95% confidence (Z 95) is 1.96. 3. Find the Upper Limit of Confidence = p plus CI.4. Compare the Upper Limit of Confidence to the Yearly Target.
a. If the Upper Limit of Confidence equals or exceeds the Yearly Target, Progress Target is met.
b. If the Upper Limit of Confidence is less than the Yearly Target, Progress Target is not met.
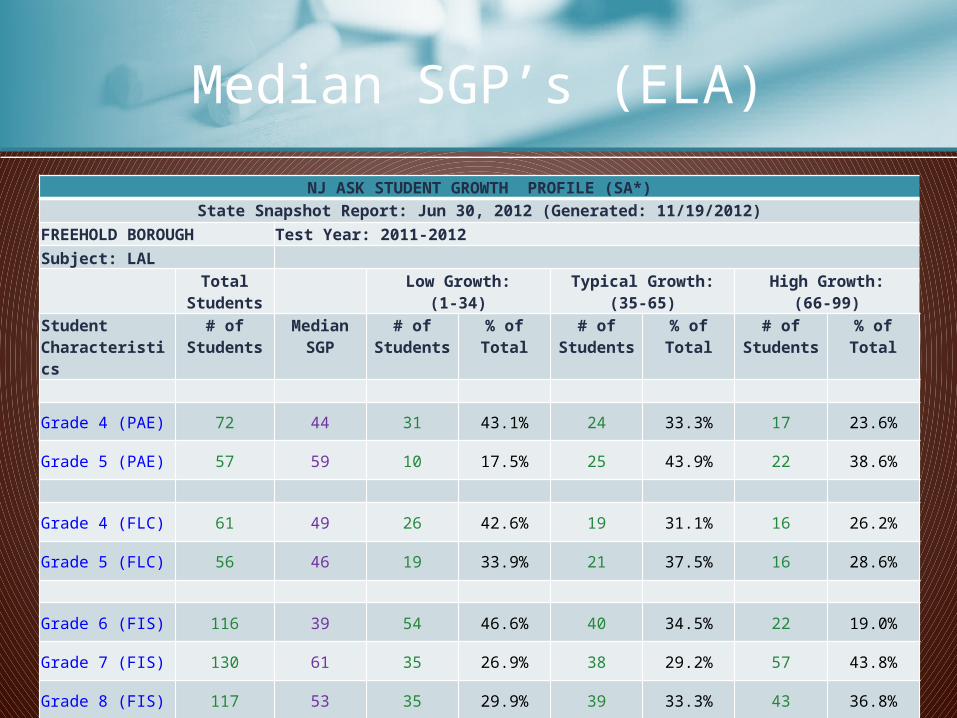
NJ ASK STUDENT GROWTH PROFILE (SA*)State Snapshot Report: Jun 30, 2012 (Generated: 11/19/2012)
FREEHOLD BOROUGH Test Year: 2011-2012
Subject: LAL
Total Students
Low Growth:(1-34)
Typical Growth:(35-65)
High Growth:(66-99)
Student Characteristics
# of Students
Median SGP
# of Students
% of Total # of Students
% of Total # of Students
% of Total
Grade 4 (PAE) 72 44 31 43.1% 24 33.3% 17 23.6%
Grade 5 (PAE) 57 59 10 17.5% 25 43.9% 22 38.6%
Grade 4 (FLC) 61 49 26 42.6% 19 31.1% 16 26.2%
Grade 5 (FLC) 56 46 19 33.9% 21 37.5% 16 28.6%
Grade 6 (FIS) 116 39 54 46.6% 40 34.5% 22 19.0%
Grade 7 (FIS) 130 61 35 26.9% 38 29.2% 57 43.8%
Grade 8 (FIS) 117 53 35 29.9% 39 33.3% 43 36.8%
Median SGP’s (ELA)

NJ ASK STUDENT GROWTH PROFILE (SA*)State Snapshot Report: Jun 30, 2012 (Generated: 11/19/2012)
FREEHOLD BOROUGH Test Year: 2011-2012
Subject: LAL
Total Students
Low Growth:(1-34)
Typical Growth:(35-65)
High Growth:(66-99)
Student Characteristics
# of Students
Median SGP
# of Students
% of Total # of Students
% of Total # of Students
% of Total
Grade 4 (PAE) 72 22 46 63.9% 16 22.2% 10 13.9%
Grade 5 (PAE) 57 55 17 29.8% 19 33.3% 21 36.8%
Grade 4 (FLC) 61 42 25 41.0% 20 32.8% 16 26.2%
Grade 5 (FLC) 56 60 12 21.4% 19 33.9% 25 44.6%
Grade 6 (FIS) 116 38 47 40.5% 45 38.8% 24 20.7%
Grade 7 (FIS) 130 57 35 26.9% 41 31.5% 54 41.5%
Grade 8 (FIS) 117 38 44 37.6% 51 43.6% 22 18.8%
Median SGP’s (Math)

Focus School
• 3 Categories– Low Graduation Rate– Largest Within-School Gaps (>43.5%)– Lowest Subgroup Performance (<29.2% Tot
Prof)
• FIS => Within-School Gap (46.0%)– School Improvement Plan– Regional Achievement Center (RAC)
Partnership

PROGRESS & GROWTH
The New Vision for Achievement Data
Review