STRICTLY PRIVATE AND...
30
RHT STRICTLY PRIVATE AND CONFIDENTIAL
Transcript of STRICTLY PRIVATE AND...
RHT STRICTLY PRIVATE AND CONFIDENTIAL
This presentation is focused on comparing actual results from the period from 1 April 2014 to 31 March 2015 (“FY15”). Other than the comparative
figures presented, no other comparative figures will be presented as the acquisition of the Portfolio of RHT as well as listing on the Singapore Stock
Exchange was completed on 19 October 2012.
This presentation may contain forward-looking statements that involve risks and uncertainties. Actual future performance, outcomes and results
may differ materially from those expressed in forward-looking statements as a result of a number of risks, uncertainties and assumptions.
Representative examples of these factors include (without limitation) general industry and economic conditions, interest rate trends, cost of capital
and capital availability, competition from other developments or companies, shifts in expected levels of income and occupancy rate, changes in
operating expenses (including employee wages, benefits and training), governmental and public policy changes and the continued availability of
financing in the amounts and the terms necessary to support future business. Investors are cautioned not to place undue reliance on these forward-
looking statements. For further information, please also refer to RHT’s press release which is released in conjunction with this set of presentation.
The Indian Rupee and Singapore Dollar are defined herein as “₹” and “S$” respectively. Any discrepancy between individual amounts and total
shown in this presentation is due to rounding.
Disclaimer
2
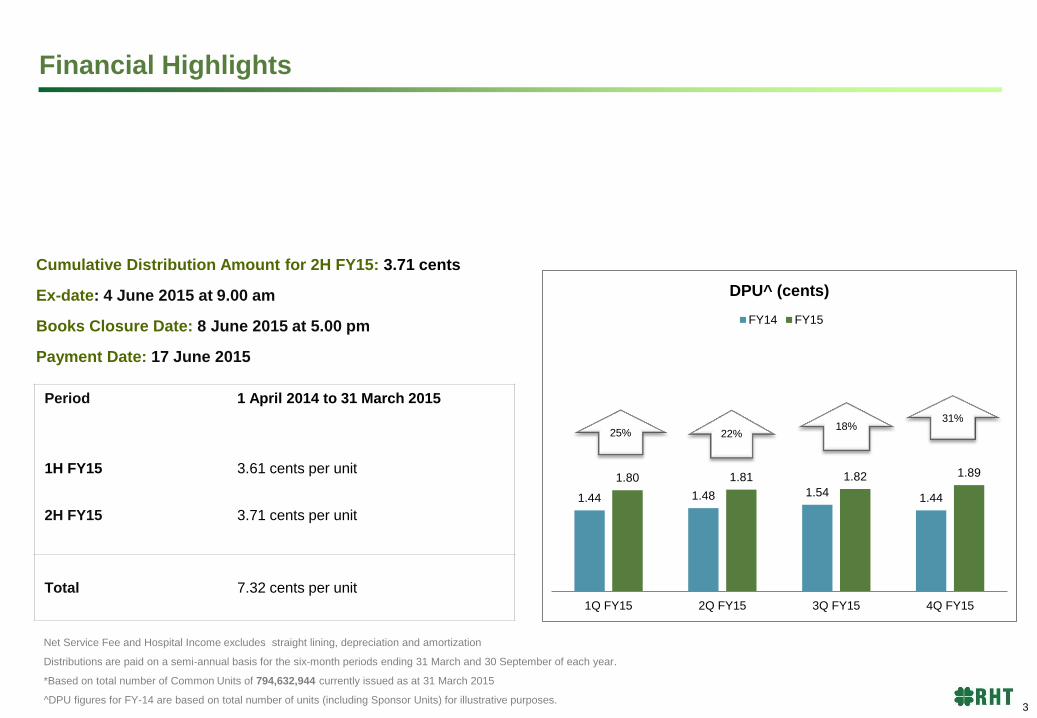
Financial Highlights
Net Service Fee and Hospital Income excludes straight lining, depreciation and amortization
Distributions are paid on a semi-annual basis for the six-month periods ending 31 March and 30 September of each year.
*Based on total number of Common Units of 794,632,944 currently issued as at 31 March 2015
^DPU figures for FY-14 are based on total number of units (including Sponsor Units) for illustrative purposes.
1.44 1.48 1.54 1.44
1.80 1.81 1.82 1.89
1Q FY15 2Q FY15 3Q FY15 4Q FY15
DPU^ (cents)
FY14 FY15
22% 25% 18%
31%
3
Period 1 April 2014 to 31 March 2015
1H FY15 3.61 cents per unit
2H FY15 3.71 cents per unit
Total 7.32 cents per unit
Cumulative Distribution Amount for 2H FY15: 3.71 cents Ex-date: 4 June 2015 at 9.00 am Books Closure Date: 8 June 2015 at 5.00 pm Payment Date: 17 June 2015
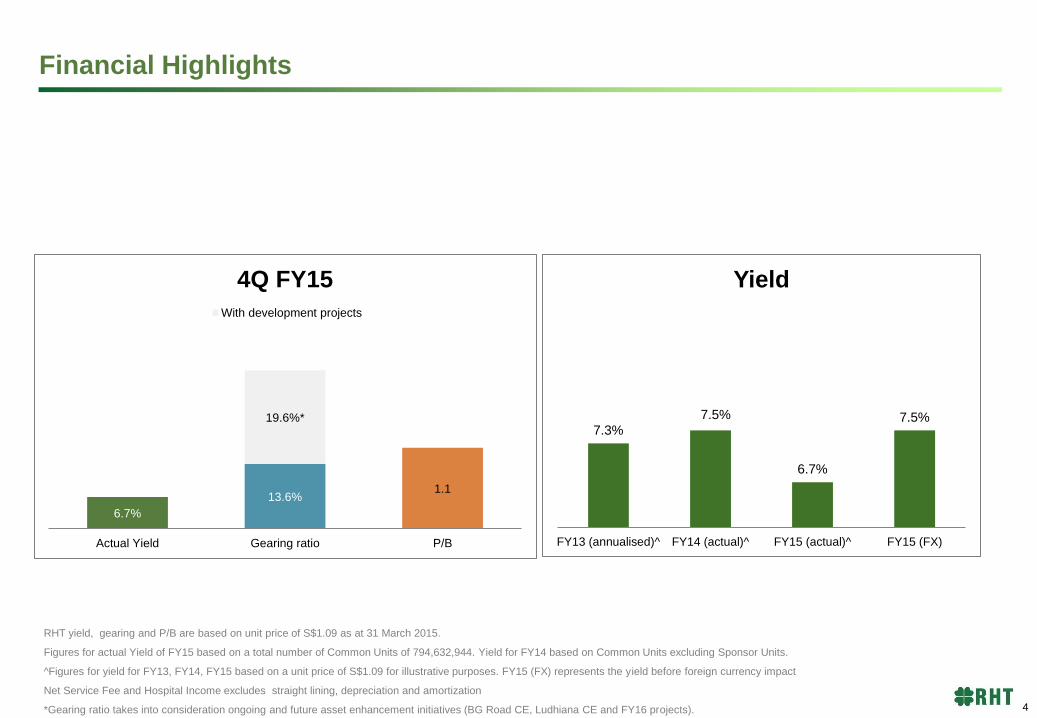
Financial Highlights
RHT yield, gearing and P/B are based on unit price of S$1.09 as at 31 March 2015.
Figures for actual Yield of FY15 based on a total number of Common Units of 794,632,944. Yield for FY14 based on Common Units excluding Sponsor Units.
^Figures for yield for FY13, FY14, FY15 based on a unit price of S$1.09 for illustrative purposes. FY15 (FX) represents the yield before foreign currency impact
Net Service Fee and Hospital Income excludes straight lining, depreciation and amortization
*Gearing ratio takes into consideration ongoing and future asset enhancement initiatives (BG Road CE, Ludhiana CE and FY16 projects).
7.3%
7.5%
6.7%
7.5%
FY13 (annualised)^ FY14 (actual)^ FY15 (actual)^ FY15 (FX)
Yield
4
6.7%
13.6% 1.1
19.6%*
Actual Yield Gearing ratio P/B
4Q FY15
With development projects
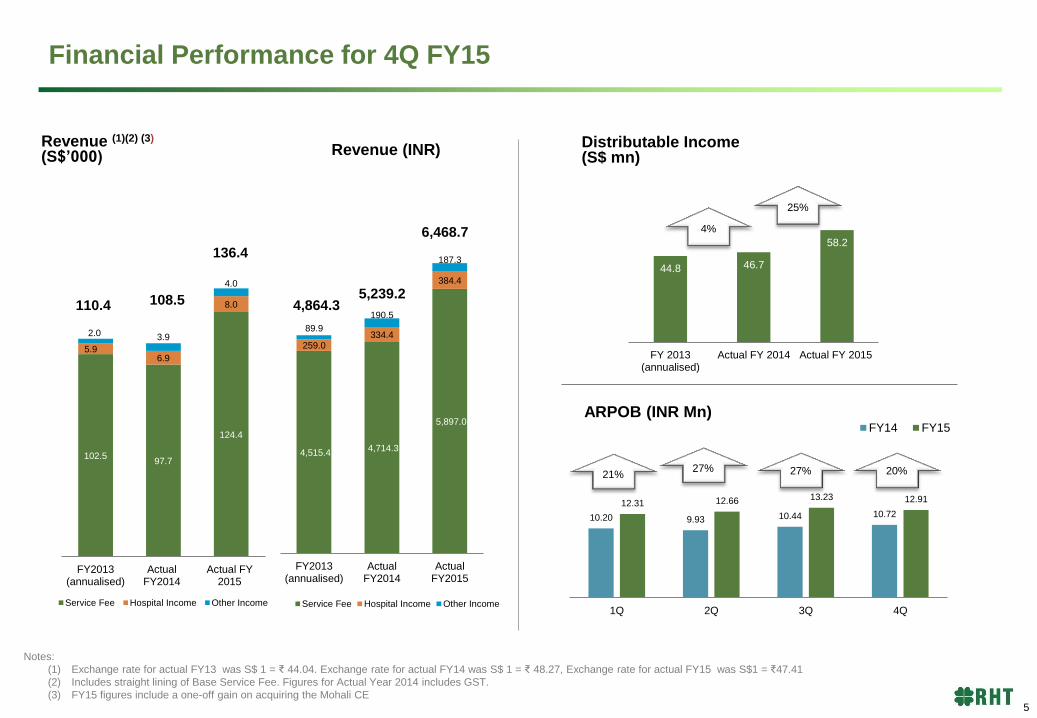
Notes:
(1) Exchange rate for actual FY13 was S$ 1 = ₹ 44.04. Exchange rate for actual FY14 was S$ 1 = ₹ 48.27, Exchange rate for actual FY15 was S$1 = ₹47.41
(2) Includes straight lining of Base Service Fee. Figures for Actual Year 2014 includes GST.
(3) FY15 figures include a one-off gain on acquiring the Mohali CE
Revenue (1)(2) (3) (S$’000)
108.5
136.4
Distributable Income
(S$ mn)
102.5 97.7
124.4
2.0
6.9
8.0
3.9
4.0
FY2013(annualised)
ActualFY2014
Actual FY2015
Service Fee Hospital Income Other Income
5.9
110.4
44.8 46.7
58.2
FY 2013(annualised)
Actual FY 2014 Actual FY 2015
25%
4%
ARPOB (INR Mn)
10.20 9.93 10.44 10.72 12.31 12.66 13.23 12.91
1Q 2Q 3Q 4Q
FY14 FY15
21% 27% 20%
Financial Performance for 4Q FY15
27%
4,515.4 4,714.3
5,897.0
259.0 334.4
384.4
89.9
190.5
187.3
FY2013(annualised)
ActualFY2014
ActualFY2015
Revenue (INR)
Service Fee Hospital Income Other Income
4,864.3 5,239.2
6,468.7
5

Portfolio

RHT– 18 Quality Assets Spread Across India
: RHT Clinical Establishments : Greenfield Clinical Establishments : Operating Hospitals
RHT Portfolio Summary:
Portfolio valued at S$991m(3)
12 RHT Clinical Establishments
4 Greenfield Clinical Establishments
2 Operating Hospitals managed and operated by RHT
Premier Locations Across India:
Approximately 3.6 million sq ft of built-up area across 10 states
Sizeable population catchment
Located near to major transportation nodes
RHT:
Investment mandate to invest in medical and healthcare assets and services in Asia, Australasia and other emerging markets
A healthcare-related business trust listed on the SGX (current market cap of S$866.2 m(1))
Partnership with Fortis Healthcare Limited, the leading healthcare delivery services provider in India
400 Potential Bed Capacity
Amritsar
153 Operational Beds 166 Installed Bed Capacity
Ludhiana
79 Potential Bed Capacity
Jaipur
235 Operational Beds 320 Installed Bed Capacity
Faridabad
203 Operational Beds 210 Installed Bed Capacity
Mumbai (Mulund)
259 Operational Beds 567 Installed Bed Capacity
Mumbai (Kalyan)
49 Operational Beds 52 Installed Capacity
255 Operational Beds 255 Installed Bed Capacity
Bengaluru (BG Road) Bengaluru (Nagarbhavi)
45 Operational Beds 62 Installed Bed Capacity
Bengaluru (Rajajinagar)
45 Operational Beds 52 Installed Bed Capacity
Chennai (Malar)
Chennai
167 Operational Beds 178 Installed Bed Capacity
45 Potential Bed Capacity
Hyderabad
Kolkata (Anandapur)
184 Operational Beds 373 Installed Bed Capacity
Noida
191 Operational Beds 200 Installed Bed Capacity
Greater Noida
350 Potential Bed Capacity
Mohali
344 Operational Beds 355 Installed Bed Capacity
National Capital Region
274 Operational Bed Capacity 450 Installed Bed Capacity
Gurgaon
200 Operational Beds 350 Installed Bed Capacity
Delhi (Shalimar Bagh)
Note: (1) As at 31 March 2015 (2) No. of beds and installed capacities as of 31 March 2015. Potential bed capacity assumes all planned phases of development and construction are completed in respect of the Greenfield Clinical
Establishments (3) Based on S$1 = INR 45.43 as at 31 March 2015. The appraised value of each of the portfolio assets by the independent valuer is as at 31 March 2015.
7

Current Portfolio for Quarter and Full Year ended 31 March 2015
Hospitals Current Operational Bed Capacity Current Installed Bed Capacity
Amritsar 153 166
Anandapur, Kolkata 184 373
BG Road, Bengaluru 255 255
Gurgaon 274 450
Faridabad 203 210
Jaipur 235 320
Kalyan, Mumbai 49 52
Malar, Chennai 167 178
Mohali 344 355
Mulund, Mumbai 259 567
Nagarbhavi, Bengaluru 45 62
Noida 191 200
Rajajinagar, Bengaluru 48 52
Shalimar Bagh, New Delhi 200 350
Total 2,607 3,590
8
Information updated as of 31 March 2015

3%
68%
29%
Solid Portfolio Characteristics Stability from Substantial Base Fee Component
Strong Growth from Capacity Expansion with Minimal Capex Potential to Provide Higher-End and More Advanced Services
Fee structure offers RHT ideal combination of guaranteed, stable cash-flows with opportunity to participate in operational growth of its healthcare assets
Income-generating Assets Account for Vast Majority of Portfolio
Substantial Portion of Portfolio Comprise Long Term Lease / Freehold Land
Portfolio Valuation Breakdown (FY-15)(1)
Variable Service Fee • 7.5% of Fortis
Operating Companies’ Operating Income
Base Service Fee(3)
• Fixed at the start with a 3.0% p.a. escalation
• Revised upwards for any capex / expansion
Service Fee Components - Base and Variable(INRm)(2)
Number of Beds(4)
Note: (1) Weighted by portfolio valuation. Asset are independently valued by the Independent Valuer in INR as at 31 Mar 2015 (2) Financials converted at S$1 = INR43.75 for FY-13, S$1 = INR48.27 for FY-14, S$1 = INR47.41 for FY-15 (3) Base Service fee excludes accounting straight lining and includes Technological Renewal Fee and are on a full year basis. (4) Current Operational Beds include those of Mohali Clinical Establishment. Installed capacity refers to the maximum number of beds that can be operated at each hospital without further
expansion. Potential capacity refers to the maximum number of beds that can operate at each hospital when all stages of development are completed. (5) Includes Secondary/Tertiary Services.
Note: FY-13 fees are annualised. Decline in Base Service Fee in FY-14 is due to depreciation of INR against SGD
Portfolio Valuation % (FY-15)(1)
Quaternary Quaternary
Tertiary(5)
S$m 64.8 62.1 82.8
S$m 21.1 22.1 36.1
Stable Portfolio Providing Upside Exposure
Secondary
9
2,607 3,590 4,464
2,000
2,500
3,000
3,500
4,000
4,500
5,000
Operational Bed Capacity Installed Bed Capacity Potential Bed Capacity
874
983
Operating Hospitals
1.1%
RHT Clinical
Establishments
95.5%
Greenfield Clinical
Establishments
3.4%
Freehold 75.0%
<50 years Remaining
Lease Life
1.7% ≥ 50 years
Remaining
Lease Life
23.3%
69%
28%
2,835 2,998 3,931
923 1,067
1,712
-
1,000
2,000
3,000
4,000
5,000
6,000
FY-13 FY-14 FY-15
4,064
5,643 8.1%
38.9%
3,758
The Gurgaon CE and Shalimar Bagh CE owned by FHTL 49% with 51% owned by FHML. Currently, RHT has the 100% economic interest.

Asset Enhancement Initiatives for 4Q FY15
Cost converted at an exchange rate of S$1 = ₹45.52.
Information updated as of 31 March 2015
Location Type Cost
Noida Refurbishment works done in Dialysis, Triage,
Observation areas.
S$0.4 million
(INR 1.8 million)
Mulund Creation of ‘Patient’s Attendants Room’ for Day Care
and OPD patients.
S$0.2 million
(INR 0.9 million)
Malar Refurbishment works done for operation theatres and
hospital blocks.
S$0.3 million
(INR 12.3 million)
Gurgaon Creation of Liver Transplant Unit. S$0.14 million
(INR 6.5 million)
10

Development Project Status – BG Road and Ludhiana
Estimated Time
of Completion
4Q 2016
No. of Beds
Planned
200
Specialties Oncology, OT
Estimated Cost S$28.5 million
Estimated Time of
Completion
4Q 2016
No. of Beds
Planned
79
Specialties Obstetrics & Gynecology, IVF
services, Cosmetology,
Neonatology, Health Checks
Estimated Cost S$19.7 million
Cost converted at an exchange rate of S$1 = ₹45.52
11
BG Road
Ludhiana

Capacity Enhancement Initiatives for FY16
Location Rationale Proposed date of
commencement
Proposed period of
completion
No. of beds to
be added
Civil Cost
Noida Addition of Maternal and Child
Health (“MCH”) program
Q1 FY16
(Jun 2015)
Q1 FY17
(Apr 2016)
40 S$2.6 million
(INR 117.9 million)
Mulund Addition of beds would cater to
increasing MCH demands and
address the high occupancy
Q1 FY16
(Jun 2015)
Q4 FY16
(Mar 2016)
50 S$0.9 million
(INR 42.0 million)
Jaipur Addition of beds would cater to
the high demand for MCH and
Orthopedics programs
Q1 FY16
(Jun 2015)
Q4 FY16
(Feb 2016)
40 S$0.5 million
(INR 21.0 million)
Amritsar Addition of beds would address
the high demand and occupancy
the CE faces and boost ARPOB
Q2 FY16
(Sep 2015)
Q4 FY17
(Mar 2017)
102 S$8.3 million
(INR 378 .0 million)
Shalimar
Bagh
Addition of oncology program
Q1 FY16
(Jun 2015)
Q1 FY17
(Jun 2016)
- S$1.3 million
(INR 57.8 million)
Nagarbhavi CE expansion would see addition
of 2 operating theatres and a cath
lab
Q1 FY16
(May 2015)
Q4 FY16
(Feb 2016)
60 S$4.4 million
(INR 200.0 million)
12
Cost converted at an exchange rate of S$1 = ₹45.52.
Information updated as of 31 March 2015
Financials

Financial Highlights
Gross Revenue(1)(2) Operating Income and Margin(1)(2)
EBITDA and EBITDA Margin(1)(2) Total Assets(6)
Strong growth in revenue, income, and EBITDA witnessed in recent years
(INRm) Operating
Income (INR m)(4) Operating Margin (%)
EBITDA (INRm)(5)
(INRm)
Note:
(1) S$1 = INR for FY-13, FY-14 and FY-15 are 44.04, 48.27 and 47.41 respectively.
(2) Excludes non-recurring items
(3) Annualised as IPO was in October of FY-13
(4) Operating Income is defined as Total Revenue minus Total Service and Hospital Expenses
(5) EBITDA is defined as Total Revenue minus Total Expenses, adding back Depreciation and Amortisation and Finance Expense
(6) S$1 = INR for FY-13, FY-14, FY-15 are 43.75, 47.73 and 45.43 respectively
Note: Decline in total assets for FY-14 (in SGD terms) due to depreciation of INR against SGD
(2)
(2)
(3)
4,515 4,714 5,897
259 334
384 90 113
168
FY-13 FY-14 FY-15
Service Fee Hospital Income Other Income
5,161 6,449
S$m 110.5 106.9 136.04
4,864
958.4 962.9 86.9 72.9
2,504 3,052
83.8 65.6
2,231
14
2,888 3,046 3,936
59.4
59.0
61.0
58
58.5
59
59.5
60
60.5
61
61.5
-
500
1,000
1,500
2,000
2,500
3,000
3,500
4,000
4,500
FY-13 FY-14 FY-15
Operating Income (INR m) Operating Margin (%)
S$m 63.1
3,209 3,360 4,120
66.0 65.1 63.9
0.0
10.0
20.0
30.0
40.0
50.0
60.0
70.0
-
500
1,000
1,500
2,000
2,500
3,000
3,500
4,000
4,500
5,000
FY-13 FY-14 FY-15
EBITDA (INR m) EBITDA Margin (%)
S$m 69.6
42,127 45,743 51,054
-
10,000
20,000
30,000
40,000
50,000
60,000
FY-13 FY-14 FY-15
1,123.8 S$m

Review of 4Q FY15 Performance
Exchange rate for actual 3Q FY15 was S$ 1 = ₹ 47.74, Exchange rate for actual 4Q FY14 was S$1 = ₹48.53. Exchange rate for actual 4Q FY15 was S$1 = ₹45.52.
^Excludes straight lining
Actual 4Q FY14 against 4Q FY15
(y-o-y)
Actual 4Q
FY14
Actual 4Q
FY15 Variance Actual 4Q FY14
Actual 4Q
FY15 Variance
S$’000 S$’000 % INR’000 INR’000 %
Total Revenue^ 23,468 34,803 48.3 1,138,883 1,589,541 39.6
Net Service and Hospital Income 15,937 24,097 51.2 773,293 1,099,834 42.2
Distributable Income 11,413 15,056 31.9 - - -
Actual 3Q FY15 against 4Q FY15
(q-o-q)
Actual 3Q
FY15
Actual 4Q
FY15 Variance Actual 3Q FY15
Actual 4Q
FY15 Variance
S$’000 S$’000 % INR’000 INR’000 %
Total Revenue^ 32,726 34,803 6.3 1,562,627 1,589,541 1.7
Net Service and Hospital Income 22,954 24,097 5.0 1,096,692 1,099,834 0.3
Distributable Income 14,435 15,056 4.3 - - -
15
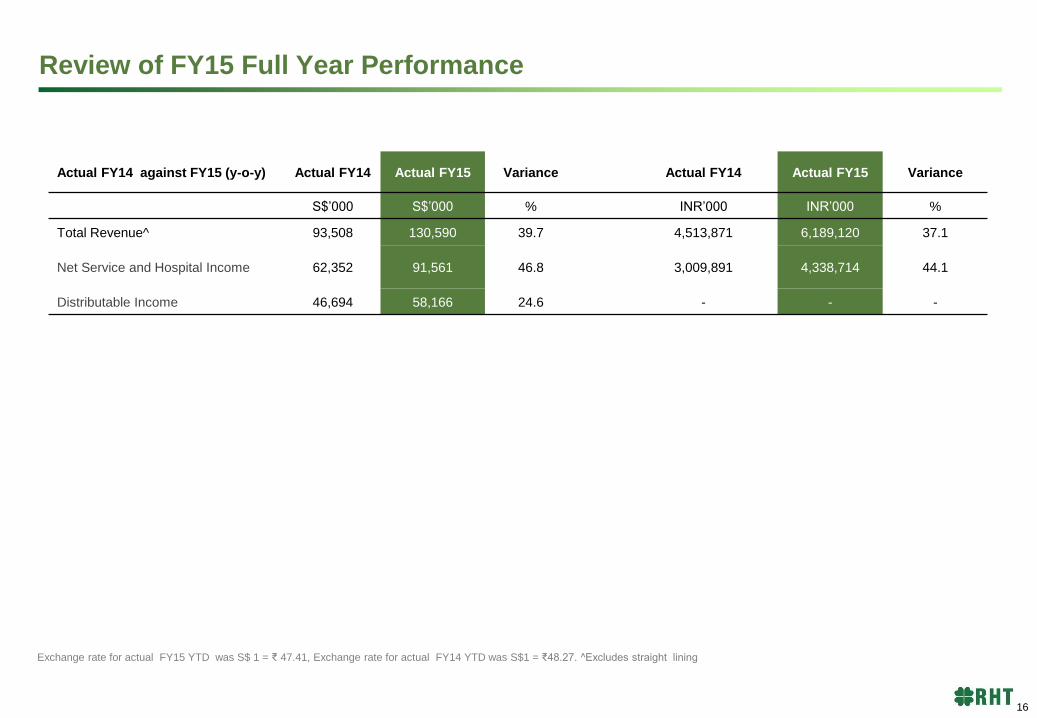
Review of FY15 Full Year Performance
Exchange rate for actual FY15 YTD was S$ 1 = ₹ 47.41, Exchange rate for actual FY14 YTD was S$1 = ₹48.27. ^Excludes straight lining
Actual FY14 against FY15 (y-o-y) Actual FY14 Actual FY15 Variance Actual FY14 Actual FY15 Variance
S$’000 S$’000 % INR’000 INR’000 %
Total Revenue^ 93,508 130,590 39.7 4,513,871 6,189,120 37.1
Net Service and Hospital Income 62,352 91,561 46.8 3,009,891 4,338,714 44.1
Distributable Income 46,694 58,166 24.6 - - -
16

Financial Results for 4Q FY15
Converted at an exchange rate of S$1 = ₹45.52 for 4Q FY15. Exchange rate for actual 4Q FY14 was S$1 = ₹48.53.
*Prior quarter’s amounts have been reclassified to conform to current quarter’s presentation.
For the quarter ended 31 March 2015 4Q FY15
S$ ‘000
4Q FY14
S$ ‘000
Variance
%
Revenue:
Service fee
Hospital income
Other income
32,827
2,248
629
24,374
1,738
1,089
35
29
(42)
Total revenue 35,704 27,201 31
Total service fee and hospital expenses* (13,048) (10,000) 30
Finance income
Finance expenses
Trustee-manager fee
Other trust expenses*
Foreign exchange gain
292
(1,688)
(1,726)
(393)
2,262
178
(630)
(1,386)
(238)
1,361
64
168
25
65
66
Total expenses (14,301) (10,715) 33
Profit before changes in fair value of financial derivatives 21,403 16,486 30
Fair value loss on financial derivatives (5,036) (2,610) 93
Profit before taxes 16,637 13,876 18
Income tax expense (5,936) (2,654) 124
Net profit for the period attributable to unitholders of the Trust 10,431 11,222 (7)
17

Financial Results for 4Q FY15
For the quarter ended 31 March 2015 4Q FY15
S$ ‘000
4Q FY14
S$ ‘000
Reconciliation to Unitholders’ Distribution
Net profit for the period attributable to unitholders of the Trust
Distribution adjustments:
Impact of non-cash straight lining
Technology renewal fee
Depreciation and amortisation
Amortisation of debt arrangement fee
Trustee-manager fees payable in units
Deferred tax
Foreign exchange differences
Capital expenditure
Transaction cost capital in nature
Unrealised gain on financial asset
10,431
(1,399)
(181)
2,274
150
805
2,716
212
(273)
567
(246)
11,222
(3,377)
(156)
2,470
159
693
(304)
1,423
(717)
-
-
Total distributable income attributable to unitholders of the Trust 15,056 11,413
18
Converted at an exchange rate of S$1 = ₹45.52 for 4Q FY15. Exchange rate for actual 4Q FY14 was S$1 = ₹48.53.
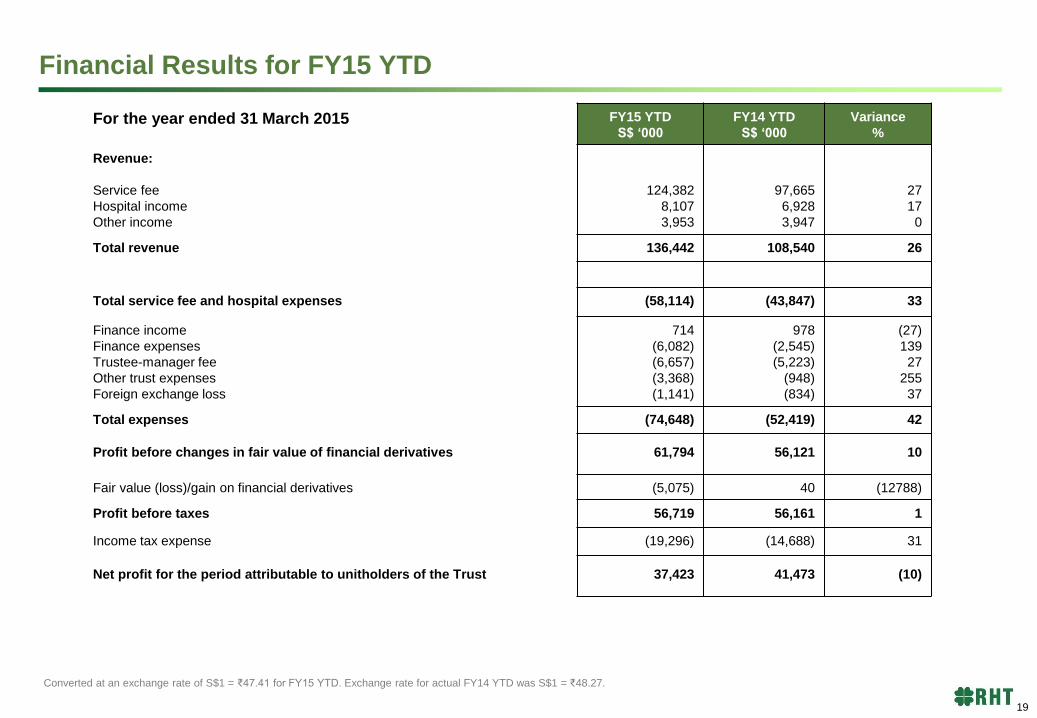
Financial Results for FY15 YTD
Converted at an exchange rate of S$1 = ₹47.41 for FY15 YTD. Exchange rate for actual FY14 YTD was S$1 = ₹48.27.
For the year ended 31 March 2015 FY15 YTD
S$ ‘000
FY14 YTD
S$ ‘000
Variance
%
Revenue:
Service fee
Hospital income
Other income
124,382
8,107
3,953
97,665
6,928
3,947
27
17
0
Total revenue 136,442 108,540 26
Total service fee and hospital expenses (58,114) (43,847) 33
Finance income
Finance expenses
Trustee-manager fee
Other trust expenses
Foreign exchange loss
714
(6,082)
(6,657)
(3,368)
(1,141)
978
(2,545)
(5,223)
(948)
(834)
(27)
139
27
255
37
Total expenses (74,648) (52,419) 42
Profit before changes in fair value of financial derivatives 61,794 56,121 10
Fair value (loss)/gain on financial derivatives (5,075) 40 (12788)
Profit before taxes 56,719 56,161 1
Income tax expense (19,296) (14,688) 31
Net profit for the period attributable to unitholders of the Trust 37,423 41,473 (10)
19
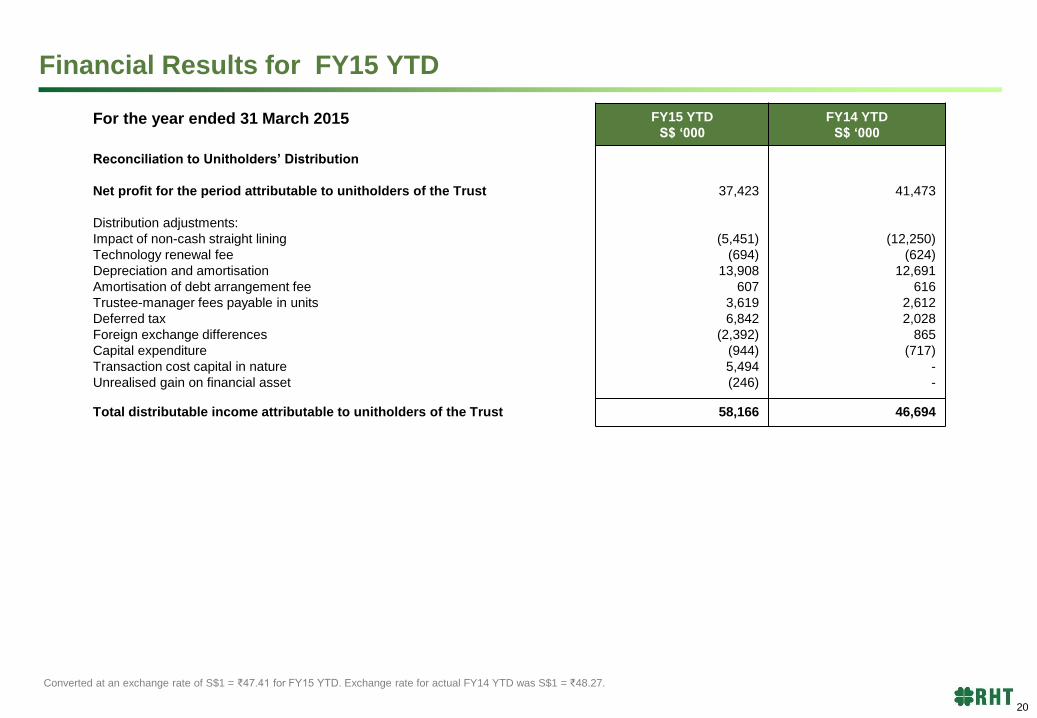
Financial Results for FY15 YTD
For the year ended 31 March 2015 FY15 YTD
S$ ‘000
FY14 YTD
S$ ‘000
Reconciliation to Unitholders’ Distribution
Net profit for the period attributable to unitholders of the Trust
Distribution adjustments:
Impact of non-cash straight lining
Technology renewal fee
Depreciation and amortisation
Amortisation of debt arrangement fee
Trustee-manager fees payable in units
Deferred tax
Foreign exchange differences
Capital expenditure
Transaction cost capital in nature
Unrealised gain on financial asset
37,423
(5,451)
(694)
13,908
607
3,619
6,842
(2,392)
(944)
5,494
(246)
41,473
(12,250)
(624)
12,691
616
2,612
2,028
865
(717)
-
-
Total distributable income attributable to unitholders of the Trust 58,166 46,694
20
Converted at an exchange rate of S$1 = ₹47.41 for FY15 YTD. Exchange rate for actual FY14 YTD was S$1 = ₹48.27.

Balance Sheet
Converted at an exchange rate of S$1 = ₹45.43 for 31 March 2015. Exchange rate for 31 March 2014 was S$1 = ₹47.73.
(S$ ‘000) 31 Mar 15 31 Mar 14
Intangibles
PPE
Other long term assets
Long term liabilities
Net current Assets
Total net assets attributable to unitholders
140,514
823,597
61,398
(196,915)
(59,461)
769,133
135,501
676,070
46,449
(166,121)
13,336
705,235
21

Hedging - Foreign currency exposure
RHT has hedged the following foreign exchange exposures
Contracted rate Settlement
INR 51.38 to SGD 1 Jun-15
INR 50.23 to SGD 1 Dec-15
Particulars
Minimum Hedging (percentage to total exposure)
Indian rupee-denominated cashflows received from India 100% (on one year forward basis)
22

S$ 123.8m(4)
H1-15
Key Credit Ratios and Debt Maturity
Low Gearing with Extremely Conservative Capital Structure Healthy Interest Coverage Ratios(2)
Weighted Average Debt Maturity of 1.4 Years with Generous Debt Headroom
Conservative financial profile with generous debt headroom; INR cash flows from India hedged into S$ on a one year forward basis via forward contracts on a semi-annual basis(1)
(S$m)
Ratio (x)
Total Debt / Total Assets Interest Coverage Ratio (“ICR”) (x)
Debt Maturity Profile(3) (S$m)
Headroom of S$1,038.1 m
60%
35%
13.6%(5)
Debt Headroom (S$m) Gearing (%)
Headroom of S$ 294.5 m
Note:
(1) Average contracted rate of INR52.28 to S$1 for FY-15 and INR 50.23 to S$1 for 1H FY-16
(2) Interest Coverage Ratio is defined as the ratio between EBITDA divided by Financial Expense
(3) As at 31 March 2015, gross of upfront fees.
(4) Defined as Net Debt, being total loans and borrowings less cash and cash equivalents
(5) Gearing is calculated as Net Debt divided by sum of Net Assets and Net Debt
Debt / assets (%)
S$121.88 m (4)
YTD- 15
66.4
61.2
Repayable in ≤ 1 year Repayable >1 year
859.3
998.2
23
30.1x 27.4x
13.5x
0
5
10
15
20
25
30
35
FY-13 FY-14 FY-15
65.3 64.5 126.1
962.9 958.4 1,123.8
6.8 6.7
11.2
0
2
4
6
8
10
12
0
200
400
600
800
1000
1200
1400
FY-13 FY-14 FY-15
Debt Assets Debt/Assets

Appendix

Unit Price Performance Against Peers
For the period 1 April 2014 to 31 March 2015
Source: Miraqle
25
90%
95%
100%
105%
110%
115%
120%
125%
130%
135%
01 Apr 14 08 May 14 13 Jun 14 18 Jul 14 26 Aug 14 30 Sep 14 06 Nov 14 11 Dec 14 19 Jan 15 25 Feb 15
RHT First REIT Plife REIT AIT FTSE-REIT
Name Open Close Change (%)
Religare Health Trust 0.85 1.09 28.24
Ascendas India Trust 0.77 0.90 16.88
Parkway Life REIT 2.43 2.36 (2.88)
First REIT 1.08 1.40 29.63
FTSE REIT 720.18 807.62 12.14

Stable and Efficient Trust Structure
RHT Trust Structure Income Secured through Long Term Work Agreements
Fortis Healthcare (“Sponsor”)
Institutional & Public Investors
Trustee-Manager
Portfolio Assets
18 Assets Across India
Fortis Operating
Companies
28.0% 72.0%
Ownership Distributions
Service Fee
Clinical Establishment
Services
TM Fees
Acts on behalf of unitholders and
provides management
services
Singapore
India
Term of Agreement • 15 years with option to extend by another 15 years by mutual
consent
Primary Obligations
of HSCos
• Making available and maintaining the Clinical Establishments
• Provision of outpatient services
• Provision of radio diagnostic services
Primary Obligations
of FOCs
• Provision of healthcare services at the Clinical Establishments
• Pay to RHT the Services Fees and Commitment Deposits
Services Fee
• Base Service Fee
• Fixed quarterly payments with 3% escalation per annum
• Upward revision for any capital expansion or expansion of the
Fortis Hospital or services provided by the HSCos
• RHT entitled to request for an advance of up to 60% of the Base
Service Fee
• Variable Service Fee
• 7.5% of the operating income of Fortis
• Allows RHT to capture upside exposure
Commitment
Deposit
• FOC to pay HSCo 25% for greenfield development of Fortis
Hospitals as an interest free refundable commitment deposit
RHT’s ROFR over
Fortis’ Assets
• Right of First Refusal (“ROFR”) granted to RHT over Fortis’ medical
and healthcare infrastructure and facilities which fall within the scope
of RHT’s investment mandate
26
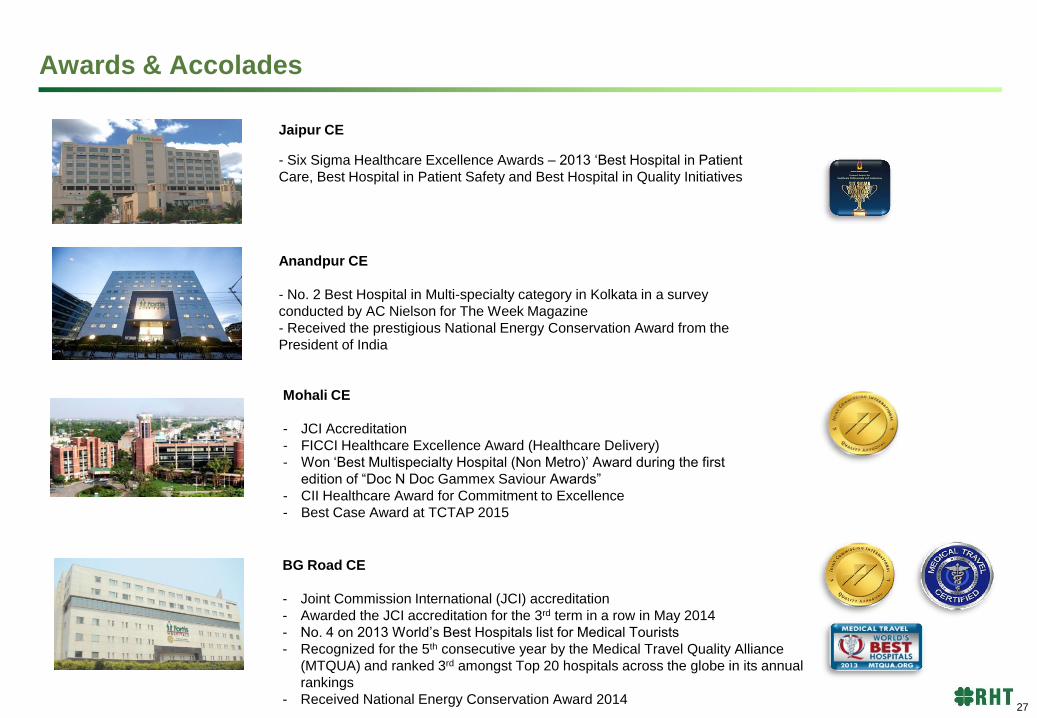
Jaipur CE
- Six Sigma Healthcare Excellence Awards – 2013 ‘Best Hospital in Patient
Care, Best Hospital in Patient Safety and Best Hospital in Quality Initiatives
Anandpur CE
- No. 2 Best Hospital in Multi-specialty category in Kolkata in a survey
conducted by AC Nielson for The Week Magazine
- Received the prestigious National Energy Conservation Award from the
President of India
BG Road CE
- Joint Commission International (JCI) accreditation
- Awarded the JCI accreditation for the 3rd term in a row in May 2014
- No. 4 on 2013 World’s Best Hospitals list for Medical Tourists
- Recognized for the 5th consecutive year by the Medical Travel Quality Alliance
(MTQUA) and ranked 3rd amongst Top 20 hospitals across the globe in its annual
rankings
- Received National Energy Conservation Award 2014
Mohali CE
- JCI Accreditation
- FICCI Healthcare Excellence Award (Healthcare Delivery)
- Won ‘Best Multispecialty Hospital (Non Metro)’ Award during the first
edition of “Doc N Doc Gammex Saviour Awards”
- CII Healthcare Award for Commitment to Excellence
- Best Case Award at TCTAP 2015
Awards & Accolades
27

Mulund CE
- Received JCI Accreditation 4th consecutive time
- Stars of the Industry Healthcare Leadership Award (Patient Safety)
- FICCI Healthcare Award (Operational Excellence)
- FICCI ‘Special Jury Recognition Award’
- Won 3 awards at the prestigious Asian Hospital Management Awards, 2014 in categories
of ‘Human Resources’ and ‘Patient Safety’
- Named ‘Medical Team of the Year’ at the first British Medical Journal Awards (BMJA)
India 2014
Gurgaon CE
- Recognized as a Green Building and received a 4 Star rating by TERI GRIHA
(Green Rating for Integrating Habitat Assessment)
- No. 2 globally on ‘30 Most Technologically Advanced Hospitals in the World’ by
‘topmastersinhealthcare.com’
Shalimar Bagh CE
- Received a 3 Star rating by TERI GRIHA
- 1st Runner-up in FICCI HEAL Award 2014 (Poster Presentation)
- 3 Star rating by the Bureau of Energy Efficiency, Government of India, Ministry of Power
- FICCI HEAL Award 2014 (Excellence in Branding Marketing & Image Building)
- 1st prize in ‘Best Poster Presentation’ at National Conference of Consortium of Accredited
Healthcare Organisations (CAHOCON 2015)
Awards & Accolades
28

Nagarbhavi CE - National Energy Conservation Award
Awards & Accolades
29

For further information please contact:
Tan Suan Hui
Religare Health Trust Trustee Manager Pte. Ltd
80 Raffles Place
#11-20 UOB Plaza 2
Singapore 048624
Email: [email protected]
www.religarehealthtrust.com
30
Information updated as of 7 May 2015