Stainless Steel Sheet and Strip from China Steel Sheet and Strip from China Investigation Nos....
141
U.S. International Trade Commission Publication 4603 April 2016 Washington, DC 20436 Stainless Steel Sheet and Strip from China Investigation Nos. 701-TA-557 and 731-TA-1312 (Preliminary)
Transcript of Stainless Steel Sheet and Strip from China Steel Sheet and Strip from China Investigation Nos....

U.S. International Trade CommissionPublication 4603 April 2016
Washington, DC 20436
Stainless Steel Sheet and Strip from China
Investigation Nos. 701-TA-557 and 731-TA-1312 (Preliminary)
U.S. International Trade Commission
COMMISSIONERS
Meredith M. Broadbent, Chairman Dean A. Pinkert, Vice Chairman
Irving A. Williamson David S. Johanson
F. Scott Kieff Rhonda K. Schmidtlein
Catherine DeFilippo
Staff assigned
Address all communications to Secretary to the Commission
United States International Trade Commission Washington, DC 20436
Director of Operations
Christopher Cassise, Senior Investigator Karen Taylor, Industry Analyst
Andrew Knipe, Economist Jennifer Brinckhaus, Accountant
Charles St. Charles, Attorney Benjamin Allen, Legal Advisor
Russell Duncan, Statistician Douglas Corkran, Supervisory Investigator

U.S. International Trade CommissionWashington, DC 20436
www.usitc.gov
Publication 4603 April 2016
Stainless Steel Sheet and Strip from China
Investigation Nos. 701-TA-557 and 731-TA-1312 (Preliminary)


CONTENTS Page
i
Determinations ............................................................................................................................... 1
Views of the Commission ............................................................................................................... 3
Part I: Introduction ................................................................................................................ I‐1
Background ................................................................................................................................ I‐1
Statutory criteria and organization of the report ..................................................................... I‐1
Statutory criteria ................................................................................................................... I‐1
Organization of report ........................................................................................................... I‐3
Market summary ....................................................................................................................... I‐3
Summary data and data sources ............................................................................................... I‐3
Previous and related investigations .......................................................................................... I‐4
Nature and extent of subsidies and sales at LTFV .................................................................... I‐6
Subsidies ................................................................................................................................ I‐6
Sales at LTFV .......................................................................................................................... I‐7
The subject merchandise .......................................................................................................... I‐7
Commerce’s scope ................................................................................................................ I‐7
Tariff treatment ................................................................................................................... I‐10
Physical characteristics and uses ......................................................................................... I‐10
Manufacturing process ........................................................................................................ I‐13
Domestic like product issues ................................................................................................... I‐18
Part II: Conditions of competition in the U.S. market ............................................................ II‐1
U.S. market characteristics ....................................................................................................... II‐1
Channels of distribution ........................................................................................................... II‐1
Geographic distribution ........................................................................................................... II‐2
Supply and demand considerations ......................................................................................... II‐2
U.S. supply ............................................................................................................................ II‐2
U.S. demand ......................................................................................................................... II‐6
Substitutability issues ............................................................................................................. II‐10
Lead times .......................................................................................................................... II‐10

CONTENTS Page
ii
Factors affecting purchasing decisions............................................................................... II‐11
Comparison of U.S.‐produced and imported stainless steel sheet and strip .................... II‐11
Part III: U.S. producers’ production, shipments, and employment ....................................... III‐1
U.S. producers ......................................................................................................................... III‐1
AK Steel ................................................................................................................................ III‐2
Allegheny ............................................................................................................................. III‐3
North American Stainless .................................................................................................... III‐3
Outokumpu .......................................................................................................................... III‐4
U.S. production, capacity, and capacity utilization ................................................................. III‐5
Potential product shifting in U.S. production facilities ....................................................... III‐5
U.S. producers’ U.S. shipments and exports ........................................................................... III‐6
U.S. producers’ inventories ..................................................................................................... III‐8
U.S. producers’ imports and purchases .................................................................................. III‐8
U.S. employment, wages, and productivity ............................................................................ III‐8
Part IV: U.S. imports, apparent U.S. consumption, and market shares ................................ IV‐1
U.S. importers.......................................................................................................................... IV‐1
U.S. imports ............................................................................................................................. IV‐3
Negligibility .............................................................................................................................. IV‐6
Apparent U.S. consumption and U.S. market shares .............................................................. IV‐6
Part V: Pricing data ............................................................................................................... V‐1
Factors affecting prices ............................................................................................................ V‐1
Raw material costs ............................................................................................................... V‐2
Energy costs .......................................................................................................................... V‐3
Pricing structure ....................................................................................................................... V‐4
Surcharges ............................................................................................................................ V‐5
Base prices ............................................................................................................................ V‐5
U.S. inland transportation costs ........................................................................................... V‐6

CONTENTS Page
iii
Pricing practices ....................................................................................................................... V‐6
Pricing methods .................................................................................................................... V‐6
Sales terms and discounts .................................................................................................... V‐7
Price data .................................................................................................................................. V‐8
Price trends ......................................................................................................................... V‐13
Price comparisons .............................................................................................................. V‐14
Lost sales and lost revenue .................................................................................................... V‐15
Part VI: Financial experience of U.S. producers .................................................................... VI‐1
Background .............................................................................................................................. VI‐1
Operations on stainless steel sheet and strip ......................................................................... VI‐1
Variance analysis ................................................................................................................. VI‐6
Capital expenditures and research and development expenses ............................................ VI‐7
Assets and return on investment ............................................................................................ VI‐8
Capital and investment ........................................................................................................... VI‐9
Part VII: Threat considerations and information on nonsubject countries .......................... VII‐1
The industry in China .............................................................................................................. VII‐3
Data for the stainless steel sheet and strip industry in China ............................................ VII‐4
Potential product shifting in production facilities in China ................................................ VII‐6
Exports of stainless steel sheet and strip from China ........................................................ VII‐6
U.S. inventories of imported merchandise ............................................................................ VII‐8
U.S. importers’ outstanding orders ........................................................................................ VII‐8
Antidumping or countervailing duty orders in third‐country markets .................................. VII‐9
Information on nonsubject countries .................................................................................... VII‐9
Appendixes
A. Federal Register notices ................................................................................................. A‐1
B. Conference witnesses ..................................................................................................... B‐1
C. Summary data ................................................................................................................ C‐1

CONTENTS Page
iv
D. Monthly U.S. import data ............................................................................................... D‐1
E. Nonsubject sources price data ....................................................................................... E‐1
Note.—Information that would reveal confidential operations of individual concerns may not
be published and therefore has been deleted. Such deletions are indicated by asterisks.
1
UNITED STATES INTERNATIONAL TRADE COMMISSION
Investigation Nos. 701‐TA‐557 and 731‐TA‐1312 (Preliminary)
Stainless Steel Sheet and Strip from China
DETERMINATIONS
On the basis of the record1 developed in the subject investigations, the United States International Trade Commission (“Commission”) determines, pursuant to the Tariff Act of 1930 (“the Act”), that there is a reasonable indication that an industry in the United States is materially injured by reason of imports of stainless steel sheet and strip from China, provided for in subheadings 7219.13.00, 7219.14.00, 7219.23.00, 7219.24.00, 7219.32.00, 7219.33.00, 7219.34.00, 7219.35.00, 7219.90.00, 7220.12.10, 7220.12.50, 7220.20.10, 7220.20.60, 7220.20.70, 7220.20.90, and 7220.90.00 of the Harmonized Tariff Schedule of the United States, that are alleged to be sold in the United States at less than fair value (“LTFV”) and are allegedly subsidized by the government of China.
COMMENCEMENT OF FINAL PHASE INVESTIGATIONS
Pursuant to section 207.18 of the Commission’s rules, the Commission also gives notice of the commencement of the final phase of its investigations. The Commission will issue a final phase notice of scheduling, which will be published in the Federal Register as provided in section 207.21 of the Commission’s rules, upon notice from the Department of Commerce (“Commerce”) of affirmative preliminary determinations in the investigations under sections 703(b) or 733(b) of the Act, or, if the preliminary determinations are negative, upon notice of affirmative final determinations in those investigations under sections 705(a) or 735(a) of the Act. Parties that filed entries of appearance in the preliminary phase of the investigations need not enter a separate appearance for the final phase of the investigations. Industrial users, and, if the merchandise under investigation is sold at the retail level, representative consumer organizations have the right to appear as parties in Commission antidumping and countervailing duty investigations. The Secretary will prepare a public service list containing the names and addresses of all persons, or their representatives, who are parties to the investigations.
BACKGROUND
On February 12, 2016, AK Steel Corp., West Chester, Ohio; Allegheny Ludlum, LLC d/b/a ATI Flat Rolled Products, Pittsburgh, Pennsylvania; North American Stainless, Inc., Ghent, Kentucky; and Outokumpu Stainless USA, LLC, Bannockburn, Illinois filed a petition with the
1 The record is defined in sec. 207.2(f) of the Commission’s Rules of Practice and Procedure (19 CFR § 207.2(f)).

2
Commission and Commerce, alleging that an industry in the United States is materially injured or threatened with material injury by reason of LTFV and subsidized imports of stainless steel sheet and strip from China. Accordingly, effective February 12, 2016, the Commission, pursuant to sections 703(a) and 733(a) of the Act (19 U.S.C. §§ 1671b(a) and 1673b(a)), instituted countervailing duty investigation No. 701‐TA‐557 and antidumping duty investigation No. 731‐TA‐1312 (Preliminary).
Notice of the institution of the Commission’s investigations and of a public conference to be held in connection therewith was given by posting copies of the notice in the Office of the Secretary, U.S. International Trade Commission, Washington, DC, and by publishing the notice in the Federal Register of February 19, 2016 (81 FR 8544). The conference was held in Washington, DC, on March 4, 2016, and all persons who requested the opportunity were permitted to appear in person or by counsel.

Bis a reasoimports oUnited StChina.
TI.
Trequires preliminamateriallmateriallstandardrecord asthreat ofinvestiga
BII.
A(“Alleghe(“Outokuthese invsubmitte
SeCo. Ltd., Ridetaixisubject massociatithe staff
Uaccounti
1
994, 1001argues thaunfairly tr
2 AF.3d 1535
3
ased on theonable indicaof stainless states at less
The Legal S
he legal stanthe Commisary determinly injured orly retarded, d, the Comms a whole cof such injury;ation.”2
Background
AK Steel Corpeny”), Northumpu”) (collvestigations ed a postconeveral respoBaosteel Stang Precisionmerchandiseon in China conference
U.S. industry ng for virtua
19 U.S.C. §§ 11‐04 (Fed. Cir.at the establiraded importAmerican Lam5, 1543 (Fed. CConfidential
record in thation that ansteel sheet athan fair va
Standard fo
ndard for pression to detenations, whethreatenedby reason oission weighontains clear ; and (2) no
d
poration (“A American Sectively “Peton Februaryference brieondents partainless Steel n Stainless Ste in China, an(collectivelyand submittdata are basally all dome
1671b(a), 167. 1986); Aristeshment of ans. mb Co., 785 FCir. 1994). Report (“CR”
Views of t
he preliminan industry inand strip (“SSlue and that
or Prelimin
eliminary anermine, baseether there i with materf the allegedhs the evidenand convinclikelihood ex
K Steel”), Altainless (“NAtitioners”), dy 12, 2016. Pef. ticipated in tCo., Ltd., Niteel Incorpond the China “Respondented a postcosed on the qstic product
73b(a) (2000)ech Chem. Con industry in t
F.2d at 1001; s
) at III‐1, Publ
3
the Comm
ry phase of tn the United SSS”) from Ct are alleged
nary Deter
ntidumping aed upon the is a reasonabial injury, ordly unfairly tnce before itcing evidencxists that co
legheny LudAS”), and Oudomestic proPetitioners a
these investiingbo Baoxinrated Co., Lta Chamber onts”). Respoonference brquestionnairtion of SSSS
; see also Amorp. v. United the United Sta
see also Texa
lic Report (“P
mission
these investStates is maChina that ardly subsidize
rminations
and counterinformationble indicatior that the esttraded impot and determce that thereontrary evide
dlum, LLC d/butokumpu Soducers of Sappeared at
igations: Shn Stainless Std., produceof Internatioondents werrief. re responsesin 2015.3 U.
merican Lamb States, 20 CITates is mater
as Crushed Sto
PR”) at III‐I.
tigations, weaterially injure allegedly d by the gov
s
vailing duty n available aon that a domtablishmentrts.1 In applmines whethe is no mateence will aris
b/a ATI Flat tainless USASSSS, filed ththe staff co
hanXi TaiganSteel Co, Ltd.rs and exponal Commerre represent
s of four pro.S. import da
Co. v. UnitedT 353, 354‐55ially retarded
one Co. v. Un
e find that thured by reasosold in the vernment of
determinatt the time omestic indust of an industlying this her “(1) the rial injury orse in a final
Rolled ProdA, LLC he petitions inference an
g Stainless S., and Taiyuarters of the rce, a busineted by couns
ducers, ata are base
d States, 785 F5 (1996). No d by the allege
ited States, 3
here on of
f
ions f the stry is try is
r
ucts
in d
Steel an
ess sel at
ed on
F.2d party edly
35

official Ureceived subject imresponseaccounte66.0 perc
DIII.
InStates is subject m“industrythe relevthose proproportio“domestcharacte
Tfactual d“most simdispositivfacts of apossible
4 5 6 7 8 9 S
DepartmeStates, 191990), affparticularnumber o(3) channmanufactprice. See1996).
10
11
at 90‐91 (narrow fa(Continue
.S. Departmquestionnamports and es to its quesed for approcent of expo
Domestic L
n determininmaterially inmerchandisey.”6 Section vant domestoducers whoon of the totic like produristics and uhe decision eterminatiomilar in charve, and the Ca particular ilike product
CR at I‐4, IV‐3CR at I‐4‐5, P19 U.S.C. § 1619 U.S.C. § 1619 U.S.C. § 16See, e.g., Cleoent of Comme9 CIT 450, 455f’d, 938 F.2d 1r record at issof factors incluels of distribuuring facilitiee Nippon, 19 C
0 See, e.g., S. R1 See, e.g., NipCongress hasashion as to ped…)
ment of Commire response*** percentstionnaires fximately ***orts of SSSS f
ike Produc
ng whether tnjured or thre, the Comm771(4)(A) ofic industry aose collectivtal domesticuct” as “a proses with, theregarding thn, and the Cracteristics aCommissionnvestigationts and disreg
3, PR at I‐3, IVR at I‐3‐4, CR677(4)(A). 677(4)(A). 677(10). o Inc. v. Uniteerce, 36 F. Sup5 (1995); Torr1278 (Fed. Cirue’ and the ‘uuding the follution; (4) custes, productionCIT at 455 n.4
Rep. No. 96‐2ppon, 19 CIT as indicated thermit minor d
merce (“Comes from 14 Ut of nonsubjefrom seven p* percent offrom China t
ct
there is a reareatened wiission first df the Tariff Aas the “produe output of c productionoduct whiche article subhe appropriaCommission and uses” on may considn.10 The Comgards minor
V‐3. /PR at Table
ed States, 501pp. 2d 380, 3rington Co. v. r. 1991) (“eveunique facts oowing: (1) phtomer and prn processes, a4; Timken Co.
249 at 90‐91 (at 455; Torrinat the like prdifferences in
4
mmerce”) imU.S. importerect imports producers off productionto the United
asonable indth material idefines the “Act of 1930, ucers as a wa domestic l of the prodh is like, or inbject to an inate domestichas applied n a case‐by‐cer other facmmission loovariations.11
IV‐1.
1 F.3d 1291, 183 (Ct. Int’l TUnited Statesery like produof each case’”hysical characoducer perceand productio v. United Sta
(1979). ngton, 747 F. oduct standan physical cha
mport statistirs, which accin 2015.5 Thf subject me of subject md States in 2
dication thatinjury by rea“domestic likas amended
whole of a dolike productduct.”7 In turn the absencnvestigation.c like producthe statutorcase basis.9 ctors it deemoks for clear1 Although t
1299 (Fed. Cirrade 1998); Ns, 747 F. Suppuct determina”). The Commcteristics andeptions of theon employeesates, 913 F. Su
Supp. at 748‐ard should noaracteristics o
ics.4 The Cocounted for he Commisserchandise inmerchandise2015.
t an industryason of impoke product” d (“the Tariffomestic like p constitutesrn, the Tariffce of like, mo.”8 ct(s) in an invry standard No single fa
ms relevant b dividing linethe Commiss
r. 2007); NEC Nippon Steel Cp. 744, 749 nation ‘must bemission gened uses; (2) intee products; (5s; and, whereupp. 580, 584
‐49; see also t be interpretor uses to lead
ommission *** percention receivedn China that e in China an
y in the Unitorts of the and the f Act”), definproduct, or a major f Act definesost similar in
vestigation iof “like” or ctor is based on thees among sion must ac
Corp. v. Corp. v. Unite.3 (Ct. Int’l Tre made on thrally considererchangeabili5) common e appropriate4 (Ct. Int’l Tra
S. Rep. No. 96ted in “such ad to the
t of d
nd
ed
nes
s n
is a
e
ccept
ed rade he rs a ity;
, (6) ade
6‐249 a

5
Commerce’s determination as to the scope of the imported merchandise that is allegedly subsidized and/or sold at less than fair value,12 the Commission determines what domestic product is like the imported articles Commerce has identified.13
A. Scope Definition
In its notices of initiation, Commerce defined the imported merchandise within the scope of these investigations as follows:
The merchandise covered by this investigation is stainless steel sheet and strip, whether in coils or straight lengths. Stainless steel is an alloy steel containing, by weight, 1.2 percent or less of carbon and 10.5 percent or more of chromium, with or without other elements. The subject sheet and strip is a flat‐rolled product with a width that is greater than 9.5 mm and with a thickness of 0.3048 mm and greater but less than 4.75 mm, and that is annealed or otherwise heat treated, and pickled or otherwise descaled. The subject sheet and strip may also be further processed (e.g., cold‐rolled, annealed, tempered, polished, aluminized, coated, painted, varnished, trimmed, cut, punched, or slit, etc.) provided that it maintains the specific dimensions of sheet and strip set forth above following such processing. The products described include products regardless of shape, and include products of either rectangular or non‐rectangular cross‐section where such cross‐section is achieved subsequent to the rolling process, i.e., products which have been “worked after rolling” (e.g., products which have been beveled or rounded at the edges). For purposes of the width and thickness requirements referenced above: (1) Where the nominal and actual measurements vary, a product is within the scope if application of either the nominal or actual measurement would place it within the scope based on the definitions set forth above;
(…Continued) conclusion that the product and article are not ‘like’ each other, nor should the definition of ‘like product’ be interpreted in such a fashion as to prevent consideration of an industry adversely affected by the imports under consideration.”).
12 See, e.g., USEC, Inc. v. United States, 34 Fed. App’x 725, 730 (Fed. Cir. 2002) (“The ITC may not modify the class or kind of imported merchandise examined by Commerce.”); Algoma Steel Corp. v. United States, 688 F. Supp. 639, 644 (Ct. Int’l Trade 1988), aff’d, 865 F.3d 240 (Fed. Cir.), cert. denied, 492 U.S. 919 (1989).
13 Hosiden Corp. v. Advanced Display Mfrs., 85 F.3d 1561, 1568 (Fed. Cir. 1996) (the Commission may find a single like product corresponding to several different classes or kinds defined by Commerce); Cleo, 501 F.3d at 1298 n.1 (“Commerce’s {scope} finding does not control the Commission’s {like product} determination.”); Torrington, 747 F. Supp. at 748‐52 (affirming the Commission’s determination defining six like products in investigations where Commerce found five classes or kinds).

6
and (2) where the width and thickness vary for a specific product (e.g., the thickness of certain products with non‐rectangular cross‐section, the width of certain products with non‐rectangular shape, etc.), the measurement at its greatest width or thickness applies. All products that meet the written physical description, and in which the chemistry quantities do not exceed any one of the noted element levels listed above, are within the scope of this investigation unless specifically excluded. Subject merchandise includes stainless steel sheet and strip that has been further processed in a third country, including but not limited to cold‐rolling, annealing, tempering, polishing, aluminizing, coating, painting, varnishing, trimming, cutting, punching, and/or slitting, or any other processing that would not otherwise remove the merchandise from the scope of the investigation if performed in the country of manufacture of the stainless steel sheet and strip. Excluded from the scope of this investigation are the following: (1) sheet and strip that is not annealed or otherwise heat treated and not pickled or otherwise descaled; (2) plate (i.e., flat‐ rolled stainless steel products of a thickness of 4.75 mm or more); and (3) flat wire (i.e., cold‐rolled sections, with a mill edge, rectangular in shape, of a width of not more than 9.5 mm).14 SSSS is produced to industry specifications for sheet and strip products detailed by the
American Society for Testing and Materials ("ASTM"), ASM International ("ASM"), and the American Iron and Steel Institute ("AISI"). Stainless steel is a low carbon steel that contains 10.5 percent or more chromium by weight. Chromium gives the steel its corrosion resisting properties. Other alloying elements, such as nickel and molybdenum, can be added in addition to chromium. Each alloying element imparts certain characteristics to the steel. Sheet is at least 24 inches in width, whereas strip is less than 24 inches wide; the subject strip has a width greater than 9.5 mm.15 SSSS products are used in many consumer and industrial applications, especially where corrosion resistance, heat resistance, or stainless steel’s aesthetic characteristics are desired.16
14 Initiation of Less Than Fair Value Investigation, Department of Commerce, 81 Fed. Reg. 12711
(Mar. 10, 2016) (“AD Initiation Notice”); Initiation of Countervailing Duty Investigation, Department of Commerce, 81 Fed. Reg. 13322 (Mar. 14, 2016).
15 CR at I‐10, I‐12‐13; PR at I‐8, I‐10. 16 CR at I‐12‐15, PR at I‐10‐18.

7
B. Arguments of the Parties
Petitioners argue that the Commission should define a single domestic like product that is coextensive with the scope of the investigations.17 Respondents do not challenge the proposed definition of the domestic like product.
C. Analysis
Based on the record in the preliminary phase of these investigations, we define a single
domestic like product, consisting of SSSS, that is coextensive with Commerce’s scope. Physical Characteristics and Uses. The record indicates that SSSS within the scope
includes a variety of products of different forms and dimensions. SSSS contains 10.5 percent or more chromium by weight, and generally contains other alloying elements, with the precise chemistry and physical characteristics provided for in ASTM, ASM, and AISI specifications.18 All SSSS products are used in consumer and industrial applications in which corrosion resistance, heat resistance, or stainless steel’s aesthetic characteristics are desired. For example, the automotive industry uses sheet and strip to manufacture trim, exhaust‐ and emission‐control systems, and wheel covers. The pipe and tube industry uses slit coil as a raw material and produces pipes and tubes by welding the lengthwise edges together. Sheet and strip are also used by the chemical and construction industries, as well as by appliance and industrial equipment manufacturers, among many other applications.19
Manufacturing Facilities, Production Processes and Employees. Production of all SSSS begins with the melting of steel scrap and alloying elements such as chromium, nickel, and molybdenum (depending on the stainless steel grade) in an electric arc furnace. The molten steel is processed to remove impurities and is solidified into slabs, which are wide semi‐finished products from which flat‐rolled products are rolled. Finished slab is reheated and put through hot‐rolling mills, which reduce the thickness of the steel. The hot‐rolled steel is wrapped into coils, and then annealed, a form of heat treatment, to relieve stresses and soften the steel. It next undergoes pickling, an acid wash that removes oxide scale and surface defects and imparts corrosion resistance. The hot‐rolled annealed and pickled coil or band can be shipped in that condition or, if specified, transferred to a cold‐rolling mill where the product’s thickness is further reduced. The majority of SSSS is sold as cold‐rolled product. The steel may undergo further processing following cold‐rolling that can improve the surface condition, add finishes such as embossing or etching, or provide mechanical treatment such as perforations,
17 Petitioners’ Postconference Brief at 4‐5. Petitioners contend that all SSSS has similar physical
characteristics and conforms to ASTM, ASM, and AISI specifications for sheet and strip chemistry, thickness, and width. They maintain that all SSSS meeting those specifications is interchangeable. Petitioners also assert that the majority of SSSS is sold in the same channels of distribution and all SSSS is produced using the same basic manufacturing process, equipment, and employees. They further argue that producers and customers perceive all SSSS to be the same product and that all SSSS is sold within a reasonable range of similar prices. Id.
18 CR at I‐15, PR at I‐12‐13; Petitioners’ Postconference Brief at 5. 19 CR at I‐12‐15, PR at I‐10‐13.

electromPetitionethe same
C(75.7 per
Inother staand/or th
Cbetweenthicknessother ste
Pprices.25
D
BargumenCommer
DIV.
Tlike proda major pindustry,domesticthe dome
20
21
22
23
24
25
Commissicoiled pro
26
27
rollers.” Babout theconstitute
mechanical coers report the workers.21 Channels of Drcent in 2015nterchangeaainless steel hickness, as Customer and SSSS and ots. Thus, proeel productsrice. The inf
D. Concl
ased on thent, we definece’s scope d
Domestic In
he domesticuct, or thoseproportion o the Commic productionestic mercha
0 CR at I‐15‐221 Petitioners’ 2 CR/PR at Tab3 E.g., CR at I‐4 Petitioners’ 5 See Petitioneon collected oducts depen6 19 U.S.C. § 17 There are alsBecause no reem or their pre domestic pr
oloring, or pat stainless
Distribution. 5), with the ability. Interproducts, is well as the sd Producer ather steel prducers and c.24 formation av
usion
foregoing ine a single dodefinition.
ndustry
c industry is e producers of the total dssion’s genen of the like pant market.2
2, PR at I‐13‐1Postconferenble II‐1. 21‐22, PR at IPostconfereners’ Postconfindicate that ding on thick1677(4)(A). so several U.Se‐rollers resproduction operoduction. Se
lating. SSSSsteel sheet a
The record remainder (changeabilitlimited by tspecific induand Perceptiroducts in tecustomers v
vailable sugg
nformation, mestic like p
defined as twhose colle
domestic proeral practice product, wh27
18. nce Brief at 4‐
I‐17‐18. nce Brief at 5.erence Brief athere can beness and AISI
S. firms that aonded to theerations that ee CR/PR at II
8
S may also beand strip are
indicates SS24.3 percenty between She inherent ustry standarons. Industrerms of such view SSSS me
gests that SS
and in light product, con
he domesticective outpuoduction of thas been toether toll‐pr
‐5.
. at 4‐5. The ge some pricingI grade. CR/P
are not integre questionnairwould permitI‐1 n.3.
e edge‐trimme produced i
SSS is sold prnt in 2015) soSSSS and oth differencesrds to whichry standards characteristeeting those
SSS is sold w
of the absennsisting of SS
c “producersut of a domethe product.o include in troduced, cap
grade 304 andg distinctionsPR at Tables V
rated producre, the recordt a finding as
med, slit, or in the same
redominantold directly ther steel pros in physical h they confos explicitly dtics as cheme standards a
within a range
nce of any cSSS, that is c
s as a wholestic like prod.”26 In definthe industry ptively cons
d 316L pricings among domV‐3‐6.
ers of SSSS bud does not coto whether t
cut‐to‐lengtfacilities usi
ly to distributo end usersoducts, incluproperties rm.23 istinguish
mistry and as distinct fr
e of similar
ontrary oextensive w
of a domesduct constituing the domproducers oumed, or so
g data the estically prod
ut are rather ontain any dattheir operatio
th.20 ng
utors s.22 uding
rom
with
tic utes
mestic of all ld in
duced
“re‐ta ons

Bproduct,
NV.
Pmerchanall such mwhich da
Nfor 31.1 pFebruarypetition.3
RVI.
A
InCommissStates is investigasubject im
28
provision owns a 60venture wSTAL, ***
WpurchaserThe CommpredominElectrolyti4036 (Sep*** perceQuestionn
29
(developi30
31
amendedindicationrespects.
ased on thewe define a
Negligible I
ursuant to Sdise correspmerchandiseata are availaNegligibility ispercent of toy 2015 to Jan30
Reasonable
A. Legal
n the prelimision determimaterially ination.31 In mmports, thei
8 We do not eat Section 770 percent equwith Baosteel during 2013
While *** purcr of subject mmission has fonant proportioic Manganesep. 2008) at 6 nent of that firmnaire Respon9 19 U.S.C. §§ ng countries 0 CR at IV‐6, P1 19 U.S.C. §§ the provision
n of material i We have app
record presa single dom
Imports
Section 771(2ponding to ae imported inable precedis not an issuotal U.S. impnuary 2016,
e Indicatio
Standard
inary phase ines whethenjured or thrmaking this deir effect on p
exclude any p71(4)(B) of theuity interest inGroup of Chi‐15. CR at III‐chased subjemerchandise isound such coon of an impoe Dioxide fromn.26. *** purm’s 2014 impse. 1671b(a), 16for purposes R at IV‐6. 1671b(a), 16ns of the Tarifinjury and thrplied these am
sented, and estic industr
24) of the Ta domestic linto the Unitng the filingue in these inports of stainthe most rec
n of Mate
of antidumper there is a rreatened wieterminatioprices for the
roducer frome Tariff Act, 1n Shanghai STna. STAL pro‐12‐13, PR at ct merchandis a related pantrol to exist orter’s purcham Australia archases of subports. See CR
673b(a), 1677of 19 U.S.C. §
673b(a). The Tff Act pertainreat of matermendments h
9
in light of thry encompas
ariff Act, impke product tted States dug of the petitnvestigationnless steel shcent 12‐mon
rial Injury
ping and coureasonable ith material in, the Comme domestic l
m the domesti19 U.S. C. § 16TAL Precision oduces subjecIII‐8. ise in 2014, itarty only if it cwhen the doases and thesnd China, Invbject merchaat III‐12 n.21
(24)(A)(i), 167§ 1677(36)).
Trade Preferening to Commrial injury by rhere.
he definitionssing all U.S.
ports from athat accounturing the motion shall be s. U.S. impoheet and strnth period p
by Reason
untervailing indication thinjury by reamission mustike product,
ic industry pu677(4)(B). Do Stainless Stect SSSS in Chin
t is not a relatcontrols largeomestic produse purchases v. Nos. 731‐TAndise from im1, PR at II‐8 n.
77(24)(B); se
ences Extensimission determreason of sub
of the dom. producers
a subject cout for less thaost recent 12deemed neorts from Chrip by quantipreceding the
n of Subjec
duty investihat an industason of the it consider th, and their im
ursuant to theomestic produeel Co., Ltd. (“na. CR at III‐1
ted party on te volumes of ucer was respwere substanA‐1124‐25 (Fimporter *** o.21; *** Impo
ee also 15 C.F
ion Act of 201minations of rbject imports
estic like of SSSS.28
untry of an 3 percent2 months fogligible.29 hina accountity from e filing of th
ct Imports
gations, thetry in the Unmports undhe volume ompact on
e related partucer Alleghen“STAL”), a join12‐13, PR at I
that basis. A subject impoponsible for a ntial. See nal), USITC Ponly constitutorters
.R. § 2013.1
15, Pub. L. 11reasonable in certain
of r
ted
e
s
nited er of
ty ny nt II‐8.
orts.
ub. ted
14‐27,

10
domestic producers of the domestic like product, but only in the context of U.S. production operations.32 The statute defines “material injury” as “harm which is not inconsequential, immaterial, or unimportant.”33 In assessing whether there is a reasonable indication that the domestic industry is materially injured by reason of subject imports, we consider all relevant economic factors that bear on the state of the industry in the United States.34 No single factor is dispositive, and all relevant factors are considered “within the context of the business cycle and conditions of competition that are distinctive to the affected industry.”35
Although the statute requires the Commission to determine whether there is a reasonable indication that the domestic industry is “materially injured by reason of” unfairly traded imports,36 it does not define the phrase “by reason of,” indicating that this aspect of the injury analysis is left to the Commission’s reasonable exercise of its discretion.37 In identifying a causal link, if any, between subject imports and material injury to the domestic industry, the Commission examines the facts of record that relate to the significance of the volume and price effects of the subject imports and any impact of those imports on the condition of the domestic industry. This evaluation under the “by reason of” standard must ensure that subject imports are more than a minimal or tangential cause of injury and that there is a sufficient causal, not merely a temporal, nexus between subject imports and material injury.38
In many investigations, there are other economic factors at work, some or all of which may also be having adverse effects on the domestic industry. Such economic factors might include nonsubject imports; changes in technology, demand, or consumer tastes; competition among domestic producers; or management decisions by domestic producers. The legislative history explains that the Commission must examine factors other than subject imports to ensure that it is not attributing injury from other factors to the subject imports, thereby
32 19 U.S.C. § 1677(7)(B). The Commission “may consider such other economic factors as are
relevant to the determination” but shall “identify each {such} factor ... {a}nd explain in full its relevance to the determination.” 19 U.S.C. § 1677(7)(B).
33 19 U.S.C. § 1677(7)(A). 34 19 U.S.C. § 1677(7)(C)(iii). 35 19 U.S.C. § 1677(7)(C)(iii). 36 19 U.S.C. §§ 1671b(a), 1673b(a). 37 Angus Chemical Co. v. United States, 140 F.3d 1478, 1484‐85 (Fed. Cir. 1998) (“{T}he statute
does not ‘compel the commissioners’ to employ {a particular methodology}.”), aff’g 944 F. Supp. 943, 951 (Ct. Int’l Trade 1996).
38 The Federal Circuit, in addressing the causation standard of the statute, has observed that “{a}s long as its effects are not merely incidental, tangential, or trivial, the foreign product sold at less than fair value meets the causation requirement.” Nippon Steel Corp. v. USITC, 345 F.3d 1379, 1384 (Fed. Cir. 2003). This was re‐affirmed in Mittal Steel Point Lisas Ltd. v. United States, 542 F.3d 867, 873 (Fed. Cir. 2008), in which the Federal Circuit, quoting Gerald Metals, Inc. v. United States, 132 F.3d 716, 722 (Fed. Cir. 1997), stated that “this court requires evidence in the record ‘to show that the harm occurred “by reason of” the LTFV imports, not by reason of a minimal or tangential contribution to material harm caused by LTFV goods.’” See also Nippon Steel Corp. v. United States, 458 F.3d 1345, 1357 (Fed. Cir. 2006); Taiwan Semiconductor Industry Ass’n v. USITC, 266 F.3d 1339, 1345 (Fed. Cir. 2001).

11
inflating an otherwise tangential cause of injury into one that satisfies the statutory material injury threshold.39 In performing its examination, however, the Commission need not isolate the injury caused by other factors from injury caused by unfairly traded imports.40 Nor does the “by reason of” standard require that unfairly traded imports be the “principal” cause of injury or contemplate that injury from unfairly traded imports be weighed against other factors, such as nonsubject imports, which may be contributing to overall injury to an industry.41 It is clear that the existence of injury caused by other factors does not compel a negative determination.42
Assessment of whether material injury to the domestic industry is “by reason of” subject imports “does not require the Commission to address the causation issue in any particular way” as long as “the injury to the domestic industry can reasonably be attributed to the subject imports” and the Commission “ensure{s} that it is not attributing injury from other sources to
39 SAA, H.R. Rep. 103‐316, Vol. I at 851‐52 (1994) (“{T}he Commission must examine other
factors to ensure that it is not attributing injury from other sources to the subject imports.”); S. Rep. 96‐249 at 75 (1979) (the Commission “will consider information which indicates that harm is caused by factors other than less‐than‐fair‐value imports.”); H.R. Rep. 96‐317 at 47 (1979) (“in examining the overall injury being experienced by a domestic industry, the ITC will take into account evidence presented to it which demonstrates that the harm attributed by the petitioner to the subsidized or dumped imports is attributable to such other factors;” those factors include “the volume and prices of nonsubsidized imports or imports sold at fair value, contraction in demand or changes in patterns of consumption, trade restrictive practices of and competition between the foreign and domestic producers, developments in technology and the export performance and productivity of the domestic industry”); accord Mittal Steel, 542 F.3d at 877.
40 SAA at 851‐52 (“{T}he Commission need not isolate the injury caused by other factors from injury caused by unfair imports.”); Taiwan Semiconductor Industry Ass’n , 266 F.3d at 1345. (“{T}he Commission need not isolate the injury caused by other factors from injury caused by unfair imports ... . Rather, the Commission must examine other factors to ensure that it is not attributing injury from other sources to the subject imports.” (emphasis in original)); Asociacion de Productores de Salmon y Trucha de Chile AG v. United States, 180 F. Supp. 2d 1360, 1375 (Ct. Int’l Trade 2002) (“{t}he Commission is not required to isolate the effects of subject imports from other factors contributing to injury” or make “bright‐line distinctions” between the effects of subject imports and other causes.); see also Softwood Lumber from Canada, Inv. Nos. 701‐TA‐414 and 731‐TA‐928 (Remand), USITC Pub. 3658 at 100‐01 (Dec. 2003) (Commission recognized that “{i}f an alleged other factor is found not to have or threaten to have injurious effects to the domestic industry, i.e., it is not an ‘other causal factor,’ then there is nothing to further examine regarding attribution to injury”), citing Gerald Metals, 132 F.3d at 722 (the statute “does not suggest that an importer of LTFV goods can escape countervailing duties by finding some tangential or minor cause unrelated to the LTFV goods that contributed to the harmful effects on domestic market prices.”).
41 S. Rep. 96‐249 at 74‐75; H.R. Rep. 96‐317 at 47. 42 See Nippon, 345 F.3d at 1381 (“an affirmative material‐injury determination under the statute
requires no more than a substantial‐factor showing. That is, the ‘dumping’ need not be the sole or principal cause of injury.”).

12
the subject imports.”43 44 Indeed, the Federal Circuit has examined and affirmed various Commission methodologies and has disavowed “rigid adherence to a specific formula.”45
The Federal Circuit’s decisions in Gerald Metals, Bratsk, and Mittal Steel all involved cases in which the relevant “other factor” was the presence in the market of significant volumes of price‐competitive nonsubject imports. The Commission interpreted the Federal Circuit’s guidance in Bratsk as requiring it to apply a particular additional methodology following its finding of material injury in cases involving commodity products and a significant market presence of price‐competitive nonsubject imports.46 The additional “replacement/benefit” test looked at whether nonsubject imports might have replaced subject imports without any benefit to the U.S. industry. The Commission applied that specific additional test in subsequent cases, including the Carbon and Certain Alloy Steel Wire Rod from Trinidad and Tobago determination that underlies the Mittal Steel litigation.
Mittal Steel clarifies that the Commission’s interpretation of Bratsk was too rigid and makes clear that the Federal Circuit does not require the Commission to apply an additional test nor any one specific methodology; instead, the court requires the Commission to have “evidence in the record ‘to show that the harm occurred ‘by reason of’ the LTFV imports,’” and requires that the Commission not attribute injury from nonsubject imports or other factors to
43 Mittal Steel, 542 F.3d at 877‐78; see also id. at 873 (“While the Commission may not enter an
affirmative determination unless it finds that a domestic industry is materially injured ‘by reason of’ subject imports, the Commission is not required to follow a single methodology for making that determination ... {and has} broad discretion with respect to its choice of methodology.”) citing United States Steel Group v. United States, 96 F.3d 1352, 1362 (Fed. Cir. 1996) and S. Rep. 96‐249 at 75. In its decision in Swiff‐Train v. United States, 792 F.3d 1355 (Fed. Cir. 2015), the Federal Circuit affirmed the Commission’s causation analysis as comporting with the Court’s guidance in Mittal.
44 Vice Chairman Pinkert and Commissioner Kieff do not join this paragraph or the following three paragraphs. They point out that the Federal Circuit, in Bratsk, 444 F.3d 1369, and Mittal Steel, held that the Commission is required, in certain circumstances when analyzing present material injury, to consider a particular issue with respect to the role of nonsubject imports, without reliance upon presumptions or rigid formulas. The Court has not prescribed a specific method of exposition for this consideration. Mittal Steel explains as follows:
What Bratsk held is that “where commodity products are at issue and fairly traded, price competitive, non‐subject imports are in the market,” the Commission would not fulfill its obligation to consider an important aspect of the problem if it failed to consider whether non‐subject or non‐LTFV imports would have replaced LTFV subject imports during the period of investigation without a continuing benefit to the domestic industry. 444 F.3d at 1369. Under those circumstances, Bratsk requires the Commission to consider whether replacement of the LTFV subject imports might have occurred during the period of investigation, and it requires the Commission to provide an explanation of its conclusion with respect to that factor.
542 F.3d at 878. 45 Nucor Corp. v. United States, 414 F.3d 1331, 1336, 1341 (Fed. Cir. 2005); see also Mittal Steel,
542 F.3d at 879 (“Bratsk did not read into the antidumping statute a Procrustean formula for determining whether a domestic injury was ‘by reason’ of subject imports.”).
46 Mittal Steel, 542 F.3d at 875‐79.

13
subject imports.47 Accordingly, we do not consider ourselves required to apply the replacement/benefit test that was included in Commission opinions subsequent to Bratsk.
The progression of Gerald Metals, Bratsk, and Mittal Steel clarifies that, in cases involving commodity products where price‐competitive nonsubject imports are a significant factor in the U.S. market, the Court will require the Commission to give full consideration, with adequate explanation, to non‐attribution issues when it performs its causation analysis.48
The question of whether the material injury threshold for subject imports is satisfied notwithstanding any injury from other factors is factual, subject to review under the substantial evidence standard.49 Congress has delegated this factual finding to the Commission because of the agency’s institutional expertise in resolving injury issues.50
B. Conditions of Competition and the Business Cycle
The following conditions of competition inform our analysis of whether there is a reasonable indication of material injury by reason of subject imports.
1. Demand Conditions
The information available indicates that U.S. demand for SSSS depends on the demand for U.S.‐produced downstream products. Reported end uses include automotive parts, pipe and tube, restaurant and food service equipment, appliances, sinks, tanks and pressure vessels, tables, flexible hoses, and computer parts.51
All four U.S. producers reported an increase in U.S. demand for SSSS since 2013, and a majority of importers reported that demand increased or fluctuated.52 Apparent U.S. consumption of SSSS increased from 1.9 million short tons in 2013 to 2.1 million short tons in
47 Mittal Steel, 542 F.3d at 873 (quoting from Gerald Metals, 132 F.3d at 722), 875‐79 & n.2
(recognizing the Commission’s alternative interpretation of Bratsk as a reminder to conduct a non‐attribution analysis).
48 To that end, after the Federal Circuit issued its decision in Bratsk, the Commission began to present published information or send out information requests in the final phase of investigations to producers in nonsubject countries that accounted for substantial shares of U.S. imports of subject merchandise (if, in fact, there were large nonsubject import suppliers). In order to provide a more complete record for the Commission’s causation analysis, these requests typically seek information on capacity, production, and shipments of the product under investigation in the major source countries that export to the United States. The Commission plans to continue utilizing published or requested information in the final phase of investigations in which there are substantial levels of nonsubject imports.
49 We provide below a full analysis of other factors alleged to have caused any material injury experienced by the domestic industry.
50 Mittal Steel, 542 F.3d at 873; Nippon Steel Corp., 458 F.3d at 1350, citing U.S. Steel Group, 96 F.3d at 1357; S. Rep. 96‐249 at 75 (“The determination of the ITC with respect to causation is ... complex and difficult, and is a matter for the judgment of the ITC.”).
51 CR at II‐9, PR at II‐6. 52 CR at II‐13, PR at II‐9, CR/PR at Table II‐3.

14
2014, then decreased to 2.0 million short tons in 2015, for an overall increase of 4.5 percent from 2013 to 2015.53
2. Supply Conditions
The domestic industry was the largest supplier to the U.S. market throughout the POI. Its market share declined from 81.3 percent in 2013 to 78.9 percent in 2014 and 77.0 percent in 2015, for an overall decline of 4.3 percentage points.54
As previously stated, four firms responded to the U.S. producers’ questionnaire. NAS and AK Steel are the two *** producers, accounting for *** percent of reported 2015 domestic production, respectively. The other two producers, Outokumpu and Allegheny, accounted for *** percent of 2015 production, respectively.55 The information available indicates that SSSS is primarily produced to order, rather than sold from inventories.56
Domestic producers reported experiencing some supply constraints during the POI.57 All domestic producers reported experiencing extended lead times in 2014, with Outokumpu reporting that in June 2014 its lead times extended to *** weeks.58 Additionally, Outokumpu reported that it had a motor failure on one of its three cold‐rolling mills from June 2014 to December 2014 and that its other two cold‐rolling mills were down for two weeks in September 2014.59 NAS reported using ***.60 AK Steel reported that ***.61 Finally, Allegheny reported that in August 2015 it locked out union workers from all of its production facilities due to a labor dispute, but continued production using salaried and temporary employees.62 Allegheny reported that it also mitigated potential supply concerns by augmenting its inventories prior to this 2015 lockout.63
Respondents argue that because of the domestic industry’s production difficulties in 2014, lead times increased and purchasers perceived the domestic producers to be an unreliable source of supply.64 Consequently, they contend, purchasers turned to subject imports to satisfy their supply needs.65 By contrast, Petitioners maintain that extended lead
53 CR/PR at Table IV‐4. 54 CR/PR at Table IV‐4. 55 CR/PR at Table III‐1. 56 CR at II‐14, PR at II‐10. Domestic producers reported that 92.9 percent of their commercial
shipments were produced to order. Id. 57 CR at II‐5, PR at II‐3. 58 CR at II‐15, PR at II‐10. 59 CR at II‐5, PR at II‐3; CR at III‐6, PR at III‐4. 60 CR at II‐5, PR at II‐4. 61 CR at II‐5, PR at II‐4. 62 CR at III‐14, PR at III‐9. Although Allegheny announced plans to idle temporarily one of its
facilities in late 2015, it reported that ***. CR at II‐5, PR at II‐4. 63 CR at III‐14, PR at III‐9. 64 Respondents’ Postconference Brief at 6‐7. 65 Respondents’ Postconference Brief at 6‐7.

15
times did not lead to lost sales.66 They assert that, although production difficulties and an unusually large volume of orders may have extended lead times, they were nonetheless able to meet customer demands. 67 According to Petitioners, their lead times never exceeded those for subject imports.68
Subject import market share increased over the POI, from 3.3 percent in 2013 to 6.2 percent in 2014 and 7.4 percent in 2015, for an overall increase of 4.1 percentage points.69 By 2015, China was the largest single supplier of imports to the U.S. market.70
The market share of nonsubject imports decreased from 15.4 percent in 2013 to 14.9 percent in 2014, but then increased to 15.5 percent in 2015.71 The largest sources of nonsubject imports were Mexico and Taiwan.72 The market share of nonsubject imports from Mexico decreased over the POI from 4.8 percent in 2013 to 3.6 percent in 2015, while the market share of nonsubject imports from Taiwan increased from 1.9 percent in 2013 to 2.3 percent in 2015.73 Antidumping orders are currently in place on imports of SSSS from Japan, Korea, and Taiwan.74
3. Substitutability and Other Conditions
We find that there is a high degree of substitutability between domestically produced SSSS and subject imports and that price is an important factor in purchasing decisions. All U.S. producers and the majority of importers of SSSS reported that SSSS is *** interchangeable, regardless of source.75 They also reported that differences other than price were sometimes or never important in purchasing decisions.76 Purchasers that responded to the lost sales and lost revenue surveys most frequently reported price and quality among the top three factors considered in purchasing decisions.77
The raw materials used in the production of SSSS include alloying elements, such as chromium, nickel, and molybdenum.78 Prices for SSSS generally consist of a base price and a surcharge.79 Surcharges are typically adjusted monthly and generally reflect the price of alloying elements, but may also reflect energy costs.80 Base prices incorporate other inputs not
66 Petitioners’ Postconference Brief at 8‐9. 67 Petitioners’ Postconference Brief at 8‐9. 68 Petitioners’ Postconference Brief at 8‐9. 69 CR/PR at Table IV‐4. 70 CR/PR at Table IV‐4. 71 CR/PR at Table IV‐4. 72 CR/PR at Table IV‐4. 73 CR/PR at Table IV‐4. 74 CR at I‐6, PR at I‐4; CR/PR at Table I‐1. 75 CR/PR at Table II‐4. 76 CR/PR at Table II‐5. 77 CR at II‐16, PR at II‐11. 78 CR/PR at V‐1. 79 CR at V‐6, PR at V‐4. 80 CR at V‐7‐8, PR at V‐5.

16
included in surcharges, such as labor costs, industrial gases, acids, and all other components of conversion.81 The costs of nickel and molybdenum decreased overall during the POI by *** percent and *** percent, respectively, while the cost of chromium increased overall by *** percent during the POI.82 SSSS is sold both in the spot market and on a contract basis.83 The information available indicates that roughly half of domestic producers’ commercial shipments in 2015 occurred in the spot market, while importers reported selling a majority of their product through short‐term contracts.84
C. Volume of Subject Imports
Section 771(7)(C)(i) of the Tariff Act provides that the “Commission shall consider whether the volume of imports of the merchandise, or any increase in that volume, either in absolute terms or relative to production or consumption in the United States, is significant.”85
The volume of subject imports increased from 63,114 short tons in 2013 to 132,016 short tons in 2014 and 147,106 short tons in 2015, an increase of 133.1 percent from 2013 to 2015.86 Subject imports also increased as a share of apparent U.S. consumption, from 3.3 percent in 2013 to 6.2 percent in 2014 and 7.4 percent in 2015, an increase of 4.1 percentage points from 2013 to 2015.87 Subject imports’ gain in market share came at the expense of the domestic industry, which lost 4.3 percentage points of market share from 2013 to 2015.88 In light of the foregoing, we find that the volume of subject imports and the increase in that volume are significant in both absolute terms and relative to domestic consumption.
D. Price Effects of the Subject Imports
Section 771(7)(C)(ii) of the Tariff Act provides that, in evaluating the price effects of subject imports, the Commission shall consider whether –
(I) there has been significant price underselling by the imported merchandise as
compared with the price of domestic like products of the United States, and
81 CR at V‐8, PR at V‐5. We intend to explore further during any final phase of these
investigations how base prices are set and to what extent they are affected by changes in raw material costs, including whether they reflect raw material costs not encompassed by the surcharge, such as those for stainless steel scrap. We also intend to examine how the application of surcharges applies specifically to contract sales and spot sales.
82 CR at V‐3, PR at V‐2. 83 CR at V‐10‐11, PR at V‐6‐7. 84 CR at V‐11, PR at V‐7; CR/PR at Table V‐2. 85 19 U.S.C. § 1677(7)(C)(i). 86 CR/PR at Tables IV‐2. 87 CR/PR at Table IV‐5. 88 CR/PR at Table IV‐4. Nonsubject imports’ share of apparent U.S. consumption, after declining
from 15.4 percent in 2013 to 14.9 percent in 2014, increased to 15.5 percent in 2015. Id.

17
(II) the effect of imports of such merchandise otherwise depresses prices to a
significant degree or prevents price increases, which otherwise would have occurred, to a significant degree.89
As addressed in section VI.B.3 above, the record indicates that there is a high degree of
substitutability between subject imports and the domestic like product and that price is an important consideration in purchasing decisions.
All four domestic producers and six importers of subject merchandise provided usable data for four pricing products,90 although not all firms reported pricing data for all products for all quarters.91 The data show a mixed pattern of overselling and underselling by subject imports during the POI, with slightly more instances of overselling and a slightly higher total volume of underselling.92 Specifically, subject imports undersold the domestic like product in 21 of 43 quarterly comparisons, at margins ranging from 0.3 to *** percent, and oversold the domestic like product in the other 22 comparisons, at margins ranging from *** to *** percent.93 The average underselling margin was 5.4 percent, and the average overselling margin was *** percent.94 There were *** short tons of subject import shipments involved in the underselling comparisons and *** short tons involved in the overselling comparisons.95
We have also examined price trends. Prices for all four domestically produced pricing products generally declined during 2013. They rose in 2014, with prices for all four domestically produced products reaching their period peak during the third quarter of 2014.96 During the remainder of the POI, as the volume of subject imports was increasing, prices for all domestically produced pricing products declined; they reached period lows during the fourth quarter of 2015.97 We recognize that the U.S. producers’ raw material costs also declined
89 19 U.S.C. § 1677(7)(C)(ii). 90 CR at V‐13, PR at V‐9. Pricing product 1 is AISI Grade 304, 0.075 inch nominal thickness
(0.068‐0.082 inch actual), width 48‐60 inches, in coils, 2B finish. Product 2 is AISI Grade 304, 0.029 inch nominal thickness (0.0291‐0.032 inch actual), width 48‐60 inches, in coils, 2B finish. Product 3 is AISI Grade 304, 0.036 inch nominal thickness (0.032‐0.040 inch actual), width 48‐60 inches, in coils, 2B finish. Product 4 is AISI Grade 316L, 0.060 inch nominal thickness (0.054‐0.066 inch actual), width 48‐60 inches, in coils, 2B finish. Id.
91 CR at V‐13, PR at V‐9. Reported pricing data accounted for approximately 2.7 percent of the value of U.S. producers’ U.S. shipments and 9.4 percent of the value of U.S. commercial shipments of subject imports from China in 2015. Id. We invite parties, in commenting on draft questionnaires in any final phase of these investigations, to suggest pricing products that would increase the share of U.S. producers’ shipments and subject import shipments encompassed by reported pricing data.
92 CR/PR at Table V‐8. 93 CR/PR at Table V‐8. 94 CR/PR at Table V‐8. 95 CR/PR at Table V‐8. 96 CR/PR at Tables V‐3‐6. 97 CR/PR at Tables IV‐3‐4, V‐3‐6.

18
during the latter portion of the POI.98 The current record indicates that declining raw material costs would be reflected in changes to surcharges.99 Nevertheless, the base prices for each of the four domestic producers also declined during the POI.100 Consequently, it does not appear that changes in raw materials costs can fully explain the price declines for the domestically produced product observed during the latter portion of the POI.101
In response to the Commission’s survey regarding domestic producers’ allegations of lost sales and lost revenue, seven of the 14 responding purchasers reported that U.S. producers had reduced prices during the POI, by estimates ranging from 6.0 to 35.0 percent, to compete with subject imports; five of the 14 purchasers reported that they did not know if domestic producers had reduced prices to compete with subject imports.102 Eleven of the 14 responding purchasers reported that they had shifted purchases from U.S.‐produced SSSS to subject imports since 2013, with seven of these purchasers identifying price as the reason for the shift.103 As discussed in section VI.C. above, the record indicates that the subject imports gained market share at the expense of the domestic industry during the POI.
The record does not support Respondents’ contention that Outokumpu drove U.S. market prices downward by following a “fill the mill” strategy in which it cut prices in order to increase sales, production, and capacity utilization.104 Notably, for most of the POI, Outokumpu’s reported quarterly prices were not the lowest among the four domestic producers.105 Moreover, rather than increasing, Outokumpu’s production and capacity utilization declined between 2014 and 2015, and did so to a greater extent than did the production and capacity utilization of the industry as a whole.106
In light of the information in the record indicating mixed underselling, market share shifts, and declining prices during the POI while subject imports were increasing, as well as the
98 CR at V‐3‐5, PR at V‐2‐3; CR/PR at Figures V‐2‐3. See also CR/PR at Table VI‐2 (declining
average unit raw materials costs), CR/PR at Table VI‐1 (declining raw materials costs as a ratio to net sales).
99 CR at V‐7‐8, PR at V‐5. 100 CR at V‐8‐9, PR at V‐5‐6. 101 In any final phase of these investigations, we will examine the extent to which raw materials
costs declines were responsible for declines in prices, including base prices and prices for spot sales. 102 CR/PR at Table V‐11. 103 CR/PR at Table V‐10. We note that the total volume purchases reported to be shifted was
only *** short tons. Id. 104 Conference Transcript at 110 (Neeley); Respondents’ Postconference Brief at 1‐2, 8‐9, and
Exhibits 8 and 9. 105 See CR at V‐23 n.14, PR at V‐14 n.14; see also Producers Questionnaire responses at IV‐2(a). 106 Outokumpu’s production declined from *** short tons in 2014 to *** short tons in 2015, a
decline of *** percent. Outokumpu’s Producers Questionnaire response at II‐7. Production by the industry as a whole, in contrast, declined from 2.1 million short tons in 2014 to 1.8 million short tons in 2015, a decline of 14.2 percent. CR/PR at Table III‐2. Outokumpu’s capacity utilization declined by *** percentage points between 2014 and 2015, from *** percent to *** percent, whereas the capacity utilization of the industry as a whole declined by 10.5 percentage points, from 72.5 percent to 62.0 percent. Outokumpu’s Producers Questionnaire response at II‐7, CR/PR at Table III‐2.
19
information obtained from purchasers, we find for purposes of these preliminary determinations that the subject imports had significant effects on prices in the United States for the domestic like product.
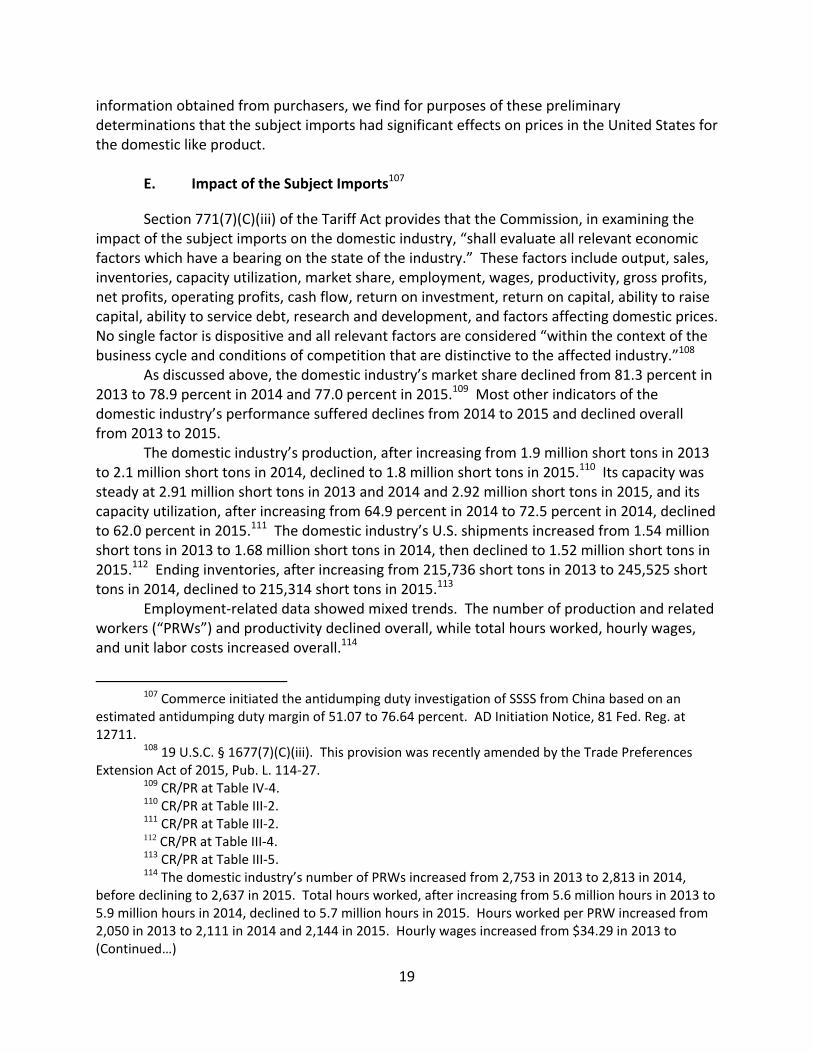
E. Impact of the Subject Imports107
Section 771(7)(C)(iii) of the Tariff Act provides that the Commission, in examining the impact of the subject imports on the domestic industry, “shall evaluate all relevant economic factors which have a bearing on the state of the industry.” These factors include output, sales, inventories, capacity utilization, market share, employment, wages, productivity, gross profits, net profits, operating profits, cash flow, return on investment, return on capital, ability to raise capital, ability to service debt, research and development, and factors affecting domestic prices. No single factor is dispositive and all relevant factors are considered “within the context of the business cycle and conditions of competition that are distinctive to the affected industry.”108
As discussed above, the domestic industry’s market share declined from 81.3 percent in 2013 to 78.9 percent in 2014 and 77.0 percent in 2015.109 Most other indicators of the domestic industry’s performance suffered declines from 2014 to 2015 and declined overall from 2013 to 2015.
The domestic industry’s production, after increasing from 1.9 million short tons in 2013 to 2.1 million short tons in 2014, declined to 1.8 million short tons in 2015.110 Its capacity was steady at 2.91 million short tons in 2013 and 2014 and 2.92 million short tons in 2015, and its capacity utilization, after increasing from 64.9 percent in 2014 to 72.5 percent in 2014, declined to 62.0 percent in 2015.111 The domestic industry’s U.S. shipments increased from 1.54 million short tons in 2013 to 1.68 million short tons in 2014, then declined to 1.52 million short tons in 2015.112 Ending inventories, after increasing from 215,736 short tons in 2013 to 245,525 short tons in 2014, declined to 215,314 short tons in 2015.113
Employment‐related data showed mixed trends. The number of production and related workers (“PRWs”) and productivity declined overall, while total hours worked, hourly wages, and unit labor costs increased overall.114
107 Commerce initiated the antidumping duty investigation of SSSS from China based on an
estimated antidumping duty margin of 51.07 to 76.64 percent. AD Initiation Notice, 81 Fed. Reg. at 12711.
108 19 U.S.C. § 1677(7)(C)(iii). This provision was recently amended by the Trade Preferences Extension Act of 2015, Pub. L. 114‐27.
109 CR/PR at Table IV‐4. 110 CR/PR at Table III‐2. 111 CR/PR at Table III‐2. 112 CR/PR at Table III‐4. 113 CR/PR at Table III‐5. 114 The domestic industry’s number of PRWs increased from 2,753 in 2013 to 2,813 in 2014,
before declining to 2,637 in 2015. Total hours worked, after increasing from 5.6 million hours in 2013 to 5.9 million hours in 2014, declined to 5.7 million hours in 2015. Hours worked per PRW increased from 2,050 in 2013 to 2,111 in 2014 and 2,144 in 2015. Hourly wages increased from $34.29 in 2013 to (Continued…)

20
The domestic industry’s unit net sales value and total net sales revenues increased in 2014 but declined thereafter and were lower in 2015 than in 2013 as prices declined and the domestic industry lost market share.115 The industry’s gross profit, operating income, and net income all followed similar trends.116 Its operating income as a share of net sales also declined from 2014 to 2015 and reached a period low in 2015.117 The industry’s capital expenditures declined from 2013 to 2015, and its research and development (“R&D”) expenditures increased.118
For purposes of these preliminary determinations, we find that subject imports had a significant impact on the domestic industry. The market share of subject imports increased significantly during the POI at the domestic industry’s expense. Declines in the domestic industry’s performance were particularly intense when the volume and market share of subject imports increased to a period high in 2015, despite declining apparent U.S. consumption. As a result of lost market share and declining prices, the domestic industry’s revenues were lower than they would have been otherwise during 2015. The lower revenues, in turn, resulted in negative gross profit, operating income, and net income, as well as lower output and employment, during 2015.
Respondents argue that subject imports were pulled into the U.S. market by the domestic industry’s supply constraints and extended lead times. As discussed in section VI.B.2 above, the record indicates that the domestic industry experienced some extended lead times in 2014. It is unclear, however, the extent to which the supply constraints impacted the market. NAS, the largest domestic producer, implemented ***.119 AK Steel, the second largest
(…Continued) $35.05 in 2014 and $36.41 in 2015. Productivity, after increasing from 334.6 short tons per 1,000 hours in 2013 to 355.3 short tons per 1,000 hours in 2013, declined to 320.1 short tons per 1,000 hours in 2015. Unit labor costs declined from $102.48 per short ton in 2013 to $98.64 per short ton in 2014, before increasing to $113.77 per short ton in 2015. CR/PR at Table III‐6.
115 CR/PR at Table VI‐1. The domestic industry’s total net sales, after increasing from $4.1 billion in 2013 to $4.9 billion in 2014, declined to $3.6 billion in 2015. CR/PR at Table VI‐1. Its average unit net sales value increased from $2,194 in 2013 to $2,340 in 2014, then declined to $1,983 in 2015. Id.
116 Gross profit, after improving from $29.6 million in 2013 to $230.0 million in 2014, deteriorated to a loss of $33.6 million in 2015. Operating income, after improving from a loss of $96.9 million in 2013 to income of $84.8 million in 2014, declined to a loss of $149.7 million in 2015. Similarly, net income, after improving from a loss of $147.2 million in 2013 to income of $33.2 million in 2014, deteriorated to a loss of $273.1 million in 2015. CR/PR at Table VI‐1.
117 The domestic industry’s operating income as a share of net sales, after improving from negative 2.4 percent in 2013 to positive 1.7 percent in 2014, declined to negative 4.1 percent in 2015. CR/PR at Table VI‐1.
118 The domestic industry’s capital expenditures declined from $*** in 2013 to $*** in 2014 and $*** in 2015. CR/PR at Table VI‐4. The industry’s research and development expenses declined from $*** in 2013 to $*** in 2014, before increasing to $*** in 2015. Id.
119 CR at II‐5, PR at II‐4.

domesticproducerdeliverieutilizatio*** prodMoreovebecause discussedconcessioimports b
Wimports iimports, imports aproduct.1
financial
CVII.
Foindustry are allegethe gove
12
tons in 20Steel’s Pro
12
short tons2014. Ou
12
12
but that mCR/PR at Tfrom purcaffected p
12
Commissiinformatioprice beninvestigatthan did i
12
12
c producer, *rs, had prods during 201n substantiaducer, tempoer, respondeof domesticd above indions from dobecause of pWe have alsoincreased in declined as also were ge126 The obseperformanc
Conclusion
or the reasoin the Uniteedly sold in trnment of C
20 CR at II‐5, P014, and its caoducers Ques21 CR at II‐5, Ps in 2014, andtokumpu’s P22 CR at II‐5, P23 We note thmonthly subjeTable D‐1. Inchasers on hopurchasing de24 For purposeoner Kieff finon in this preefit to the dotion. Importsmports from 25 CR/PR at Ta26 CR/PR at Ta
***, but repuction diffic14, but was nally that yearorarily idled ents’ assertioc industry sucating that pmestic prodprice.123 o examined tabsolute tea share of aenerally priceerved declince conseque
ons stated abd States is mthe United SChina.
PR at II‐4. AK apacity utilizastionnaire resPR at II‐3‐4. Od its capacity roducers QuePR at II‐4. at monthly dect import von any final phaow domestic pecisions. es of the consnd that, regardeliminary phasomestic industs from nonsubChina. CR/PRable IV‐2. able E‐3.
orted that itulties that hnonethelessr and returnits Midland,ons that subjpply difficultpurchasers uducers and th
the role of nrms by far lepparent U.Sed higher thes in the dontly cannot
bove, we detmaterially injStates at less
Steel’s produation increasesponse at II‐7Outokumpu’s utilization incestionnaire Re
ata indicate tlume remainase of these iproducers’ pr
siderations redless of whetse of the invetry if subject bject country R at Table E‐3
21
t ***.120 Ouhad a negativ able to incr to full oper, Pennsylvanject importsties does noused subjecthat purchase
onsubject imess than did S. consumptihan both submestic indusbe explained
termine thatjured by reas than fair va
uction increased from *** p. production increased fromesponse at II‐
that subject imed higher thanvestigationsroduction con
equired by Brather the otheestigation indimports had Mexico gene3.
tokumpu, thve impact onrease its proations in Denia facility ins were pulledot comport wt import pricers increase
mports.124 Tsubject impion during thbject importsstry’s marked by nonsub
t there is a rson of impoalue and tha
sed from ***percent in 201
ncreased fromm *** percent ‐7.
mports declinan in the corrs, we will seenstraints and
ratsk/Mittal, Vr factors are icates that thexited the maerally sold at h
he *** of then a certain nduction andecember 201 late 2015, bd into the mwith the infocing to obtaid purchases
The volume oports and, unhe POI.125 Ns and the doet share, revbject imports
reasonable iorts of SSSS fat are alleged
short tons in13 to *** per
m *** short t in 2013 to **
ned in the secesponding mk more speciflead times du
Vice Chairmasatisfied, thehere likely woarket during thigher prices
e four number of itsd capacity 14.121 Alleghbut ***.122 arket in 201
ormation n price s of subject
of nonsubjecnlike subjectNonsubject omestic like enues, and s.
ndication thfrom China tdly subsidize
2013 to ***rcent in 2014
ons in 2013 t** percent in
cond part of 2onths of 2013fic informatiouring the POI
n Pinkert ande available ould have beethe period ofin the U.S. m
s
heny,
14
ct t
hat an that ed by
short . AK
o ***
2015, 3. on
d
en a f market


I‐1
PART I: INTRODUCTION
BACKGROUND
These investigations result from petitions filed on February 12, 2016, by AK Steel Corp., West Chester, Ohio (“AK Steel”); Allegheny Ludlum, LLC d/b/a ATI Flat Rolled Products, Pittsburgh, Pennsylvania (“Allegheny”); North American Stainless, Inc., Ghent, Kentucky (“NAS”); and Outokumpu Stainless USA, LLC, Bannockburn, Illinois (“Outokumpu”), alleging that an industry in the United States is materially injured and threatened with material injury by reason of imports from China of stainless steel sheet and strip1 that are allegedly sold in the United States at less‐than‐fair‐value (“LTFV”) and allegedly subsidized by the government of China. The following tabulation provides information relating to the background of these investigations.2 3
Effective date Action
February 12, 2016 Petition filed with Commerce and the Commission; institution of Commission investigations (81 FR 8544, February 19, 2016)
March 3, 2016 Commerce’s notice of initiation of antidumping investigation (81 FR 12711, March 10, 2016)
March 3, 2016 Commerce’s notice of initiation of countervailing duty investigation (81 FR 13322, March 14, 2016)
March 4, 2016 Commission’s conference
March 25, 2016 Commission’s vote
March 28, 2016 Commission’s determinations
April 4, 2016 Commission’s views
STATUTORY CRITERIA AND ORGANIZATION OF THE REPORT
Statutory criteria
Section 771(7)(B) of the Tariff Act of 1930 (the “Act”) (19 U.S.C. § 1677(7)(B)) provides that in making its determinations of injury to an industry in the United States, the Commission—
shall consider (I) the volume of imports of the subject merchandise, (II) the effect of imports of that merchandise on prices in the United States for domestic like products, and (III) the impact of imports of such
1 See the section entitled “The Subject Merchandise” in Part I of this report for a complete description of the merchandise subject to this proceeding.
2 Pertinent Federal Register notices are referenced in appendix A, and may be found at the Commission’s website (www.usitc.gov).
3 A list of witnesses appearing at the conference is presented in appendix B of this report.

I‐2
merchandise on domestic producers of domestic like products, but only in the context of production operations within the United States; and. . . may consider such other economic factors as are relevant to the determination regarding whether there is material injury by reason of imports.
Section 771(7)(C) of the Act (19 U.S.C. § 1677(7)(C)) further provides that‐—
In evaluating the volume of imports of merchandise, the Commission shall consider whether the volume of imports of the merchandise, or any increase in that volume, either in absolute terms or relative to production or consumption in the United States is significant.. . .In evaluating the effect of imports of such merchandise on prices, the Commission shall consider whether. . .(I) there has been significant price underselling by the imported merchandise as compared with the price of domestic like products of the United States, and (II) the effect of imports of such merchandise otherwise depresses prices to a significant degree or prevents price increases, which otherwise would have occurred, to a significant degree.. . . In examining the impact required to be considered under subparagraph (B)(i)(III), the Commission shall evaluate (within the context of the business cycle and conditions of competition that are distinctive to the affected industry) all relevant economic factors which have a bearing on the state of the industry in the United States, including, but not limited to. . . (I) actual and potential decline in output, sales, market share, gross profits, operating profits, net profits, ability to service debt, productivity, return on investments, return on assets, and utilization of capacity, (II) factors affecting domestic prices, (III) actual and potential negative effects on cash flow, inventories, employment, wages, growth, ability to raise capital, and investment, (IV) actual and potential negative effects on the existing development and production efforts of the domestic industry, including efforts to develop a derivative or more advanced version of the domestic like product, and (V) in {an antidumping investigation}, the magnitude of the margin of dumping.
In addition, Section 771(7)(J) of the Act (19 U.S.C. § 1677(7)(J)) provides that—4 (J) EFFECT OF PROFITABILITY.—The Commission may not determine that there is no material injury or threat of material injury to an industry in the United States merely because that industry is profitable or because the performance of that industry has recently improved.
4 Amended by PL 114‐27 (as signed, June 29, 2015), Trade Preferences Extension Act of 2015.

I‐3
Organization of report
Part I of this report presents information on the subject merchandise, alleged dumping and subsidy margins, and domestic like product. Part II of this report presents information on conditions of competition and other relevant economic factors. Part III presents information on the condition of the U.S. industry, including data on capacity, production, shipments, inventories, and employment. Parts IV and V present the volume of subject imports and pricing of domestic and imported products, respectively. Part VI presents information on the financial experience of U.S. producers. Part VII presents the statutory requirements and information obtained for use in the Commission’s consideration of the question of threat of material injury as well as information regarding nonsubject countries.
MARKET SUMMARY
The U.S. market for stainless steel sheet and strip totaled $4.1 billion and 2.0 million short tons in 2015. AK Steel, Allegheny, NAS, and Outokumpu accounted for virtually all U.S. production of stainless steel sheet and strip in the United States during 2013‐15. Fourteen firms reported importing stainless steel sheet and strip from China and nonsubject countries during this period, the largest of which were ***.
U.S. producers’ U.S. shipments of stainless steel sheet and strip totaled 1.5 million short tons valued at $3.0 billion in 2015, and accounted for 77.0 percent of apparent U.S. consumption based on quantity (73.9 percent based on value). U.S. imports from China totaled 147,106 short tons valued at $312.2 million in 2015, and accounted for 7.4 percent of apparent U.S. consumption based on quantity (7.6 percent based on value). U.S. imports from all other sources combined totaled 306,709 short tons in 2015 valued at $764.7 million, and accounted for 15.5 percent of apparent consumption by quantity (18.6 percent by value).
SUMMARY DATA AND DATA SOURCES
Appendix C, table C‐1, presents a summary of data collected in these investigations. U.S. industry data are based on questionnaire responses from four U.S. producers that accounted for virtually all of U.S. production of stainless steel sheet and strip in 2015.5 Data for U.S. imports from China and nonsubject countries are based on official import statistics from Commerce.6 7 U.S. imports from China reported in submitted U.S. importer questionnaires
5 Petitioners estimated that the four petitioning U.S. producers accounted for *** percent of total production in 2015 and the remaining *** percent may be produced by one or more of the following four firms, which were listed in the petition: (1) Elgiloy Specialty Metals, Inc.; (2) Nucor Corp. (3) Precision Specialty Metals, Inc.; (4) Ulbrich Stainless Steel & Specialty Metals, Inc. These firms are not integrated producers of stainless steel sheet and strip but rather “re‐rollers” of the subject product. See Part III, infra, U.S. producers.
6 Official import statistics have a coverage ratio of over 99.0 percent for stainless steel sheet and strip. Petitioners estimated that products outside the scope of these investigations that may be included in the HTS subheading used to compile data on U.S. imports of the subject product accounted
(continued...)

I‐4
accounted for approximately *** percent of total U.S. imports from China countries in 2015.8 U.S. imports from nonsubject countries reported in submitted U.S. importer questionnaires accounted for approximately *** percent of total U.S. imports from nonsubject countries in 2015.9 Information on the industry that produces stainless steel sheet and strip in China is based on questionnaire responses from seven foreign producers and exporters from China and publicly available data. The seven responding producers in China accounted for approximately *** percent of total 2015 production of stainless steel sheet and strip in China10 and approximately 66.0 percent of total exports to the United States in 2015.11
PREVIOUS AND RELATED INVESTIGATIONS
Stainless steel sheet and strip has been the subject of prior antidumping, countervailing duty, and safeguard investigations in the United States. The most recent investigations took place in 1998 and resulted in antidumping and countervailing duty orders on U.S. imports stainless steel sheet and strip from France, Germany, Italy, Japan, Korea, Mexico, Taiwan, and the United Kingdom. The Commission conducted its most recent reviews on a number of these orders in 201112 and determined that revocation of the antidumping duty orders on stainless steel sheet and strip from Germany, Italy, and Mexico would not be likely to lead to continuation or recurrence of material injury to an industry in the United States.13 Orders on U.S. imports of stainless steel sheet and strip from Japan, Korea, and Taiwan are still in place
(…continued) for less than one percent of total volume. Conference transcript, pp. 58‐59 (Cannon); Petitioners’ postconference brief, pp. 14‐15.
7 Monthly U.S. import data are presented in Appendix D. 8 In 2015, U.S. imports from China as reported in U.S. importer questionnaires submitted to the
Commission equaled *** short tons whereas official import statistics equaled 147,106 short tons (***). 9 In 2015, U.S. imports from nonsubject countries as reported in U.S. importer questionnaires
submitted to the Commission equaled *** short tons whereas official import statistics equaled 306,709 short tons (***).
10 In 2015, the seven responding Chinese producers reported total capacity of 5.1 million short tons whereas ***.
11 Based on official Chinese export statistics, responding foreign producers from China accounted for 66.0 percent of total exports to the United States (81,266/123,093=0.660) in 2015. Respondents estimated that responding foreign producers in China accounted for *** percent of all exports to the United States in 2014, the year in which U.S. imports peaked and *** percent of total exports over 2013‐15. Respondents’ postconference brief, p. 1.
12 By 2011, Commerce had revoked the countervailing duty order on France and the Commission, in its first reviews, had determined that revocation of the antidumping duty orders on France and the United Kingdom would not be likely to lead to continuation or recurrence of material injury. Stainless Steel Sheet and Strip in Coils From France: Notice of Amended Final Determination Pursuant to Final Court Decision and Revocation of Order, 69 FR 53415, September 1, 2004; Certain Stainless Steel Sheet and Strip from France, Germany, Italy, Japan, Korea, Mexico, Taiwan, and The United Kingdom, Inv. Nos. 701‐TA‐381‐382 and 731‐TA‐797‐804 (Review), USITC Publication 3788, July 2005.
13 Stainless Steel Sheet and Strip from Germany, Italy, Japan, Korea, Mexico, Taiwan, Inv. Nos. 701‐TA‐382 and 731‐TA‐798‐803 (Second Review), USITC Publication 4244, July 2011.

I‐5
and are scheduled to be reviewed by the Commission in June 2016. Table I‐1 presents all the prior Commission investigations on stainless steel sheet and strip.
Table I‐1
Stainless steel sheet and strip: Previous Commission investigations on stainless steel sheet and strip
Item/sources Inv. No. Year Report No. Action/status Stainless steel sheet and strip,
cold‐rolled, from France
AD‐126 1973 TC 615 Negative
Stainless steel and alloy tool steel
TA‐201‐5 1976 USITC 756 3‐year VRA
(6/14/76‐6/13/79) Stainless steel and alloy tool steel
TA‐203‐3 1977 USITC 838 Probable economic effect if the relief provided by Presidential Proclamation 4445, as modified by Proclamation 4477, were to be reduced or revoked
Stainless steel and alloy tool
steel TA‐201‐48 1983 USITC 1377 4‐year import relief
(quotas and tariffs) Stainless steel sheet and strip from Germany
731‐TA‐92 1983 USITC 1391 Affirmative
Order date: 6/23/83
Revocation date: 8/11/86 Stainless steel sheet and strip
from France 731‐TA‐95 1983 USITC 1391 Affirmative
Order date: 6/22/83
Revocation date: 8/11/86 Stainless steel sheet and strip from the United Kingdom
701‐TA‐195 1983 USITC 1391 Negative
Stainless steel sheet and strip,
cold‐rolled, from Spain 731‐TA‐164 1984 USITC 1593 Negative
Stainless steel sheet and strip from France
701‐TA‐380 1998 USITC 3208 AffirmativeOrder date: 8/6/99 Revocation date: 8/4/05
Stainless steel sheet and strip from France
731‐TA‐797 1998 USITC 3208 AffirmativeOrder date: 7/27/99 Revocation date: 8/4/05
Stainless steel sheet and strip from Germany
731‐TA‐798 1998 USITC 3208 AffirmativeOrder date: 8/6/99 Revocation date: 7/25/11
Stainless steel sheet and strip from Italy
701‐TA‐381 1998 USITC 3208 AffirmativeOrder date: 7/27/99 Revocation date: 3/28/06
Stainless steel sheet and strip from Italy
731‐TA‐799 1998 USITC 3208 AffirmativeOrder date: 7/27/99 Revocation date: 7/25/11
Stainless steel sheet and strip from Japan
731‐TA‐800 1998 USITC 3208 AffirmativeOrder date: 7/27/99 Order in place; continued 8/11/11
Stainless steel sheet and strip from Korea
701‐TA‐382 1998 USITC 3208 AffirmativeOrder date: 8/6/99 Order in place; continued 8/11/11
Stainless steel sheet and strip from Korea
731‐TA‐801 1998 USITC 3208 AffirmativeOrder date: 7/27/99 Order in place; continued 8/11/11
Table continued.

I‐6
Stainless steel sheet and strip from Mexico
731‐TA‐802 1998 USITC 3208 AffirmativeOrder date: 7/27/99 Revocation date: 7/25/11
Stainless steel sheet and strip from Taiwan
731‐TA‐803 1998 USITC 3208 AffirmativeOrder date: 7/27/99 Order in place; continued 8/11/11
Stainless steel sheet and strip from the United Kingdom
731‐TA‐804 1998 USITC 3208 AffirmativeOrder date: 7/27/99 Revocation date: 8/4/05
Note.‐‐Shaded rows indicate antidumping or countervailing duty orders currently still in place. Source: U.S. International Trade Commission publications.
NATURE AND EXTENT OF SUBSIDIES AND SALES AT LTFV
Subsidies
On March 14, 2016, Commerce published a notice in the Federal Register of the initiation of its countervailing duty investigation on stainless steel sheet and strip from China.14
14 Stainless Steel Sheet and Strip From the People's Republic of China: Initiation of Countervailing Duty Investigation, 81 FR 13322 March 14, 2016. Commerce initiated its investigation on the following 42 programs: (1) Policy Loans to the Stainless Sheet and Strip Industry; (2) Preferential Loans for State‐Owned Enterprises (“SOEs”); (3) Preferential Loans for Key Projects and Technologies; (4) Preferential Lending to Stainless Sheet and Strip Producers and Exporters Classified As “Honorable Enterprises”; (5) Export Loans; (6) Export Seller's Credits; (7) Export Buyer's Credits; (8) Export Credit Guarantees; (9) Treasury Bond Loans; (10) Loans and Interest Subsidies Provided Pursuant to the Northeast Revitalization Program; (11) Debt‐to‐Equity Swaps; (12) Equity Infusions; (13) Exemptions for SOEs from Distributing Dividends; (14) Loan and/or Interest Forgiveness for SOEs; (15) Income Tax Reductions for High and New Technology Enterprises; (16) Enterprise Tax Law Research and Development Program; (17) Income Tax Reductions and Exemptions for HNTEs in Designated Zones; (18) Income Tax Deductions for Enterprises Engaged in Comprehensive Resource Utilization; (19) Income Tax Deductions/Credits for Purchase of Special Equipment; (20) Income Tax Credits for Domestically‐Owned Companies Purchasing Domestically Produced Equipment; (21) Reduction in or Exemption from Fixed Assets Investment Orientation Regulatory Tax; (22) Income Tax Benefits for Domestically‐Owned Enterprises Engaging in Research and Development; (23) Preferential Income Tax Policy for Enterprises in the Northeast Region; (24) Import Tariff and VAT Exemptions for Foreign‐Invested Enterprises (“FIEs”) and Certain Domestic Enterprises Using Imported Equipment in Encouraged Industries; (25) Stamp Tax Exemption on Share Transfer Under Non‐Tradeable Share Reform; (26) Deed Tax Exemption for SOEs Undergoing Mergers or Restructuring; (27) VAT and Tariff Exemptions for Purchasers of Fixed Assets Under the Foreign Trade Development Fund; (28) Provision of Land to SOEs for Less Than Adequate Remuneration (“LTAR”); (29) Provision of Iron Ore for LTAR; (30) Provision of Coking Coal for LTAR; (31) Provision of Steam Coal for LTAR; (32) Provision of Nickel/Nickel Pig Iron for LTAR; (33) Provision of Ferrochrome/Chromium for LTAR; (34) Provision of Electricity for LTAR; (35) Subsidies for Development of Famous Brands and China World Top Brands; (36) State Key Technology Project Fund; (37) Grants for Energy Conservation and Emission Reduction; (38) Grants for the Retirement of Capacity; (39) Grants for Relocating Production Facilities; (40) Export Assistance Grants; (41) Grants to Baoshan; and (42) Grants to TISCO.

I‐7
Table I‐2 presents Commerce’s initial findings of subsidization of stainless steel sheet and strip by the government of China.
Table I‐2 Stainless steel sheet and strip: Commerce’s preliminary countervailing duty margins with respect to imports from China
Country Estimated countervailing duty margin
(percent)
China Above de minimis
Source: Stainless Steel Sheet and Strip From the People's Republic of China: Initiation of Countervailing Duty Investigation, 81 FR 13322 March 14, 2016.
Sales at LTFV
On March 10, 2016, Commerce published a notice in the Federal Register of the initiation of its antidumping investigation on stainless steel sheet and strip from China.15 The alleged estimated weighted‐average dumping margins (in percent ad valorem), as reported by Commerce are summarized in table I‐3.
Table I‐3 Stainless steel sheet and strip: Commerce’s preliminary weighted‐average LTFV margins with respect to imports from China
Country Estimated dumping margin
(percent)
China 51.07 to 76.64
Source: Stainless Steel Sheet and Strip From the People's Republic of China: Initiation of Less Than Fair Value Investigation, 81 FR 12711, March 10, 2016.
THE SUBJECT MERCHANDISE
Commerce’s scope
Commerce has defined the scope of these investigations as follows:
The merchandise covered by these investigations is stainless steel sheet and strip, whether in coils or straight lengths. Stainless steel is an alloy steel containing, by weight, 1.2 percent or less of carbon and 10.5 percent or more of chromium, with or without other elements. The subject sheet and strip is a flat‐rolled product – either in coils or straight lengths ‐ with a width that is greater than 9.5 mm and with a thickness of 0.3048 mm
15 Stainless Steel Sheet and Strip From the People's Republic of China: Initiation of Less Than Fair Value Investigation, 81 FR 12711, March 10, 2016.

I‐8
and greater but less than 4.75 mm, and that is annealed or otherwise heat treated and pickled or otherwise descaled. The subject sheet and strip may also be further processed (e.g., cold‐rolled, annealed, tempered, polished, aluminized, coated, painted, varnished, trimmed, cut, punched, or slit, etc.) provided that it maintains the specific dimensions of sheet and strip following such processing. The products described above may be rectangular, square, circular, or other shape and include products of either rectangular or non‐rectangular cross‐section where such cross‐section is achieved subsequent to the rolling process, i.e., products which have been "worked after rolling" (e.g., products which have been beveled or rounded at the edges). For purposes of the width and thickness requirements referenced above: (1) Where the nominal and actual measurements vary, a product is within the scope if application of either the nominal or actual measurement would place it within the scope based on the definitions set forth above; and (2) where the width and thickness vary for a specific product (e.g., the thickness of certain products with non‐rectangular cross‐section, the width of certain products with non‐rectangular shape, etc.), the measurement at its greatest width or thickness applies. All products that meet the written physical description, and in which the chemistry quantities do not exceed any one of the noted element levels listed above, are within the scope of these investigations unless specifically excluded. Subject merchandise includes stainless steel sheet and strip that has been further processed in a third country, including but not limited to cold‐rolling, annealing, tempering, polishing, aluminizing, coating, painting, varnishing, trimming, cutting, punching, and/or slitting, or any other processing that would not otherwise remove the merchandise from the scope of the investigation if performed in the country of manufacture of the stainless steel sheet and strip. Excluded from the scope of these investigations are the following: (1) sheet and strip that is not annealed or otherwise heat treated and not pickled or otherwise descaled; (2) plate (i.e., flat‐rolled stainless steel products of a thickness of 4.75 mm or more); and (3) flat wire (i.e., cold‐rolled sections, with a prepared edge, rectangular in shape, of a width of not more than 9.5 mm).16
16 Stainless Steel Sheet and Strip From the People's Republic of China: Initiation of Countervailing Duty Investigation, 81 FR 13322 March 14, 2016. On February 19, 2016, Petitioners amended the scope of these investigations in response to issues raised by Commerce. Among the changes were the deletion of three HTS statistical reporting numbers that covered thin gauge sheet and strip that the scope explicitly excluded (HTS 7220.20.8000, 7220.20.9030, and 7220.20.9060. Petitioners' Responses to Department's
(continued...)

I‐9
The scope of these investigations differs from the prior investigations on stainless steel
sheet and strip conducted by the Commission in 1998. In the prior investigations, the scope did not include a minimum required thickness or gauge and included the following excluded products:
(1) sheet and strip that is not annealed or otherwise heat treated and pickled or otherwise descaled, (2) sheet and strip that is cut to length, (3) plate (i.e., flat‐rolled stainless steel products of a thickness of 4.75 mm or more), (4) flat wire (i.e., cold‐rolled sections, with a prepared edge, rectangular in shape, of a width of not more than 9.5 mm), (5) razor blade steel, (6) flapper valve steel, (7) suspension foil, (8) certain stainless steel foil for automotive catalytic converters, (9) permanent magnet iron‐chromium‐cobalt alloy stainless strip, (10) certain electrical resistance alloy steel, (11) certain martensitic precipitation‐hardenable stainless steel, and (12) three specialty stainless steels typically used in certain industrial blades and surgical and medication instruments17
The scope in the present investigations does include a minimum thickness or gauge by requiring in‐scope product to have a thickness of 0.3048 mm or greater and only lists three exclusions: (1) sheet and strip that is not heat‐treated and/or de‐scaled; (2) plate; and (3) flat wire. Petitioners stated that the two scope definitions are largely the same and that the minimum thickness requirement excludes many of the products that were listed as specific exclusions in the prior investigation, including the foil and razor blade steel products.18 Petitioners stated that U.S. imports of these products were minimal and their presence has not caused material injury to the domestic industry.19 In addition, the scope in the prior investigations did not include stainless steel sheet and strip that had been cut‐to‐length. Petitioners stated that they specifically did not exclude this product in the current investigations after experiencing what they described as “circumvention concerns” with the prior orders on the subject product.20
(…continued) Questions on General and Injury Volume of Petition and Amendment to Petition to Modify Scope Language, February 19, 2016, exh. Gen‐Supp.‐2; Petitioners’ postconference brief, exh. 1, p. 3.
17 Stainless Steel Sheet and Strip from Germany, Italy, Japan, Korea, Mexico, Taiwan, Inv. Nos. 701‐TA‐382 and 731‐TA‐798‐803 (Second Review), USITC Publication 4244, July 2011, p. I‐23‐I‐24.
18 Petitioners’ postconference brief, p. 3. 19 Ibid., exh. 1, p. 3 20 Ibid., p. 3; Conference transcript, p. 60 (Cannon).

I‐10
Tariff treatment
Stainless steel sheet and strip are classifiable in subheadings 7219.13.00, 7219.14.00, 7219.23.00, 7219.24.00, 7219.32.00, 7219.33.00, 7219.34.00, 7219.35.00, 7219.90.00, 7220.12.10, 7220.12.50, 7220.20.10, 7220.20.60, 7220.20.70, 7220.20.80, 7220.20.90, and 7220.90.00 of the Harmonized Tariff Schedule of the United States (“HTS”).21 The general duty rate for each of these HTS subheadings is free.22
Physical characteristics and uses23
Physical characteristics
The stainless steel sheet and strip subject to these investigations are flat‐rolled stainless steel products, less than 4.75 mm in thickness, at least 0.3048 mm in thickness, at least 9.5 mm in width, that are annealed (heat‐treated) and pickled (subjected to an acid rinse to remove surface scale).24
Sheet and strip are distinguished from one another by width. Sheet is 24 inches or greater in width; strip is less than 24 inches in width (table I‐4). Stainless steel is a low carbon steel which contains 10.5 percent or more chromium by weight. The addition of chromium gives the steel its corrosion resisting properties. Other alloying elements can be added to impart various characteristics, but all stainless steels contain chromium at a minimum.
21 The petitions stated that stainless steel sheet and strip is imported under HTS statistical reporting numbers: 7219.13.0031, 7219.13.0051, 7219.13.0071, 7219.13.0081, 7219.14.0030, 7219.14.0065, 7219.14.0090, 7219.23.0030, 7219.23.0060, 7219.24.0030, 7219.24.0060, 7219.32.0005, 7219.32.0020, 7219.32.0025, 7219.32.0035, 7219.32.0036, 7219.32.0038, 7219.32.0042, 7219.32.0044, 7219.32.0045, 7219.32.0060, 7219.33.0005, 7219.33.0020, 7219.33.0025, 7219.33.0035, 7219.33.0036, 7219.33.0038, 7219.33.0042, 7219.33.0044, 7219.33.0045, 7219.33.0070, 7219.33.0080, 7219.34.0005, 7219.34.0020, 7219.34.0025, 7219.34.0030, 7219.34.0035, 7219.34.0050, 7219.35.0005, 7219.35.0015, 7219.35.0030, 7219.35.0035, 7219.35.0050, 7219.90.0010, 7219.90.0020, 7219.90.0025, 7219.90.0060, 7219.90.0080, 7220.12.1000, 7220.12.5000, 7220.20.1010, 7220.20.1015, 7220.20.1060, 7220.20.1080, 7220.20.6005, 7220.20.6010, 7220.20.6015, 7220.20.6060, 7220.20.6080, 7220.20.7005, 7220.20.7010, 7220.20.7015, 7220.20.7060, 7220.20.7080, 7220.90.0010, 7220.90.0015, 7220.90.0060, and 7220.90.0080. Petitioners' Responses to Department's Questions on General and Injury Volume of Petition and Amendment to Petition to Modify Scope Language, February 19, 2016, exh. Gen‐Supp.‐2.
22 Harmonized Tariff Schedule of the United States (2016). 23 Unless otherwise noted, information in this section was obtained from Stainless Steel Sheet and
Strip from Germany, Italy, Japan, Korea, Mexico, and Taiwan, Invs. Nos. 701‐TA‐382 and 731‐TA‐798‐803 (Second Review), USITC Publication 4244, July 2011, pp. I‐24—I‐27.
24 Hot‐rolled black band (“HRB”), the intermediate stainless flat‐rolled product produced after stainless steel slab is rolled but before the rolled material is annealed and pickled, is not within the product scope.

I‐11
Table I‐4
Stainless steel flat products: Various forms and their definitions Item
Definition Relation to product scope
Sheet
Under 3/16 inches (4.75 mm) in thickness and 24 inches (610 mm) and over in width.
Sheet is within the product scope if it is of a thickness of at least 0.3048 mm.
Strip
Under 3/16 inches (4.75 mm) in thickness and is under 24 inches (610 mm) in width.
Strip is within the product scope if it is of a thickness of at least 0.3048 mm (0.012 inches) and a width of a least 9.5 mm (0.374 inches).
Foil
Maximum width of .005 inches. Foil is outside the product scope.
Plate
More than ten inches (254 mm) wide with a thickness ranging from 3/16 of an inch (4.75 mm) and over.
Plate is outside of the product scope.
Source: Specialty Steel Industry of North America, “Stainless Steel Overview: Definition of Terms,” http://www.ssina.com/overview/glossary.html, retrieved March 8, 2016.
There are many different stainless steel alloys, each with its own characteristics. The
broad metallurgical groupings are austenitic, ferritic, martensitic, precipitation‐hardening, and (table I‐5). The precipitation‐hardening and duplex types are less widely used than the others. Each alloying element imparts certain characteristics to the steel (table I‐6). The higher‐volume “commodity” grades of stainless steel sheet and strip are 301, 304, 316, 430, and 409.25
25 Conference transcript, p. 47 (Pfeiffer).

I‐12
Table I‐5
Stainless steel: Stainless steel classes and their most important grades Class Composition Characteristics Common applications
Austenitic Iron‐Chromium‐Manganese or Iron‐Chromium‐Nickel
Molybdenum is added to some grades for additional resistance to chlorides. In some alloys, nitrogen may be added to improve strength and corrosion resistance
Commonly used grades:
Grades 301, 304, and 316. Grades 304 and 316 are the most widely‐used stainless steel grades.
Excellent corrosion resistance
Non‐magnetic
Good high and low temperature mechanical properties
Excellent formability and weldability
All common finishes can be applied
Cookware, Flatware, Automotive wiper arms, Hardware, hinges, Entry Doors, Chemical processing equipment, Storage tanks, Chemical transportation tanks, Food processing equipment, Oil refining equipment
Ferritic Iron‐Chromium
Commonly used grades:
409 and 430
Good corrosion resistance
Magnetic
Limited temperature use
Can be polished
Automotive exhaust systems, Fins for heater tubes, Smoke control ductwork, Transformer and capacitor cases, Architectural applications (interior), Automotive trim, Cooking utensils, Food processing equipment
Martensitic Iron‐Chromium‐Carbon
Commonly used grades:
410, 420 and 440
Adequate corrosion resistance
Magnetic
Somewhat limited temperature use
Limited weldability
Fasteners, pump shafts, turbine blades, surgical instruments, cutlery
Precipitation Hardening Steels
Iron‐Chromium‐Nickel
Some grades may contain other elements such as molybdenum, aluminum, copper, rare earth elements and nitrogen.
Good corrosion resistance Characterized by ease of fabrication
Valves, gears, and petrochemical equipment
Duplex Iron‐Chromium‐Nickel‐Nitrogen
Combine both the austenitic and ferritic metallurgical structures
Some grades also contain molybdenum
Magnetic
Offer increased tensile and yield strength over the other categories
More resistant to stress corrosion cracking than austenitic, yet tougher than ferritic alloys.
Pipelines, pressure shafting, structural components, and industrial tanks
Source: Special Steel Industry of North America, “Stainless Steel Overview: Alloy Classifications,” http://www.ssina.com/overview/alloy‐families.html, “Stainless Steel Overview: Applications,” http://www.ssina.com/overview/sheetstrip.html, retrieved March 9, 2016.

I‐13
Table I‐6
Stainless steel sheet and strip: Properties imparted by common alloying elements
Alloying element Properties imparted
Chromium ‐Resists rust
Nickel ‐Increases ductility‐Increases toughness ‐Increases corrosion resistance to acids ‐Creates non‐magnetic structure
Molybdenum ‐Increases pitting and crevice corrosion resistance‐Increases resistance to chlorides
Manganese ‐Substitutes for nickel is some grades
Nitrogen ‐Increases strength and corrosion resistance in austenitic and duplex steels
Carbon ‐Usually kept low. Used in martensitic grades to increase strength and hardness.
Source: Special Steel Industry of North America, “Stainless Steel Overview: Alloying Elements Summary,” http://www.ssina.com/overview/alloyelements_summary.html, retrieved March 10, 2016.
Uses
Stainless steel sheet and strip products are used in many consumer and industrial applications, especially where corrosion resistance, heat resistance, or stainless steel’s aesthetic characteristics are desired. For example, the automotive industry uses sheet and strip to manufacture trim, exhaust‐ and emission‐control systems, and wheel covers. The pipe and tube industry uses slit coil as its raw material and produces pipes and tubes by welding the lengthwise edges together. Sheet and strip are also used by the chemical and construction industries, as well as by appliance and industrial equipment manufacturers among many other applications.
Manufacturing process26
The basic steps in stainless steel sheet and strip production regardless of grade or final width and thickness are: (1) stainless steel production; (2) the casting of slabs, a semifinished flat‐rolled product; (3) hot‐rolling the slabs; and, if specified, (4) cold‐rolling the hot‐rolled products; and, if specified (5) finishing (figure 1‐1). U.S. producers perform all of these steps. 27
26 Unless otherwise noted, information in this section was obtained from Stainless Steel Sheet and Strip from Germany, Italy, Japan, Korea, Mexico, and Taiwan, Invs. Nos. 701‐TA‐382 and 731‐TA‐798‐803 (Second Review), USITC Publication 4244, July 2011, pp. I‐27—I‐32.
27 Certain firms do not make their own stainless steel but rather acquire a stainless steel flat‐rolled input from another company and re‐roll the material to produce a flat‐rolled product. In the United States, re‐rollers typically acquire a product within the scope of these investigations and roll it to a thickness below 0.3048 mm, converting the material to a product outside the scope of these investigations. Little, if any, of their production is believed to be within the scope of these investigations. Conference transcript, p. 79 (Hartford). No questionnaire responses were received from known re‐rollers.

Figure I‐1
Stainless
1 Stainlesband and 2 After that this stafinishing oof stainles3 If brightWith brig4 If desire Source: Nohttp://www
Stainless
Melementsin an electransferrknown asthrough ttesting towith spec
28 An adecarburithrough it
steel sheet a
s steel coil atis not withine stainless stage is also knooperations suss steel sheett annealing is ht annealing ed, the coil ca
orth American w.northameric
s steel produ
Mills produces such as chrctric arc furnred to an args secondary the molten so determinecific propert
alternate metzation (“VODt.
nd strip: Prod
t this point is the product eel is hot‐rollown as white uch as slitting,t and strip conrequired, it tthe pickling sn undergo fin
Stainless, Flat canstainless.co
uction
e stainless stromium, nicnace. The regon‐oxygen dsteelmakingsteel, to elime the preciseties accordin
hod of removD”), in which t
duction proc
not yet anneascope. led annealed band. Stainle, cut to lengthntinues procetakes place atstep is eliminanishing opera
Products Brochom/flat‐produc
teel by meltikel, and molsultant liquidecarburizatg) in which ominate impu amount of fng to end‐use
ving impuritiethe molten m
I‐14
ess
aled and pick
and pickled iess steel coil ch, or continueessing througt this stage inated. ations.
hure, p. 14, mocts/,retrieved M
ing stainlesslybdenum (dd steel is taption (“AOD”oxygen, gradrities.28 Secoferroalloys te application
es from molteetal is placed
kled. The coil
t is within thecan be sold ae in the procegh the cold‐rostead of the u
odified by ComMarch 10, 201
or other stedepending opped into a f) vessel for fdually replacondary steelto be added ns. The quan
en stainless std in a vacuum
at this point
e product scot this point, bess to cold roolled stage. usual pickling
mmission staff, 6.
eel scrap andon the stainlefurnace ladlfurther refinced by argonlmaking requin order to pntity and com
teel is to use m while oxyge
is hot‐rolled b
ope. The prodbe moved to lling. The ma
g and anneali
d alloying ess steel grae and nement (alson, is blown uires frequeproduce stemposition of
vacuum oxygn is bubbled
black
duct
jority
ng.
ade)
o
ent el f
gen

I‐15
inputs is particularly important in the production of stainless steel as raw materials such as scrap and the alloying elements nickel, molybdenum, and chromium account for the majority of the total cost. After achieving the desired chemical composition, the molten stainless steel is transferred in a preheated transfer ladle to the continuous slab caster for solidification into slabs, the wide semifinished products from which flat‐rolled products are rolled.
Slab casting
The molten stainless steel is poured into a tundish (reservoir dam) which controls the flow into the top of the mold of the continuous casting machine. Solid surfaces form as the molten stainless steel passes through and out the open bottom of the mold, and the slab solidifies as it slowly descends through the caster. The resulting slabs are generally 5 to 8 inches thick and up to 100 inches wide, depending on mill capability and the flat‐rolled product that will be produced from the slab. The continuous slab is cut into lengths of up to about 35 feet for further processing. The length is limited by the mill’s reheating and/or rolling capability. The slab is then inspected and conditioned by grinding the surface to remove scale and defects, in preparation for rolling in coil form on the hot‐strip mill. Before it enters the rolling mill, the slab is charged in a gas‐fired reheating furnace to a rolling temperature of 2,250‐2,300 degrees Fahrenheit. After reaching the appropriate temperature, the slab exits the furnace and enters the hot‐strip mill.
Hot rolling the slabs
For a mill designed primarily to produce stainless steel, the roughing mill is generally a reversing mill in which the slabs are rolled to a thickness of about 1 inch in a succession of rolling passes. The finishing mill is either a reversing mill of the Steckel type, which is equipped to coil the bands after each pass in order to conserve space and temperature, or a continuous mill made up of a series of individual roll stands that may be hundreds of yards long and with the bands passing continuously through the stands in one direction only.29 Finally, the bands continue on to a coiler, where they are wrapped into coils. The product at this point (whether it is destined to become sheet, strip, or foil) is called hot‐rolled black (HRB) band, due to the layer of dark‐colored oxide that forms on the steel’s surface when it is exposed to oxygen at high temperatures.
29 Because the slabs are fed into the mill at an elevated temperature, the mill is known as a “hot‐strip mill.”

I‐16
Annealing
Rolling the steel creates internal stresses and makes the steel harder. Annealing, a form of heat treatment, relieves the stresses and softens the steel. After cooling down from the hot‐rolling process, the black band passes through a continuous furnace in which it is heated to annealing temperatures, about 2,000 degrees Fahrenheit depending on the stainless steel grade, and then quickly cooled. The heat treatment creates a dark colored oxide scale on the surface of the steel. The band next passes through a grit‐blasting machine in which the scale from the hot mill and the annealing furnace is broken up by using small particles of steel grit thrown at high speed by centrifugal wheels.
Pickling
The next process the band undergoes is pickling, an acid wash which removes the dark oxide scale and surface defects, and imparts corrosion resistance. The band passes through pickling tanks which contain acid to descale the steel, followed by a water rinse. Annealing and pickling are usually performed on a continuous process line, although they can be performed in separate units. The product at this point is considered white coil or white band, or hot‐rolled annealed and pickled (“HRAP”) coil or HRAP band, and can be shipped in this condition.
Cold rolling
Cold‐rolled stainless sheet and strip is manufactured by transferring HRAP coil to a cold‐rolling mill to reduce the product’s thickness. Cold‐rolling involves a further reduction in thickness ranging from 10 to 95 percent. Depending on the desired thickness of the end product, various numbers of cold‐rolling passes through the mill may be required to achieve the necessary reduction. As in hot‐rolling, the material hardens after a certain amount of cold‐rolling. Further cold‐rolling becomes difficult at this point so annealing (to soften the material) and pickling, several times may be necessary to achieve the desired final thickness. The final product is considered cold‐rolled, annealed, and pickled coil. The majority of stainless steel sheet and strip is sold as cold‐rolled product. If specified, after cold rolling the coil can be bright annealed.30 In bright annealing, the coil is placed in a special furnace that heats the coil in an oxygen‐free reducing atmosphere. Bright annealing does not create the dark oxide scale on the coil and so the pickling step is unnecessary. This type of annealing produces a mirror‐like appearance and is often used when a highly reflective surface is desired.31
30 NAS is constructing a bright anneal furnace scheduled for completion in March 2017. Conference transcript, p. 50 (Lyons).
31 NAS invested in a bright anneal furnace in order to offer their customers a product not currently produced by the company in products such as automotive trim and appliances. Conference transcript, p. 93 (Lyons).

I‐17
Finishing
Stainless steel sheet and strip may undergo additional finishing operations. For example, once the final anneal/pickle/cold‐roll sequence is complete, the steel may undergo a temper roll (skin pass) to improve surface condition. However, this step does not involve any further thickness reduction in the material. A finish may also be applied to the product. As shown in table I‐7, stainless steel sheet and strip are available in a number of finishes, including “rolled‐on” embossing, etching, special surface mechanical treatment to provide, for example, perforations, electromechanical coloring and plating.32 Table I‐7
Stainless steel sheet and strip: Standard finishes
Finish designator Description
No. 1 Rough, dull finish that results from hot rolling
No. 2B Bright finish with some reflectivity. It is a general purpose finish used as is, or it is used as a basis for subsequent polished finishes.
No. 2D Dull finish generally used where the surface appearance is of little concern.
Bright Annealed (BA or 2BA) Mirror like appearance but may have some cloudiness and other imperfections. A finish that is designated “BA” has only been bright annealed. A finish that is designated “2BA” has been bright annealed and then passed between highly polished rolls. A minimal amount of roll pressure (skin pass) is applied. The process improves flatness and finish uniformity but does not significantly decrease thickness. Bright annealed stainless is sometimes buffed to attain a more mirror‐like finish.
No. 4 Polished bright surface with reasonable reflectivity, although it contains visible “grit lines” which prevent mirror reflection.
No. 6 Dull satin finish with less reflectivity than a No. 4.
No. 7 Highly reflective surface finish but still maintains some light “grit” lines.
No. 8 Reflective standard finish with a mirror‐like reflectivity
Source: Specialty Steel Industry of North America, Designer Handbook: Stainless Steel Primer, p. 2, http://www.ssina.com/publications/primer.html, retrieved March 10, 2016.
Sheet and strip may also be edge‐trimmed, slit, or cut‐to‐length. Edge condition is often
more important for strip than for sheet. Strip is produced with various edge specifications: (1) mill edge (as produced, condition unspecified); (2) No. 1 edge (edge‐rolled, rounded, or square); (3) No. 3 edge (as‐slit); or (4) No. 5 edge (square edge produced by rolling or filing after slitting). Mill edge is the least expensive edge condition and is adequate for many purposes. No. 1 edge provides improved width tolerance over mill edge plus a cold‐rolled edge condition; rounded edges are preferred for applications requiring the lowest degree of stress concentration at corners. No. 3 and No. 5 edges give progressively better width tolerance and
32 Specialty Steel Industry of North America, Designer Handbook: Special Finishes for Stainless Steel, http://www.ssina.com/publications/spe_fin.html, retrieved March 10, 2016.

I‐18
squareness over No. 1 edge.33 Cut‐to‐length sheet and strip produced from coiled sheet and strip is made by placing the coil in a cut‐to‐length line which unrolls the coil, levels and then cuts it to desired length.
DOMESTIC LIKE PRODUCT ISSUES
In the present investigations, petitioners argued that the Commission should find one domestic like product that is co‐extensive with the scope of the investigations as defined by Commerce.34 Respondents have stated that for purposes of the preliminary investigations, they do not dispute the definition of the domestic like product as proposed by the petitioners.35
In prior investigations of stainless steel sheet and strip, the Commission has addressed the issue of whether the definition of the domestic like product should be expanded to include stainless steel plate, which is a higher thickness or gauge stainless steel product. The Commission declined to expand the definition of the domestic like product to include stainless steel plate and determined:
Although all flat stainless products share similar chemical compositions and properties, the industry has established a specific thickness‐based distinction between plate on the one hand, and sheet and strip, on the other. To a large degree, these distinctions correspond to different end uses and channels of distribution, and result in limited interchangeability. While sheet and plate generally are produced by similar, and sometimes, common initial manufacturing processes and equipment, virtually all sheet and strip undergoes the more extensive additional processing of cold‐rolling before being sold for end use. The cold‐rolling process used to finish sheet and strip entails the use of different employees and equipment from that used for hot‐rolling, and is usually performed in different facilities, and in some instances, by different producers. The additional processing adds substantial value to the sheet and strip and results in different pricing practices from those used for plate. For these reasons, we do not include plate in our definition of the domestic like product.36
33 ASM International, ASM Specialty Handbook: Stainless Steels, p. 39, 1994. 34 Petition, pp. 11‐12; Petitioners’ postconference brief, pp. 2‐5. 35 Conference transcript, p. 118 (Neely). 36 Certain Stainless Steel Sheet and Strip from France, Germany, Italy, Japan, Korea, Mexico, Taiwan,
and the United Kingdom, Inv. Nos. 701‐TA‐380‐382 and 731‐TA‐797‐804 (Preliminary), USITC Publication 3118, August 1998, p. 9.

II‐1
PART II: CONDITIONS OF COMPETITION IN THE U.S. MARKET
U.S. MARKET CHARACTERISTICS
Stainless steel sheet and strip is an input used in a variety of downstream products, including automotive parts, pipe and tube, food service equipment, kitchen equipment and appliances, tanks and pressure vessels, and computer parts. Demand for stainless steel sheet and strip is driven largely by demand in these industries, as well as overall economic conditions. During a 2011 review of outstanding countervailing and antidumping duties on stainless steel sheet and strip, the growth of China as a producer and consumer of stainless steel sheet and strip, the global economy, and fluctuating raw material prices were identified as affecting the stainless steel sheet and strip market.1 Apparent U.S. consumption of stainless steel sheet and strip fluctuated but increased during 2013‐15. Overall, apparent U.S. consumption in 2015 was 4.5 percent higher than in 2013.
CHANNELS OF DISTRIBUTION
Both U.S. producers and importers sell stainless steel sheet and strip primarily to distributors, as shown in table II‐1. All four U.S. producers sold to both distributors and end users, whereas *** reporting importers, ***, sold *** to end users. Table II-1 Stainless steel sheet and strip: U.S. producers’ and importers’ U.S. commercial shipments, by sources and channels of distribution, 2013-15
Item
Period Calendar year
2013 2014 2015 Share of reported shipments (percent)
U.S. producers’ U.S. commercial shipments: Distributors 76.0 75.8 75.7 End users 24.0 24.2 24.3
U.S. importers’ U.S. commercial shipments of stainless steel sheet and strip from China: Distributors *** *** *** End users *** *** *** U.S. importers’ U.S. commercial shipments of stainless steel sheet and strip from all other countries: Distributors 87.2 85.7 92.2 End users 12.8 14.3 7.8
Source: Compiled from data submitted in response to Commission questionnaires.
1 Stainless Steel Sheet and Strip from Germany, Italy, Japan, Korea, Mexico, and Taiwan, Inv. Nos. 701‐TA‐382 and 731‐TA‐798‐803 (Second Review), USITC Publication 4244, July 2011, p. II‐1.

II‐2
GEOGRAPHIC DISTRIBUTION
All four U.S. producers reported selling stainless steel sheet and strip to all regions in the contiguous United States (table II‐2). Importers reported selling to contiguous regions other than the Mountain region;2 however, only one importer reported selling to all contiguous regions. For U.S. producers, 8.9 percent of sales were within 100 miles of their production facility, 78.5 percent were between 101 and 1,000 miles, and 12.5 percent were over 1,000 miles. Importers sold 27.5 percent within 100 miles of their U.S. point of shipment, 69.8 percent between 101 and 1,000 miles, and 2.7 percent over 1,000 miles. Table II-2 Stainless steel sheet and strip: Geographic market areas in the United States served by U.S. producers and importers
Region U.S. producers Importers Northeast 4 6 Midwest 4 6 Southeast 4 7 Central Southwest 4 7 Mountain 4 1 Pacific Coast 4 7 Other1 0 0 All regions (except Other) 4 1 Reporting firms 4 7
1 All other U.S. markets, including AK, HI, PR, and VI. Source: Compiled from data submitted in response to Commission questionnaires.
SUPPLY AND DEMAND CONSIDERATIONS
U.S. supply
Domestic production
Based on available information, U.S. producers of stainless steel sheet and strip have the ability to respond to changes in demand with moderate‐to‐large changes in the quantity of shipments of U.S.‐produced stainless steel sheet and strip to the U.S. market. The main contributing factors to this degree of responsiveness of supply are the availability of unused capacity and, to a lesser extent, some inventories and some ability to produce alternate products.
2 The Mountain region includes the states of Arizona, Colorado, Idaho, Montana, Nevada, New Mexico, Utah, and Wyoming.

II‐3
Industry capacity
Domestic capacity remained relatively stable from 2013 to 2015, while total production decreased by 4.2 percent. Domestic capacity utilization decreased irregularly from 2013 to 2015, from 64.9 percent to 62.0 percent. This relatively low level of capacity utilization suggests that U.S. producers may have a moderate‐to‐substantial ability to increase production of product in response to an increase in prices. Alternative markets
U.S. producers’ exports as a share of total shipments decreased slightly from 18.1 percent in 2013 to 17.2 percent in 2015. This level indicates that U.S. producers may have some ability to shift shipments between the U.S. market and other markets in response to price changes. Inventory levels
U.S. producers’ inventories increased by *** percent from 2013 to 2014, but declined to 2013 levels in 2015. U.S. producers’ inventories as a percentage of total shipments increased slightly from *** percent in 2013 to *** percent in 2015. These inventory levels suggest that U.S. producers may have some ability to respond to changes in demand with changes in the quantity shipped from inventories. Production alternatives
Two of four responding U.S. producers stated that they could switch production from stainless steel sheet and strip to other products. Other products that producers reportedly can produce on the same equipment as stainless steel sheet and strip are nickel alloy sheet and strip and titanium sheet and strip (***), as well as electrical steel and carbon steel (***). *** reported that the market size for alternate products is very small compared to the market for stainless steel sheet and strip, making it difficult to run its business cost effectively without a high volume of stainless steel. Supply constraints
Three U.S. producers reported experiencing supply constraints during 2013‐15. Outokumpu reported that it had a motor failure on one of its three cold‐rolling mills from June to December of 2014, and that its two other cold‐rolling mills were down for two weeks in September of 2014.3 This caused a temporary supply disruption in 2014 that had a “negative
3 Petitioners’ postconference brief, ex. 10.

II‐4
impact” on roughly 38,500 short tons of deliveries.4 Outokumpu reported that by December 2014, however, all three cold‐rolling mills were operational. NAS reported that ***. AK Steel reported that ***, and that it “***.” Allegheny also announced plans in late 2015 to temporarily idle its Midland, Pennsylvania facility, but reported that ***.5
Respondents argue that the equipment issues at the Outokumpu’s Calvert, Alabama plant, extended lead times in 2014, and the lockout at Allegheny beginning in August 2015 led to constraints in domestic availability.6 Petitioners argue that both the output from the domestic industry and the domestic shipments *** grew in 2014.7 Petitioners also state that Allegheny’s lockout occurred in 2015, after the alleged supply issues, but argue that ***.8 Subject imports from China9
Based on available information, producers of stainless steel sheet and strip from China have the ability to respond to changes in demand with large changes in the quantity of shipments of stainless steel sheet and strip to the U.S. market. The main contributing factors to this degree of responsiveness of supply are the availability of unused capacity, sales to alternate markets, and the limited existence of inventories. Industry capacity
Among responding Chinese producers, production capacity increased by 23.7 percent from 2013 to 2015, while total production increased by 28.0 percent, resulting in an increase in capacity utilization from 81.9 to 84.7 percent. One Chinese producer, ***, reported that it expects its total capacity to produce stainless steel sheet and strip to decrease *** in 2016 and 2017, citing ***. Four of seven responding Chinese producers also projected that their total production will decrease from 2015 to 2017, including ***. Based on these firms’ data, Chinese producers’ capacity utilization rate is projected to be *** percent by 2017. This moderate level of capacity utilization suggests that Chinese producers may have a moderate‐to‐substantial
4 Conference transcript, pp. 49 (Letnich) and 64 (Vormizeele); https://globenewswire.com/news‐release/2014/12/10/690043/0/en/Outokumpu‐Update‐on‐impact‐of‐the‐recent‐technical‐issues‐in‐Calvert‐and‐market‐development.html.
5 Conference transcript, pp. 19‐20 and 66 (Hartford); Allegheny Tech to Idle Some Pennsylvania Operations, http://www.wsj.com/articles/allegheny‐tech‐to‐idle‐some‐pennsylvania‐operations‐1449787130.
6 Respondents’ postconference brief, pp. 6‐9, and exhibits 6‐10. 7 Petitioners’ postconference brief, pp. 8‐9, ex. 9. 8 Petitioners’ postconference brief, pp. 10‐11. 9 For data on the number of responding foreign firms and their share of U.S. imports from China,
please refer to Part I, “Summary Data and Data Sources.”

II‐5
ability to increase production of product in response to an increase in prices, depending on how representative responding Chinese producers’ data is of the Chinese industry.10
Based on ***, China’s overall capacity to produce cold‐rolled stainless steel flat products increased by *** percent from 2013 to 2015, from *** tons to *** tons.11 These data also suggest that China’s overall capacity to produce cold‐rolled stainless steel flat products may reach *** tons in 2016. Petitioners argue that Chinese producers’ excess capacity is ***, and that the Chinese industry still continues to expand capacity.12 Alternative markets
Chinese producers’ exports to the United States, exports to all other markets, and total export shipments all followed the same trend, increasing from 2013 to 2014, then decreasing from 2014 to 2015, but showing an overall increase between 2013 and 2015. Chinese producers’ exports as a share of total shipments increased from 15.3 percent in 2013 to 20.8 percent in 2014, then decreased to 12.9 percent in 2015. These data suggest that Chinese producers may have the ability to shift shipments between other markets and the U.S. market in response to price changes.
*** Chinese producers reported that Chinese exports of stainless steel sheet and strip are subject to any antidumping/countervailing duty/safeguard findings, remedies, or proceedings. Petitioners, however, identify a number of third countries that have issued antidumping duties on stainless steel sheet and strip from China, including Brazil, India, Taiwan, Thailand, Vietnam, the European Union, and indicate that Indonesia and Turkey instituted investigations in December of 2014 and August of 2015, respectively.13 Inventory levels
Chinese producers’ inventories increased by 45.1 percent from 2013 to 2015, from 137,471 short tons to 199,489 short tons. Chinese producers’ inventories relative to total shipments increased from 4.2 percent in 2013 to 4.7 percent in 2015. No Chinese producers reported maintaining inventories in the United States. These inventory levels suggest that
10 No Chinese producers provided an estimate of the percentage of total production of stainless steel sheet and strip in China that is accounted for by their firm, or the percentage total exports of stainless steel sheet and strip to the United States from China accounted for by their firm. Petitioners argue that the seven Chinese producers who provided capacity and production data in the Commission’s questionnaires represent approximately *** of the total Chinese capacity ***. Petitioners’ postconference brief, p. 33.
11 Petitioners’ postconference brief, ex. 12. 12 Petitioners cite “trade press and independent consultant reports” in identifying 20 Chinese firms
they report to be involved in planned capacity expansions. Petitioners’ postconference brief, pp. 32‐36. 13 Conference transcript, pp. 35 (Letnich), 90 (Kim); Petitioners’ conference exhibit, p. 15; Petitioners’
postconference brief, pp. 11 and 39‐40.

II‐6
Chinese producers may have limited ability to respond to changes in demand with changes in the quantity shipped from inventories. Production alternatives
*** responding Chinese producers reported that they are able to switch production from stainless steel sheet and strip to other products. Nonsubject imports
The largest sources of nonsubject imports in 2015 were Mexico and Taiwan.14 Combined, imports from these two sources accounted for more than one‐third of nonsubject imports in 2015. Imports of stainless steel sheet and strip from Mexico decreased by 22.1 percent from 2013 to 2015, while imports of stainless steel sheet and strip from Taiwan increased by 26.5 percent.
U.S. demand
Based on available information, the overall demand for stainless steel sheet and strip is likely to experience small‐to‐moderate changes in response to changes in price. The main contributing factors to this are the lack of substitute products, though cost shares of stainless steel sheet and strip in its most common end‐use products varies. End uses
U.S. demand for stainless steel sheet and strip depends on the demand for U.S.‐produced downstream products. Reported end uses include automotive parts, pipe and tube, restaurant and food service equipment, appliances, sinks, tanks and pressure vessels, tables, flexible hose, and computer parts. No U.S. producers reported any changes in end uses since January 2013, nor did they anticipate any changes. Cost share
Stainless steel sheet and strip accounts for a moderate‐to‐large share of the cost of the end‐use products in which it is used. Reported cost shares for some end uses were as follows:15
Automotive exhaust and other components (70‐90 percent)
Pipe and tube (70‐85 percent)
Sinks (85 percent)
14 See table IV‐2. 15 Importer *** reported a cost share of 100 percent for vacuum cleaner tanks.

II‐7
Food and restaurant equipment (70 percent)
Tables (50 percent)
Flexible hose (50 percent)
Appliances (20 percent) Business cycles
No U.S. producers reported that the market for stainless steel sheet and strip was subject to business cycles. One U.S. producer reported that the market for stainless steel sheet and strip was subject to distinct conditions of competition, citing “import penetration.” Four of 14 importers reported that the market for stainless steel sheet and strip was subject to business cycles. Two of these importers reported that the market was based on fluctuations in nickel and chrome prices, and one importer reported that customers manage for lower year‐end inventories, which creates an increase in orders during the first two quarters of the year. One importer also reported that the market was subject to distinct conditions of competition, stating that different producers have differing levels of competitiveness for various grades, and that surface finishes vary from mill to mill. No importers reported that there had been changes in the business cycles or conditions of competition since January 2013, but two U.S. producers did, citing an increase in imports of stainless steel sheet and strip from China and an increase in Chinese capacity. Demand trends
U.S. demand for stainless steel sheet and strip is driven largely by changes in overall economic activity, as well as demand in the most common end‐use markets, such as automobiles, construction, and home appliances.16
The U.S. quarterly real GDP growth rate has fluctuated between 0.6 percent (first quarter of 2014) and 6.9 percent (second quarter of 2014) (figure II‐1). Real annual GDP growth is forecasted to increase from 1.9 percent in 2015 to 2.3 percent in both 2016 and 2017.17
16 Conference transcript, p. 62 (Horford); Petitioners’ postconference brief, p. 7. 17 Blue Chip Economic Indicators, Blue Chip Econometric Detail, Vol. 32, No. 1, March 10, 2016. The
average or “consensus” rate is derived from monthly interviews of leading business economists and is one of the best known organizations for consensus macroeconomic forecasts.

II‐8
Figure II-1 Real U.S. GDP growth: Percentage change, quarterly, January 2013-December 2015
Source: Bureau of Economic Analysis, retrieved March 4, 2016. According to ***, vehicle production in the United States increased *** between 2013 and 2015, and vehicle sales in 2015 were at their highest level since 2000, at 17.47 million vehicles.18 The construction industry also experienced growth in 2014 and 2015, and is forecasted by the Associated Builders and Contractors to grow by 7.4 percent.19
Between January 2013 and December 2015, total vehicle sales and total construction spending both increased, by 12.3 percent and 47.1 percent, respectively, while total spending on household appliances decreased by 6.7 percent (figure II‐2).
18 Petitioners’ postconference brief, p. 7, ex. 7, and ex. 8; U.S. auto sales in 2015 set record after strong December, http://www.reuters.com/article/us‐usa‐autos‐idUSKBN0UJ1C620160105.
19 Petitioners’ postconference brief, p. 7, and ex. 8; 2016 forecast: Continued growth expected for the construction industry, http://www.bdcnetwork.com/2016‐forecast‐continued‐growth‐expected‐construction‐industry
0.0
1.0
2.0
3.0
4.0
5.0
6.0
7.0
8.0
2013 2014 2015
Perc
enta
ge c
hang
e
Real GDP growth rate

II‐9
Figure II-2 Indices of manufacturing spending: Total vehicles, seasonally adjusted, total construction, and total household appliances, seasonally adjusted, January 2013-January 2016
Sources: Bureau of Economic Analysis and U.S. Census Bureau, retrieved March 9, 2016.
All four U.S. producers and a plurality of importers reported an increase in U.S. demand for stainless steel sheet and strip since January 1, 2013 (table II‐3). U.S. producer *** reported that there was a small increase in demand in the automotive, appliance, and construction markets, but stated that the increase in demand was smaller than the increase in supply. Among the importers reporting an increase in U.S. demand, *** cited an increase in demand in the automotive and construction sectors. *** reported a decrease in U.S. demand, stating that “demand {is} reflected by low domestic prices.” Table II-3 Stainless steel sheet and strip: Firms’ responses regarding U.S. demand and demand outside the United States
Item Increase No change Decrease Fluctuate Demand in the United States U.S. producers 4 0 0 0 Importers 5 4 1 3 Demand outside the United States U.S. producers 2 1 1 0 Importers 2 4 1 3
Source: Compiled from data submitted in response to Commission questionnaires.
Regarding demand for stainless steel sheet and strip outside the United States, responses were more varied. U.S. producer *** pointed again to an increase in demand in the automotive, appliance, and construction markets, while *** reported a decrease in demand for
0
20
40
60
80
100
120
140
160
180
200
2013 2014 2015 2016
Jana
ury
2013
=100
Vehicles Contruction Household appliances

II‐10
stainless steel sheet and strip outside the United States. Importers *** also stated that there had been growth in global demand for automobiles and household appliances, and *** reported a growth in the “new energy” industry. Substitute products
No U.S. producers or importers reported that there were substitutes for stainless steel sheet and strip.
SUBSTITUTABILITY ISSUES
The degree of substitution between domestic and imported stainless steel sheet and strip depends upon such factors as relative prices, quality (e.g., grade standards, reliability of supply, defect rates, etc.), and conditions of sale (e.g., price discounts/rebates, lead times between order and delivery dates, payment terms, product services, etc.). Based on available data, staff believes that there is high degree of substitutability between domestically produced stainless steel sheet and strip and stainless steel sheet and strip imported from China.
Lead times
Stainless steel sheet and strip is primarily produced‐to‐order. U.S. producers reported that 92.9 percent of their commercial shipments were produced‐to‐order, with reported lead times ranging between 30‐35 days (***) and 56‐63 days (***). The remaining 7.1 percent came from inventories, with reported lead times ranging from two to seven days. Importers reported that 93.9 percent of their commercial shipments of stainless steel sheet and strip imported from China were produced‐to‐order, with reported lead times averaging 106 days. Two importers also reported shipping Chinese product from U.S. inventory (for *** percent of importers’ total shipments), with a lead time averaging 17 days, as well as from a foreign manufacturer’s inventory (for *** percent of importers’ total shipments), with a lead time averaging 90 days.
All four U.S. producers reported experiencing extended lead times during 2014. Outokumpu reported that its lead times extended in June 2014 to *** weeks.20 AK Steel indicated that it experienced extended lead times in the second half of 2014, Allegheny reported extended lead times in May through November of 2014, and NAS reported extended lead times beginning March‐April of 2014 through the end of the year.21
A number of purchasers also reported that domestic producers’ lead times were extended.22 *** reported decreasing domestic purchases of stainless steel sheet and strip due
20 Petitioners’ postconference brief, p. 9 and ex. 10. 21 Conference transcript, pp. 66 (Hartford, Pfeiffer) and 67 (Lyons). 22 This information is compiled from responses by purchasers identified by Petitioners to the lost
sales lost revenue allegations. See Part V for additional information.

II‐11
in part to these extended lead times. *** reported that the limited supply and extended lead times from the domestic industry “forc{ed} {them} to look for alternate sources.” *** reported increasing its purchases from China for the same reason.
Respondents argue that lead times for most domestic producers grew from *** in early 2014 to *** by June 2014, and that Chinese product “filled the gap” left by these extended lead times.23 Petitioners argue that while domestic producers’ lead times extended “to three to four months at their longest point,” they were still able to meet their customers’ demands, and that purchasers turned to imports of Chinese product due to lower prices, and not as a result of domestic producers’ extended lead times.24
Factors affecting purchasing decisions
Purchasers responding to lost sales lost revenue allegations were asked to identify the main purchasing factors their firm considered in their purchasing decisions for stainless steel sheet and strip. The most frequently cited top three factors firms consider in their purchasing decisions were quality and price (12 firms each), and delivery performance / lead times (8 firms). Other cited factors were availability (4 firms), service (3 firms), reliability and purchase terms / extension of credit (2 firms each).25
Comparison of U.S.‐produced and imported stainless steel sheet and strip
In order to determine whether U.S.‐produced stainless steel sheet and strip can generally be used in the same applications as imports from China, U.S. producers and importers were asked whether the products can “always,” “frequently,” “sometimes,” or “never” be used interchangeably. As shown in table II‐4, all four U.S. producers reported that all stainless steel sheet and strip is “always” interchangeable with one another, regardless of source. Most importers reported the same, although two indicated that different country sources have differing levels of surface quality, and that either cut samples or small quantity trials may be required.
23 Conference transcript, pp. 112‐113 (Neeley); Respondents’ postconference brief, p. 6 and ex. 6. 24 Conference transcript, pp. 30 (Lyons) and 65‐67 (Letnich, Hartford, Pfeiffer, and Lyons); Petitioners’
postconference brief, pp. 9‐10. 25 Other factors included breadth of offering, relationship with supplier, appearance, price vs. quality
evaluation, product consistency, inventory management programs, rebate programs, and continuity of supply (one firm each).

II‐12
Table II-4 Stainless steel sheet and strip: Interchangeability between stainless steel sheet and strip produced in the United States and in other countries, by country pairs
Country pair Number of
U.S. producers reporting Number of
U.S. importers reporting
A F S N A F S N Subject country comparison: U.S. vs. China 4 0 0 0 6 1 3 0
Nonsubject countries comparisons: U.S. vs. Mexico 4 0 0 0 5 1 2 0 U.S. vs. Taiwan 4 0 0 0 5 1 3 0 U.S. vs. Other nonsubject 4 0 0 0 7 2 2 0 China vs. Mexico 4 0 0 0 5 1 2 0 China vs. Taiwan 4 0 0 0 5 0 3 0 China vs. Other nonsubject 4 0 0 0 5 0 2 0 Mexico vs. Taiwan 4 0 0 0 5 0 2 0 Mexico vs. Other nonsubject 4 0 0 0 5 0 1 0 Taiwan vs. Other nonsubject 4 0 0 0 5 0 2 0
Note.—A=Always, F=Frequently, S=Sometimes, N=Never. Source: Compiled from data submitted in response to Commission questionnaires.
In addition, producers and importers were asked to assess how often differences other than price were significant in sales of stainless steel sheet and strip from the United States, subject, or nonsubject countries. As seen in table II‐5, a majority of U.S. producers reported that differences other than price were “never” a factor, while *** reported that they sometimes were for all country comparisons. A majority of importers reported that differences other than price were either “sometimes” or “never” a factor. Two importers reiterated that surface quality differences between country sources was a factor.

II‐13
Table II-5 Stainless steel sheet and strip: Significance of differences other than price between stainless steel sheet and strip produced in the United States and in other countries, by country pair
Country pair Number of
U.S. producers reporting Number of
U.S. importers reporting
A F S N A F S N Subject country comparison: U.S. vs. China 0 0 1 3 0 3 3 4
Nonsubject countries comparisons: U.S. vs. Mexico 0 0 1 3 0 1 3 4 U.S. vs. Taiwan 0 0 1 3 0 2 3 4 U.S. vs. Other nonsubject 0 0 1 3 0 2 4 6 China vs. Mexico 0 0 1 3 0 1 3 4 China vs. Taiwan 0 0 1 3 0 2 2 4 China vs. Other nonsubject 0 0 1 3 0 2 1 4 Mexico vs. Taiwan 0 0 1 3 0 1 2 4 Mexico vs. Other nonsubject 0 0 1 3 0 1 1 4 Taiwan vs. Other nonsubject 0 0 1 3 0 2 1 4
Note.--A = Always, F = Frequently, S = Sometimes, N = Never. Source: Compiled from data submitted in response to Commission questionnaires.


III‐1
PART III: U.S. PRODUCERS’ PRODUCTION, SHIPMENTS, AND EMPLOYMENT
The Commission analyzes a number of factors in making injury determinations (see 19
U.S.C. §§ 1677(7)(B) and 1677(7)(C)). Information on the dumping margins was presented in Part I of this report and information on the volume and pricing of imports of the subject merchandise is presented in Part IV and Part V. Information on the other factors specified is presented in this section and/or Part VI and (except as noted) and is based on the questionnaire responses of four firms that accounted for virtually all U.S. production of stainless steel sheet and strip during 2013‐15.1
U.S. PRODUCERS
The Commission issued U.S. producer questionnaires to nine firms2 which included those firms identified in the petition as well as one potential producer of the subject product. The Commission received responses from four firms which accounted for virtually all domestic production of stainless steel sheet and strip 2013‐15. The remaining five firms did not submit questionnaires to the Commission, but are believed to produce little, if any, stainless steel sheet or strip with a thickness of 0.3048 mm or greater.3 Table III‐1 lists U.S. producers of stainless steel sheet and strip, their positions on the petition, production location(s), and shares of total production in 2015.
1 For information regarding the estimation of the share of reporting U.S. producers’ production of total U.S. production see, Part I, Summary Data and Data Sources, supra.
2 These nine firms included: (1) AK Steel Corp.; (2) Allegheny Ludlum, LLC d/b/a ATI Flat Rolled Products; (3) North American Stainless; (4) Outokumpu Stainless USA, LLC; (5) Elgiloy Specialty Metals, Inc.; (6) Nucor Corp. (7) Precision Specialty Metals, Inc.; (8) Ulbrich Stainless Steel & Specialty Metals, Inc.; and (9) Somers Thin Strip, Inc.
3 These five firms included: (1) Elgiloy Specialty Metals, Inc.; (2) Nucor Corp. (3) Precision Specialty Metals, Inc.; (4) Ulbrich Stainless Steel & Specialty Metals, Inc.; and (5) Somers Thin Strip, Inc.
Precision Specialty Metals, Inc. ceased production operations in late 2015 and is no longer a going concern. Petition, p. 3 fn.1.
These firms are not integrated producers of stainless steel sheet and strip but rather “re‐rollers” of the subject product. A “re‐roller” reduces the gauge or thickness of stainless steel sheet and strip through cold‐rolling. The vast majority of the gauges produced by “re‐rollers” are not within the scope of these investigations.
Petitioners stated that they listed these firms as U.S. producers of stainless steel sheet and strip in the petition because they may produce small volumes of in‐scope product and in prior Commission proceedings concerning stainless steel sheet and strip, the Commission has included the “re‐rollers” as part of the domestic industry finding that these firms provided sufficient production related activities. Petitioners’ postconference brief, pp. 5‐6. The scope definition in the current investigations, however, includes a minimum gauge requirement that the prior Commission proceedings on this product did not have. Therefore, in the current investigations, the vast majority of these thin gauge products produced by the “re‐rollers” are explicitly excluded from the scope of these investigations. Respondents do not contest the inclusion of “re‐rollers” in the domestic industry. Conference transcript, p. 119 (Neeley).

III‐2
Table III‐1 Stainless steel sheet and strip: U.S. producers of stainless steel sheet and strip, their positions on the petitions, production locations, and shares of reported production, 2015
Firm Position on petition Production location(s) Share of production
(percent)
AK Steel Petitioner
Butler, PACoshocton, OHMansfield, OH
Middletown, OH Rockport, IN
Zanesville, OH ***
Allegheny1 Petitioner
Brackenridge, PAMidland, PA
Vandergrift, PA
Louisville, OH New Bedford, MA
Waterbury, CT ***
NAS2 Petitioner Ghent, KY
Minooka, IL Pendergrass, GA Wrightsville, PA ***
Outokumpu3 Petitioner Calvert, AL ***
Total 100.0
1 Allegheny Ludlum, LLC (“Allegheny”) does business under the name ATI Flat Rolled Products and is a wholly owned subsidiary of Allegheny Technologies, Inc. of Pittsburgh, Pennsylvania. Shanghai STAL Precision Stainless Steel Co., Ltd. (“STAL”) of Shanghai, China is a producer of stainless steel sheet and strip in China. STAL is a joint venture between Allegheny Technologies, Inc. and Baosteel of China. 2 North American Stainless (“NAS”) is a wholly owned subsidiary of Acerinox, S.A. of Madrid, Spain and affiliated with Columbus Stainless of Middleburg, South Africa and Bahru Stainless of Joher, Malaysia. 3 Outokumpu Stainless USA, LLC (“Outokumpu”) is a wholly owned subsidiary of Outokumpu Oyj of Espoo, Finland. Outokumpu Oyj has stainless steel sheet and strip production facilities in Finland, Germany, Sweden, Mexico, and the United Kingdom. Source: Compiled from data submitted in response to Commission questionnaires.
AK Steel
AK Steel, headquartered in West Chester, Ohio, is a producer of flat‐rolled carbon steel, stainless steel, and electrical steel products. Its products are used primarily in the automotive, infrastructure, manufacturing, construction, and electrical power generation markets. AK Steel operates eight steel production mills, two coke plants, and two tube manufacturing plants located in six states: Indiana, Kentucky, Michigan, Ohio, Pennsylvania and West Virginia.4 Of its eight production mills, six mills are involved in the production of stainless steel sheet and strip products during 2013‐15. These are: (1) Bulter Works, Bulter, Pennsylvania; (2) Coshocton Works, Coschocton, Ohio; (3) Mansfield Works, Mansfield, Ohio; (4) Middleton Works, Middleton, Ohio; (5) Rockport Works, Rockport, Indiana; and (6) Zanesville Works, Zanesville, Ohio.5
In June 2013, a blast furnace was idled at AK Steel’s Middleton, Ohio facility after it experienced a mechanical failure.6 AK Steel stated that this incident affected its carbon steel melting capabilities and did not affect its stainless steel sheet and strip operations.7
4 http://www.aksteel.com/company/corporate‐profile/ accessed March 3, 2016. 5 http://www.aksteel.com/production_facilities/ accessed March 3, 2016. The AK Steel’s remaining
two production mills in Ashland, Kentucky and Dearborn, Michigan produce carbon steel products. Ibid. 6 AK Steel’s Middleton (OH) Blast Furnace Experiences Incident, AK Steel Press Release, June 24, 2013.

III‐3
Allegheny
Allegheny, headquartered in Pittsburgh, Pennsylvania, is a fully integrated supplier of specialty metals and components. The company operates two business segments: (1) High Performance Materials & Components and (2) Flat Rolled Products. The high performance segment produces a range of high performance metals, including titanium and titanium‐based alloys, nickel and cobalt based alloys and superalloys, zirconium and related, advanced powder alloys, and other specialty metals, in long product forms such as ingot, billet, bar, rod, wire, shapes and rectangles, and seamless tubes, plus precision forgings and castings, components and machined parts. Approximately 65.0 percent of this business segment’s revenue is derived from sales to the aerospace and defense markets.
The flat rolled products segment produces stainless steel, nickel‐based alloys, specialty alloys, and titanium and titanium‐based alloys, in a variety of product forms including plate, sheet, engineered strip, as well as grain‐oriented electrical steel. The major end markets for its flat rolled products are oil, gas, and chemical process industry, electrical energy generation, automotive, food processing equipment, construction, mining, electronics, communication equipment, computers, aerospace, and defense.8
In 2008, Allegheny announced that it planned to invest $1.2 billion to build a new state of the art hot‐rolling and processing facility (“HRPF”) at its Brackenridge, Pennsylvania site. The new facility, one of the largest single investments in the company’s history, was completed and fully operational at the end of 2014. Allegheny stated that going forward, HRPF will significantly expand its product offering, shorten manufacturing times, reduce inventory requirements, and improve the cost structure of its flat rolled products segment. Allegheny also stated that HRPF will replace legacy equipment which will be idled.9 Therefore, HRPF will replace less efficient legacy capacity with higher efficiency HRPF capacity resulting in little increase in overall production capacity.10 The idling of legacy capacity began in December 2015 when Allegheny announced the idling of the standard stainless melt shop and sheet finishing operations at the Midland, PA facility.11
North American Stainless
North American Stainless (“NAS”), a subsidiary of the Acerinox Group, is an integrated producer of stainless steel long and flat products with a production facility in Ghent, Kentucky. The Acerinox Group, which is headquartered in Madrid, Spain, reports annual global stainless steel capacity of 3.5 million metric tons (3.9 million short tons) with mills in Spain, the United States, South Africa, and Malaysia. 12
(…continued)
7 Conference transcript, p. 45 (Pfeiffer). 8 Allegheny Technologies, Inc., SEC Form 10‐K, 2014, p. F‐6. 9 Ibid.; Conference transcript, p. 52 (Hartford). 10 Conference transcript, p. 52 (Hartford). 11 Allegheny Technologies, Inc., SEC Form 10‐K, 2015, p. 7. 12 http://www.northamericanstainless.com/about/, accessed March 7, 2016.

III‐4
The Ghent production facility was built by Acerinox in 1990 and claims to be the most efficient stainless steel production facility in United States. In March 2015, Acerinox announced a $150 million investment in the Ghent mill that would add a bright annealing line and an additional cold rolling mill. These additions to the production facility are scheduled to be completed in early 2017.13
Outokumpu
Outokumpu Oyj, headquartered in Espoo, Finland, is a global producer of stainless steel with a reported cold‐rolling capacity of 2.6 million metric tons (2.9 million short tons) and stainless steel production facilities in China, Finland, Germany, Mexico, Sweden, the United Kingdom, and the United States.14 Its integrated stainless steel production facility in the United States, Outokumpu Stainless USA, LLC, is located in Calvert, Alabama.
The Calvert, Alabama facility was originally constructed in 2007 as a greenfield project by ThyssenKrupp AG of Essen, Germany at a cost of $4.65 billion. The facility became operational in July 2010. In 2012, ThyssenKrupp sold its global stainless steel division, Inoxum, which included the stainless producing portion of the Calvert plant to Outokumpu. In February 2014, the carbon steel portion of the facility was sold for $1.5 billion to a joint venture of ArcelorMittal and Nippon Steel & Sumitomo Corp., AM/NS Calvert. Outokumpu stated that the Calvert stainless steel production facility was fully operational in 2013, but continued to “ramp up” in terms of seeking additional sales for the facility.15
In June 2014, Outokumpu reported that it experienced motor failure in its cold rolling mill ("CRM") 54, which was one of three cold rolling mills at the Calvert facility. As a result, CRM 54 did not operate from June 2014 until December 2014 when repairs were completed. During this period, cold rolling operations continued at the remaining two cold rolling mills at the Calvert facility, CRM 64 and CRM 74. Preventative maintenance was performed on CRM 64 and CRM 74 that resulted in each mill ceasing operations in September 2014. CRM 64 went offline from September 2 to September 21, 2014 whereas CRM 74 went offline from September 6 to September 16, 2014. Therefore, other than the period of time in September 2014, cold rolling capabilities, albeit in a diminished capacity, existed at the Calvert facility from June 2014 to December 2014.16 A press release from Outokumpu described the effects as, “this has had a negative impact on customer deliveries and increased costs. Following the damage calculations and discussions with the insurance company, the cost impact of the incident is estimated at €34 million ($38 million) in 2014 which will be partly covered by insurance.”17
13 Conference transcript, p. 50 (Lyons). 14 http://www.outokumpu.com/en/company/Pages/default.aspx, accessed March 7, 2016. 15 Conference transcript, p. 47 (Letnich). 16 Conference transcript, pp. 49 (Letnich); Petitioners’ postconference brief, exh. 10. 17 Outokumpu ‐‐Update on impact of the recent technical issues in Calvert and market development,
Outokumpu press release, December 10, 2014 found at https://globenewswire.com/news‐release/2014/12/10/690043/0/en/Outokumpu‐Update‐on‐impact‐of‐the‐recent‐technical‐issues‐in‐Calvert‐and‐market‐development.html, accessed March 10, 2016.

III‐5
U.S. PRODUCTION, CAPACITY, AND CAPACITY UTILIZATION
Table III‐2 presents U.S. producers’ reported production, capacity, and capacity utilization. Total U.S. capacity of stainless steel sheet and strip increased by 0.2 percent from 2013 to 2015. Total U.S. production of stainless steel sheet and strip decreased from 2013 to 2015 by 4.2 percent. U.S. capacity utilization rates for stainless steel sheet and strip production fluctuated 2013‐15 and ranged from 62.0 percent in 2015 to 72.5 percent in 2014.
Table III‐2 Stainless steel sheet and strip: U.S. producers’ production, capacity, and capacity utilization, 2013‐15
Item
Calendar year
2013 2014 2015
Quantity (short tons)
Capacity 2,911,738 2,911,738 2,916,603
Production 1,888,312 2,110,124 1,809,645
Ratio (percent)
Capacity utilization 64.9 72.5 62.0
Source: Compiled from data submitted in response to Commission questionnaires.
Potential product shifting in U.S. production facilities
*** reported that they are able to switch production from stainless steel sheet and strip to another product using the same manufacturing equipment and labor.18 ***. ***.
Table III‐3 presents overall U.S. capacity and production on manufacturing equipment used to produce stainless steel sheet and strip and other products. ***.19 In addition to those products mentioned above, *** reported that they produced thin gauge stainless steel20 during 2013‐15. *** also reported producing ***. *** reported producing both ***.
18 U.S. producer questionnaire responses of ***, question II‐3e(i). 19 U.S. producer questionnaire responses of ***, question II‐3a. ***. U.S. producer questionnaire
response of ***, question II‐3a. 20 “Thin gauge stainless steel” refers to stainless steel sheet or strip with a thickness of less than
0.3048 mm. These products have been explicitly excluded from the scope of these investigations.

III‐6
Table III‐3
Stainless steel sheet and strip: U.S. producers’ overall capacity and production on the same equipment as subject production, 2013‐15
* * * * * * *
Source: Compiled from data submitted in response to Commission questionnaires.
U.S. PRODUCERS’ U.S. SHIPMENTS AND EXPORTS
As presented in table III‐4, the quantity of U.S. shipments of stainless steel sheet and strip decreased by 1.0 percent from 2013 to 2015 while the value of U.S. shipments decreased by 9.8 percent during the same period. The quantity of export shipments of stainless steel sheet and strip decreased by 6.5 percent from 2013 to 2015 while the value of export shipments decreased by 19.0 percent during this period. U.S. producers reported that their principal export markets were *** during 2013‐15.
Overall, U.S. shipments of stainless steel sheet and strip decreased by 15,020 short tons, while exports declined by 22,194 short tons between 2013 and 2015. The value of both U.S. and export shipments likewise declined over this period, reflecting reduced shipment quantities and average unit values that fell by $195 per short ton for U.S. shipments and $292 per short ton for export shipments.
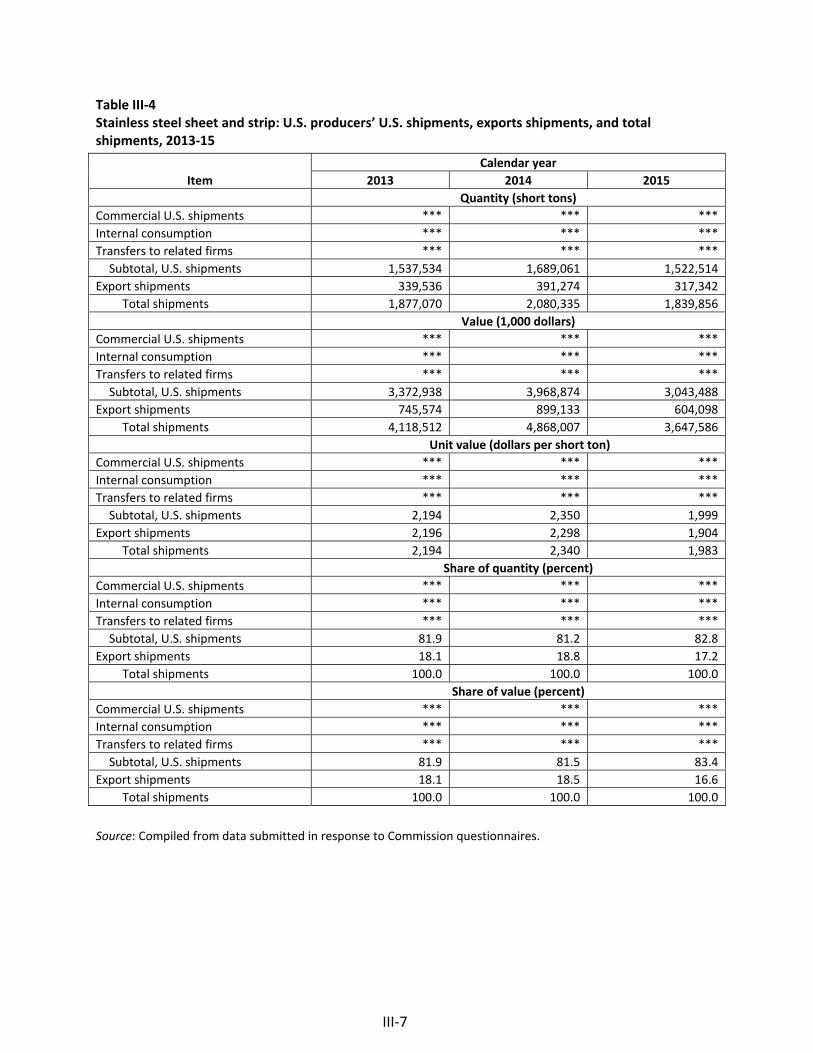
III‐7
Table III‐4 Stainless steel sheet and strip: U.S. producers’ U.S. shipments, exports shipments, and total shipments, 2013‐15
Item
Calendar year
2013 2014 2015
Quantity (short tons)
Commercial U.S. shipments *** *** ***
Internal consumption *** *** ***
Transfers to related firms *** *** ***
Subtotal, U.S. shipments 1,537,534 1,689,061 1,522,514
Export shipments 339,536 391,274 317,342
Total shipments 1,877,070 2,080,335 1,839,856
Value (1,000 dollars)
Commercial U.S. shipments *** *** ***
Internal consumption *** *** ***
Transfers to related firms *** *** ***
Subtotal, U.S. shipments 3,372,938 3,968,874 3,043,488
Export shipments 745,574 899,133 604,098
Total shipments 4,118,512 4,868,007 3,647,586
Unit value (dollars per short ton)
Commercial U.S. shipments *** *** ***
Internal consumption *** *** ***
Transfers to related firms *** *** ***
Subtotal, U.S. shipments 2,194 2,350 1,999
Export shipments 2,196 2,298 1,904
Total shipments 2,194 2,340 1,983
Share of quantity (percent)
Commercial U.S. shipments *** *** ***
Internal consumption *** *** ***
Transfers to related firms *** *** ***
Subtotal, U.S. shipments 81.9 81.2 82.8
Export shipments 18.1 18.8 17.2
Total shipments 100.0 100.0 100.0
Share of value (percent)
Commercial U.S. shipments *** *** ***
Internal consumption *** *** ***
Transfers to related firms *** *** ***
Subtotal, U.S. shipments 81.9 81.5 83.4
Export shipments 18.1 18.5 16.6
Total shipments 100.0 100.0 100.0
Source: Compiled from data submitted in response to Commission questionnaires.

III‐8
U.S. PRODUCERS’ INVENTORIES
Table III‐5 presents U.S. producers’ end‐of‐period inventories of stainless steel sheet and strip and the ratio of these inventories to U.S. producers’ production, U.S. shipments, and total shipments during 2013‐15.
Table III‐5 Stainless steel sheet and strip: U.S. producers’ inventories, 2013‐15
Item
Calendar year
2013 2014 2015
Quantity (short tons)
U.S. producers' end‐of‐period inventories 215,736 245,525 215,314
Ratio (percent)
Ratio of inventories to.‐‐ U.S. production 11.4 11.6 11.9
U.S. shipments 14.0 14.5 14.1
Total shipments 11.5 11.8 11.7
Source: Compiled from data submitted in response to Commission questionnaires.
U.S. PRODUCERS’ IMPORTS AND PURCHASES
*** U.S. producers, ***, reported that it purchased ***. 21 This volume represented ***.22
Allegheny owns a 60 percent equity interest in a joint venture with Baosteel Group of China. This joint venture, Shanghai STAL Precision Stainless Steel Co., Ltd. (“STAL”), produces stainless steel sheet and strip *** in China, but reported *** during 2013‐15. It reported that ***.23
Petitioner argued that all reporting U.S. producers be included in the domestic industry as there is no basis to exclude any of them.24 Respondents do not argue that any U.S. producer should be excluded from the domestic industry as a related party.25
U.S. EMPLOYMENT, WAGES, AND PRODUCTIVITY
Data provided by U.S. producers on the number of production and related workers (“PRWs”) engaged in the production of stainless steel sheet and strip, the total hours worked by
21 The volume purchased by *** accounted for *** percent of *** total U.S. imports of stainless steel sheet and strip from China in 2014.
22 U.S. producer questionnaire response of ***, question II‐11. 23 Allegheny Technologies, Inc., SEC Form 10‐K, 2014, p. F‐6; Petitioners’ postconference brief, p. 6 &
exh. 1, p. 1. 24 Petitioners’ postconference brief, p. 6. 25 Conference transcript, p. 119 (Neeley).

III‐9
such workers, wages paid to such PRWs, productivity, and unit labor costs during 2013‐15 are presented in table III‐6.
On August 15, 2015, due to a lack of progress in contract negotiations with the United Steel Workers Union (“USW”) over health care benefits, Allegheny locked out approximately 2,000 USW‐represented employees from all its production facilities. On February 11, 2016, the National Labor Relations Board (“NLRB”) served a complaint on Allegheny that alleged violations of the National Labor Relations Act including an unlawful lockout of its union employees. On March 4, 2016, Allegheny announced that an agreement with the union had been reached, a new contract ratified, and the complaint with the NLRB withdrawn. Union employees are scheduled to return to work March 13, 2016.
Petitioners testified that the seven month lockout of its union employees did not materially affect its production or shipment capabilities. They contended that Allegheny accumulated excess inventory in anticipation of the lockout and resumed operations using salaried employees and temporary workers.26 According to its annual report, “after an initial drop in asset utilization during the work stoppage, production rates improved and resumed operations, meeting and in some cases exceeding output and quality expectations.”27
In December 2015, Allegheny announced that it was idling its Midland, Pennsylvania production facility and laying off 250 of its employees due to its decision to idle legacy capacity and replace it with the new HRPF facility, but also in part due to unfairly traded imports from China.28
Table III‐6 Stainless steel sheet and strip: Average number of production and related workers, hours worked, wages paid to such employees, hourly wages, productivity, and unit labor costs, 2013‐15
Item
Calendar year
2013 2014 2015
Production and related workers (PRWs) (number) 2,753 2,813 2,637
Total hours worked (1,000 hours) 5,644 5,939 5,654
Hours worked per PRW (hours) 2,050 2,111 2,144
Wages paid ($1,000) 193,512 208,144 205,880
Hourly wages (dollars per hour) $34.29 $35.05 $36.41
Productivity (short tons per 1,000 hours) 334.6 355.3 320.1
Unit labor costs (dollars per short tons) $102.48 $98.64 $113.77
Source: Compiled from data submitted in response to Commission questionnaires.
26 Petitioners’ postconference brief, pp. 10‐11. 27 Allegheny Technologies, Inc., SEC Form 10‐K, 2015, p. 29. 28 Petitioners’ postconference brief, pp. 24‐25. Petitioners testified that the seven month lockout of
its union employees had no bearing on its decision to idle the plant. Conference transcript, pp. 53‐54 (Hartford).


IV‐1
PART IV: U.S. IMPORTS, APPARENT U.S. CONSUMPTION, AND MARKET SHARES
U.S. IMPORTERS
The Commission sent U.S. importer questionnaires to 62 firms identified in the petition and proprietary import data obtained from U.S. Customs and Border Patrol (“CBP”) as possible U.S. importers of stainless steel sheet and strip as well as to all U.S. producers.1 The Commission received questionnaire responses from 14 firms.2 3
Table IV‐1 lists all reporting U.S. importers of stainless steel sheet and strip, their headquarter locations, and their share of reported quantities of U.S. imports, by source, for 2015.
1 Proprietary data obtained from CBP show that in 2015, *** firms accounted for *** percent of U.S. imports of stainless steel sheet and strip from China. These firms included in order of descending volume imported in 2015: ***.
Proprietary data obtained from CBP show that in 2015, *** firms accounted for *** percent of U.S. imports of stainless steel sheet and strip from nonsubject countries. These firms included in order of descending volume imported in 2015: ***.
***. 2 Petitioner, Outokumpu submitted two U.S. importers questionnaires, one for each of its two U.S.
subsidiaries, Outokumpu Stainless USA, LLC and Outokumpu Stainless Coil, Inc. These two submissions were combined into one response for the firm, Outokumpu Americas, Inc., which is Outokumpu’s umbrella U.S. subsidiary.
3 For information regarding the estimation of the share of reporting U.S. importers of total U.S. imports see, Part I, Summary Data and Data Sources, supra.

IV‐2
Table IV‐1 Stainless steel sheet and strip: U.S. importers by source, 2015
Firm Headquarters
Share of imports by source (percent)
China All other sources
Total imports
Atlas Steel Products Co.1 Twinsburg, OH *** *** ***
Baosteel America, Inc.2 Montvale, NJ *** *** ***
Commercial Metals Co. Irving, TX *** *** ***
Daewoo International (America) Corp.3 Teaneck, NJ *** *** ***
Excel Stainless, LLC4 Warrenville, IL *** *** ***
Felchar Manufacturing Corp.5 Binghamton, NY *** *** ***
Hanwa American Corp.6 Schaumburg, IL *** *** ***
Jindal Stainless, Ltd.7 New Delhi, IN *** *** ***
North American Stainless8 Ghent, KY *** *** ***
Outokumpu Americas, Inc.9 Calvert, ALBannockburn, IL *** *** ***
R.M. Creations, Inc. South Plainfield, NJ *** *** ***
Sumitomo Corp. of Americas10 Rosemont, IL *** *** ***
ThyssenKrupp Materials NA, Inc.11 Southfield, MI *** *** ***
Tisco Trading USA, Inc.12 Canonsburg, PA *** *** ***
Total *** *** *** 1 ***. 2 Baosteel America, Inc. (“Baosteel USA”) is a wholly owned subsidiary of the Baosteel Group of Shanghai, China, a producer of stainless steel sheet and strip in China. It reported U.S. imports from its parent company in China. 3 Daewoo International America Corp. (“Daewoo”) is a wholly owned subsidiary of Daewoo International Corp. of Incheon, Korea and affiliated with POSCO of Seoul, Korea, a producer of stainless steel sheet and strip in Korea. 4 Excel Stainless, LLC. (“Excel”) is a wholly owned subsidiary of Excel Global FZE of Dubai, U.A.E. 5 Felchar Manufacturing Corp. (“Felchar”) is a wholly owned subsidiary of Shop Vac Corp. of Williamsport, Pennsylvania. 6 Hanwa America Corp. (“Hanwa”) is a wholly owned subsidiary of Hanwa Co., Ltd. of Tokyo, Japan and is affiliated with Ningbo Baoxin Stainless Steel Co. and Tsingshan Holding Group, producers of stainless steel sheet and strip in China. 7 Jindal Stainless, Ltd. (“Jindal”) of New Delhi, India is a producer of stainless steel sheet and strip in India and Indonesia and a U.S. importer of record of stainless steel sheet and strip. 8 North American Stainless (“NAS”) is a wholly owned subsidiary of Acerinox, S.A. of Madrid, Spain and affiliated with Columbus Stainless of Middleburg, South Africa and Bahru Stainless of Joher, Malaysia. ***. 9 Outokumpu Stainless USA, LLC (“Outokumpu”) is a wholly owned subsidiary of Outokumpu Oyj of Espoo, Finland. Outokumpu Oyj has stainless steel sheet and strip production facilities in Finland, Germany, Sweden, Mexico, and the United Kingdom. ***. 10 Sumitomo Corp. of Americas (“Sumitomo”) is a wholly owned subsidiary of Sumitomo Corp. of Tokyo, Japan 11 ThyssenKrupp Materials North America, Inc. (“ThyssenKrupp”) is a wholly owned subsidiary of ThyssenKrupp AG of Essen, Germany and affiliated with Acciai Speciali Terni of Terni, Italy, a producer of stainless steel sheet and strip in Italy. ***. 12 Tisco Trading USA, Inc. (“Tisco”) is a wholly owned subsidiary of Taigang Group International Trade Co., Ltd. of Shanxi, China and affiliated with Shanxi Taigang Stainless Steel Co., Ltd. of Shanxi, China, a producer of stainless steel sheet and strip in China. Source: Compiled from data submitted in response to Commission questionnaires.

IV‐3
U.S. IMPORTS
Table IV‐2 presents data for U.S. imports of stainless steel sheet and strip from China and nonsubject countries. The U.S. import data are compiled using official import statistics from Commerce.4 As shown, the volume of U.S. imports of stainless steel sheet and strip from China increased by 133.1 percent from 2013 to 2015 while the value increased by 113.8 percent during the same period. The volume of U.S. imports from nonsubject countries of stainless steel sheet and strip increased by 5.6 percent from 2013 to 2015 while the value increased by 4.0 percent during the same period. The largest sources of U.S. imports from nonsubject countries in 2015, in descending order, were: (1) Mexico, (2) Taiwan, (3) France, (4) South Africa, and (5) Germany.5
Respondents argued that U.S. imports from China were drawn into the U.S. market in 2014 due to production and delivery time issues experienced by the U.S. producers6 at that time and that as the problems with U.S. supply abated, U.S. imports from China decreased as well.7 Specifically, respondents observed that monthly U.S. import statistics show that U.S. imports from China increased in mid‐2014 due to increasing demand in the U.S. market at the same time U.S. producers were experiencing supply issues followed by a decrease in monthly U.S. imports from China by 2015, as U.S. producers addressed their supply concerns and normalcy returned to the U.S. market.8 Petitioners claimed that U.S. imports from China decreased in 2015 because (1) the prices in 2014 were so low that purchasers stockpiled product leading to a subsequent inventory draw down period; and (2) rumors in the industry that an antidumping petition could be filed.9
4 For information regarding the estimation of the coverage of official import statistics of total U.S. imports of stainless steel sheet and strip see, Part I, Summary Data and Data Sources, supra.
5 Based on official import statistics for 2015. 6 Respondents cited Outokumpu’s partial mill shutdown, Allegheny’s union worker lockout, and
increasingly extended lead times as issues with U.S. production supply during the 2014 period. Respondents’ postconference brief, pp. 3‐9.
7 Respondents’ postconference brief, pp. 1‐2. 8 Ibid., pp. 9‐10; Monthly U.S. import data are presented in appendix D. 9 Petitioners’ postconference brief, p. 29.

IV‐4
Table IV‐2 Stainless steel sheet and strip: U.S. imports by source, 2013‐15
Item
Calendar year
2013 2014 2015
Quantity (short tons)
U.S. imports from.‐‐ China 63,114 132,016 147,106
Mexico 90,730 87,224 70,676
Taiwan 35,167 36,613 44,493
All other sources 164,683 195,850 191,540
Subtotal, nonsubject sources 290,580 319,687 306,709
Total U.S. imports 353,694 451,703 453,815
Value (1,000 dollars)
U.S. imports from.‐‐ China 146,026 309,368 312,249
Mexico 194,488 198,235 153,245
Taiwan 93,778 116,870 107,556
All other sources 447,216 563,453 503,941
Subtotal, nonsubject sources 735,482 878,558 764,742
Total U.S. imports 881,508 1,187,927 1,076,991
Unit value (dollars per short ton)
U.S. imports from.‐‐ China 2,314 2,343 2,123
Mexico 2,144 2,273 2,168
Taiwan 2,667 3,192 2,417
All other sources 2,716 2,877 2,631
Subtotal, nonsubject sources 2,531 2,748 2,493
Total U.S. imports 2,492 2,630 2,373
Table continued.

IV‐5
Table IV‐2‐‐Continued Stainless steel sheet and strip: U.S. imports by source, 2013‐15
Item
Calendar year
2013 2014 2015
Share of quantity (percent)
U.S. imports from.‐‐ China 17.8 29.2 32.4
Mexico 25.7 19.3 15.6
Taiwan 9.9 8.1 9.8
All other sources 46.6 43.4 42.2
Subtotal, nonsubject sources 82.2 70.8 67.6
Total U.S. imports 100.0 100.0 100.0
Share of value (percent)
U.S. imports from.‐‐ China 16.6 26.0 29.0
Mexico 22.1 16.7 14.2
Taiwan 10.6 9.8 10.0
All other sources 50.7 47.4 46.8
Subtotal, nonsubject sources 83.4 74.0 71.0
Total U.S. imports 100.0 100.0 100.0
Ratio to U.S. production
U.S. imports from.‐‐ China 3.3 6.3 8.1
Mexico 4.8 4.1 3.9
Taiwan 1.9 1.7 2.5
All other sources 8.7 9.3 10.6
Subtotal, nonsubject sources 15.4 15.2 16.9
Total U.S. imports 18.7 21.4 25.1
Note.—Stainless steel sheet and strip in coils from Korea is subject to a countervailing duty order and such product from Japan, Korea, and Taiwan is subject to antidumping duty orders. Source: Official U.S. import statistics using statistical reporting numbers 7219.13.0031, 7219.13.0051, 7219.13.0071, 7219.13.0081, 7219.14.0030, 7219.14.0065, 7219.14.0090, 7219.23.0030, 7219.23.0060, 7219.24.0030, 7219.24.0060, 7219.32.0005, 7219.32.0020, 7219.32.0025, 7219.32.0035, 7219.32.0036, 7219.32.0038, 7219.32.0042, 7219.32.0044, 7219.32.0045, 7219.32.0060, 7219.33.0005, 7219.33.0020, 7219.33.0025, 7219.33.0035, 7219.33.0036, 7219.33.0038, 7219.33.0042, 7219.33.0044, 7219.33.0045, 7219.33.0070, 7219.33.0080, 7219.34.0005, 7219.34.0020, 7219.34.0025, 7219.34.0030, 7219.34.0035, 7219.34.0050, 7219.35.0005, 7219.35.0015, 7219.35.0030, 7219.35.0035, 7219.35.0050, 7219.90.0010, 7219.90.0020, 7219.90.0025, 7219.90.0060, 7219.90.0080, 7220.12.1000, 7220.12.5000, 7220.20.1010, 7220.20.1015, 7220.20.1060, 7220.20.1080, 7220.20.6005, 7220.20.6010, 7220.20.6015, 7220.20.6060, 7220.20.6080, 7220.20.7005, 7220.20.7010, 7220.20.7015, 7220.20.7060, 7220.20.7080, 7220.90.0010, 7220.90.0015, 7220.90.0060, and 7220.90.0080, accessed February 26, 2016.

IV‐6
NEGLIGIBILITY
The statute requires that an investigation be terminated without an injury determination if imports of the subject merchandise are found to be negligible.10 Negligible imports are generally defined in the Tariff Act of 1930, as amended, as imports from a country of merchandise corresponding to a domestic like product where such imports account for less than 3 percent of the volume of all such merchandise imported into the United States in the most recent 12‐month period for which data are available that precedes the filing of the petition or the initiation of the investigation. However, if there are imports of such merchandise from a number of countries subject to investigations initiated on the same day that individually account for less than 3 percent of the total volume of the subject merchandise, and if the imports from those countries collectively account for more than 7 percent of the volume of all such merchandise imported into the United States during the applicable 12‐month period, then imports from such countries are deemed not to be negligible.11 Based on monthly U.S. import data compiled from official import statistics, U.S. imports from China accounted for 31.1 percent of total U.S. imports of stainless steel sheet and strip by quantity from February 2015 to January 2016, the most recent 12‐month period preceding the filing of the petition.
APPARENT U.S. CONSUMPTION AND U.S. MARKET SHARES
Data on apparent U.S. consumption of stainless steel sheet and strip are presented in table IV‐3. From 2013 to 2015, the quantity of apparent U.S. consumption of stainless steel sheet and strip increased by 4.5 percent.12 The value of apparent U.S. consumption, however, decreased by 3.1 percent from 2013 to 2015. In 2015, reported U.S. capacity to produce stainless steel sheet and strip was equivalent to 147.6 percent of total apparent U.S. consumption.
10 Sections 703(a)(1), 705(b)(1), 733(a)(1), and 735(b)(1) of the Act (19 U.S.C. §§ 1671b(a)(1), 1671d(b)(1), 1673b(a)(1), and 1673d(b)(1)).
11 Section 771 (24) of the Act (19 U.S.C § 1677(24)). 12 Apparent U.S. consumption increased by 13.2 percent based on quantity from 2013 to 2014.
Parties agreed that the market experienced a surge in demand during this period. Petitioners stated that this increase in demand was seen throughout all end use markets whereas respondents claimed that the surge was due in large part to an increase in orders for durable goods, specifically appliances, during the period. Respondents’ postconference brief, pp. 5‐6; Conference transcript, p. 102 (Lyons).

IV‐7
Table IV‐3 Stainless steel sheet and strip: U.S. shipments of domestic product, U.S. imports, and apparent U.S. consumption, by quantity and value, 2013‐15
Item
Calendar year
2013 2014 2015
Quantity (short tons)
U.S. producers' U.S. shipments 1,537,534 1,689,061 1,522,514
U.S. imports from.‐‐ China 63,114 132,016 147,106
Mexico 90,730 87,224 70,676
Taiwan 35,167 36,613 44,493
All other sources 164,683 195,850 191,540
Subtotal, nonsubject sources 290,580 319,687 306,709
Total U.S. imports 353,694 451,703 453,815
Apparent U.S. consumption 1,891,228 2,140,764 1,976,329
Value (1,000 dollars)
U.S. producers' U.S. shipments 3,372,938 3,968,874 3,043,488
U.S. imports from.‐‐ China 146,026 309,368 312,249
Mexico 194,488 198,235 153,245
Taiwan 93,778 116,870 107,556
All other sources 447,216 563,453 503,941
Subtotal, nonsubject sources 735,482 878,558 764,742
Total U.S. imports 881,508 1,187,927 1,076,991
Apparent U.S. consumption 4,254,446 5,156,801 4,120,479
Source: Compiled from data submitted in response to Commission questionnaires and official import statistics.
Data on U.S. market shares for stainless steel sheet and strip are presented in table IV‐4. From 2013 to 2015, U.S. producers’ U.S. market share based on quantity decreased by 4.3 percentage points. From 2013 to 2015, U.S. producers’ U.S. market share based on value decreased by 5.4 percentage points. U.S. imports from China increased as a share of apparent U.S. consumption by 4.1 percentage points from 2013 to 2015 based on quantity and value. U.S. imports from nonsubject countries increased as a share of apparent U.S. consumption by 0.2 percentage points from 2013 to 2015 based on quantity and 1.3 percentage points based on value.

IV‐8
Table IV‐4 Stainless steel sheet and strip: U.S. market shares, by quantity and value, 2013‐15
Item
Calendar year
2013 2014 2015
Quantity (short tons)
Apparent U.S. consumption 1,891,228 2,140,764 1,976,329
Share of quantity (percent)
U.S. producers' U.S. shipments 81.3 78.9 77.0
U.S. imports from.‐‐ China 3.3 6.2 7.4
Mexico 4.8 4.1 3.6
Taiwan 1.9 1.7 2.3
All other sources 8.7 9.1 9.7
Subtotal, nonsubject sources 15.4 14.9 15.5
Total U.S. imports 18.7 21.1 23.0
Value (1,000 dollars)
Apparent U.S. consumption 4,254,446 5,156,801 4,120,479
Share of value (percent)
U.S. producers' U.S. shipments 79.3 77.0 73.9
U.S. imports from.‐‐ China 3.4 6.0 7.6
Mexico 4.6 3.8 3.7
Taiwan 2.2 2.3 2.6
All other sources 10.5 10.9 12.2
Subtotal, nonsubject sources 17.3 17.0 18.6
Total U.S. imports 20.7 23.0 26.1
Source: Compiled from data submitted in response to Commission questionnaires and official import statistics.
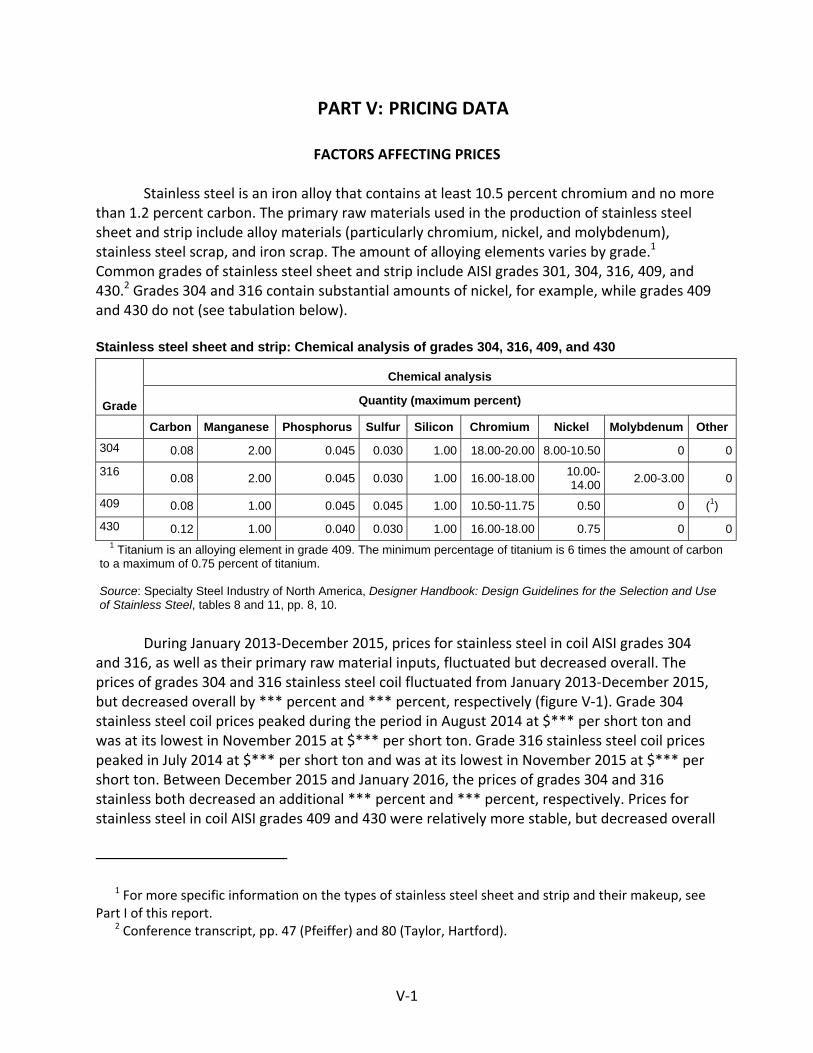
V‐1
PART V: PRICING DATA
FACTORS AFFECTING PRICES
Stainless steel is an iron alloy that contains at least 10.5 percent chromium and no more than 1.2 percent carbon. The primary raw materials used in the production of stainless steel sheet and strip include alloy materials (particularly chromium, nickel, and molybdenum), stainless steel scrap, and iron scrap. The amount of alloying elements varies by grade.1 Common grades of stainless steel sheet and strip include AISI grades 301, 304, 316, 409, and 430.2 Grades 304 and 316 contain substantial amounts of nickel, for example, while grades 409 and 430 do not (see tabulation below). Stainless steel sheet and strip: Chemical analysis of grades 304, 316, 409, and 430
Grade
Chemical analysis
Quantity (maximum percent)
Carbon Manganese Phosphorus Sulfur Silicon Chromium Nickel Molybdenum Other
304 0.08 2.00 0.045 0.030 1.00 18.00-20.00 8.00-10.50 0 0
316 0.08 2.00 0.045 0.030 1.00 16.00-18.00 10.00-14.00 2.00-3.00 0
409 0.08 1.00 0.045 0.045 1.00 10.50-11.75 0.50 0 (1)
430 0.12 1.00 0.040 0.030 1.00 16.00-18.00 0.75 0 0
1 Titanium is an alloying element in grade 409. The minimum percentage of titanium is 6 times the amount of carbon to a maximum of 0.75 percent of titanium. Source: Specialty Steel Industry of North America, Designer Handbook: Design Guidelines for the Selection and Use of Stainless Steel, tables 8 and 11, pp. 8, 10.
During January 2013‐December 2015, prices for stainless steel in coil AISI grades 304 and 316, as well as their primary raw material inputs, fluctuated but decreased overall. The prices of grades 304 and 316 stainless steel coil fluctuated from January 2013‐December 2015, but decreased overall by *** percent and *** percent, respectively (figure V‐1). Grade 304 stainless steel coil prices peaked during the period in August 2014 at $*** per short ton and was at its lowest in November 2015 at $*** per short ton. Grade 316 stainless steel coil prices peaked in July 2014 at $*** per short ton and was at its lowest in November 2015 at $*** per short ton. Between December 2015 and January 2016, the prices of grades 304 and 316 stainless both decreased an additional *** percent and *** percent, respectively. Prices for stainless steel in coil AISI grades 409 and 430 were relatively more stable, but decreased overall
1 For more specific information on the types of stainless steel sheet and strip and their makeup, see Part I of this report.
2 Conference transcript, pp. 47 (Pfeiffer) and 80 (Taylor, Hartford).

V‐2
as well. The prices of grades 409 and 430 stainless steel coil decreased overall from January 2013‐December 2015 by *** percent and *** percent, respectively. Figure V-1 Cold-rolled stainless steel: Prices of U.S. ex-mill cold-rolled AISI grades 304, 316, 409, and 430 stainless steel, including alloy surcharges, by month, January 2013-January 2016
* * * * * * *
Raw material costs
U.S. producers’ raw material costs as a share of the COGS decreased from 67.2 percent in 2013 to 62.0 percent in 2015. The costs of the alloying agents nickel and molybdenum decreased while the cost of chrome increased during January 2013‐December 2015 (figure V‐2). Between January 2013 and mid‐2014, the prices of these alloys all increased; but by December 2015, nickel and molybdenum prices were below their January 2013 levels. Overall, the prices of nickel and molybdenum decreased by *** percent and *** percent, respectively, while the price of chromium increased by *** percent during January 2013‐December 2015. Between December 2015 and January 2016, the prices of nickel and chrome decreased by *** percent and *** percent, respectively, while the price of molybdenum increased by *** percent.
During the period, the price of nickel was at its highest in May 2014 at $*** per pound; the price of chrome was at its highest in September 2014 at *** cents per pound; and the price of molybdenum was at its highest in June 2014 at $*** per pound. The price of chrome was at its lowest in August 2013 at *** cents per pound, while the prices of nickel and molybdenum were at their lowest in December 2015 at $*** per pound and $*** per pound, respectively. Figure V-2 Raw materials: Alloy cost indices of nickel, ferrochrome, and ferromolybdenum spot prices, by month, January 2013-January 2016
* * * * * * *
The costs of both stainless steel scrap and iron scrap decreased from January 2013 to December 2015 (figure V‐3). During this period, the price of stainless steel scrap decreased by 43.9 percent and the price of iron scrap decreased by 59.0 percent. Stainless steel scrap was at its highest price in July of 2014 at $*** per short ton, and iron scrap was at its highest price in January of 2014 at $*** per short ton. Both stainless steel scrap and iron scrap were at their lowest prices in December of 2015 at $*** per short ton and $*** per short ton, respectively. From December 2015 to January 2016, the price of stainless steel scrap decreased by 2.4 percent, and the price of iron scrap increased by 10.4 percent.

V‐3
Figure V-3 Raw materials: Producer price indices of stainless steel scrap and iron scrap in the United States, monthly, January 2013-January 2016
Source: American Metal Market, retrieved March 4, 2016.
Energy costs
Both electricity and natural gas prices decreased during January 2013‐December 2015 (figure V‐4). Electricity prices decreased 1.2 percent and natural gas prices decreased 26.2 percent during this period. The average industrial retail price of electricity was at its highest in July 2014 at 7.62 cents per kilowatt hour and its lowest in December 2015 at 6.42 cents per kilowatt hour. The average industrial price of natural gas was at its highest in February 2014 at $6.58 per thousand cubic feet and lowest in November 2015 at $3.18 per thousand cubic feet.
0
20
40
60
80
100
120
140
2013 2014 2015 2016
Janu
ary
2013
=100
SS scrap Iron scrap

V‐4
Figure V-4 Industrial natural gas and electricity: Monthly prices, January 2013-December 2015
Source: Short Term Energy Outlook, Energy Information Administration, retrieved on March 4, 2016. All four U.S. producers and eight of 11 importers reported that raw material prices decreased from January 2013 to December 2015. Importers *** reported that the fluctuation and ultimate decline in nickel prices, in particular, was a large driver of price declines of stainless steel sheet and strip since January 2013.
Petitioners argue that while raw material prices and the surcharges attached to them have declined, U.S. producers have been forced to lower their base prices as well in order to compete with imports of stainless steel sheet and strip from China.
PRICING STRUCTURE
U.S.‐produced stainless steel sheet and strip prices consist of two components: a surcharge and a base price. Surcharges are based largely on the alloying materials used in stainless steel, and are often published.3 U.S. producers typically issue their surcharge lists on a monthly basis, and numerous other firms – including some importers of stainless steel sheet
3 Petitioners’ current raw material surcharge lists are available at: http://www.northamericanstainless.com/NAS_App/Surcharge1?language=E&type=F, http://www.outokumpu.com/en/pricing‐aaf/surcharges‐north‐america/Pages/default.aspx, http://www.aksteel.com/markets_products/surcharges/stainless.aspx, https://www.atimetals.com/businesses/ATIFlatRolledProducts/Tools/Pages/Stainless‐Steel‐Report.aspx?d=635923872000000000&r=False.
0
1
2
3
4
5
6
7
8
9
0.00
1.00
2.00
3.00
4.00
5.00
6.00
7.00
2013 2014 2015
Cen
ts p
er k
ilow
att-h
our (
elec
trici
ty)
Dol
lars
per
thou
sand
cub
it fe
et (n
atur
al g
as)
Natural gas Electricity

V‐5
and strip from China – use these lists in quoting their own prices. Base prices consist, in part, of all other inputs to making stainless steel sheet and strip.
Surcharges
Surcharges typically reflect the pricing of the alloying elements used in stainless steel, such as nickel, chromium, molybdenum, manganese, iron, titanium, vanadium, copper, tungsten, and niobium. The amount of alloying elements used in different grades of stainless steel varies, as different grades use different amounts or different alloys altogether. Some firms include energy costs in their surcharge lists, and some include it in their base price. NAS indicated that its surcharges are based on prices published by Platts and London Metal Exchange (LME),4 while the other U.S. producers reported using various combinations of Platts, LME, American Metal Market (AMM), metalprices.com, and NYMEX (for natural gas).
All four U.S. producers reported raw material surcharges for nickel, chromium, molybdenum, manganese, iron, and fuel. Three firms also reported a surcharge for energy (electricity and/or natural gas), one firm reported surcharges for titanium and niobium, and one firm reported surcharges for copper, titanium, and niobium. U.S. producers’ surcharges are typically adjusted monthly, and their customers are quoted surcharges based on the period during which an order ships. Roughly half (either 6 or 7) of 13 reporting importers also reported surcharges for nickel, chromium, molybdenum, manganese, and iron. Importers reported basing their surcharges on either the same sources as U.S. producers or the U.S. producers’ surcharge lists themselves. Seven importers also reported adjusting surcharges monthly.
Base prices
Base prices consist of other inputs not included in surcharges, such as labor costs, industrial gases, acids, and all other components of conversion. Therefore, a firm’s profitability, according to NAS, comes from the base price.5 When a firm seeks to initiate changes to the price of their stainless steel sheet and strip products, it typically does so through changes in the base price. These changes are done at the discretion of each firm, though when one firm changes its base price it is not uncommon for others to do so.
Petitioners argue that base prices *** fell in 2015 to their lowest levels on record, and that this decline was due to the influx of imports of stainless steel sheet and strip from China.6 Petitioners were asked to provide data showing their firms’ base prices for pricing products 1‐4 during the first quarter of 2013 and the fourth quarter of 2015.7 Petitioners reported the following results (see tabulation below):
4 Conference transcript, p. 27 (Lyons). 5 Conference transcript, p. 70 (Hartford). 6 Conference transcript, p. 41 (Cannon); Petitioners’ postconference brief, p. 20. 7 See below, “Price Data” for descriptions of each of the four pricing products.

V‐6
Stainless steel sheet and strip: U.S. producers’ base prices for products 1-4, dollars per short ton, first quarter of 2013 and fourth quarter of 2015
* * * * * * *
For pricing product 1, Outokumpu’s base price *** by *** percent, NAS’ base price *** by *** percent, Allegheny’s base price *** by *** percent, and AK Steel’s base price *** by *** percent.
For pricing product 2, Outokumpu’s base price *** by *** percent, NAS’ base price *** by *** percent, Allegheny’s base price *** by *** percent, and AK Steel’s base price *** by *** percent.
For pricing product 3, Outokumpu’s base price *** by *** percent, NAS’ base price *** by *** percent, Allegheny’s base price *** by *** percent, and AK Steel’s base price *** by *** percent.
For pricing product 4, Outokumpu’s base price *** by *** percent, NAS’ base price *** by *** percent, Allegheny’s base price *** by *** percent, and AK Steel ***.
U.S. inland transportation costs
All four responding U.S. producers and four of seven importers reported that they typically arrange transportation to their customers. U.S. producers reported that their U.S. inland transportation costs ranged from 2 to 4 percent, while importers reported costs of 2 to 8 percent.
PRICING PRACTICES
Pricing methods
U.S. producers and importers reported selling stainless steel sheet and strip primarily on a transaction‐by‐transaction basis and/or through contracts (table V‐1). All four U.S. producers reported using both transaction‐by‐transaction negotiations and contracts for their sales of stainless steel sheet and strip, and NAS and AK Steel reported issuing price lists related to alloy surcharges. Among importers, six firms reported selling only through transaction‐by‐transaction negotiations, one reported selling only through contracts, and five firms reported using both methods.8 Importer *** reported using both methods for sales from some sources, but only selling on a transaction‐by‐transaction basis for stainless steel sheet and strip imported from China.9 Importers *** also reported using price lists.
8 Importer *** initially reported its transaction‐by‐transaction sales as “contracts” that cover individual one‐time transactions. Staff included these sales as transaction‐by‐transaction sales.
9 Email from ***, March 7, 2016.

V‐7
Table V-1 Stainless steel sheet and strip: U.S. producers’ and importers’ reported price setting methods, by number of responding firms1
Method U.S. producers Importers Transaction-by-transaction 4 9 Contract 4 6 Set price list 2 1 Other 0 1
1 The sum of responses down may not add up to the total number of responding firms as each firm was instructed to check all applicable price setting methods employed. Source: Compiled from data submitted in response to Commission questionnaires.
U.S. producers and importers also reported their 2015 U.S. commercial shipments of stainless steel sheet and strip by type of sale. U.S. producers reported selling roughly half of their product in 2015 in the spot market, while importers reported selling a majority of their product through short‐term contracts (table V‐2). U.S. producers’ contract sales were roughly evenly distributed between short‐term, annual, and long‐term contracts. Of the seven responding importers, five reported selling exclusively in the spot market, while *** reported selling through short‐term contracts. *** reported selling *** percent of its product under short‐term contract, and *** reported selling exclusively through short‐term contracts. *** importers reported selling through long‐term or annual contracts. Table V-2 Stainless steel sheet and strip: U.S. producers’ and importers’ shares of U.S. commercial shipments by type of sale, 2015
Type of sale U.S. producers Importers Long-term contracts *** *** Annual contracts *** *** Short-term contracts *** *** Spot sales *** ***
Total 100.0 100.0 Note.--Because of rounding, figures may not add to the totals shown. Source: Compiled from data submitted in response to Commission questionnaires.
Sales terms and discounts
All four U.S. producers reported typically quoting prices on an f.o.b. basis, while 6 of 7 importers reported quoting prices on a delivered basis. Four producers reported offering

V‐8
quantity discounts, while three reported offering total volume discounts.10 Three importers of stainless steel sheet and strip from China reported offering quantity discounts, two offered discounts on alloy surcharges, one offered total volume discounts, one offered early payment discounts in some cases, and nine reported having no discount policy. Three U.S. producers reported sales terms of net 30 days, two of ½ percent 10 days net 30 days, one of net 60 days, and one firm (***) reported offering various forms of 1 percent 10 days net 30, 1 percent 10 days net 60, as well as cash in advance and letters of credit. Importers reported sales terms of net 30 days (six firms), as well as net 60 days, 2/10 net 30 days, and net 45 days (one firm each).11
PRICE DATA
The Commission requested U.S. producers and importers to provide quarterly data for the total quantity and f.o.b. value of the following stainless steel sheet and strip products shipped to unrelated U.S. customers during 2013‐15.
Product 1.—AISI Grade 304, 0.075 inch nominal thickness (0.068‐0.082 inch actual), width 48‐60 inches, in coils, 2B finish.
Product 2.—AISI Grade 304, 0.029 inch nominal thickness (0.0291‐0.032 inch actual), width 48‐60 inches, in coils, 2B finish.
Product 3.—AISI Grade 304, 0.036 inch nominal thickness (0.032‐0.040 inch actual), width 48‐60 inches, in coils, 2B finish.
Product 4.—AISI Grade 316L, 0.060 inch nominal thickness (0.054‐0.066 inch actual), width 48‐60 inches, in coils, 2B finish.
10 U.S. producer *** reported that while it does offer quantity discounts, it does not have a specific discount policy, and that its discounts are all given on a case‐by‐case basis and are market driven. Email from ***, March 8, 2016.
11 Importer *** also reported sales terms of “T/T 10 days after B/L date and T/T 20 days after B/L date.” Staff attempted to contact *** to verify that the meaning of “T/T” and “B/L” were “telegraphic transfer” and “bill of lading,” but did not receive a response.

V‐9
All four U.S. producers and six importers provided usable pricing data for sales of the requested products, although not all firms reported pricing for all products for all quarters.12 Pricing data reported by these firms accounted for approximately 2.7 percent of U.S. producers’ commercial shipments of stainless steel sheet and strip and 9.4 percent of U.S. commercial shipments of subject imports from China during 2015.
Price data for products 1‐4 are presented in tables V‐3 to V‐6 and figures V‐5 to V‐8. Price data for nonsubject source Mexico is presented in Appendix E. Table V-3 Stainless steel sheet and strip: Weighted-average f.o.b. prices and quantities of domestic and imported product 11 and margins of underselling/(overselling), by quarters, January 2013-December 2015
Period
United States China
Price (per short ton)
Quantity (short tons)
Price (per short ton)
Quantity (short tons)
Margin (percent)
2013: Jan.-Mar. 2,488 5,751 *** *** ***Apr.-June 2,354 5,806 *** *** ***July-Sept. 2,184 6,253 *** *** ***Oct.-Dec. 2,215 6,696 *** *** ***2014: Jan.-Mar. 2,284 6,210 *** *** ***Apr.-June 2,578 6,986 *** *** ***July-Sept. 2,807 6,515 *** *** ***Oct.-Dec. 2,636 6,093 *** *** ***2015: Jan.-Mar. 2,460 4,804 *** *** ***Apr.-June 2,135 4,849 *** *** ***July-Sept. *** *** *** *** ***Oct.-Dec. 1,657 5,095 *** *** ***
1 Product 1: AISI Grade 304, 0.075 inch nominal thickness (0.068-0.082 inch actual), width 48-60 inches, in coils, 2B finish. Source: Compiled from data submitted in response to Commission questionnaires.
12 Per‐unit pricing data are calculated from total quantity and total value data provided by U.S. producers and importers. The precision and variation of these figures may be affected by rounding, limited quantities, and producer or importer estimates.
Importer *** reported importing stainless steel sheet and strip from China during January 2013‐December 2015, but did not provide pricing data, indicating that it does not “have system software to figure out {such} details/bifurcation on the basis of thickness.”

V‐10
Table V-4 Stainless steel sheet and strip: Weighted-average f.o.b. prices and quantities of domestic and imported product 21 and margins of underselling/(overselling), by quarters, January 2013-December 2015
Period
United States China
Price (per short ton)
Quantity (short tons)
Price (per short ton)
Quantity (short tons)
Margin (percent)
2013: Jan.-Mar. 2,668 785 *** *** ***Apr.-June 2,540 1,044 *** *** ***July-Sept. 2,428 814 *** *** ***Oct.-Dec. 2,480 519 *** *** ***2014: Jan.-Mar. 2,579 644 *** *** ***Apr.-June 2,872 610 *** *** ***July-Sept. 3,186 683 *** *** ***Oct.-Dec. 2,949 486 *** *** ***2015: Jan.-Mar. 2,851 788 *** *** ***Apr.-June 2,459 510 *** *** ***July-Sept. *** *** *** *** ***Oct.-Dec. *** *** *** *** ***
1 Product 2: AISI Grade 304, 0.029 inch nominal thickness (0.0291-0.032 inch actual), width 48-60 inches, in coils, 2B finish. Source: Compiled from data submitted in response to Commission questionnaires.

V‐11
Table V-5 Stainless steel sheet and strip: Weighted-average f.o.b. prices and quantities of domestic and imported product 31 and margins of underselling/(overselling), by quarters, January 2013-December 2015
Period
United States China
Price (per short ton)
Quantity (short tons)
Price (per short ton)
Quantity (short tons)
Margin (percent)
2013: Jan.-Mar. 2,599 3,941 *** *** ***Apr.-June 2,457 3,522 *** *** ***July-Sept. 2,280 4,089 *** *** ***Oct.-Dec. 2,306 3,785 *** *** ***2014: Jan.-Mar. 2,370 3,120 *** *** ***Apr.-June 2,668 3,932 *** *** ***July-Sept. 2,908 3,331 *** *** ***Oct.-Dec. 2,744 2,739 *** *** ***2015: Jan.-Mar. 2,562 2,670 *** *** ***Apr.-June 2,273 2,066 *** *** ***July-Sept. 2,005 2,371 *** *** ***Oct.-Dec. *** *** *** *** ***
1 Product 3: AISI Grade 304, 0.036 inch nominal thickness (0.032-0.040 inch actual), width 48-60 inches, in coils, 2B finish. Source: Compiled from data submitted in response to Commission questionnaires.

V‐12
Table V-6 Stainless steel sheet and strip: Weighted-average f.o.b. prices and quantities of domestic and imported product 41 and margins of underselling/(overselling), by quarters, January 2013-December 2015
Period
United States China
Price (per short ton)
Quantity (short tons)
Price (per short ton)
Quantity (short tons)
Margin (percent)
2013: Jan.-Mar. 3,549 2,484 *** *** ***Apr.-June 3,408 2,267 --- --- ---July-Sept. 3,122 2,712 --- --- ---Oct.-Dec. 3,130 2,260 --- --- ---2014: Jan.-Mar. 3,162 2,637 *** *** ***Apr.-June 3,629 2,214 --- --- ---July-Sept. 4,066 2,723 *** *** ***Oct.-Dec. 3,754 2,186 *** *** ***2015: Jan.-Mar. 3,375 2,008 *** *** ***Apr.-June 2,970 1,748 *** *** ***July-Sept. 2,574 2,007 *** *** ***Oct.-Dec. 2,268 1,948 --- --- ---
1 Product 4: AISI Grade 316L, 0.060 inch nominal thickness (0.054-0.066 inch actual), width 48-60 inches, in coils, 2B finish. Source: Compiled from data submitted in response to Commission questionnaires. Figure V-5 Stainless steel sheet and strip: Weighted-average prices and quantities of domestic and imported product 1, by quarters, January 2013-December 2015
* * * * * * * Figure V-6 Stainless steel sheet and strip: Weighted-average prices and quantities of domestic and imported product 2, by quarters, January 2013-December 2015
* * * * * * * Figure V-7 Stainless steel sheet and strip: Weighted-average prices and quantities of domestic and imported product 3, by quarters, January 2013-December 2015
* * * * * * *
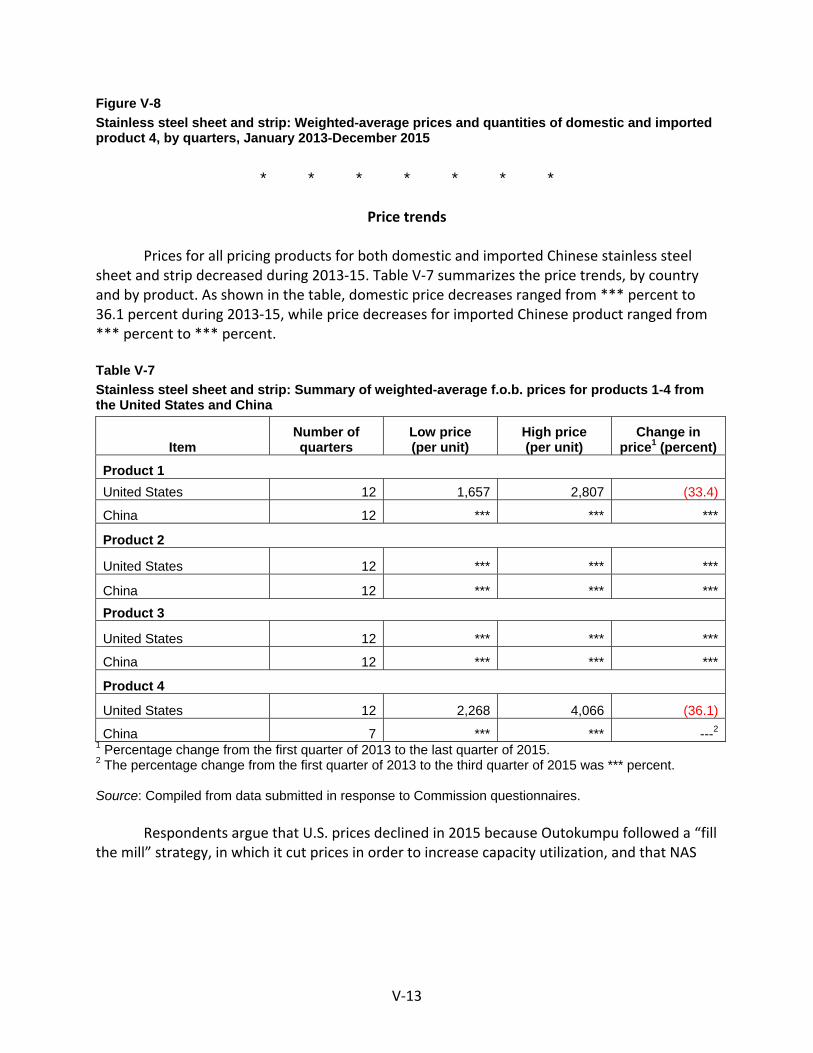
V‐13
Figure V-8 Stainless steel sheet and strip: Weighted-average prices and quantities of domestic and imported product 4, by quarters, January 2013-December 2015
* * * * * * *
Price trends
Prices for all pricing products for both domestic and imported Chinese stainless steel sheet and strip decreased during 2013‐15. Table V‐7 summarizes the price trends, by country and by product. As shown in the table, domestic price decreases ranged from *** percent to 36.1 percent during 2013‐15, while price decreases for imported Chinese product ranged from *** percent to *** percent. Table V-7 Stainless steel sheet and strip: Summary of weighted-average f.o.b. prices for products 1-4 from the United States and China
Item Number of quarters
Low price (per unit)
High price (per unit)
Change in price1 (percent)
Product 1 United States 12 1,657 2,807 (33.4)
China 12 *** *** ***
Product 2
United States 12 *** *** ***
China 12 *** *** ***
Product 3
United States 12 *** *** ***
China 12 *** *** ***
Product 4
United States 12 2,268 4,066 (36.1)
China 7 *** *** ---2
1 Percentage change from the first quarter of 2013 to the last quarter of 2015. 2 The percentage change from the first quarter of 2013 to the third quarter of 2015 was *** percent. Source: Compiled from data submitted in response to Commission questionnaires. Respondents argue that U.S. prices declined in 2015 because Outokumpu followed a “fill the mill” strategy, in which it cut prices in order to increase capacity utilization, and that NAS

V‐14
and the other domestic producers followed this strategy.13 Petitioners argue that ***, and that ***.14
Price comparisons
As shown in table V‐8, prices for stainless steel sheet and strip imported from China were below those for U.S.‐produced product in 21 of 43 instances (*** short tons); margins of underselling ranged from 0.3 to 21.0 percent. In the remaining 22 instances, prices for stainless steel sheet and strip imported from China were between *** and *** percent above prices for the domestic product. Table V-8 Stainless steel sheet and strip: Instances of underselling/overselling of Chinese product and the range and average of margins, by pricing product, January 2013-December 2015
Product
Underselling
Number of quarters
Quantity1 (short tons)
Average margin
(percent)
Margin range (percent)
Min Max
Product 1 3 *** *** *** *** Product 2 8 *** *** *** ***Product 3 5 *** *** *** *** Product 4 5 *** *** *** *** Total2
21 *** 5.4 0.3 21.0
Product
(Overselling)
Number of quarters
Quantity1 (short tons)
Average margin
(percent)
Margin range (percent)
Min Max
Product 1 9 *** *** *** ***Product 2 4 *** *** *** ***Product 3 7 *** *** *** ***Product 4 2 *** *** *** *** Total3
22 *** (7.8) (0.5) (32.2)1 These data include only quarters in which there is a comparison between the U.S. and subject product. 2 On an annual basis, there were four instances of underselling during 2013, 13 instances of underselling during 2014, and four instances of underselling during 2015. 3 On an annual basis, there were nine instances of overselling during 2013, two instances of overselling during 2014, and 11 instances of overselling during 2015. Source: Compiled from data submitted in response to Commission questionnaires.
13 Conference transcript, p. 110 (Neeley); Respondents’ postconference brief, pp. 1‐2, 8‐9, and exhibits 8 and 9.
14 Petitioners’ postconference brief, p. 10. Of the 48 quarters of price comparisons for the four products, ***.
V‐15
LOST SALES AND LOST REVENUE
All four U.S. producers reported that they had to reduce prices, three reported that they had to roll back announced price increases, and all four reported that they had lost sales. All four U.S. producers also submitted the lost sale and lost revenue allegations, identifying 26 firms where they lost sales or revenue (19 consisting lost sales allegations, and seven consisting of both lost sales and lost revenues allegations). U.S. producers were also asked to provide information regarding the timing, method of sale, and product type related to the lost sales and lost revenue allegations. NAS ***. NAS and Allegheny listed all methods of sale as ***, AK Steel listed ***, and Outokumpu listed ***. Regarding product type, NAS listed ***; Allegheny listed “***;” AK Steel listed ***; and Outokumpu listed ***.
Staff contacted these 26 purchasers and received responses from 14 of them. Responding purchasers reported purchasing approximately 2.0 million short tons of stainless steel sheet and strip during 2013‐15, including 660,962 short tons in 2015 (table V‐9). During 2015, purchasers purchased 65.1 percent from U.S. producers, 9.4 percent from China, 14.5 percent from nonsubject sources, and 10.9 percent from “unknown source” countries.15 Of the responding purchasers, four reported decreasing purchases from domestic producers, one reported increasing purchases, four reported no change, and four reported fluctuating purchases. For the firms that reported decreasing purchases from domestic sources, three reported lead time delays and availability constraints as the reasons. The purchaser that reported increasing purchases from domestic producers (***) reported doing so because “availability improved.”
Of the 14 responding purchasers, 11 reported that they had shifted purchases of stainless steel sheet and strip from U.S. producers to imports from China since 2013. Seven of these purchasers reported that price was the reason for the shift, and their reported quantities of shifted purchases ranged from *** to *** short tons, for a total of approximately 52,900 short tons (table V‐10).16 One purchaser also reported shifting due to limited availability of domestic polished coil in 2014.
Of the 14 responding purchasers, seven reported that U.S. producers had reduced prices in order to compete with lower‐priced imports from China (table V‐11); five reported that they did not know. The reported estimated price reductions ranged from 6.0 to 35.0 percent. In describing the price reductions, purchasers noted that that the price of nickel dropped “approximately 30 percent” during 2015, that domestic mills had reduced their base price for 304 2B gauge by 25.7 percent, and that price reductions occurred seven times in 2015 due to “an oversaturation of stainless steel ordered from foreign sources in the second half of 2014.”
15 *** reported that it purchased exclusively from domestic companies, but it did not track the country of origin for the material that it purchased, and so reported all of its purchases under “sources unknown.”
16 Importer *** reported shifting an estimated *** short tons from domestic to imported product from China from 2013 to 2015, but ***. After staff contacted *** seeking clarification, it reported that ***.” Email from ***, March 16, 2016.

V‐16
Table V-9 Stainless steel sheet and strip: Purchasers’ responses to purchasing patterns
* * * * * * * Table V-10 Stainless steel sheet and strip: Purchasers’ responses to shifting supply sources
* * * * * * * Table V-11 Stainless steel sheet and strip: Purchasers’ responses to U.S. producer price reductions
* * * * * * *
In responding to the lost sales lost revenue survey, some purchasers provided additional information on purchases and market dynamics. *** reported that:
“***.”

VI‐1
PART VI: FINANCIAL EXPERIENCE OF U.S. PRODUCERS
BACKGROUND Four integrated U.S. producers, AK Steel, Allegheny, NAS, and Outokumpu, reported
their financial results on stainless steel sheet and strip.1 While no U.S. producer represented the majority of overall stainless steel sheet and strip revenue, *** accounted for the largest share of total sales value in 2015 (*** percent), followed by *** (*** percent), *** (*** percent), and *** ***.2
*** reported purchasing *** of inputs from related suppliers (*** percent of COGS, respectively). *** companies confirmed that these inputs were reported in a manner consistent with the firm’s accounting books and records.3 4
OPERATIONS ON STAINLESS STEEL SHEET AND STRIP
Table VI‐1 presents aggregated data on U.S. producers’ operations in relation to
stainless steel sheet and strip over the period examined, while table VI‐2 presents selected company‐specific financial data.5
1 All four U.S. producers reported their annual financial results on a calendar‐year basis. With the exception of Outokumpu, which reported on the basis of International Financial Reporting Standards (IFRS), U.S. producers reported their financial results on the basis of Generally Accepted Accounting Principles (“GAAP”).
2 As mentioned in a previous section of this report, ThyssenKrupp constructed the Calvert, Alabama facility, which became operational in 2010. Outokumpu Oyj. (Outokumpu’s parent company) purchased ThyssenKrupp’s global stainless steel division, Inoxum, which included the stainless producing portion of the Calvert plant.
3 U.S. producer questionnaires, responses to III‐7 and III‐8. 4 The Commission’s current practice requires that relevant cost information associated with input
purchases from related suppliers correspond to the manner in which this information is reported in the U.S. producer’s own accounting books and records. See 1,1,1,2‐Tetrafluoroethane from China, Inv. Nos. 701‐TA‐509 and 731‐TA‐1244 (Final), USITC Publication 4503, December 2014, pp. 23 and 37.
5 Outokumpu has a toll agreement with AM/NS Calvert (the joint venture that owns that carbon steel portion of the Calvert facility) to hot‐roll slabs and ingots for Outokumpu. In 2015, *** percent of Outokumpu’s hot‐rolling was toll‐produced by AM/NS Calvert. The tolling fees accounted for approximately *** percent of Outokumpu’s COGS in 2015 and were reported in ***. Conference transcript, pp. 75‐76 (Vormizeele); Michael Kerwin, economic consultant, email message with attachment to USITC auditor, March, 3 2016; and Patrick Grundke, CFO Outokumpu Business Area Coil Americas, email message to USITC auditor March 9, 2016. The other three responding U.S. producers reported a small amount of toll processing related to stainless steel sheet and strip, mainly for finishing operations such as slitting, cutting‐to‐length, polishing, and aluminizing. The tolling fees encountered by these companies accounted for between *** and *** percent of their company‐specific COGS in 2015, and have minimal impact on the financial data. Conference transcript pp. 76‐77 (Hartford), p. 77 (Lyons),
(continued...)

VI‐2
Revenue
Net sales primarily reflect commercial sales (*** of total sales quantity during 2013‐15), followed by transfers (*** of total sales volume during 2014‐15).6 Internal consumption, the smallest revenue category, accounted for *** percent of total sales volume in 2013, 2014, and 2015.7
Net sales, by both quantity and value, increased from 2013 to 2014, and decreased from 2014 to 2015 to levels below 2013. As shown in table VI‐2, the directional trend of company‐specific sales quantity was largely uniform (***). The directional trend of company‐specific net sales values was uniform (with ***).
The directional trend of company‐specific average sales values was uniform, increasing between 2013 and 2014 and decreasing between 2014 and 2015, with ***. From 2013 to 2015, the overall net sales value decreased by 9.6 percent from $2,194 per short ton in 2013 to $1,983 per short ton in 2015. As shown in table VI‐2, *** consistently reported the *** average value, followed by ***.
(…continued) and p. 77 (Pfeiffer) and Michael Kerwin, economic consultant, email message with attachment to USITC auditor, March, 3 2016.
6 The transfers to related firms were sales of stainless steel sheet and strip by *** to ***. *** U.S. producer questionnaire, response to II‐10.
7 Internal consumption was reported by *** and was described as ***. ***, email message with attachment to USITC auditor, March, 3 2016.

VI‐3
Table VI-1 Stainless steel sheet and strip: Results of operations of U.S. producers, 2013-15
Item Fiscal year
2013 2014 2015 Quantity (short tons) Commercial sales *** *** ***Internal consumption1 *** *** ***Transfers to related firms1 *** *** ***
Total net sales 1,877,070 2,080,335 1,839,856 Value (1,000 dollars) Commercial sales *** *** ***Internal consumption1 *** *** ***Transfers to related firms1 *** *** ***
Total net sales 4,118,512 4,868,009 3,647,587 Cost of goods sold.-- Raw materials 2,746,199 3,138,071 2,280,550
Direct labor 254,204 286,983 250,696 Other factory costs 1,088,467 1,212,934 1,149,948
Total COGS 4,088,870 4,637,988 3,681,194 Gross profit 29,642 230,021 (33,607)SG&A expense 126,493 145,259 116,139 Operating income or (loss) (96,851) 84,762 (149,746)Other expense or (income), net 50,369 51,517 123,397 Net income or (loss) (147,220) 33,245 (273,143)Depreciation/amortization 164,581 144,521 145,199 Cash flow 17,361 177,766 (127,944) Ratio to net sales (percent) Cost of goods sold.-- Raw materials 66.7 64.5 62.5
Direct labor 6.2 5.9 6.9 Other factory costs 26.4 24.9 31.5
Average COGS 99.3 95.3 100.9 Gross profit 0.7 4.7 (0.9)SG&A expense 3.1 3.0 3.2 Operating income or (loss) (2.4) 1.7 (4.1)Net income or (loss) (3.6) 0.7 (7.5)
Table continued on the next page.
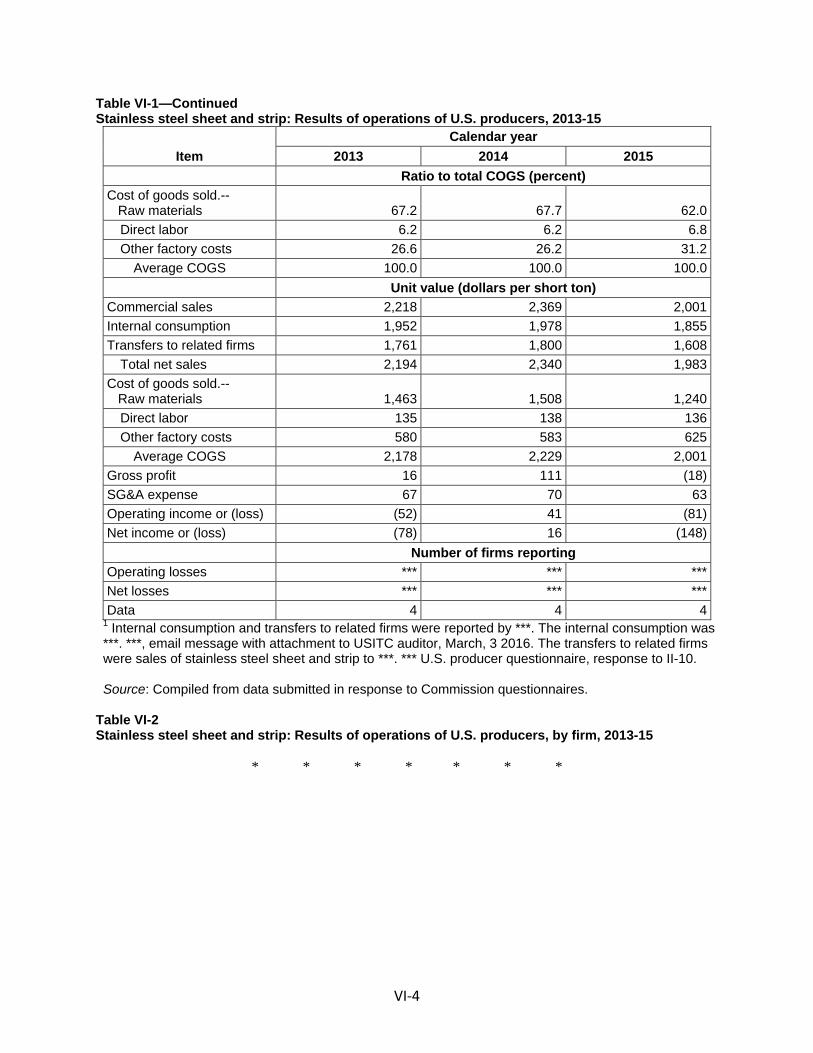
VI‐4
Table VI-1—Continued Stainless steel sheet and strip: Results of operations of U.S. producers, 2013-15
Item Calendar year
2013 2014 2015 Ratio to total COGS (percent) Cost of goods sold.-- Raw materials 67.2 67.7 62.0
Direct labor 6.2 6.2 6.8 Other factory costs 26.6 26.2 31.2
Average COGS 100.0 100.0 100.0 Unit value (dollars per short ton)
Commercial sales 2,218 2,369 2,001 Internal consumption 1,952 1,978 1,855 Transfers to related firms 1,761 1,800 1,608
Total net sales 2,194 2,340 1,983 Cost of goods sold.-- Raw materials 1,463 1,508 1,240
Direct labor 135 138 136 Other factory costs 580 583 625
Average COGS 2,178 2,229 2,001 Gross profit 16 111 (18)SG&A expense 67 70 63 Operating income or (loss) (52) 41 (81)Net income or (loss) (78) 16 (148) Number of firms reporting Operating losses *** *** ***Net losses *** *** ***Data 4 4 4
1 Internal consumption and transfers to related firms were reported by ***. The internal consumption was ***. ***, email message with attachment to USITC auditor, March, 3 2016. The transfers to related firms were sales of stainless steel sheet and strip to ***. *** U.S. producer questionnaire, response to II-10. Source: Compiled from data submitted in response to Commission questionnaires. Table VI-2 Stainless steel sheet and strip: Results of operations of U.S. producers, by firm, 2013-15
* * * * * * *

VI‐5
Cost of goods sold and gross profit or (loss) *** as the primary raw materials in the production of stainless steel sheet and strip.
***, while ***.8 As shown in table VI‐1 raw material costs represented the largest component of COGS,
accounting for 67.2 percent in 2013, 67.7 percent in 2014, and 62.0 percent in 2015. This pattern generally reflects a combination of somewhat lower raw material costs in 2015 compared to 2013, and a corresponding increase in average other factory costs during this time.9 Table VI‐2 shows that company‐specific average raw material costs were mostly uniform, increasing from 2013 to 2014, and decreasing from 2014 to 2015. The ***.10 *** consistently had the lowest average raw material costs.
Other factory costs were the second largest component of COGS, accounting for between 26.2 percent in 2014 and 31.2 percent in 2015, while direct labor accounted for between 6.2 percent in 2013 and 2014 to 6.8 percent in 2015.11
The industry’s gross profits increased from $29.6 million in 2013 to $230.0 million in 2014, before decreasing to a net loss of $33.6 million in 2015. The increase in gross profit in 2014 reflects an increase in the gross margin from $16 per short ton to $111 per short ton (per‐short ton net sales values increased more than the increase in per‐short ton COGS) as well as an increase in the net sales quantity. Conversely, from 2014 to 2015, the gross margin decreased from $111 per short ton to a negative $18 per short ton. While the per‐short ton unit COGS decreased during this time, the per‐short ton sales values decreased to a greater extent.
While ***.
8 ***, email message with attachments to USITC auditor, March, 3 2016. 9 Average direct labor stayed within a relatively narrow range fluctuating between $*** and $*** per
short ton. 10 Dr. Philipp Vormizeele, Senior Vice President and General Counsel of Outokumpu testified at the
staff conference that “Outokumpu is the result of a merger between the former Outokumpu operations based in Finland and the former ThyssenKrupp stainless activities in Germany. The merger was announced in January 2012, and followed a rather long merger control proceeding with the European Commission.” The merger was approved in 2012, “but included some remedies that Outokumpu had to fulfill.” When ThyssenKrupp owned the Calvert facility, its cold‐rolling mill was supplied by its sister company in Terni, Italy. One of the requirements issued by the European Commission was that Outokumpu would continue supplying the Calvert facility with hot‐rolled steel from the Terni, Italy plant until it was sold. Conference transcript, pp. 73‐75.
11 ***.
VI‐6
SG&A expenses and operating profit or (loss) As shown in table VI‐1, the industry’s SG&A expense ratio (i.e., total SG&A expenses
divided by total revenue) moved within a relatively narrow range, from 3.0 percent in 2014 to 3.2 percent in 2015. Table VI‐2 shows that most company‐specific SG&A expenses were directionally similar, ***. The ***.12
All other expenses and net income or (loss)
All other expenses (net of all other income) remained relatively unchanged from 2013 to 2014 (increasing by 2.3 percent). However, from 2014 to 2015, it increased by 139.5 percent, which contributed to the worsening of the already negative net income. *** of this increase can be attributed to ***, which reported ***.13 By definition, items classified at this level of the income statement only affect net income or (loss).
Net income followed the same trend as operating income, fluctuating from a *** in 2013, to *** in 2014, and then to a *** in 2015.
Variance analysis
A variance analysis for the operations of U.S. producers of stainless steel sheet and strip
is presented in table VI‐3.14 The information for this variance analysis is derived from table VI‐1. The analysis indicates that from 2013 to 2015, the decrease in operating income is attributable to an unfavorable price variance despite a favorable net cost/expense variance (i.e., prices decreased more than costs and expenses).
12 ***. 13 ***. 14 The Commission’s variance analysis is calculated in three parts: Sales variance, cost of sales
variance (COGS variance), and SG&A expense variance. Each part consists of a price variance (in the case of the sales variance) or a cost or expense variance (in the case of the COGS and SG&A expense variance), and a volume variance. The sales or cost/expense variance is calculated as the change in unit price or per‐unit cost/expense times the new volume, while the volume variance is calculated as the change in volume times the old unit price or per‐unit cost/expense. Summarized at the bottom of the table, the price variance is from sales; the cost/expense variance is the sum of those items from COGS and SG&A variances, respectively, and the volume variance is the sum of the volume components of the net sales, COGS, and SG&A expense variances. The overall volume component of the variance analysis is generally small.

VI‐7
Table VI-3 Stainless steel sheet and strip: Variance analysis on the operations of U.S. producers, between fiscal years
Item Between fiscal years
2013-15 2013-14 2014-15 Net sales: Price variance (389,273) 303,510 (657,698)
Volume variance (81,652) 445,987 (562,724)Net sales variance (470,925) 749,497 (1,220,422)
COGS: Price variance 326,612 (106,341) 420,660
Volume variance 81,064 (442,777) 536,134 COGS variance 407,676 (549,118) 956,794
Gross profit vairance (63,249) 200,379 (263,628)SG&A expenses: Cost/expense variance 7,846 (5,068) 12,329
Volume variance 2,508 (13,698) 16,791 Total SG&A expense variance 10,354 (18,766) 29,120
Operating income variance (52,895) 181,613 (234,508)Summarized as: Price variance (389,273) 303,510 (657,698)
Net cost/expense variance 334,458 (111,409) 432,988 Net volume variance 1,920 (10,488) (9,798)
Source: Compiled from data submitted in response to Commission questionnaires.
CAPITAL EXPENDITURES AND RESEARCH AND DEVELOPMENT EXPENSES
Table VI‐4 presents capital expenditures and research and development (“R&D”) expenses by firm. Capital expenditures decreased by *** percent from 2013 to 2015. As shown in table VI‐4 ***.
Table VI-4 Stainless steel sheet and strip: Capital expenditures and research and development expenses of U.S. producers, 2013-15
* * * * * * *

VI‐8
ASSETS AND RETURN ON INVESTMENT
Table VI‐5 presents data on the U.S. producers’ total assets and their return on investment (“ROI”). Total assets increased from $3.2 million in 2013 to $3.8 million in 2014 and decreased to $3.4 million in 2015. Table VI-5 Stainless steel sheet and strip: U.S. producers’ total assets and return on investment, 2013-15
Firm Fiscal years
2013 2014 2015 Total net assets ($1,000) AK Steel *** *** ***Allegheny *** *** ***NAS *** *** ***Outokumpu *** *** ***
Total net assets 3,202,133 3,752,897 3,352,936 Operating income or (loss) to net assets (percent) AK Steel *** *** ***Allegheny *** *** ***NAS *** *** ***Outokumpu *** *** ***
Average operating income or (loss) to net assets (3.0) 2.3 (4.5) Asset turnover (expressed as a multiple) AK Steel *** *** ***Allegheny *** *** ***NAS *** *** ***Outokumpu *** *** ***
Average operating income or (loss) to net assets 1.3 1.3 1.1 Source: Compiled from data submitted in response to Commission questionnaires.

VI‐9
CAPITAL AND INVESTMENT
The Commission requested U.S. producers of stainless steel sheet and strip to describe any actual or potential negative effects of imports of stainless steel sheet and strip from China on their firms’ growth, investment, ability to raise capital, development and production efforts, or the scale of capital investments. Table VI‐6 presents U.S. producers’ responses in a tabulated format and table VI‐7 provided the narrative responses.
Table VI-6 Stainless steel sheet and strip: Actual and anticipated negative effects of imports on investment, growth, and development, since January 1, 2013
Item No Yes Negative effects on investment 0 4
Cancellation, postponement, or rejection of expansion projects
1 Denial or rejection of investment proposal 1 Reduction in the size of capital investments 1 Return on specific investments negatively
impacted 1 Other 2
Negative effects on growth and development 0 4 Rejection of bank loans
1 Lowering of credit rating 2 Problem related to the issue of stocks or bonds 1 Ability to service debt 1 Other 4
Anticipated negative effects of imports 0 4 Source: Compiled from data submitted in response to Commission questionnaires.
Terry Hartford, Vice President and General Manager of Allegheny’s stainless sheet business testified at the staff conference that a $1.2 billion capital investment in a hot‐rolling and processing facility which Allegheny uses to hot‐roll stainless steel sheet and strip is running fewer days than planned due to “weak conditions in the U.S. market caused by the dumped and subsidized imports from China.” He further testified that the weak pricing for stainless steel sheet and strip products is “preventing {Allegheny} from earning a return on {its} capital investment.”15 Similarly, Steven Letnich, Vice President of Sales for Coil Americas, for Outokumpu Stainless USA, testified that at the time of Outokumpu’s original investment in the stainless steel sheet and strip facility in Calvert, Alabama (previously owned by ThyssenKrupp), “the U.S. market was strong and stable.” He further testified that, “a massive increase in low‐
15 Conference transcript, p. 18 (Hartford).

VI‐10
priced imports from China have far outstripped the increases in U.S. demand… ultimately endanger{ing} the business rationale for the original investment in Alabama.”16
As presented in table VI‐7, one or more U.S. producers reported each of the following conditions: cancellation, postponement, or rejection of expansion projects; denial or rejection of investment proposal; reduction in the size of capital investments; return on specific investments negatively impacted; rejection of bank loans; lowering of credit rating; problem related to the issue of stocks or bonds; ability to service debt; and anticipated negative effects from imports). ***. ***.
Table VI-7 Stainless steel sheet and strip: Narratives relating to the actual and anticipated negative effects of imports on investment, growth, and development, since January 1, 2013
* * * * * * *
16 Conference transcript, p. 32 (Letnich).

VII‐1
PART VII: THREAT CONSIDERATIONS AND INFORMATION ON NONSUBJECT COUNTRIES
Section 771(7)(F)(i) of the Act (19 U.S.C. § 1677(7)(F)(i)) provides that—
In determining whether an industry in the United States is threatened with material injury by reason of imports (or sales for importation) of the subject merchandise, the Commission shall consider, among other relevant economic factors1‐‐ (I) if a countervailable subsidy is involved, such information as may
be presented to it by the administering authority as to the nature of the subsidy (particularly as to whether the countervailable subsidy is a subsidy described in Article 3 or 6.1 of the Subsidies Agreement), and whether imports of the subject merchandise are likely to increase,
(II) any existing unused production capacity or imminent, substantial increase in production capacity in the exporting country indicating the likelihood of substantially increased imports of the subject merchandise into the United States, taking into account the availability of other export markets to absorb any additional exports,
(III) a significant rate of increase of the volume or market penetration of imports of the subject merchandise indicating the likelihood of substantially increased imports,
(IV) whether imports of the subject merchandise are entering at prices that are likely to have a significant depressing or suppressing effect on domestic prices, and are likely to increase demand for further imports,
(V) inventories of the subject merchandise,
1 Section 771(7)(F)(ii) of the Act (19 U.S.C. § 1677(7)(F)(ii)) provides that “The Commission shall consider {these factors} . . . as a whole in making a determination of whether further dumped or subsidized imports are imminent and whether material injury by reason of imports would occur unless an order is issued or a suspension agreement is accepted under this title. The presence or absence of any factor which the Commission is required to consider . . . shall not necessarily give decisive guidance with respect to the determination. Such a determination may not be made on the basis of mere conjecture or supposition.”
VII‐2
(VI) the potential for product‐shifting if production facilities in the foreign country, which can be used to produce the subject merchandise, are currently being used to produce other products,
(VII) in any investigation under this title which involves imports of both a raw agricultural product (within the meaning of paragraph (4)(E)(iv)) and any product processed from such raw agricultural product, the likelihood that there will be increased imports, by reason of product shifting, if there is an affirmative determination by the Commission under section 705(b)(1) or 735(b)(1) with respect to either the raw agricultural product or the processed agricultural product (but not both),
(VIII) the actual and potential negative effects on the existing development and production efforts of the domestic industry, including efforts to develop a derivative or more advanced version of the domestic like product, and
(IX) any other demonstrable adverse trends that indicate the probability that there is likely to be material injury by reason of imports (or sale for importation) of the subject merchandise (whether or not it is actually being imported at the time).2
Information on the nature of the subsidies was presented earlier in this report; information on the volume and pricing of imports of the subject merchandise is presented in Parts IV and V; and information on the effects of imports of the subject merchandise on U.S. producers’ existing development and production efforts is presented in Part VI. Information on inventories of the subject merchandise; foreign producers’ operations, including the potential for “product‐shifting;” any other threat indicators, if applicable; and any dumping in third‐country markets, follows. Also presented in this section of the report is information obtained for consideration by the Commission on nonsubject countries.
2 Section 771(7)(F)(iii) of the Act (19 U.S.C. § 1677(7)(F)(iii)) further provides that, in antidumping investigations, “. . . the Commission shall consider whether dumping in the markets of foreign countries (as evidenced by dumping findings or antidumping remedies in other WTO member markets against the same class or kind of merchandise manufactured or exported by the same party as under investigation) suggests a threat of material injury to the domestic industry.”

VII‐3
THE INDUSTRY IN CHINA
The petition listed 157 producers of stainless steel sheet and strip in China.3 The Commission received questionnaire responses from seven producers of stainless steel sheet and strip in China,4 which are believed to account for approximately *** percent of total production in China and 66.0 percent of exports to the United States of the subject product from China in 2015.5 These firms are identified in table VII‐1 along with each firm’s capacity, production, and export shipment data.
Table VII‐1 Stainless steel sheet and strip: Reporting producers of stainless steel sheet and strip in China, production, share of reported production, exports to the United States, and share of exports to the United States, total shipments, and share of total shipments exported to the United States, by firm, 2015
Firm Production (short tons)
Share of reported production (percent)
Exports to the United States (short
tons)
Share of reported exports to the United States
(percent)
Total shipments (short tons)
Share of firm's total shipments exported to the United States
(percent)
Baosteel *** *** *** *** *** ***
Tiancheng *** *** *** *** *** ***
Baoxin *** *** *** *** *** ***
Qiyi *** *** *** *** *** ***
STAL *** *** *** *** *** ***
Taigang *** *** *** *** *** ***
Taiyuan Ri De Tai *** *** *** *** *** ***
Total/average 4,286,849 100.0 81,266 100.0 4,278,386 1.9
Source: Compiled from data submitted in response to Commission questionnaires.
3 The list of producers of stainless steel sheet and strip in China, as set forth in exhibit GEN‐5 by the petitioners, fails to list the requisite contact information for many of the listed firms. Moreover, many of the firms listed appear to be global logistics firms that although they may have been the importer of record, are clearly not producers of stainless steel sheet and strip in China. Therefore, it appears that petitioners’ list of producers of stainless steel sheet and strip in China may overstate the number of actual producers.
Proprietary import data obtained from CBP shows that *** percent of all U.S. imports of stainless steel sheet and strip in 2015 was produced by 10 producers in China. These firms include in order of descending import volume in 2015: ***.
4 These firms include: (1) Shanxi Taigang Stainless Steel Co., Ltd. (“Taigang”); (2) Baosteel Stainless Steel Co., Ltd. (“Baosteel”); (3) Ningbo Baoxin Stainless Steel Co., Ltd. (“Baoxin”); (4) Taiyuan Ri De Tai Xing Precision Stainless Steel Co., Ltd. (“Taiyuan Ri De Tai”); (5) Ningbo Qiyi Precision Metals Co., Ltd. (“Qiyi”); (6) Guanghan Tiancheng Stainless Steel Products Co., Ltd. (“Tiancheng”); and (7) Shanghai STAL Precision Stainless Steel Co., Ltd. (“STAL”).
5 For information regarding the estimation of the share of reporting producers in China see, Part I, Summary Data and Data Sources, supra.

VII‐4
Data for the stainless steel sheet and strip industry in China
Table VII‐2 presents data for reported capacity, production, and shipments of stainless steel sheet and strip for all reporting producers in China. Collectively, producers in China reported that stainless steel sheet and strip capacity increased by 23.7 percent from 2013 to 2015 and is projected to ***.6 7 Their reported production increased by 28.0 percent from 2013 to 2015 and is projected to ***. In 2015, producers in China reported that 2.5 percent of their total shipments of stainless steel sheet and strip were internally consumed, 84.6 percent were commercial sales to their home market, 1.9 percent were exported to the United States, and 11.0 percent were exported to other markets, including ***.
6 ***. 7 Data compiled by ***. Petitioners’ postconference brief, exh. 13.

VII‐5
Table VII‐2 Stainless steel sheet and strip: China’s reported production capacity, production, shipments, and inventories, 2013‐15
Item
Calendar year
Actual experience Projections
2013 2014 2015 2016 2017
Quantity (short tons)
Capacity 4,091,033 4,780,200 5,060,700 *** ***
Production 3,348,659 4,009,416 4,286,849 *** ***
End‐of‐period inventories 137,471 190,963 199,489 *** ***
Shipments: Home market shipments: Internal consumption/ transfers 72,106 56,785 105,240 *** ***
Commercial shipments 2,723,384 3,077,185 3,619,179 *** ***
Subtotal, home market shipments 2,795,490 3,133,970 3,724,419 *** ***
Export shipments to: United States 45,623 109,740 81,266 *** ***
All other markets 457,882 711,877 472,701 *** ***
Total exports 503,505 821,617 553,967 *** ***
Total shipments 3,298,995 3,955,587 4,278,386 *** ***
Ratios and shares (percent)
Capacity utilization 81.9 83.9 84.7 *** ***
Inventories/production 4.1 4.8 4.7 *** ***
Inventories/total shipments 4.2 4.8 4.7 *** ***
Share of shipments: Home market shipments: Internal consumption/ transfers 2.2 1.4 2.5 *** ***
Home market shipments 82.6 77.8 84.6 *** ***
Subtotal, home market shipments 84.7 79.2 87.1 *** ***
Export shipments to: United States 1.4 2.8 1.9 *** ***
All other markets 13.9 18.0 11.0 *** ***
Total exports 15.3 20.8 12.9 *** ***
Total shipments 100.0 100.0 100.0 100.0 100.0 Source: Compiled from data submitted in response to Commission questionnaires.

VII‐6
Potential product shifting in production facilities in China
Table VII‐3 presents overall capacity and production in China on manufacturing equipment used to produce stainless steel sheet and strip and other products. As shown, producers in China use approximately 95 percent or more of their overall capacity to produce stainless steel sheet and strip. *** producers in China reported that they are able to switch production from stainless steel sheet and strip to another product using the same manufacturing equipment and labor.8 *** producers in China reported that they are able to produce other products using their overall capacity.9 *** reported that it produced ***. *** reported that it produced ***10 during 2013‐15.
Table VII‐3
Stainless steel sheet and strip: Chinese producers’ overall capacity and production on the same equipment as subject production, 2013‐15
Item
Calendar year
2013 2014 2015
Quantity (short tons)
Overall capacity 4,200,700 4,895,791 5,176,195
Production: Stainless steel sheet and strip 3,348,659 4,009,416 4,286,849
All other products 184,769 195,463 149,657
Total production on same machinery 3,533,428 4,204,879 4,436,506
Ratios and shares (percent)
Overall capacity utilization 84.1 85.9 85.7
Share of production: Stainless steel sheet and strip 94.8 95.4 96.6
All other products 5.2 4.6 3.4
Total production on same machinery 100.0 100.0 100.0 Source: Compiled from data submitted in response to Commission questionnaires.
Exports of stainless steel sheet and strip from China
Data from reporting producers in China in Table VII‐2 depicted that 1.9 percent of their total shipments of stainless steel sheet and strip were exported to the United States and that 11.0 percent were exported to other markets. Table VII‐4 presents overall export shipments of stainless steel sheet and strip from China. As shown, the Asian markets of Taiwan, Korea, and Vietnam were the largest export markets for the subject product during 2013‐15.
8 Questionnaire responses of ***, question II‐4e(i). 9 Questionnaire responses of ***, question II‐4a. ***. 10 ***.

VII‐7
Table VII‐4
Stainless steel sheet and strip: Exports from China of stainless steel sheet and strip, by destination market, 2013‐15
Item
Calendar year
2013 2014 2015
Quantity (short tons)
Exports from China to the United States 61,851 159,371 123,093
Exports from China to other major destination markets.‐‐ Taiwan 529,486 606,143 504,758
Korea 284,064 523,419 471,453
Vietnam 171,473 246,483 294,713
India 115,389 232,223 275,559
Italy 74,372 202,841 99,842
Pakistan 52,794 64,140 71,707
Indonesia 35,643 61,439 71,421
Malaysia 39,213 64,639 63,498
All other destination markets 396,570 582,332 451,105
Total exports from China 1,760,856 2,743,031 2,427,149
Share of quantity (percent)
Exports from China to the United States 3.5 5.8 5.1
Exports from China to other major destination markets.‐‐ Taiwan 30.1 22.1 20.8
Korea 16.1 19.1 19.4
Vietnam 9.7 9.0 12.1
India 6.6 8.5 11.4
Italy 4.2 7.4 4.1
Pakistan 3.0 2.3 3.0
Indonesia 2.0 2.2 2.9
Malaysia 2.2 2.4 2.6
All other destination markets 22.5 21.2 18.6
Total exports from China 100.0 100.0 100.0
Source: Official Chinese exports statistics under HTS subheading 7219.13, 7219.14, 7219.23, 7219.24, 7219.32, 7219.33, 7219.34, 7219.35, 7219.90, 7220.12, 7220.20, and 7220.90 as reported by China Customs in the GTIS/GTA database, accessed February 26, 2016.

VII‐8
U.S. INVENTORIES OF IMPORTED MERCHANDISE
Table VII‐5 presents data on U.S. importers’ reported inventories of stainless steel sheet and strip.
Table VII‐5 Stainless steel sheet and strip: U.S. importers’ inventories, 2013‐15
* * * * * * *
Source: Compiled from data submitted in response to Commission questionnaires.
U.S. IMPORTERS’ OUTSTANDING ORDERS
The Commission requested U.S. importers to indicate whether they imported or arranged for the importation of stainless steel sheet and strip after December 31, 2015. *** U.S. importers indicated that they had imported or arranged for importation stainless steel sheet and strip from China since December 31, 2015. Table VII‐6 presents the U.S. importers that had imported or arranged for the importation of the subject product from China and the quantity of those U.S. imports.
Table VII‐6 Stainless steel sheet and strip: U.S. importers’ orders of subject imports from China subsequent to December 31, 2015
* * * * * * *
Source: Compiled from data submitted in response to Commission questionnaires.
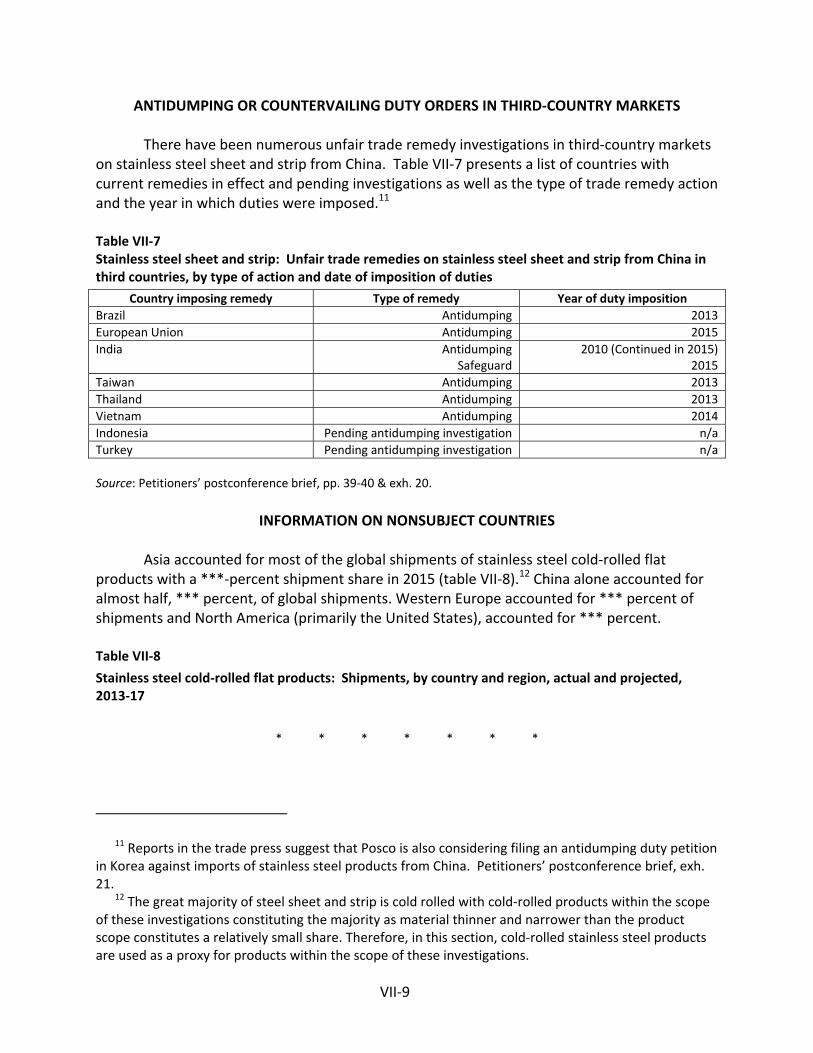
VII‐9
ANTIDUMPING OR COUNTERVAILING DUTY ORDERS IN THIRD‐COUNTRY MARKETS
There have been numerous unfair trade remedy investigations in third‐country markets on stainless steel sheet and strip from China. Table VII‐7 presents a list of countries with current remedies in effect and pending investigations as well as the type of trade remedy action and the year in which duties were imposed.11
Table VII‐7 Stainless steel sheet and strip: Unfair trade remedies on stainless steel sheet and strip from China in third countries, by type of action and date of imposition of duties
Country imposing remedy Type of remedy Year of duty imposition
Brazil Antidumping 2013
European Union Antidumping 2015
India AntidumpingSafeguard
2010 (Continued in 2015)2015
Taiwan Antidumping 2013
Thailand Antidumping 2013
Vietnam Antidumping 2014
Indonesia Pending antidumping investigation n/a
Turkey Pending antidumping investigation n/a
Source: Petitioners’ postconference brief, pp. 39‐40 & exh. 20.
INFORMATION ON NONSUBJECT COUNTRIES
Asia accounted for most of the global shipments of stainless steel cold‐rolled flat products with a ***‐percent shipment share in 2015 (table VII‐8).12 China alone accounted for almost half, *** percent, of global shipments. Western Europe accounted for *** percent of shipments and North America (primarily the United States), accounted for *** percent. Table VII‐8
Stainless steel cold‐rolled flat products: Shipments, by country and region, actual and projected, 2013‐17
* * * * * * *
11 Reports in the trade press suggest that Posco is also considering filing an antidumping duty petition in Korea against imports of stainless steel products from China. Petitioners’ postconference brief, exh. 21.
12 The great majority of steel sheet and strip is cold rolled with cold‐rolled products within the scope of these investigations constituting the majority as material thinner and narrower than the product scope constitutes a relatively small share. Therefore, in this section, cold‐rolled stainless steel products are used as a proxy for products within the scope of these investigations.
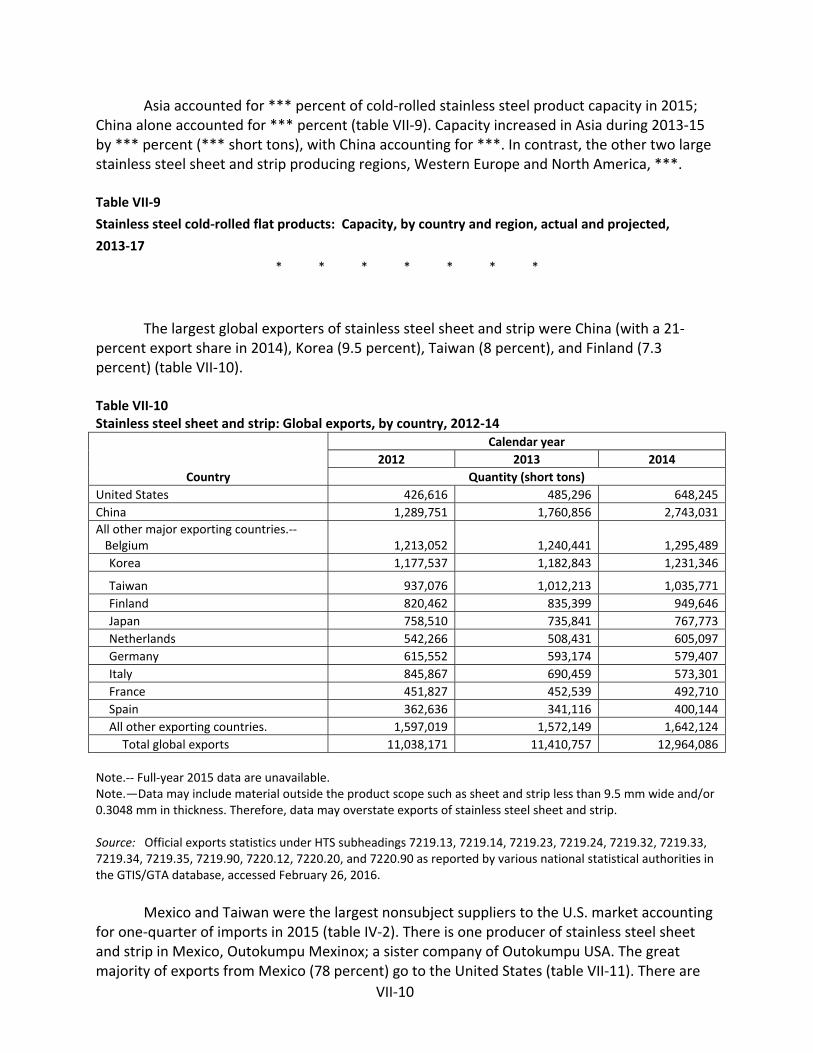
VII‐10
Asia accounted for *** percent of cold‐rolled stainless steel product capacity in 2015; China alone accounted for *** percent (table VII‐9). Capacity increased in Asia during 2013‐15 by *** percent (*** short tons), with China accounting for ***. In contrast, the other two large stainless steel sheet and strip producing regions, Western Europe and North America, ***.
Table VII‐9
Stainless steel cold‐rolled flat products: Capacity, by country and region, actual and projected,
2013‐17
* * * * * * *
The largest global exporters of stainless steel sheet and strip were China (with a 21‐
percent export share in 2014), Korea (9.5 percent), Taiwan (8 percent), and Finland (7.3 percent) (table VII‐10). Table VII‐10 Stainless steel sheet and strip: Global exports, by country, 2012‐14
Country
Calendar year
2012 2013 2014
Quantity (short tons)
United States 426,616 485,296 648,245
China 1,289,751 1,760,856 2,743,031
All other major exporting countries.‐‐ Belgium 1,213,052 1,240,441 1,295,489
Korea 1,177,537 1,182,843 1,231,346
Taiwan 937,076 1,012,213 1,035,771
Finland 820,462 835,399 949,646
Japan 758,510 735,841 767,773
Netherlands 542,266 508,431 605,097
Germany 615,552 593,174 579,407
Italy 845,867 690,459 573,301
France 451,827 452,539 492,710
Spain 362,636 341,116 400,144
All other exporting countries. 1,597,019 1,572,149 1,642,124
Total global exports 11,038,171 11,410,757 12,964,086
Note.‐‐ Full‐year 2015 data are unavailable. Note.—Data may include material outside the product scope such as sheet and strip less than 9.5 mm wide and/or 0.3048 mm in thickness. Therefore, data may overstate exports of stainless steel sheet and strip. Source: Official exports statistics under HTS subheadings 7219.13, 7219.14, 7219.23, 7219.24, 7219.32, 7219.33, 7219.34, 7219.35, 7219.90, 7220.12, 7220.20, and 7220.90 as reported by various national statistical authorities in the GTIS/GTA database, accessed February 26, 2016.
Mexico and Taiwan were the largest nonsubject suppliers to the U.S. market accounting
for one‐quarter of imports in 2015 (table IV‐2). There is one producer of stainless steel sheet and strip in Mexico, Outokumpu Mexinox; a sister company of Outokumpu USA. The great majority of exports from Mexico (78 percent) go to the United States (table VII‐11). There are

VII‐11
*** producers in Taiwan;13 the largest producer is Yieh United Steel Corp. (“YUSCO”) which is the largest integrated steel mill in Southeast Asia.14 Exports from Taiwan are not as concentrated as those from Mexico as Taiwan’s largest export market for stainless steel sheet and strip is Korea with a 9‐percent share (table VII‐12). Table VII‐11 Stainless steel sheet and strip: Exports from Mexico by destination market, 2012‐14
Country Calendar year
2012 2013 2014 Quantity (1,000 short tons) Mexico's exports to the United States 105,935 93,434 89,666Mexico's exports to other major destination markets.‐‐ 6,053 8,192 14,511 China 8,104 4,103 3,797Uruguay 1,112 2,474 1,713Colombia 1,565 2,309 1,694Brazil 782 1,670 1,293Pakistan 1,977 981 680Peru 240 1,185 498Canada 165 540 189All other destination markets 3,804 1,870 879 Total Mexico exports 129,736 116,758 114,920
Share of quantity (percent) Mexico's exports to the United States 81.7 80.0 78.0
Mexico's exports to other major destination markets.— India 4.7 7.0 12.6
China 6.2 3.5 3.3Uruguay 0.9 2.1 1.5Colombia 1.2 2.0 1.5Brazil 0.6 1.4 1.1Pakistan 1.5 0.8 0.6Peru 0.2 1.0 0.4Canada 0.1 0.5 0.2All other destination markets 2.9 1.6 0.8Total Mexico exports 100.0 100.0 100.0
Note.— Full‐year 2015 data are unavailable. Data may include material outside the product scope such as sheet and strip less than 9.5 mm wide and/or 0.3048 mm in thickness. Therefore, data may overstate exports of stainless steel sheet and strip. Source: Official export statistics of Mexico under HTS subheadings 7219.13, 7219.14, 7219.23, 7219.24, 7219.32, 7219.33, 7219.34, 7219.35, 7219.90, 7220.12, 7220.20, and 7220.90 in the GTIS/GTA database, accessed February 26, 2016.
13 Petitioner’s postconference brief, exh. 7, ***. 14 YUSCO, “About YUSCO,” http://www.yusco.com.tw/English/about_yusco_ch.htm, retrieved March
11, 2016. An integrated steel mill produces the stainless steel that is used for its products.

VII‐12
Table VII‐12 Stainless steel sheet and strip: Exports from Taiwan by destination market, 2013‐15
Country
Calendar year
2013 2014 2015
Quantity (1,000 short tons)
Taiwan's exports to the United States 34,182 38,432 42,255
Taiwan's exports to other major destination markets.‐‐ Korea 115,837 104,541 72,314
Turkey 101,830 62,861 68,911
Italy 67,795 83,728 67,949
Russia 39,907 40,550 42,976
China 50,938 53,512 41,903
Iran 48,485 43,301 30,956
Malaysia 39,539 38,468 29,610
Thailand 27,355 33,964 28,919
All other destination markets 486,345 536,414 399,245
Total Taiwan exports
Share of quantity (percent)
Taiwan's exports to the United States 3.4 3.7 5.1
Taiwan's exports to other major destination markets.‐‐ Korea 11.4 10.1 8.8
Turkey 10.1 6.1 8.4
Italy 6.7 8.1 8.2
Russia 3.9 3.9 5.2
China 5.0 5.2 5.1
Iran 4.8 4.2 3.8
Malaysia 3.9 3.7 3.6
Thailand 2.7 3.3 3.5
All other destination markets 48.0 51.8 48.4
Total Taiwan exports 100.0 100.0 100.0
Note.‐‐Data may include material outside the product scope such as sheet and strip less than 9.5 mm wide and/or 0.3048 mm in thickness. Therefore, data may overstate exports of stainless steel sheet and strip. Source: Official export statistics of Taiwan under HTS subheadings 7219.13, 7219.14, 7219.23, 7219.24, 7219.32, 7219.33, 7219.34, 7219.35, 7219.90, 7220.12, 7220.20, and 7220.90 in the GTIS/GTA database, accessed February 26, 2016.

A‐1
APPENDIX A
FEDERAL REGISTER NOTICES


A‐3
The Commission makes available notices relevant to its investigations and reviews on its
website, www.usitc.gov. In addition, the following tabulation presents, in chronological order,
Federal Register notices issued by the Commission and Commerce during the current
proceeding.
Citation Title Link
81 FR 8544 February 19, 2016
Stainless Steel Sheet and Strip From China; Institution of Antidumping and Countervailing Duty Investigations and Scheduling of Preliminary Phase Investigations
https://www.federalregister.gov/articles/2016/02/19/2016‐03434/stainless‐steel‐sheet‐and‐strip‐from‐china‐institution‐of‐antidumping‐and‐countervailing‐duty
81 FR 12711 March 10, 2016
Stainless Steel Sheet and Strip From the People's Republic of China: Initiation of Less Than Fair Value Investigation
https://www.federalregister.gov/articles/2016/03/10/2016‐05405/stainless‐steel‐sheet‐and‐strip‐from‐the‐peoples‐republic‐of‐china‐initiation‐of‐less‐than‐fair
81 FR 13322 March 14, 2016
Stainless Steel Sheet and Strip From the People's Republic of China: Initiation of Countervailing Duty Investigation
https://www.federalregister.gov/articles/2016/03/14/2016‐05469/stainless‐steel‐sheet‐and‐strip‐from‐the‐peoples‐republic‐of‐china‐initiation‐of‐countervailing‐duty

A‐4

B‐1
APPENDIX B
CONFERENCE WITNESSES

B‐2

B‐3
CALENDAR OF PUBLIC PRELIMINARY CONFERENCE
Those listed below appeared as witnesses at the United States International Trade Commission’s preliminary conference:
Subject: Stainless Steel Sheet and Strip from China
Inv. Nos.: 701‐TA‐557 and 731‐TA‐1312 (Preliminary)
Date and Time: March 4, 2016 ‐ 9:30 a.m.
Sessions were held in connection with these preliminary phase investigations in Courtroom A (room 100), 500 E Street, S.W., Washington, DC.
OPENING REMARKS:
Petitioners (Kathleen W. Cannon, Kelley Drye & Warren LLP)
Respondents (Jeffrey S. Neeley, Husch Blackwell LLP) In Support to the Imposition of Antidumping and Countervailing Duty Orders: Kelley Drye & Warren LLP Washington, DC on behalf of AK Steel Corporation Allegheny Ludlum, LLC d/b/a ATI Flat Rolled Products North American Stainless Outokumpu Stainless USA, LLC Terence Hartford, Vice President for ATI Defense, Allegheny Technologies Incorporated Geoff Pfeiffer, General Manager – Specialty Steel Sales, AK Steel Corporation Dan Lebherz, Manager ‐ Specialty Products & Markets, AK Steel Corporation

B‐4
In Support of the Imposition of Antidumping and Countervailing Duty Orders (continued):
Chris Lyons, Vice President, Commercial, North American Stainless Stephen Letnich, Vice President of Sales for Coil Americas, Outokumpu Stainless, LLC William Milon, General Manager, Distribution Sheet Marketing, ATI Flat Rolled Products, Allegheny Technologies Incorporated Philipp Voet van Vormizeele, Senior Vice President – Head of Legal/General Counsel, Corporate Management, Outokumpu Christian Tebroke, Managing Partner, Forell & Tebroke (Consultant to Outokumpu) Jose Ramon Salas, Director General, Outokumpu Mexinox Michael Kerwin, Economic Consultant, Georgetown Economic Services Kathleen W. Cannon ) David A. Hartquist ) ) – OF COUNSEL John M. Herrmann ) Grace W. Kim )

B‐5
In Opposition of the Imposition of Antidumping and Countervailing Duty Orders: Husch Blackwell LLP Washington, DC on behalf of ShanXi Taigang Stainless Steel Co., Ltd. Baosteel Stainless Steel Co., Ltd. Ningbo Baoxin Stainless Steel Co., Ltd. Taiyuan Ridetaixing Precision Stainless Steel Incorporated Co., Ltd. Ningbo Qiyi Precision Metals Co., Ltd. Guanghan Tiancheng Stainless Steel Products Co., Ltd. (producer) Sichuan Dyang Trading Co. Ltd. (exporter) The China Chamber of International Commerce Jeffrey S. Neeley ) ) – OF COUNSEL Cortney Morgan ) REBUTTAL/CLOSING REMARKS: Petitioners (Kathleen W. Cannon, Kelley Drye & Warren LLP) Respondents (Jeffrey S. Neeley, Husch Blackwell LLP)


C‐1
APPENDIX C
SUMMARY DATA

C‐2

Table C-1Stainless steel sheet and strip: Summary data concerning the U.S. market, 2013-15
2013 2014 2015 2013-15 2013-14 2014-15U.S. consumption quantity:
Amount........................................................................ 1,891,228 2,140,764 1,976,329 4.5 13.2 (7.7)Producers' share (fn1)................................................. 81.3 78.9 77.0 (4.3) (2.4) (1.9)Importers' share (fn1):
China........................................................................ 3.3 6.2 7.4 4.1 2.8 1.3 Mexico...................................................................... 4.8 4.1 3.6 (1.2) (0.7) (0.5)Taiwan...................................................................... 1.9 1.7 2.3 0.4 (0.1) 0.5 All others sources..................................................... 8.7 9.1 9.7 1.0 0.4 0.5
Subtotal, nonsubject sources................................. 15.4 14.9 15.5 0.2 (0.4) 0.6 Total imports...................................................... 18.7 21.1 23.0 4.3 2.4 1.9
U.S. consumption value:Amount........................................................................ 4,254,446 5,156,801 4,120,479 (3.1) 21.2 (20.1)Producers' share (fn1)................................................. 79.3 77.0 73.9 (5.4) (2.3) (3.1)Importers' share (fn1):
China........................................................................ 3.4 6.0 7.6 4.1 2.6 1.6 Mexico...................................................................... 4.6 3.8 3.7 (0.9) (0.7) (0.1)Taiwan...................................................................... 2.2 2.3 2.6 0.4 0.1 0.3 All others sources..................................................... 10.5 10.9 12.2 1.7 0.4 1.3
Subtotal, nonsubject sources................................. 17.3 17.0 18.6 1.3 (0.3) 1.5 Total imports...................................................... 20.7 23.0 26.1 5.4 2.3 3.1
U.S. imports from:China:
Quantity.................................................................... 63,114 132,016 147,106 133.1 109.2 11.4 Value........................................................................ 146,026 309,368 312,249 113.8 111.9 0.9 Unit value................................................................. $2,314 $2,343 $2,123 (8.3) 1.3 (9.4)Ending inventory quantity.......................................... *** *** *** *** *** ***
Mexico:Quantity.................................................................... 90,730 87,224 70,676 (22.1) (3.9) (19.0)Value........................................................................ 194,488 198,235 153,245 (21.2) 1.9 (22.7)Unit value................................................................. $2,144 $2,273 $2,168 1.2 6.0 (4.6)
Taiwan:Quantity.................................................................... 35,167 36,613 44,493 26.5 4.1 21.5 Value........................................................................ 93,778 116,870 107,556 14.7 24.6 (8.0)Unit value................................................................. $2,667 $3,192 $2,417 (9.3) 19.7 (24.3)
All other sources:Quantity.................................................................... 164,683 195,850 191,540 16.3 18.9 (2.2)Value........................................................................ 447,216 563,453 503,941 12.7 26.0 (10.6)Unit value................................................................. $2,716 $2,877 $2,631 (3.1) 5.9 (8.5)
Subtotal, nonsubject sources:Quantity.................................................................... 290,580 319,687 306,709 5.6 10.0 (4.1)Value........................................................................ 735,482 878,558 764,742 4.0 19.5 (13.0)Unit value................................................................. $2,531 $2,748 $2,493 (1.5) 8.6 (9.3)Ending inventory quantity.......................................... *** *** *** *** *** ***
Total imports:Quantity.................................................................... 353,694 451,703 453,815 28.3 27.7 0.5 Value........................................................................ 881,508 1,187,927 1,076,991 22.2 34.8 (9.3)Unit value................................................................. $2,492 $2,630 $2,373 (4.8) 5.5 (9.8)Ending inventory quantity.......................................... *** *** *** *** *** ***
U.S. producers':Average capacity quantity............................................ 2,911,738 2,911,738 2,916,603 0.2 0.0 0.2 Production quantity...................................................... 1,888,312 2,110,124 1,809,645 (4.2) 11.7 (14.2)Capacity utilization (fn1)............................................... 64.9 72.5 62.0 (2.8) 7.6 (10.4)U.S. shipments:
Quantity.................................................................... 1,537,534 1,689,061 1,522,514 (1.0) 9.9 (9.9)Value........................................................................ 3,372,938 3,968,874 3,043,488 (9.8) 17.7 (23.3)Unit value................................................................. $2,194 $2,350 $1,999 (8.9) 7.1 (14.9)
Export shipments:Quantity.................................................................... 339,536 391,274 317,342 (6.5) 15.2 (18.9)Value........................................................................ 745,574 899,133 604,098 (19.0) 20.6 (32.8)Unit value................................................................. $2,196 $2,298 $1,904 (13.3) 4.6 (17.2)
Ending inventory quantity............................................. 215,736 245,525 215,314 (0.2) 13.8 (12.3)Inventories/total shipments (fn1).................................. 11.5 11.8 11.7 0.2 0.3 (0.1)Production workers...................................................... 2,753 2,813 2,637 (4.2) 2.2 (6.3)Hours worked (1,000s)................................................ 5,644 5,939 5,654 0.2 5.2 (4.8)Wages paid ($1,000)................................................... 193,512 208,144 205,880 6.4 7.6 (1.1)Hourly wages (dollars)................................................. $34.29 $35.05 $36.41 6.2 2.2 3.9 Productivity (short tons per 1,000 hours)...................... 334.6 355.3 320.1 (4.3) 6.2 (9.9)Unit labor costs............................................................ $102.48 $98.64 $113.77 11.0 (3.7) 15.3
Table continued next page
Period changes
(Quantity=short tons; Value=1,000 dollars; Unit values, unit labor costs, and unit expenses=dollars per short ton; Period changes=percent--exceptions noted)
Calendar year Calendar yearReported data
C-3

Table C-1--ContinuedStainless steel sheet and strip: Summary data concerning the U.S. market, 2013-15
2013 2014 2015 2013-15 2013-14 2014-15Net sales:
Quantity.................................................................... 1,877,070 2,080,335 1,839,856 (2.0) 10.8 (11.6)Value........................................................................ 4,118,512 4,868,009 3,647,587 (11.4) 18.2 (25.1)Unit value................................................................. $2,194 $2,340 $1,983 (9.6) 6.6 (15.3)
Cost of goods sold (COGS)......................................... 4,088,870 4,637,988 3,681,194 (10.0) 13.4 (20.6)Gross profit or (loss).................................................... 29,642 230,021 (33,607) fn2 676.0 fn2SG&A expenses.......................................................... 126,493 145,259 116,139 (8.2) 14.8 (20.0)Operating income or (loss).......................................... (96,851) 84,762 (149,746) 54.6 fn2 fn2Net income or (loss).................................................... (147,220) 33,245 (273,143) 85.5 fn2 fn2Capital expenditures.................................................... *** *** *** *** *** ***Unit COGS.................................................................. $2,178 $2,229 $2,001 (8.1) 2.3 (10.3)Unit SG&A expenses................................................... $67 $70 $63 (6.3) 3.6 (9.6)Unit operating income or (loss).................................... $(52) $41 $(81) 57.7 fn2 fn2Unit net income or (loss).............................................. $(78) $16 $(148) 89.3 fn2 fn2COGS/sales (fn1)........................................................ 99.3 95.3 100.9 1.6 (4.0) 5.6 Operating income or (loss)/sales (fn1)......................... (2.4) 1.7 (4.1) (1.8) 4.1 (5.8)Net income or (loss)/sales (fn1)................................... (3.6) 0.7 (7.5) (3.9) 4.3 (8.2)
fn1.--Reported data are in percent and period changes are in percentage points.fn2.--Undefined.
Source: Compiled from data submitted in response to Commission questionnaires and official U.S. import statistics as detailed in part IV.
C-4
(Quantity=short tons; Value=1,000 dollars; Unit values, unit labor costs, and unit expenses=dollars per short ton; Period changes=percent--exceptions noted)
Reported data Period changesCalendar year Calendar year

D‐1
APPENDIX D
MONTHLY U.S. IMPORT DATA

D‐2

D‐3
Figure D‐1 Stainless steel sheet and strip: Monthly U.S. imports, by source, 2013‐15
05,000
10,00015,00020,00025,00030,00035,00040,00045,000
Jan
Feb
Mar Apr
May Jun
Jul
Aug
Sep Oct
Nov
Dec Jan
Feb
Mar Apr
May Jun
Jul
Aug
Sep Oct
Nov
Dec Jan
Feb
Mar Apr
May Jun
Jul
Aug
Sep Oct
Nov
Dec
2013 2014 2015
Qua
nitty
(s
hort
tons
)
China All other sources

D‐4
Table D‐1 Stainless steel sheet and strip: Monthly U.S. imports, by source, 2013‐15
Item
Calendar year
2013 2014 2015
Quantity (short tons)
U.S. imports from China in.‐‐ January 6,098 3,936 18,968
February 2,922 6,863 18,397
March 5,379 6,432 15,551
April 5,921 7,521 21,331
May 6,100 12,357 19,358
June 4,972 8,867 10,922
July 6,314 13,501 9,066
August 4,900 9,782 7,217
September 3,822 16,117 7,344
October 6,854 16,207 7,327
November 3,889 16,384 4,450
December 5,943 14,050 7,174
Total U.S. imports from China 63,114 132,016 147,106
Quantity (short tons)
U.S. imports from all other sources in.‐‐ January 35,175 26,079 31,151
February 25,736 20,337 26,161
March 25,127 23,152 28,620
April 29,141 24,246 30,111
May 25,489 21,893 27,316
June 23,628 23,201 23,806
July 22,787 26,527 25,551
August 20,471 27,248 20,169
September 17,113 28,307 19,563
October 24,289 32,695 25,611
November 21,392 27,511 22,137
December 20,234 38,488 26,513
Total U.S. imports from all other sources 290,580 319,687 306,709
Source: Official U.S. import statistics using statistical reporting numbers 7219.13.0031, 7219.13.0051, 7219.13.0071, 7219.13.0081, 7219.14.0030, 7219.14.0065, 7219.14.0090, 7219.23.0030, 7219.23.0060, 7219.24.0030, 7219.24.0060, 7219.32.0005, 7219.32.0020, 7219.32.0025, 7219.32.0035, 7219.32.0036, 7219.32.0038, 7219.32.0042, 7219.32.0044, 7219.32.0045, 7219.32.0060, 7219.33.0005, 7219.33.0020, 7219.33.0025, 7219.33.0035, 7219.33.0036, 7219.33.0038, 7219.33.0042, 7219.33.0044, 7219.33.0045, 7219.33.0070, 7219.33.0080, 7219.34.0005, 7219.34.0020, 7219.34.0025, 7219.34.0030, 7219.34.0035, 7219.34.0050, 7219.35.0005, 7219.35.0015, 7219.35.0030, 7219.35.0035, 7219.35.0050, 7219.90.0010, 7219.90.0020, 7219.90.0025, 7219.90.0060, 7219.90.0080, 7220.12.1000, 7220.12.5000, 7220.20.1010, 7220.20.1015, 7220.20.1060, 7220.20.1080, 7220.20.6005, 7220.20.6010, 7220.20.6015, 7220.20.6060, 7220.20.6080, 7220.20.7005, 7220.20.7010, 7220.20.7015, 7220.20.7060, 7220.20.7080, 7220.90.0010, 7220.90.0015, 7220.90.0060, and 7220.90.0080, accessed February 26, 2016.

E‐1
APPENDIX E
NONSUBJECT SOURCES PRICE DATA


E‐3
One importer reported price data for nonsubject source Mexico for products 1, 2, 3, and 4.1 Price data reported by this firm accounted for *** of U.S. imports from Mexico during 2015. These price items and accompanying data are comparable to those presented in tables V‐3 to V‐6. Price and quantity data for Mexico are shown in tables E‐1 to E‐2 and in figures E‐1 to E‐4 (with domestic and subject source data).
Table E-1 Stainless steel sheet and strip: Weighted-average f.o.b. prices and quantities of products 11 and 22 imported from Mexico product, by quarters, January 2013-December 2015
* * * * * * * Table E-2 Stainless steel sheet and strip: Weighted-average f.o.b. prices and quantities of products 31 and 42 imported from Mexico product, by quarters, January 2013-December 2015
* * * * * * * Figure E-1 Stainless steel sheet and strip: Weighted-average prices and quantities of domestic and imported product 1, by quarters, January 2013-December 2015
* * * * * * * Figure E-2 Stainless steel sheet and strip: Weighted-average prices and quantities of domestic and imported product 2, by quarters, January 2013-December 2015
* * * * * * * Figure E-3 Stainless steel sheet and strip: Weighted-average prices and quantities of domestic and imported product 3, by quarters, January 2013-December 2015
* * * * * * *
1 Staff also requested price data for sales of imports from nonsubject source Taiwan, but did not receive any Taiwan data from responding importers. According to ***, but it did not respond to the Commission’s request to complete a U.S. importer questionnaire.

E‐4
Figure E-4 Stainless steel sheet and strip: Weighted-average prices and quantities of domestic and imported product 4, by quarters, January 2013-December 2015
* * * * * * *
In comparing nonsubject country Mexico pricing data with U.S. producer pricing data, prices for stainless steel sheet and strip imported from Mexico were lower than prices for U.S.‐produced stainless steel sheet and strip in 7 instances and higher in 27 instances (table E‐3). In comparing nonsubject country Mexico pricing data with subject country China pricing data, prices for stainless steel sheet and strip imported from Mexico were lower than prices for stainless steel sheet and strip imported from China in 11 instances and higher in 22 instances.
Table E-3 Stainless steel sheet and strip: Summary of price differentials, by source comparison, January 2013-December 2015
Country Comparisons
Total number of
comparisons
Underselling Overselling
Number of quarters
Quantity (short tons)
Number of quarters
Quantity (short tons)
Mexico vs. United States 34 7 *** 27 ***
Mexico vs. China 33 11 *** 22 *** Source: Compiled from data submitted in response to Commission questionnaires.