
Something for Everyone: Clubs, Activities, Academies, Sports & Honor Societies

Something for Everyone.
2004 Annual Report

JAKKS Pacific, Inc. and Subsidiaries
Our customers are diverse…

2004 Annual Report
1
… as are our products.

JAKKS Pacific, Inc. and Subsidiaries
2
Michelle and Leah Michelle and Leah snuggle with Harmony Care Bear.

Traditional Toys • Fit ’N Fun Care Bear
2004 Annual Report
3
We revitalize and introduce classic favorites to new generations.

JAKKS Pacific, Inc. and Subsidiaries
4
Petro and Jacob Petro and Jacob master Spider-Man TV Games.

Plug It In & Play TV Games™ • Ms. Pac-Man TV Games
2004 Annual Report
5
We use innovation and technology to capitalize on popular trends.

JAKKS Pacific, Inc. and Subsidiaries
6
Kylie and Zoë Kylie and Zoë fly Tigger and SpongeBob kites.

Outdoor Activities • Shrek Diamond Kite
2004 Annual Report
7
With an entrepreneurial approach, we seek out unique acquisitions.

JAKKS Pacific, Inc. and Subsidiaries
8
Anne-Marie and Shane Anne-Marie and Shane get creative with Vivid Velvet activities.

And we sell our products in virtually every retail channel.
Art Activities, Stationery & Writing Instruments • Syntech Ball Point Pens
2004 Annual Report
9

Outdoor ActivitiesTraditional Toys
Our licenses and brands are key.
JAKKS Pacific, Inc. and Subsidiaries
10
®
™

Plug It In & Play TV Games
2004 Annual Report
11
There’s something for everyone.
Art Activities, Stationery & Writing Instruments
JAKKS/ THQ Video Game Joint Venture

Play Along • Cabbage Patch Kids
Road Champs • 2005 Mustang IR Racer
JAKKS Pacific, Inc. and Subsidiaries
12
Play Along • Magic Dancing Teletubbies
Boys’ Action • Dragon Ball Z Action Figures
2004 Annual Report
13
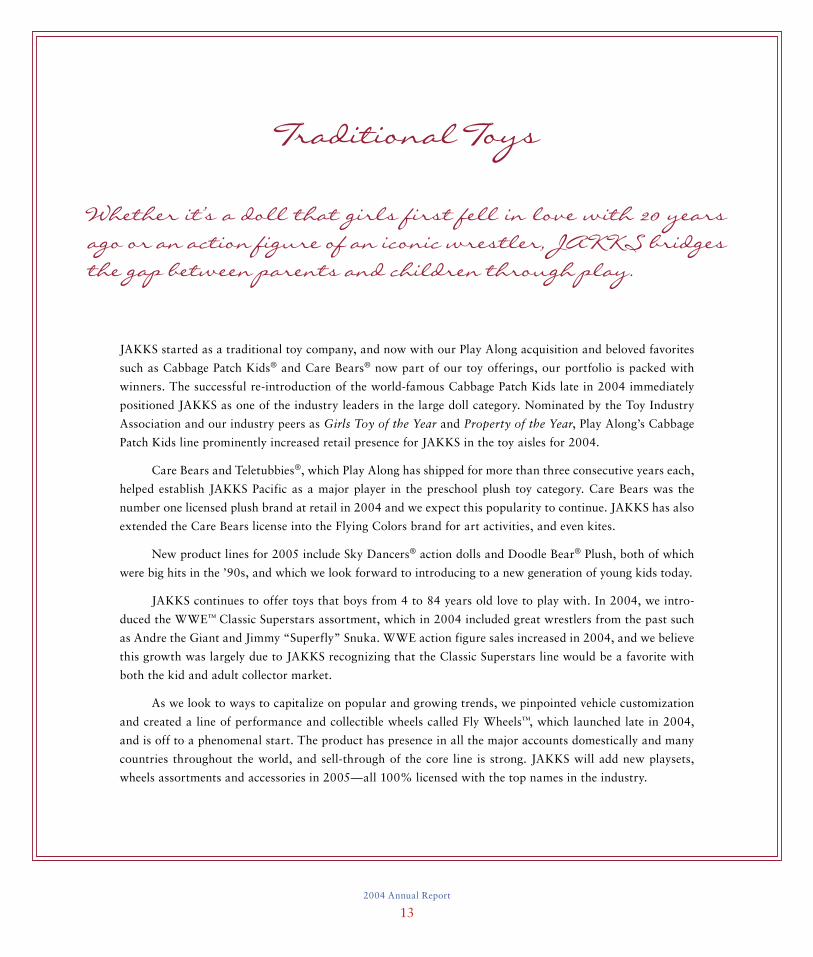
JAKKS started as a traditional toy company, and now with our Play Along acquisition and beloved favorites
such as Cabbage Patch Kids® and Care Bears® now part of our toy offerings, our portfolio is packed with
winners. The successful re-introduction of the world-famous Cabbage Patch Kids late in 2004 immediately
positioned JAKKS as one of the industry leaders in the large doll category. Nominated by the Toy Industry
Association and our industry peers as Girls Toy of the Year and Property of the Year, Play Along’s Cabbage
Patch Kids line prominently increased retail presence for JAKKS in the toy aisles for 2004.
Care Bears and Teletubbies®, which Play Along has shipped for more than three consecutive years each,
helped establish JAKKS Pacific as a major player in the preschool plush toy category. Care Bears was the
number one licensed plush brand at retail in 2004 and we expect this popularity to continue. JAKKS has also
extended the Care Bears license into the Flying Colors brand for art activities, and even kites.
New product lines for 2005 include Sky Dancers® action dolls and Doodle Bear® Plush, both of which
were big hits in the ’90s, and which we look forward to introducing to a new generation of young kids today.
JAKKS continues to offer toys that boys from 4 to 84 years old love to play with. In 2004, we intro-
duced the WWE™ Classic Superstars assortment, which in 2004 included great wrestlers from the past such
as Andre the Giant and Jimmy “Superfly” Snuka. WWE action figure sales increased in 2004, and we believe
this growth was largely due to JAKKS recognizing that the Classic Superstars line would be a favorite with
both the kid and adult collector market.
As we look to ways to capitalize on popular and growing trends, we pinpointed vehicle customization
and created a line of performance and collectible wheels called Fly Wheels™, which launched late in 2004,
and is off to a phenomenal start. The product has presence in all the major accounts domestically and many
countries throughout the world, and sell-through of the core line is strong. JAKKS will add new playsets,
wheels assortments and accessories in 2005—all 100% licensed with the top names in the industry.
Traditional Toys
Whether it’s a doll that girls first fell in love with 20 years ago or an action figure of an iconic wrestler, JAKKS bridges the gap between parents and children through play.
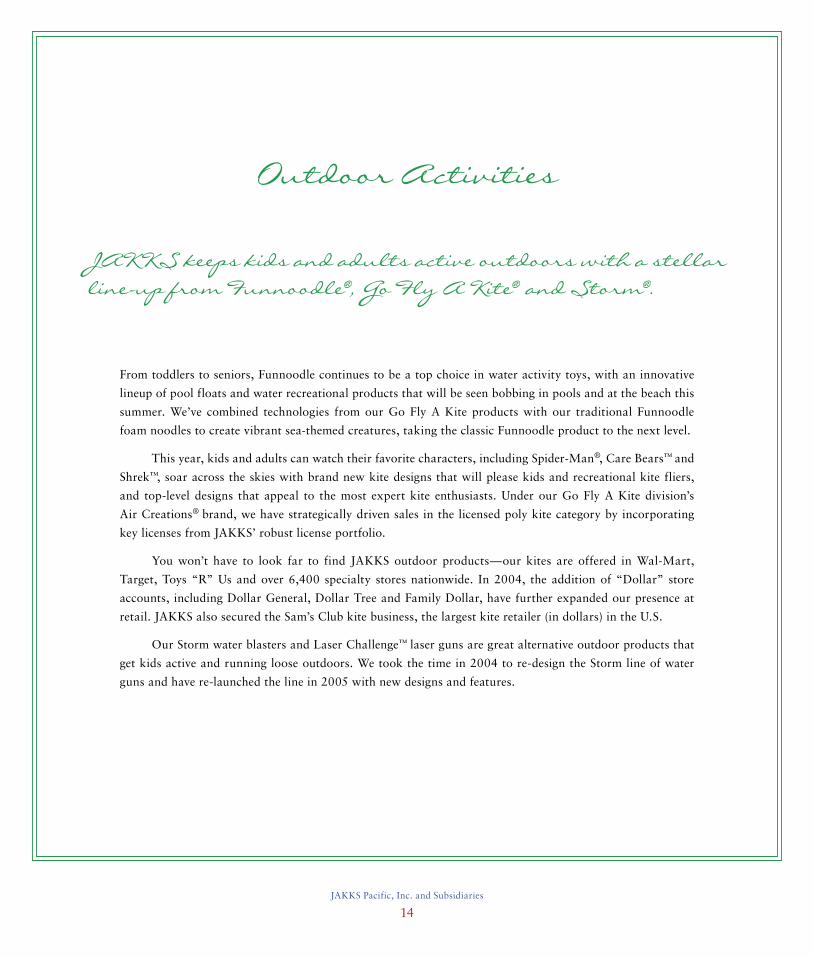
From toddlers to seniors, Funnoodle continues to be a top choice in water activity toys, with an innovative
lineup of pool floats and water recreational products that will be seen bobbing in pools and at the beach this
summer. We’ve combined technologies from our Go Fly A Kite products with our traditional Funnoodle
foam noodles to create vibrant sea-themed creatures, taking the classic Funnoodle product to the next level.
This year, kids and adults can watch their favorite characters, including Spider-Man®, Care Bears™ and
Shrek™, soar across the skies with brand new kite designs that will please kids and recreational kite fliers,
and top-level designs that appeal to the most expert kite enthusiasts. Under our Go Fly A Kite division’s
Air Creations® brand, we have strategically driven sales in the licensed poly kite category by incorporating
key licenses from JAKKS’ robust license portfolio.
You won’t have to look far to find JAKKS outdoor products—our kites are offered in Wal-Mart,
Target, Toys “R” Us and over 6,400 specialty stores nationwide. In 2004, the addition of “Dollar” store
accounts, including Dollar General, Dollar Tree and Family Dollar, have further expanded our presence at
retail. JAKKS also secured the Sam’s Club kite business, the largest kite retailer (in dollars) in the U.S.
Our Storm water blasters and Laser Challenge™ laser guns are great alternative outdoor products that
get kids active and running loose outdoors. We took the time in 2004 to re-design the Storm line of water
guns and have re-launched the line in 2005 with new designs and features.
JAKKS Pacific, Inc. and Subsidiaries
14
Outdoor Activities
JAKKS keeps kids and adults active outdoors with a stellar line-up from Funnoodle®, Go Fly A Kite® and Storm®.

2004 Annual Report
15
Go Fly A Kite • ParaStunter Kite
The Storm • Defender Water GunFunnoodle • Monster Noodle
Go Fly A Kite • SpongeBob Pinwheel

Plug It In & Play TV Games • Ms. Pac-Man Wireless TV Games
Plug It In & Play TV Games • SpongeBob SquarePants TV Games
JAKKS Pacific, Inc. and Subsidiaries
16
Plug It In & Play TV Games • Disney TV Games
Plug It In & Play TV Games • World Poker Tour TV Games

2004 Annual Report
17
JAKKS Pacific continues to dominate the growing plug and play video game category—a category first
created by JAKKS—with our award-winning Plug It In & Play TV Games™ product line. The TV Games
story first began in 2002, when JAKKS acquired ToyMax and saw the tremendous potential of one particular
product they had in their mix— a line of hand-held controllers that contained multiple games and plugged
into a standard TV. In 2003, we quietly began amassing top properties and gaming licenses that we felt had
a true fit with the brand.
And 2004 saw a new era for TV Games with the introduction of over 12 new TV Games units, such
as Ms. Pac-Man, Spider-Man and World Poker Tour® TV Games, and our lineup of preschool titles also
launched in 2004, featuring Blue’s Clues®, Disney® characters and SpongeBob SquarePants™. Our
Ms. Pac-Man® TV Games topped a remarkable number of retailers’ hot holiday toy lists, and the TV Games
brand overall received numerous prestigious industry awards, including the TIA’s nomination for Best
Electronic Entertainment Toy of the Year and the Best Videogame of the Year Award at the Ultimate Toy
Awards Show.
We established and expanded our presence at traditional toy and electronic outlets such as Wal-Mart, Toys
“R” Us, Target, Best Buy, Circuit City and Game Stop, to name a few. In addition, TV Games distribution
continued to grow in non-traditional outlets such as Walgreens, Bed Bath & Beyond, Robinsons-May and
Urban Outfitters. We are now selling our TV Games in more than 500 different retail customers worldwide.
With new product innovations and licenses, we expect to see tremendous growth both domestically
and internationally for this product line, and as we enter 2005, we have over 20 new TV Games titles slated
to launch, including Star Wars®: Revenge of the Sith™ and Dragon Ball Z TV Games, Dora the Explorer
and Disney Princess TV Games and game show classics like Wheel of Fortune® and Jeopardy!® TV Games.
Plug It In & Play TV Games
We built a brand for JAKKS Pacific, a burgeoning category for our industry, and grew our customer base in the process.

At JAKKS, we look for ways to add unique technology, new play patterns and top licenses to old favorites to
make them better and more applicable for today’s time. Our Vivid Velvet® line is a prime example. Essentially,
we infused the line with innovative and creative new features. We found success with Vivid Velvet poster
activity sets and back-to-school products, and are expanding printed velvet onto new mediums and materials,
including sun catchers, jewelry boxes and even fabric design-your-own purses.
Our expanded and improved upon line of Pentech professional writing instruments and office supplies for
school or work can be found at office superstores and drugstore channels. This is an example of how we
strive to have diversified product offerings and retail distribution to offset seasonality and shifts in consumer
buying patterns.
In 2005, we are introducing a revolutionary new pencil under our Pentech brand, called Ultra Sharp—
a pencil that never needs to be sharpened—as well as new paper products and other stationery items. We
have new marketing and product development teams whose goal is to grow both our activity and stationery
businesses and have already made strategic partnerships with Office Depot, one of the top office superstores
in the nation, and other key retailers for this category.
Other new introductions for 2005 include activities based on beloved properties, My Little Pony™ and
Care Bears, and our new compound Splish Splat®, based on the Nickelodeon game show, is a new twist on a
classic play pattern.
Also for 2005, we are working to improve on our existing lines with new technologies and licenses, and
increasing our marketing, advertising and product development efforts across all of JAKKS’ product lines
and categories. We believe our commitment will result in revenue growth, an increasingly diversified product
portfolio, expanded shelf space and top-selling products for JAKKS Pacific.
Art Activities, Stationery and Writing Instruments
Our writing instruments and office supplies inspire writers, spark creativity in artists and help adults work.
JAKKS Pacific, Inc. and Subsidiaries
18

2004 Annual Report
19
Color Workshop • BloPens Creative Activity Kit
Flying Colors • Vivid Velvet & ROC Writer ActivitiesFlying Colors • Hello Kitty Deluxe Nail Vanity
Flying Colors • Stationery & Writing Instruments

January ’04 TV Games honored with PC World magazine’s 2004 Next Gear Innovations Award
February ’04 JAKKS Pacific Secures Multiple New TV Games licenses, including Capcom®, Spider-Man®, Midway® and Ms. Pac-Man® for International
2004
December ’04 Ms. Pac-Man TV Games receives Toy Wishes’ Best Videogame of the Year Award at the Ultimate Toy Awards
Ms. Pac-Man TV Games and Cabbage Patch Kids included on Toys “R” Us’ Joy List of top 13 toys for the holidays and on Wal-Mart Canada’s Top 10 toy list for the holidays
TV Games, Cabbage Patch Kids® and WWE™ action figures included on KB Toys’ Top Toys for the Holidays list
TV Games included on Wal-Mart’s 12 Toys of Christmas list
AOL Kids names TV Games, Cabbage Patch Kids and Fit ’N Fun Care Bears on AOL Kids’ Top Holiday Toys list
Cabbage Patch Kids included on Toy Wishes’ Hot Dozen List and All-Star Doll Category
Toys “R” Us Canada includes Cabbage Patch Kids on their Top 13 Hot Toy for the Holidays list
eToys includes Cabbage Patch Kids on their Hot Holiday Toys list
January ’05 JAKKS Pacific launches Fly Wheels™ vehicle line under Road Champs® brand and secures worldwide distribution
February ’05 JAKKS Pacific rings the closing bell on NASDAQ
TV Games nominated for Best Electronic Entertainment Toy of the Year by the Toy Industry Association
Cabbage Patch Kids nominated for Girls Toy of the Year and Property of the Year by the Toy Industry Association
JAKKS Pacific announces the launch of Wireless TV Games and TV Games GAMEKEY Expansion Packs
JAKKS Pacific named Toys “R” Us Vendor of the Year for 2004
JAKKS Pacific, Inc. and Subsidiaries
20
May ’04 JAKKS Pacific signs World Poker Tour® and Star Wars® licenses for TV Games
October ’04 JAKKS Pacific recognized on Forbes magazine’s List of 200 Best Small Companies, for the third consecutive year
November ’04 JAKKS Pacific signs multiple TV Games licenses for classic game shows including Family Feud®, Price is Right®, Wheel of Fortune® and Jeopardy!®
June ’04 JAKKS Pacific completes acquisition of the Play Along companies
JAKKS Pacific signs multiple new TV Games licenses, including Warner Bros. and additional Marvel characters
Play Along named Best Licensee of the Year for Care Bears by the Licensing Industry’s Merchandiser’s Association
July ’04 JAKKS Pacific signs TV Games license with Electronic Arts, Inc.
Significant Events 2004-2005
March ’05 JAKKS Pacific named Wal-Mart Vendor Partner of the Year for 2004 and Wal-Mart Canada Vendor Partner of the Year for 2004
2005

2004 Annual Report
21
Two thousand and four was a year of growth for JAKKS Pacific. Many of our peers experienced a challeng-
ing retail environment, yet we increased our sales by 82%, realizing record sales of $574.3 million. Our net
income was $45.8 million, an increase of over 100% from 2003, and diluted earnings per share for the
year was $1.49.
We set out at the beginning of 2004 to execute on several key initiatives. We were determined to increase
our focus on our existing lines; to leverage our extensive portfolio of brands along with today’s and yester-
day’s most popular licenses; and to empower our product development teams to create new, proprietary
products, based on proven play patterns and exciting new trends. We aimed to further strengthen our rela-
tionships with our diverse customer base, and increase our shelf space and the types of retail channels into
which we sell. We also committed to expanding our marketing and advertising efforts for our licensed and
non-licensed products. We believe our dedication to these areas has led to our strong revenue growth and an
increasingly diversified portfolio of top-selling products.
Several stars shined amongst the JAKKS Pacific portfolio in 2004. One area of significant growth was
our award-winning Plug It In & Play TV Games line. We continued to lead the industry in this area, and
what started out as a single item in 2002 grew into over a dozen in 2004. While units based on classic titles,
such as Namco’s Pac-Man and Ms. Pac-Man and Atari’s Pong, were the big drivers, the play pattern and
technology also proved to be a perfect fit for today’s top licenses. As a prime example, our SpongeBob
SquarePants unit, with its unique toy-like controller and fun, original content, sold like a classic title. The
Disney, Spider-Man and World Poker Tour TV Games units, to name a few, reached different demographics
and contributed to the story.
With Plug It In & Play TV Games, we believe we have truly created a long-term product category for all
ages by combining top licenses, quality games, unique controllers and a low retail price point of approxi-
mately $20. We have established and expanded our presence at traditional toy and electronic outlets such as
Wal-Mart, Toys “R” Us, Target, Best Buy, Circuit City and Game Stop. We have continued to grow our dis-
tribution in non-traditional outlets such as Walgreens, Bed Bath & Beyond, Robinsons-May and Urban
Outfitters, and today we sell TV Games units to more than 500 different retail customers in over 35 coun-
tries worldwide. In 2005, we expect to ship over twenty new exciting titles, including Star Wars Episode III:
Revenge of the Sith, Dragon Ball Z, Wheel of Fortune, Mortal Kombat, Care Bears and Dora the Explorer.
In addition, throughout the year we will further expand the line with new TV Games technology, highlighted
by wireless versions, GAMEKEY expansion packs and AC adapters.
To Our Fellow Stockholders:

In 2004, we also strategically reached into the archives and re-launched well-loved brands from prior
years. Products that young parents and grandparents can identify with not only bring generations together
with play patterns that transcend time, but they also translate into solid sales for JAKKS Pacific in 2004 and
beyond. Key items from our most recent acquisition, Play Along were big contributors in this area.
We acquired Florida-based Play Along in June 2004, which contributed $165.5 million in sales in 2004,
and is comprised of a portfolio of nostalgic and well-known brands. Play Along has proven to be a tremen-
dous resource for these re-introductions with Care Bears plush, (the number one licensed plush brand at retail
in 2004), Teletubbies, (a top preschool brand at retail), and the giant phenomenon, Cabbage Patch Kids dolls.
Play Along further diversified our product offerings and immediately positioned JAKKS Pacific as one of the
industry leaders in the plush toy and soft body doll categories. New lines that we’ll see from Play Along in
2005 are Sky Dancers and Doodle Bears—a small action doll line and plush bear line—both of which were
big hits in the 1990s, and which we believe will be loved by a new generation of young kids today.
In boys’ action, our WWE Classic Superstar assortment brought old wrestling superstars to toy aisles
today, and, once again, old favorites meant increased year over year sales for JAKKS. For our Dragon Ball
action figure line, we partnered with Bandai in late 2004 to distribute authentic Japanese consumer-packaged
Dragon Ball action figures in the U.S. to maximize the opportunities for that brand by further tapping into
the collector market.
In our stationery area, we have been working to expand our Vivid Velvet activities by adding licenses,
new play patterns and special features, and have seen increases in sales of velvet. Additionally, we’re market-
ing new revolutionary pencil and paper products, and our new marketing and product development team has
already made inroads to grow the business with strategic partnerships with Office Depot and other key retail-
ers for this category.
In seasonal, we expanded distribution of our kite business in 2004 into dollar stores, club stores, drug
store chains and specialty channels, and we added licensed characters, such as SpongeBob SquarePants,
Tigger and Shrek, to our poly and nylon kites. We also set out to redesign our water guns under The Storm
brand, and in early 2005 we re-launched the line into the specialty and international markets. We expect to
further expand the line to mass retailers in 2006.
We sought out and secured increased International business during the year, and grew our International
sales by over 50% from $44.7 million to $68.5 million, year over year. We began to streamline our
International operations, which included securing a new distributor in the UK region. We believe this move
will improve our International efficiencies and prove to be more cost-effective for the long-term expansion of
our International division.
JAKKS Pacific, Inc. and Subsidiaries
22

2004 Annual Report
23
During the year, profit from our World Wrestling Entertainment video game joint venture was approxi-
mately $7.9 million, up $0.5 million from same period last year. We continue to work with WWE and THQ
to develop WWE video games for Xbox, PlayStation2 and GameCube consoles, in addition to PC games,
hand-held units, mobile gaming and online gaming.
We are also very proud of being recognized for our dedication to customer service, on-time shipping and
for our stellar product portfolio by our esteemed retail partners, Wal-Mart, Wal-Mart Canada and Toys “R”
Us, as Toy Vendor of the Year, Vendor Partner of the Year, and Boys Toys Vendor of the Year, respectively.
We believe our product lines are well positioned for continued growth in 2005 and beyond, and our
financial position remains strong. As of December 31, 2004, our working capital was approximately $225.4
million, including cash and equivalents and marketable securities of $195.6 million. We continue to grow our
business by executing on internal growth initiatives, securing new licenses that provide both near- and long-
term market share expansion opportunities, and actively pursuing accretive and complementary acquisitions.
We believe the future is bright for JAKKS Pacific. We have an extremely diverse product portfolio of
toys, writing instruments, stationery, outdoor products and other consumer products, and are proud of the
company we have built today. We believe we truly have Something for Everyone. We work day-in and day-
out to increase the value of JAKKS Pacific, and we thank you, our Stockholders, for the ongoing support we
receive from you.
Very sincerely,
Jack Friedman
Chairman and Chief Executive Officer
Stephen G. Berman
President and Chief Operating Officer

JAKKS Pacific, Inc. and Subsidiaries
24
Financial Highlights
200420032002
$1.49
$0.64
$1.23
Earnings Per Sharein dollars
200420032002
$43.6
$15.9
$27.9
Net Incomein millions
200420032002
$574
$316$310
Net Salesin millions
25 Selected Financial Data 26 Management’s Discussion and Analysis of Financial Condition and Results of Operations 40 Consolidated Balance Sheets
41 Consolidated Statements of Operations 41 Consolidated Statements of Other Comprehensive Income 42 Consolidated Statements of Stockholders’ Equity
43 Consolidated Statements of Cash Flows 44 Notes to Consolidated Financial Statements 64 Schedule II – Valuation and Qualifying Accounts 65 Management’s
Annual Report on Internal Control Over Financial Reporting 66 Report of Independent Registered Public Accounting Firm 68 Shareholder Information

2004 Annual Report
25
Selected Financial Data
You should read the financial data set forth below in conjunction with “Management’s Discussion and Analysis of
Financial Condition and Results of Operations” and our consolidated financial statements and the related notes.
Year Ended December 31, (In thousands, except per share data) 2000 2001 2002 2003 2004
Consolidated Statement of Operations Data:Net sales $ 252,288 $ 284,309 $ 310,016 $ 315,776 $ 574,266Cost of sales 149,881 164,222 180,173 189,334 348,259
Gross profit 102,407 120,087 129,843 126,442 226,007Selling, general and administrative expenses 80,435 89,575 98,111 113,053 172,282Acquisition shut-down and product recall costs 1,469 1,214 6,718 2,000 —
Income from operations 20,503 29,298 25,014 11,389 53,725Profit from joint venture (15,906) (6,675) (8,004) (7,351) (7,865)Interest, net (3,833) (2,057) (1,141) 1,405 2,498Other (income) expense, net (92) — — — —
Income before provision for income taxes and minority interest 40,334 38,030 34,159 17,335 59,092Provision for income taxes 11,697 9,797 6,466 1,440 15,533
Income before minority interest 28,637 28,233 27,693 15,895 43,559Minority interest — — (237) — —
Net income $ 28,637 $ 28,233 $ 27,930 $ 15,895 $ 43,559
Basic earnings per share $ 1.50 $ 1.55 $ 1.27 $ 0.66 $ 1.69
Weighted average shares outstanding 19,060 18,199 21,963 24,262 25,797
Diluted earnings per share $ 1.41 $ 1.45 $ 1.23 $ 0.66 $ 1.49
Weighted average shares and equivalents outstanding 20,281 19,410 22,747 27,437 31,406
At December 31, (In thousands) 2000 2001 2002 2003 2004
Consolidated Balance Sheet Data:Cash and cash equivalents $ 29,275 $ 25,036 $ 68,413 $ 118,182 $ 176,544Working capital 86,897 116,492 129,183 232,601 229,543Total assets 248,722 284,041 408,916 529,997 696,762Long-term debt, net of current portion 1,000 77 60 98,042 98,000Total stockholders’ equity 204,530 244,404 357,236 377,900 451,485
This annual report contains forward-looking statements (within the meaning of the Private Securities Litigation Reform Act of 1995) that are based on current expectations,
estimates and projections about JAKKS Pacific’s business based partly on assumptions made by its management. These statements are not guarantees of future performance and
involve risks, uncertainties and assumptions that are difficult to predict. Therefore, actual outcomes and results may differ materially from what is expressed or forecasted in
such statements due to numerous factors, including, but not limited to, those described above, changes in demand for JAKKS’ products, product mix, the timing of customer
orders and deliveries, the impact of competitive products and pricing, and difficulties with integrating acquired businesses. The forward-looking statements contained herein
speak only as of the date on which they are made, and JAKKS undertakes no obligation to update any of them to reflect events or circumstances after the date of this release.

JAKKS Pacific, Inc. and Subsidiaries
26
The following Management’s Discussion and Analysis of Financial Condition and Results of Operations contains
forward-looking statements that involve risks and uncertainties. Our actual results could differ materially from
those anticipated in these forward-looking statements as a result of various factors. You should read this section in
conjunction with our consolidated financial statements and the related notes.
Critical Accounting Policies
The accompanying consolidated financial statements and supplementary information were prepared in accordance with accounting principles generally accepted in the United States of America. Significant accounting policies are discussed in Footnote 2 to the Consolidated Financial Statements. Inherent in the application of many of these accounting policies is the need for management to make estimates and judgments in the determination of certain revenues, expenses, assets and liabilities. As such, materially different financial results can occur as circumstances change and additional informa-tion becomes known. The policies with the greatest potential effect on our results of operation and financial position include:
The allowance for doubtful accounts is based on our assessment of the collectibility of specific customer accounts and the aging of the accounts receivable. If there were a deterioration of a major customer’s creditworthiness, or actual defaults were higher than our historical experience, our estimates of the recoverability of amounts due to us could be overstated, which could have an adverse impact on our operating results.
Our revenue recognition policy is significant because our revenue is a key component of our results of operations. In addition, our revenue recognition determines the timing of certain expenses, such as commissions and royalties. We follow very specific and detailed guidelines in measuring revenues; however, certain judgments affect the application of our revenue policy. Revenue results are difficult to predict, and any shortfall in revenue or delay in recognizing revenue could cause our operating results to vary significantly from quarter to quarter.
We assess the impairment of long-lived assets and goodwill at least annually or whenever events or changes in circumstances indicate that the carrying value may not be recoverable. Factors we consider important which could trigger an impairment review include the following:• significant underperformance relative to expected historical or projected future operating results;• significant changes in the manner of our use of the acquired assets or the strategy for our overall business; and• significant negative industry or economic trends.
When we determine that the carrying value of long-lived assets and goodwill may not be recoverable based upon the existence of one or more of the above indicators of impairment, we measure any impairment based on a projected discounted cash flow method using a discount rate determined by our management to be commensurate with the risk inherent in our current business model. Net long-lived assets, including goodwill, amounted to $312.0 million as of December 31, 2004.
Recent Developments
On June 10, 2004, we purchased substantially all of the assets and assumed certain liabilities of Play Along, Inc., Play Along (Hong Kong) Limited and PA Distribution, Inc. (collectively “Play Along”). The total purchase price of approxi-mately $85.7 million consisted of cash in the amount of $70.8 million, 749,005 shares of our common stock at a value of $14.9 million and the assumption of certain liabilities and resulted in goodwill of $67.8 million. In addition, we agreed
Management’s Discussion and Analysis of Financial Condition and Results of Operations

2004 Annual Report
27
to pay an earn-out of up to $10.0 million per year for the four calendar years following the acquisition up to an aggregate amount of $30.0 million based on the achievement of certain financial performance criteria which will be recorded as goodwill when and if earned. Our results of operations have included Play Along from the date of acquisition.
On October 19, 2004, we were named as defendants in a lawsuit commenced by WWE in the U.S. District Court for the Southern District of New York concerning our toy licenses with WWE and the video game license between WWE and the joint venture company operated by THQ and us, encaptioned World Wrestling Entertainment, Inc. v. JAKKS Pacific, Inc., et al., 1:04-CV-08223-KMK (the “WWE Action”). The complaint also named as defendants THQ, the joint venture, certain of our foreign subsidiaries, Jack Friedman (our Chairman and Chief Executive Officer), Stephen Berman (our Chief Operating Officer, President and Secretary and a member of our Board of Directors), Joel Bennett (our Chief Financial Officer), Stanley Shenker and Associates, Inc., Bell Licensing, LLC, Stanley Shenker and James Bell.
WWE sought treble, punitive and other damages (including disgorgement of profits) in an undisclosed amount and a declaration that the video game license with the joint venture, which is scheduled to expire in 2009 (subject to joint venture’s right to extend that license for an additional five years), and an amendment to our toy licenses with WWE, which are scheduled to expire in 2009, are void and unenforceable. This action alleged violations by the defendants of the Racketeer Influenced and Corrupt Organization Act (“RICO”) and the anti-bribery provisions of the Robinson-Patman Act, and various claims under state law.
On February 16, 2005, we filed a motion to dismiss the WWE Action. On March 30, 2005, the day before WWE’s opposition to our motion was due, WWE amended its complaint to, among other things, add the Chief Executive Officer of THQ as a defendant and to add a claim under the Sherman Act. On March 31, 2005, the WWE sent a letter to the Court proposing, inter alia, a briefing schedule for defendants’ motions to dismiss the amended complaint.
In November 2004, several purported class action lawsuits were filed in the United States District Court for the Southern District of New York: (1) Garcia v. JAKKS Pacific, Inc. et al., Civil Action No. 04-8807 (filed on November 5, 2004, (2) Jonco Investors, LLC v. JAKKS Pacific, Inc. et al., Civil Action No. 04-9021 (filed on November 16, 2004), (3) Kahn v. JAKKS Pacific, Inc. et al., Civil Action No. 04-8910 (filed on November 10, 2004), (4) Quantum Equities L.L.C. v. JAKKS Pacific, Inc. et al., Civil Action No. 04-8877 (filed on November 9, 2004), and (5) Irvine v. JAKKS Pacific, Inc. et al., Civil Action No. 04-9078 (filed on November 16, 2004) (the “Class Action”). The complaints in the Class Actions allege that defendants issued positive statements concerning increasing sales of our WWE licensed products which were false and misleading because the WWE licenses had allegedly been obtained through a pattern of commercial bribery, our relationship with the WWE was being negatively impacted by the WWE’s contentions and there was an increased risk that the WWE would either seek modification or nullification of the licensing agreements with us. Plaintiffs also allege that we misleadingly failed to disclose the alleged fact that the WWE licenses were obtained through an unlawful bribery scheme. The plaintiffs in the Class Actions are described as purchasers of our common stock, who purchased from as early as October 26, 1999 to as late as October 19, 2004. The Class Actions seek compensatory and other damages in an undisclosed amount, alleging violations of Section 10(b) of the Securities Exchange Act of 1934 (the “Exchange Act”) and Rule 10b-5 promulgated thereunder by each of the defendants (namely the Company and Messrs. Friedman, Berman and Bennett), and violations of Section 20(a) of the Exchange Act by Messrs. Friedman, Berman and Bennett. On January 25, 2005, the Court consolidated the Class Actions under the caption In re JAKKS Pacific, Inc. Shareholders Class Action Litigation, Civil Action No. 04-8807.

JAKKS Pacific, Inc. and Subsidiaries
28
We believe that the claims in the WWE Action and the Class Actions are without merit and we intend to defend vigorously against them. However, because these Actions are in their preliminary stages, we cannot assure you as to the outcome of the Actions, nor can we estimate the range of our potential losses.
On February 16, 2005, we filed a motion to dismiss WWE’s Complaint in the WWE Action. The motion is currently scheduled to be fully briefed on April 14, 2005, with oral argument to be scheduled thereafter.
On December 2, 2004, a shareholder derivative action was filed in the Southern District of New York by Freeport Partner, LLC against us, nominally, and against Messrs. Friedman, Berman and Bennett, Freeport Partners v. Friedman, et al., Civil Action No. 04-9441 (the “Derivative Action”). The Derivative Action seeks to hold the individual defendants liable for damages allegedly caused to us by their actions and in particular to hold them liable on a contribution theory with respect to any liability we incur in connection with the Class Actions. On or about February 10, 2005, a second shareholder derivative action was filed in the Southern District of New York by David Oppenheim against us, nominally, and against Messrs. Friedman, Berman, Bennett, Blatte, Glick, Miller and Skala, Civil Action 05-2046 (the “Second Derivative Action”). The Second Derivative Action seeks to hold the individual defendants liable for damages allegedly caused to us by their actions as a result of alleged breaches of their fiduciary duties. On or about March 16, 2005, a third shareholder derivative action was filed. It is captioned Warr v. Friedman, Berman, Bennett, Blatte, Glick, Miller, Skala, and JAKKS (as a nominal defendant), and it was filed in the Superior Court of California, Los Angeles County (the “Third Derivative Action”). The Third Derivative Action seeks to hold the individual defendants liable for (1) damages allegedly caused to us by their alleged breaches of fiduciary duty, abuse of control, gross mismanagement, waste of corporate assets and unjust enrichment; and (2) restitution to us of profits, benefits and other compensation obtained by them.
On March 1, 2005, we delivered a Notice of Breach of Settlement Agreement and Demand for Indemnification to WWE (the “Notification”). The Notification asserted that WWE’s filing of the WWE Action violated A Covenant Not to Sue contained in a January 15, 2004 Settlement Agreement and General Release (“General Release”) entered into between WWE and us and, therefore, that we were demanding indemnification, pursuant to the Indemnification provision contained in the General Release, for all losses that the WWE’s actions have caused or will cause to us and our officers, including but not limited to any losses sustained by us in connection with the Class Actions. On March 4, 2005, in a letter from its outside counsel, WWE asserted that the General Release does not cover the claims in the WWE Action.
On March 31, 2004, our consolidated financial statements as of December 31, 2002 and 2003 and for the two years in the period ended December 31, 2003 were restated from those originally issued to reflect certain adjustments related to the accounting for the acquisitions of Toymax, Trendmasters and P&M in accordance with Statement of Financial Accounting Standards No. 141. Specifically, the purchase price of these acquisitions was originally allocated substantially to goodwill, and, based on studies and valuations completed in 2005 by a third-party valuation consultant, the purchase price of these acquisitions was reallocated in part to intangible assets other than goodwill, including those with limited lives. The resulting adjustment to amortization expense related to the limited life intangible assets of $6.3 million in 2002 and $7.3 million in 2003 and the resulting charge to cost of sales related to the mark-up of acquired inventory of $0.7 million in 2002 and $0.2 million in 2003, which led to a reduction of operating income in 2002 and 2003.
These adjustments impacted the consolidated balance sheets as of December 31, 2002 and 2003, and the consolidated statements of operations, other comprehensive income, stockholders’ equity and cash flows for each of the two years ended December 31, 2002 and 2003.
Management’s Discussion and Analysis of Financial Condition and Results of Operations (cont.)

2004 Annual Report
29
Results of Operation
The following table sets forth, for the periods indicated, certain statement of operations data as a percentage of net sales.
Year Ended December 31, 2000 2001 2002 2003 2004
Net sales 100.0% 100.0% 100.0% 100.0% 100.0%Cost of sales 59.4 57.8 58.1 60.0 60.6
Gross profit 40.6 42.2 41.9 40.0 39.4Selling, general and administrative expenses 31.9 31.5 31.6 35.8 30.0Acquisition shut-down and product recall costs 0.5 0.4 2.2 0.6 —
Income from operations 8.2 10.3 8.1 3.6 9.4Profit from joint venture (6.3) (2.3) (2.6) (2.3) (1.4)Interest, net (1.5) (0.7) (0.4) 0.4 0.4
Income before income taxes and minority interest 16.0 13.3 11.1 5.5 10.4Provision for income taxes 4.6 3.4 2.1 0.5 2.7
Income before minority interest 11.4 9.9 9.0 5.0 7.7Minority interest — — — — —
Net income 11.4% 9.9% 9.0% 5.0% 7.7%
Comparisons of the Years Ended December 31, 2004 and 2003
Net Sales. Net sales were $574.3 million in 2004 compared to $315.8 million in 2003, representing an increase of 81.9%. This increase in net sales was primarily due to the addition of $151.6 million in sales of traditional toys from our recent Play Along acquisition, as well as the addition of (i) $147.5 million in sales of some of our other traditional toy products, including primarily TV Games (with 15 titles in release in 2004, as compared to 3 titles in release in 2003) and WWE action figures and accessories; and (ii) $23.7 million in international sales (including $13.9 million by Play Along). The increase in net sales was offset in part by decreases in sales of our crafts and activities and writing instruments of $48.2 million and our seasonal products, including water guns and junior sports toys, of $16.1 million.
With the addition of Play Along, in addition to our other initiatives, we believe that the increased level of net sales should continue into 2005.
Gross Profit. Gross profit increased $99.6 million, or 78.8%, to $226.0 million, or 39.4% of net sales, in 2004 from $126.4 million, or 40.0% of net sales, in 2003. The overall increase in gross profit was attributable to the significant increase in net sales. The decrease in gross profit margin of 0.6% of net sales was primarily due to an increase in royalty expense as a percentage of net sales due to changes in the product mix to more products with higher royalty rates from products with lower royalty rates or proprietary products with no royalties.
Selling, General and Administrative Expenses. Selling, general and administrative expenses were $172.3 million in 2004 and $113.1 million in 2003, constituting 30.0% and 35.8% of net sales, respectively. The overall increase of $59.2 million in such costs was primarily due to the impact of stock-based compensation ($5.2 million), an increase in legal fees and settlements ($6.8 million) and bonus expense ($4.5 million), an increase in amortization expense related to intangible assets other than goodwill acquired in the Play Along acquisition and the addition of overhead related to the operations of Play Along ($27.2 million). Due to the increases in our grants of restricted stock awards and the price of our common

JAKKS Pacific, Inc. and Subsidiaries
30
Management’s Discussion and Analysis of Financial Condition and Results of Operations (cont.)
stock in 2004, compared to a moderate increase in the price of our common stock in 2003, we had stock-based compensation charges of $13.6 million compared to $8.4 million in 2003. The increase in direct selling expenses ($19.3 million) is primarily due to an increase in advertising and promotional expenses in 2004 in support of the sell-through of our various products at retail. We produced and aired television commercials in support of several of our products, including World Wrestling Entertainment, Dragon Ball and Mucha Lucha action figures, TV Games, Care Bears, Cabbage Patch Kids and Flying Colors products in 2004, and World Wrestling Entertainment and Dragon Ball action figures and Flying Colors products in 2003. From time to time, we may increase our advertising efforts, if we deem it appropriate for particular products.
Product Recall Costs. There were no product recall costs in 2004. In the second quarter of 2003, we accrued a $2.7 million charge for the recall of one of our products, and in the third quarter of 2003, we recorded a credit of $0.7 million for the recovery of recall costs from one of our third-party factories.
The remaining component of the product recall costs is as follows (in thousands):
Accrued Balance
December 31, 2003 Accrual Actual Accrued Balance
December 31, 2004
Product recall costs $490 $— $(490) $—
Profit from Joint Venture. Profit from joint venture increased by $0.5 million in 2004 due to the joint venture having lower unit sales at lower wholesale prices of its two vehicle combat games of the five games released in 2003 compared to releasing all new titles with higher unit sales at higher wholesale prices in addition to having higher sales of carryover titles in 2004. New releases typically generate higher unit sales resulting in higher overall sales as compared to carryover titles. Profit from the joint venture contributed significantly to our pre-tax profit, representing 22.2% of pre-tax income in 2003 and 12.7% in 2004. We expect to continue to receive a preferred return over the remaining term of the license agreement ending December 31, 2009, although we cannot predict with certainty what levels of return will be achieved and, in any case, we anticipate substantial fluctuations in the amount of the preferred return distributed to us from year to year.
Interest, Net. Interest income increased due to higher average cash balances during 2004 than in 2003, but was offset by interest expense of $4.5 million related to the convertible notes issued in June 2003.
Provision for Income Taxes. Provision for income taxes included Federal, state and foreign income taxes in 2003 and 2004, at an effective tax rate of 8.3% and 26.0%, respectively, benefiting from a flat 17.0% Hong Kong Corporation Tax on our income arising in, or derived from, Hong Kong for 2003 and 2004. For 2004, the effective rate increased as a result of the recognition of U.S. taxes on a greater proportion of foreign earnings deemed to be subject to U.S. taxes. As of December 31, 2004, we had net deferred tax assets of approximately $1.9 million. In making this determination, management believes it considered all available evidence, both positive and negative, as well as the weight and importance given to such evidence.
Comparisons of the Years Ended December 31, 2003 and 2002
Net Sales. Net sales were $315.8 million in 2003 compared to $310.0 million in 2002, representing an increase of 1.9%. The increase in net sales of $17.6 million by our seasonal products, including Trendmasters, Go Fly a Kite, Funnoodle and sports toys, and new product introductions, including Dragon Ball and NASCAR action toys, TV games and

2004 Annual Report
31
ColorWorkshop craft products, were offset by a decrease of $20.6 million in sales of our other traditional products, and $8.5 million in international sales, which included a reduction in sales of our karaoke machines and Equalizer radio control vehicle in 2003, both higher priced items.
Gross Profit. Gross profit decreased $3.4 million, or 2.7%, to $126.4 million, or 40.0% of net sales, in 2003 from $129.8 million, or 41.9% of net sales, in 2002. The overall decrease in gross profit was attributable to a decrease in gross profit margin. The decrease in gross profit margin of 1.9% of net sales was due to higher sales of seasonal products with lower margins and an increase in royalty expense as a percentage of net sales due to changes in the product mix resulting from the sale of more products with higher royalty rates, though offset in part by a decrease in amortization expense of molds and tools used in the manufacture of our products.
Selling, General and Administrative Expenses. Selling, general and administrative expenses were $113.1 million in 2003 and $98.1 million in 2002, constituting 35.8% and 31.6% of net sales, respectively. The overall increase of $15.0 million in such costs was primarily due to a charge for the grant of restricted stock of $8.4 million, a charge of $2.1 million to bad debt relating to the bankruptcy of several of our customers, including Kay Bee Toys, and an increase in direct selling expenses, product development costs, option compensation expense resulting from the price reset of options in 2000 and operating expenses incurred in connection with the P&M asset acquisition. We produced and aired television commercials in support of several of our products, including WWE and Dragon Ball Z action figures and Flying Colors products in 2003 and WWE action figures and Flying Colors products in 2002. From time to time, we may increase our advertising efforts, if we deem it appropriate for particular products.
Acquisition Shut-Down and Product Recall Costs. Acquisition shut-down costs in 2002 relate to shut-down costs, including lease termination, fixed asset abandonment and other costs, of certain operations of Toymax and Kidz Biz. There were no such costs in 2003. Operations impacted by these shut-downs were sales, design, distribution, and administration. The integrations of Toymax and Kidz Biz were completed in 2002. In 2003, we accrued a net amount of $2.0 million for the recall of one of our products, compared to having accrued $2.2 million in 2002 for the recall of the same product.
The remaining component of the acquisition shut-down and product recall costs is as follows (in thousands):
Accrued Balance
December 31, 2002 Accrual Actual Accrued Balance
December 31, 2003
Lease abandonment costs $2,310 $ — $(2,310) $ —Product recall costs — 2,000 (1,510) 490
Total $2,310 $ 2,000 $(3,820) $ 490
Profit from Joint Venture. Profit from joint venture decreased by $0.7 million in 2003 due to the joint venture having lower unit sales at lower wholesale prices of its two vehicle combat games of the five games released in 2003 compared to releasing all new titles with higher unit sales at higher wholesale prices in addition to having higher sales of carryover titles in 2002. New releases typically generate higher unit sales resulting in higher overall sales as compared to carryover titles.

JAKKS Pacific, Inc. and Subsidiaries
32
Management’s Discussion and Analysis of Financial Condition and Results of Operations (cont.)
Profit from the joint venture contributed significantly to our pre-tax profit, representing 19.5% of pre-tax income in 2002 and 22.2% in 2003. We expect to continue to receive a preferred return over the remaining term of the license agreement ending December 31, 2009, although we cannot predict with certainty what levels of return will be achieved and, in any case, we anticipate substantial fluctuations in the amount of the preferred return distributed to us from year to year.
Interest, Net. Interest income increased due to higher average cash balances during 2003 than in 2002, but was offset by interest expense of $2.5 million related to the convertible notes issued in June 2003.
Provision for Income Taxes. Provision for income taxes included Federal, state and foreign income taxes in 2002 and 2003, at an effective tax rate of 18.9% and 8.3%, respectively, benefiting from a flat 16.5% and 17.0%, Hong Kong Corporation Tax on our income arising in, or derived from, Hong Kong for 2002 and 2003, respectively. For 2003, the effective rate decreased as a result of a higher proportionate share of income arising in Hong Kong as opposed to losses arising in the higher statutory jurisdictions. As of December 31, 2003, we had deferred tax assets of approximately $4.5 million for which no allowance has been provided since, in the opinion of management, realization of the future benefit is probable. In making this determination, management believes it considered all available evidence, both positive and negative, as well as the weight and importance given to such evidence.
Quarterly Fluctuations and Seasonality
We have experienced significant quarterly fluctuations in operating results and anticipate these fluctuations in the future. The operating results for any quarter are not necessarily indicative of results for any future period. Our first quarter is typically expected to be the least profitable as a result of lower net sales but substantially similar fixed operating expenses. This is consistent with the performance of many companies in the toy industry.
The following table presents our unaudited quarterly results for the years indicated. The seasonality of our business is reflected in this quarterly presentation. 2002
(In thousands, except per share data)
First Quarter
Second Quarter
Third Quarter
Fourth Quarter
Net sales $ 59,895 $ 78,992 $ 102,640 $ 68,489 As a % of full year 19.3% 25.5% 33.1% 22.1%Gross profit $ 26,470 $ 35,192 $ 41,812 $ 26,369 As a % of full year 20.4% 27.1% 32.2% 20.3% As a % of net sales 44.2% 44.6% 40.7% 38.5%Income (loss) from operations $ 1,420 $ 7,863 $ 16,835 $ (1,104) As a % of full year 5.7% 31.4% 67.3% (4.4)% As a % of net sales 2.4% 10.0% 16.4% (1.6)%Income before income taxes and minority interest $ 2,985 $ 8,800 $ 17,884 $ 4,490 As a % of net sales 5.0% 11.1% 17.4% 6.6%Net income $ 2,156 $ 6,973 $ 13,085 $ 5,717 As a % of net sales 3.6% 8.8% 12.7% 8.3%Diluted earnings per share $ 0.11 $ 0.32 $ 0.54 $ 0.23Weighted average shares and equivalents outstanding 20,236 21,953 24,059 24,800

2004 Annual Report
33
2003
(In thousands, except per share data)
First Quarter
Second Quarter
Third Quarter
Fourth Quarter
Net sales $ 67,759 $ 73,290 $ 90,308 $ 84,419 As a % of full year 21.5% 23.2% 28.6% 26.7%Gross profit $ 27,442 $ 27,906 $ 36,226 $ 34,868 As a % of full year 21.7% 22.1% 28.7% 27.6% As a % of net sales 40.5% 38.1% 40.1% 41.3%Income (loss) from operations $ 5,960 $ 2,522 $ 10,480 $ (7,573) As a % of full year 52.3% 22.1% 92.0% (66.5)% As a % of net sales 8.8% 3.4% 11.6% (9.0)%Income before income taxes and minority interest $ 6,299 $ 2,679 $ 10,495 $ (2,138) As a % of net sales 9.3% 3.7% 11.6% (2.5)%Net income $ 4,988 $ 2,236 $ 8,248 $ 422 As a % of net sales 7.4% 3.1% 9.1% 0.5%Diluted earnings per share $ 0.20 $ 0.09 $ 0.33 $ 0.02Weighted average shares and equivalents outstanding 24,917 24,683 24,629 24,642
2004
(In thousands, except per share data)
First Quarter
Second Quarter
Third Quarter
Fourth Quarter
Net sales $ 73,986 $ 109,395 $ 206,083 $ 184,802 As a % of full year 12.9% 19.0% 35.9% 32.2%Gross profit $ 30,466 $ 41,281 $ 81,801 $ 72,459 As a % of full year 13.5% 18.3% 36.2% 32.1% As a % of net sales 41.2% 37.7% 39.7% 39.2%Income (loss) from operations $ 4,885 $ 8,321 $ 29,915 $ 10,604 As a % of full year 9.1% 15.5% 55.7% 19.7% As a % of net sales 6.6% 7.6% 14.5% 5.7%Income before income taxes and minority interest $ 4,764 $ 7,637 $ 30,042 $ 16,649 As a % of net sales 6.4% 7.0% 14.6% 9.0%Net income $ 3,791 $ 6,004 $ 23,255 $ 10,508 As a % of net sales 5.1% 5.5% 11.3% 5.7%Diluted earnings per share $ 0.15 $ 0.22 $ 0.75 $ 0.36Weighted average shares and equivalents outstanding 30,676 31,123 31,919 31,855
Due to the restatement in 2003 relating to the accounting of the Toymax, Trendmasters and P&M acquisition and to rounding, some of the figures above may differ from our previously filed Quarterly Reports on Form 10-Q.
During the first quarter of 2002, we recorded a charge which impacted operating income by approximately $6.6 million relating to the restructuring of Toymax and Kidz Biz.
During the second quarter of 2002, we recorded a charge which impacted operating income by approximately $1.5 million relating to the recall of one of our products.
During the fourth quarter of 2002, we reversed $2.1 million of the restructuring charge recorded in the first quarter of 2002 and recorded an additional charge of approximately $0.7 million relating to the recall of one of our products, the net of which favorably impacted operating income by approximately $1.4 million. In addition, our effective tax rate for the year 2002 was reduced from 26% to 19%.

JAKKS Pacific, Inc. and Subsidiaries
34
Management’s Discussion and Analysis of Financial Condition and Results of Operations (cont.)
During the second quarter of 2003, we recorded a charge which impacted operating income by approximately $2.7 million relating to the recall of one of our products.
During the third quarter of 2003, we recovered $0.7 million of the recall costs, recorded in the second quarter of 2003, from one of our factories.
During the fourth quarter of 2003, we recorded a non-cash charge of $8.4 million which impacted operating income relating to the grant of restricted stock and a charge of $2.1 million to provision for bad debt impacting operating income relating to the bankruptcy filing of several of our customers, including Kay Bee Toys.
During the fourth quarter of 2004, we recorded non-cash charges, which impacted operating income, of $5.6 million relating to the grant of restricted stock and $8.6 million relating to the amortization of short-lived intangible assets acquired in connection with the Play Along acquisition.
Recent Accounting Standards
In January 2003 and as revised in December 2003, the Financial Accounting Standards Board (“FASB”) issued FASB Interpretation No. 46, “Consolidation of Variable Interest Entities” (“Interpretation 46”) and FASB Interpretation No. 46R (“Interpretation 46R”). Interpretations 46 and 46R require companies with a variable interest in a variable interest entity to apply the guidance contained in such Interpretations as of the beginning of the first reporting period after December 15, 2003. If applicable, the application of the guidance could result in the consolidation of a variable interest entity. Interpretations 46 and 46R are not applicable to us, as we are not the beneficiary of any variable interest entities.
In May 2003, the FASB issued Statement of Financial Accounting Standards No. 150, “Accounting for Certain Financial Instruments with Characteristics of Both Liabilities and Equity” (“SFAS 150”). SFAS 150 establishes standards for how an issuer classifies and measures certain financial instruments with characteristics of both liabilities and equity. The provisions of SFAS 150 were adopted effective June 9, 2003. The adoption of SFAS 150 did not have a material effect on our financial position or results of operations.
We use the intrinsic-value method of accounting for stock options granted to employees. As required by our existing stock plans, stock options are granted at, or above, the fair market value of our stock, and, accordingly, no compensation expense is recognized for these grants in the consolidated statement of operations. We record compensation expense related to other stock-based awards, such as restricted stock grants, over the period the award vests. On December 16, 2004, the FASB issued SFAS 123 (revised 2004), “Share-Based Payment” (“SFAS 123R”), which amends SFAS 123, “Accounting for Stock-Based Compensation” and SFAS 95 “Statement of Cash Flows.” SFAS 123R requires companies to measure all employee stock-based compensation awards using a fair value method and record such expense in its consoli-dated financial statements. In addition, the adoption of SFAS 123R requires additional accounting and disclosure related to the income tax and cash flow effects resulting from share-based payment arrangements. SFAS 123R is effective for us as of July 1, 2005. The adoption of SFAS 123R’s fair value method will have an impact on our results of operations, although it will have no impact on our overall financial position. While we cannot estimate the level of share-based payments to be issued in the future, based on the stock options that are currently outstanding, we expect that the adoption of SFAS 123R will result in a charge to operations in the second half of 2005 of approximately $1.5 million.
In accordance with Emerging Issues Task Force (“EITF”) Issue 04-8, “The Effect of Contingently Convertible Instruments on Diluted Earnings Per Share,” which we adopted in December 2004, diluted earnings per share for 2003 was restated to reflect the dilutive effect of the assumed conversion of our convertible senior notes due in 2023. The

2004 Annual Report
35
diluted earnings per share calculations for the two fiscal years ended December 31, 2004 include adjustments to add back to earnings the interest expense, net of tax, incurred on the convertible senior notes, and to include in diluted weighted average shares the shares potentially issuable as if the contingent conversion features were met. There was no effect on 2003 diluted earnings per share.
Liquidity and Capital Resources
As of December 31, 2004, we had working capital of $229.5 million, as compared to $232.6 million as of December 31, 2003. This decrease was primarily attributable to disbursements relating to the acquisition of certain assets of Play Along offset in part by operating activities.
Operating activities provided net cash of $131.4 million in the year ended December 31, 2004, as compared to $7.4 million in 2003. Net cash was provided primarily by net income and non-cash charges, including compensation from stock option grants and restricted stock grants, acquisition earn-out expense, depreciation and amortization and loss on disposal of property and equipment, as well as increases in accounts payable, accrued expenses, reserve for sales returns and allowances, income taxes payable and deferred income taxes and a decrease in inventory, which were offset in part by an increase in accounts receivable, prepaid expenses and other and an increase in the cash received from the preferred return from our joint venture. Our accounts receivable turnover as measured by days sales outstanding in accounts receivable decreased from approximately 92 days as of December 31, 2003 to approximately 50 days as of December 31, 2004 primarily due to a shift in sales from domestic sales origin to FOB China, which carry shorter payment terms, a shift in domestic sales to customers with shorter payment terms and overall improved collection efforts and results. Other than open purchase orders, issued in the normal course of business, we have no obligations to purchase finished goods from our manufacturers. As of December 31, 2004, we had cash and cash equivalents of $176.5 million and marketable securities of $19.0 million.
Our investing activities used cash of $73.3 million in the year ended December 31, 2004, as compared to $47.3 million in 2003, consisting primarily of the purchase of office furniture and equipment and molds and tooling used in the manufacture of our products, the purchase of other assets and the goodwill and other intangible assets acquired in the acquisition of Play Along, partially offset by the sale of marketable securities. In 2003, our investing activities consisted primarily of the purchase of molds and tooling used in the manufacture of our products, the purchase of other assets, the goodwill and other intangible assets acquired in the acquisition of P&M, the purchase of marketable securities, partially offset by the repayment of notes receivable from officers. As part of our strategy to develop and market new products, we have entered into various character and product licenses with royalties ranging from 1% to 18% payable on net sales of such products. As of December 31, 2004, these agreements required future aggregate minimum guarantees of $27.2 million, exclusive of $9.1 million in advances already paid.
Our financing activities provided net cash of $1.6 million in the year ended December 31, 2004, as compared to $90.0 million in 2003. In 2004, cash was primarily provided from the exercise of stock options, partially offset by the repayment of long-term debt. In 2003, cash was primarily provided from the sale of our convertible senior notes and from the exercise of stock options, partially offset by the repurchase of $6.1 million of our common stock and the repayment of debt.

JAKKS Pacific, Inc. and Subsidiaries
36
Management’s Discussion and Analysis of Financial Condition and Results of Operations (cont.)
The following is a summary of our significant contractual cash obligations for the periods indicated that existed as of December 31, 2004 and is based on information appearing in the notes to the consolidated financial statements (in thousands): 2005 2006 2007 2008 2009 Thereafter Total
Long-term debt $ — $ — $ — $ — $ — $ 98,000 $ 98,000Operating leases 6,543 5,714 4,723 2,819 2,804 6,603 29,206Minimum guaranteed license/royalty payments 13,635 8,868 1,795 1,427 1,435 — 27,160Employment contracts 5,069 4,557 4,248 2,180 2,230 2,280 20,564
Total contractual cash obligations $ 25,247 $ 19,139 $ 10,766 $ 6,426 $ 6,469 $ 106,883 $ 174,930
In December 2001, we acquired all of the outstanding capital stock of Kidz Biz Limited, a United Kingdom company, and an affiliated Hong Kong company, Kidz Biz Far East Limited, for an aggregate purchase price of approximately $12.4 million. Total consideration was paid on the closing of the transaction in cash in the amount of $6.4 million and the issuance of 308,992 shares of our common stock at a value of $6.0 million. In addition, we agreed to pay an earn-out for each of 2002, 2003, 2004 and 2005, based on the achievement of certain financial performance criteria, payable by delivery of up to 25,749 shares of our common stock per year. In 2002, 2003 and 2004, no earn-outs were earned because the criteria were not met. However, we paid the 2005 earn-out at a value of $0.5 million during 2004 upon the termination of employment of a principal of the seller, which was charged to expense in 2004.
In October 2001, we and all of our domestic subsidiaries jointly and severally secured a syndicated line of credit totaling $50.0 million with a consortium of banks (“Line of Credit”). On August 6, 2004, we and all of our domestic subsidiaries notified the banks that we were terminating the Line Credit effective August 13, 2004. There have never been any outstanding borrowings under the Line of Credit since its inception.
In February 2003, our Board of Directors approved a buyback of up to $20.0 million of our common stock. During 2003, we repurchased and retired 554,500 shares of our common stock for a total of approximately $6.1 million. No shares were repurchased in 2004.
In May 2003, we purchased certain product lines, related assets and assumed certain liabilities of P&M. The total purchase price of approximately $22.0 million consisted of cash paid in the amount of $20.7 million and liabilities assumed of $1.3 million and resulted in goodwill of $13.5 million. Results of operations have included P&M from the date of acquisition.
On June 10, 2004, we purchased substantially all of the assets and assumed certain liabilities of Play Along, Inc., Play Along (Hong Kong) Limited and PA Distribution, Inc. (collectively “Play Along”). The total purchase price of $85.7 million consisted of cash paid in the amount of $70.8 million and the issuance of 749,005 shares of our common stock valued at $14.9 million. In addition, we agreed to pay an earn-out of up to $10.0 million per year for the four calendar years following the acquisition up to an aggregate amount of $30.0 million based on the achievement of certain financial performance criteria which will be recorded as goodwill when and if earned. For the year ended December 31, 2004, $10.0 million of the earn-out was earned and recorded as goodwill as of December 31, 2004. Accordingly, the annual maximum earn-out for the remaining three years through December 31, 2007 is approximately $6.7 million, or an aggregate of $20.0 million. Results of operations have included Play Along from the date of acquisition.

2004 Annual Report
37
On October 19, 2004, we were named as defendants in a lawsuit commenced by WWE in the U.S. District Court for the Southern District of New York concerning our toy licenses with WWE and the video game license between WWE and the joint venture company operated by THQ and us, encaptioned World Wrestling Entertainment, Inc. v. JAKKS Pacific, Inc., et al., 1:04-CV-08223-KMK (the “WWE Action”). The complaint also named as defendants THQ, the joint venture, certain of our foreign subsidiaries, Jack Friedman (our Chairman and Chief Executive Officer), Stephen Berman (our Chief Operating Officer, President and Secretary and a member of our Board of Directors), Joel Bennett (our Chief Financial Officer), Stanley Shenker and Associates, Inc., Bell Licensing, LLC, Stanley Shenker and James Bell.
WWE sought treble, punitive and other damages (including disgorgement of profits) in an undisclosed amount and a declaration that the video game license with the joint venture, which is scheduled to expire in 2009 (subject to joint venture’s right to extend that license for an additional five years), and an amendment to our toy licenses with WWE, which are scheduled to expire in 2009, are void and unenforceable. This action alleged violations by the defendants of the Racketeer Influenced and Corrupt Organization Act (“RICO”) and the anti-bribery provisions of the Robinson-Patman Act, and various claims under state law.
On February 16, 2005, we filed a motion to dismiss the WWE Action. On March 30, 2005, the day before WWE’s opposition to our motion was due, WWE amended its complaint to, among other things, add the Chief Executive Officer of THQ as a defendant and to add a claim under the Sherman Act. On March 31, 2005, the WWE sent a letter to the Court proposing, inter alia, a briefing schedule for defendants’ motions to dismiss the amended complaint.
In November 2004, several purported class action lawsuits were filed in the United States District Court for the Southern District of New York: (1) Garcia v. JAKKS Pacific, Inc. et al, Civil Action No. 04-8807 (filed on November 5, 2004, (2) Jonco Investors, LLC v. JAKKS Pacific, Inc. et al, Civil Action No. 04-9021 (filed on November 16, 2004), (3) Kahn v. JAKKS Pacific, Inc. et al, Civil Action No. 04-8910 (filed on November 10, 2004), (4) Quantum Equities L.L.C. v. JAKKS Pacific, Inc. et al, Civil Action No. 04-8877 (filed on November 9, 2004), and (5) Irvine v. JAKKS Pacific, Inc. et al, Civil Action No. 04-9078 (filed on November 16, 2004) (the “Class Actions”). The complaints in the Class Actions allege that defendants issued positive statements concerning increasing sales of our WWE licensed products which were false and misleading because the WWE licenses had allegedly been obtained through a pattern of commercial bribery, our relationship with the WWE was being negatively impacted by the WWE’s contentions and there was an increase risk that the WWE would either seek modification or nullification of the licensing agreements with us. Plaintiffs also allege that we misleadingly failed to disclose the alleged fact that the WWE licenses were obtained through an unlawful bribery scheme. The plaintiffs in the Class Actions are described as purchasers of our common stock, who purchased from as early as October 26, 1999 to as late as October 19, 2004. The Class Actions seek compensatory and other damages in an undisclosed amount, alleging violations of Section 10(b) of the Securities Exchange Act of 1934 (the “Exchange Act”) and Rule 10b-5 promulgated thereunder by each of the defendants (namely the Company and Messrs. Friedman, Berman and Bennett), and violations of Section 20(a) of the Exchange Act by Messrs. Friedman, Berman and Bennett. On January 25, 2005, the Court consolidated the Class Actions under the caption In re JAKKS Pacific, Inc. Shareholders Class Action Litigation, Civil Action No. 04-8807.

JAKKS Pacific, Inc. and Subsidiaries
38
Management’s Discussion and Analysis of Financial Condition and Results of Operations (cont.)
We believe that the claims in the WWE Action and the Class Actions are without merit and we intend to defend vigorously against them. However, because these Actions are in their preliminary stages, we cannot assure you as to the outcome of the Actions, nor can we estimate the range of our potential losses.
On February 16, 2005, we filed a motion to dismiss WWE’s Complaint in the WWE Action. The motion is currently scheduled to be fully briefed on April 14, 2005, with oral argument to be scheduled thereafter.
On December 2, 2004, a shareholder derivative action was filed in the Southern District of New York by Freeport Partner, LLC against us, nominally, and against Messrs. Friedman, Berman and Bennett, Freeport Partners v. Friedman, et al., Civil Action No. 04-9441 (the “Derivative Action”). The Derivative Action seeks to hold the individual defendants liable for damages allegedly caused to us by their actions and in particular to hold them liable on a contribution theory with respect to any liability we incur in connection with the Class Actions. On or about February 10, 2005, a second shareholder derivative action was filed in the Southern District of New York by David Oppenheim against us, nominally, and against Messrs. Friedman, Berman, Bennett, Blatte, Glick, Miller and Skala, Civil Action 05-2046 (the “Second Derivative Action”). The Second Derivative Action seeks to hold the individual defendants liable for damages allegedly caused to us by their actions as a result of alleged breaches of their fiduciary duties. On or about March 16, 2005, a third shareholder derivative action was filed. It is captioned Warr v. Friedman, Berman, Bennett, Blatte, Glick, Miller, Skala, and JAKKS (as a nominal defendant), and it was filed in the Superior Court of California, Los Angeles County (the “Third Derivative Action”). The Third Derivative Action seeks to hold the individual defendants liable for (1) damages allegedly caused to us by their alleged breaches of fiduciary duty, abuse of control, gross mismanagement, waste of corporate assets and unjust enrichment; and (2) restitution to us of profits, benefits and other compensation obtained by them.
On March 1, 2005, we delivered a Notice of Breach of Settlement Agreement and Demand for Indemnification to WWE (the “Notification”). The Notification asserted that WWE’s filing of the WWE Action violated A Covenant Not to Sue contained in a January 15, 2004 Settlement Agreement and General Release (“General Release”) entered into between WWE and us and, therefore, that we were demanding indemnification, pursuant to the Indemnification provision contained in the General Release, for all losses that the WWE’s actions have caused or will cause to us and our officers, including but not limited to any losses sustained by us in connection with the Class Actions. On March 4, 2005, in a letter from its outside counsel, WWE asserted that the General Release does not cover the claims in the WWE Action.
Pursuant to the terms of a Purchase Agreement, dated June 9, 2003, we sold an aggregate of $98 million of 4.625% Convertible Senior Notes due June 15, 2023. The holders of the notes may convert the notes into shares of our common stock at any time at an initial conversion price of $20.00 per share, subject to certain circumstances described in the notes. We will pay cash interest on the notes at an annual rate of 4.625% of the principal amount at issuance, from the issue date to June 15, 2010, payable on June 15 and December 15 of each year, commencing on December 15, 2003. After June 15, 2010, we will not pay cash interest on the notes. At maturity, on June 15, 2023, we will redeem the notes at their accreted principal amount, which will be equal to $1,811.95 (181.195%) per $1,000 principal amount at issuance.

2004 Annual Report
39
We may redeem the notes at our option in whole or in part beginning on June 15, 2010, at 100% of their accreted principal amount plus accrued and unpaid interest (including contingent interest and additional amounts), if any, payable in cash. Holders of the notes may also require us to repurchase all or part of their notes on June 15, 2010, for cash, at a repurchase price of 100% of the principal amount per note plus accrued and unpaid interest (including contingent interest and additional amounts), if any. Holders of the notes may also require us to repurchase all or part of their notes on June 15, 2013 and June 15, 2018 at a repurchase price of 100% of the accreted principal amount per note plus accrued and unpaid interest (including contingent interest and additional amounts), if any. Any repurchases at June 15, 2013 and June 15, 2018 may be paid in cash, in shares of common stock or a combination of cash and shares of common stock.
We believe that our cash flows from operations, cash and cash equivalents on hand and marketable securities will be sufficient to meet our working capital and capital expenditure requirements and provide us with adequate liquidity to meet our anticipated operating needs for at least the next 12 months. Although operating activities are expected to provide cash, to the extent we grow significantly in the future, our operating and investing activities may use cash and, consequently, this growth may require us to obtain additional sources of financing. There can be no assurance that any necessary additional financing will be available to us on commercially reasonable terms, if at all. We intend to finance our long-term liquidity requirements out of net cash provided by operations, marketable securities and cash on hand.
Exchange Rates
Sales from our United States and Hong Kong operations are denominated in U.S. dollars and our manufacturing costs are denominated in either U.S. or Hong Kong dollars. Domestic sales from our United Kingdom operations and operating expenses of all of our operations are denominated in local currency, thereby creating exposure to changes in exchange rates. Changes in the Hong Kong dollar or British Pound/U.S. dollar exchange rate may positively or negatively affect our gross margins, operating income and retained earnings. The exchange rate of the Hong Kong dollar to the U.S. dollar has been fixed by the Hong Kong government since 1983 at HK$7.80 to US$1.00 and, accordingly, has not represented a currency exchange risk to the U.S. dollar. We cannot assure you that the exchange rate between the United States and Hong Kong currencies will continue to be fixed or that exchange rate fluctuations between the United States and Hong Kong and United Kingdom currencies will not have a material adverse effect on our business, financial condition or results of operations.

JAKKS Pacific, Inc. and Subsidiaries
40
December 31, (In thousands, except share data) 2003 2004
AssetsCurrent assets Cash and cash equivalents $ 118,182 $ 176,544 Marketable securities 19,345 19,047 Accounts receivable, net of allowance for uncollectible accounts of $7,877 and $7,058, respectively 86,120 102,266 Inventory, net of reserves of $5,025 and $8,042, respectively 44,400 50,000 Prepaid and other 16,763 24,682
Total current assets 284,810 372,539Property and equipment Office furniture and equipment 6,563 6,823 Molds and tooling 34,481 28,818 Leasehold improvements 2,429 2,572
Total 43,473 38,213 Less accumulated depreciation and amortization 31,751 27,273
Property and equipment, net 11,722 10,940Intangibles and other, net 18,172 27,368Investment in joint venture 9,097 9,816Goodwill, net 190,728 258,331Trademarks, net 15,468 17,768
Total assets $ 529,997 $ 696,762
Liabilities and Stockholders’ EquityCurrent liabilities Accounts payable $ 31,610 $ 53,643 Accrued expenses 10,805 55,333 Reserve for sales returns and allowances 7,753 23,173 Current portion of long-term debt 19 — Income taxes payable 2,021 10,847
Total current liabilities 52,208 142,996Long-term debt, net of current portion 98,042 98,000Deferred income taxes 1,847 4,281
Total liabilities 152,097 245,277
Commitments and contingenciesStockholders’ equity Preferred shares, $.001 par value; 5,000,000 shares authorized; nil outstanding — — Common stock, $.001 par value; 100,000,000 shares authorized; 24,926,826 and 26,234,016 shares issued and outstanding, respectively 25 26 Additional paid-in capital 246,008 276,642 Retained earnings 133,005 176,564 Deferred compensation from restricted stock grants (789) — Accumulated other comprehensive loss (349) (1,747)
Total stockholders’ equity 377,900 451,485
Total liabilities and stockholders’ equity $ 529,997 $ 696,762
See notes to consolidated financial statements.
Consolidated Balance Sheets

2004 Annual Report
41
Year Ended December 31, (In thousands, except per share amounts) 2002 2003 2004
Net sales $ 310,016 $ 315,776 $ 574,266Cost of sales 180,173 189,334 348,259
Gross profit 129,843 126,442 226,007Selling, general and administrative expenses 98,111 113,053 172,282Acquisition shut-down and product recall costs 6,718 2,000 —
Income from operations 25,014 11,389 53,725Profit from joint venture (8,004) (7,351) (7,865)Interest, net (1,141) 1,405 2,498
Income before provision for income taxes and minority interest 34,159 17,335 59,092Provision for income taxes 6,466 1,440 15,533
Income before minority interest 27,693 15,895 43,559Minority interest (237) — —
Net income $ 27,930 $ 15,895 $ 43,559
Basic earnings per share $ 1.27 $ 0.66 $ 1.69
Diluted earnings per share $ 1.23 $ 0.66 $ 1.49
See notes to consolidated financial statements.
Consolidated Statements of Other Comprehensive Income
Year Ended December 31, (In thousands) 2002 2003 2004
Other comprehensive income:Net income $27,930 $15,895 $43,559Foreign currency translation adjustment — (349) (1,398)
Other comprehensive income $27,930 $15,546 $42,161
See notes to consolidated financial statements.
Consolidated Statements of Operations

JAKKS Pacific, Inc. and Subsidiaries
42
Common StockDeferred
Compensation Accumulated Number Additional from Other Total
December 31, 2002, 2003 and 2004
(In thousands)
of Shares Amount
Paid-In Capital
Treasury Stock
Retained Earnings
Restricted Stock Grants
Comprehensive Loss
Stockholders’ Equity
Balance, December 31, 2001 18,827 $20 $168,115 $ (12,911) $ 89,180 $ — $ — $244,404Exercise of options and warrants 955 1 5,883 — — — — 5,884Compensation for fully vested stock options — — (1,308) — — — — (1,308)Retirement of treasury stock — (1) (12,910) 12,911 — — — —Fair value of outstanding stock options in acquisition — — 3,151 — — — — 3,151Issuance of common stock for cash 3,525 3 59,091 — — — — 59,094Issuance of common stock for Toymax 1,166 1 18,080 — — — — 18,081Net income — — — — 27,930 — — 27,930
Balance, December 31, 2002 24,473 24 240,102 — 117,110 — — 357,236Exercise of options 312 — 1,777 — — — — 1,777Restricted stock grants 696 1 9,152 — — (789) — 8,364Issuance of warrants — — 1,057 — — — — 1,057Compensation for fully vested stock options — — 6 — — — — 6Repurchase and retirement of common stock (554) — (6,086) — — — — (6,086)Net income — — — — 15,895 — — 15,895Foreign currency translation adjustment — — — — — — (349) (349)
Balance, December 31, 2003 24,927 25 246,008 — 133,005 (789) (349) 377,900Exercise of options 192 — 1,699 — — — — 1,699Stock option income tax benefit — — 739 — — — — 739Restricted stock grants 340 — 7,487 — — 789 — 8,276Compensation for fully vested stock options — — 5,365 — — — — 5,365Issuance of common stock for Play Along 749 1 14,850 — — — — 14,851Issuance of common stock for Kidz Biz earn-out 26 — 494 — — — — 494Net income — — — — 43,559 — — 43,559Foreign currency translation adjustment — — — — — — (1,398) (1,398)
Balance, December 31, 2004 26,234 $26 $276,642 $ — $ 176,564 $ — $ (1,747) $451,485
See notes to consolidated financial statements.
Consolidated Statements of Stockholders’ Equity

2004 Annual Report
43
Year Ended December 31, (In thousands) 2002 2003 2004
Cash flows from operating activities Net income $ 27,930 $ 15,895 $ 43,559
Adjustments to reconcile net income to net cash provided by operating activities Depreciation and amortization 15,456 16,029 21,518 Compensation for fully vested stock options (1,308) 6 5,365 Acquisition earn-out — — 494 Investment in joint venture (225) 79 (719) Loss on disposal of property and equipment — — 1,096 Forgiveness of officer note receivable 285 — — Restricted stock compensation — 8,364 8,276 Minority interest (237) — — Changes in operating assets and liabilities Net sale (purchase) of marketable securities 37,119 — — Accounts receivable (3,307) (28,224) (4,333) Inventory (10,996) (2,654) 784 Prepaid expenses and other 507 (5,643) (3,613) Accounts payable (3,698) 16,264 19,192 Accrued expenses (9,534) (3,259) 19,742 Income taxes payable 7,056 (1,397) 5,945 Reserve for sales returns and allowances 8,626 (5,827) 13,289 Deferred income taxes 3,879 (2,240) 795
Total adjustments 43,623 (8,502) 87,831
Net cash provided by operating activities 71,553 7,393 131,390
Cash flows from investing activities Purchases of property and equipment (6,594) (4,472) (5,917) Purchases of other assets (21,159) (4,936) (26,863) Cash paid for net assets (66,232) (19,676) (41,438) Net (purchases) sales of marketable securities — (19,345) 967 Notes receivable—officers 861 1,113 —
Net cash used by investing activities (93,124) (47,316) (73,251)
Cash flows from financing activities Proceeds from sale of common stock 59,094 — — Repurchase of common stock — (6,086) — Proceeds from stock options and warrants exercised 5,884 1,777 1,682 Net proceeds from sale of convertible notes — 94,366 — Repayments of debt (30) (16) (61)
Net cash provided by financing activities 64,948 90,041 1,621
Foreign currency translation adjustment — (349) (1,398)Net increase in cash and cash equivalents 43,377 49,769 58,362Cash and cash equivalents, beginning of year 25,036 68,413 118,182
Cash and cash equivalents, end of year $ 68,413 $ 118,182 $ 176,544
Cash paid during the period for: Interest $ 80 $ 2,375 $ 4,534
Income taxes $ 3,235 $ 9,694 $ 2,688
See Note 16 for additional supplemental information to consolidated statements of cash flows.
See notes to consolidated financial statements.
Consolidated Statements of Cash Flows

JAKKS Pacific, Inc. and Subsidiaries
44
Note 1—Principal Industry
JAKKS Pacific, Inc. (the “Company”) is engaged in the development, production and marketing of toys and related products, some of which are based on highly-recognized entertainment properties and character licenses. The Company commenced its primary business operations in July 1995 through the purchase of substantially all of the assets of a Hong Kong toy company. The Company markets its product lines domestically and internationally.
The Company was incorporated under the laws of the State of Delaware in January 1995.
Note 2—Summary of Significant Accounting Policies
Principles of Consolidation. The consolidated financial statements include accounts of the Company and its wholly-owned subsidiaries. In consolidation, all significant inter-company balances and transactions are eliminated.
Cash and Cash Equivalents. The Company considers all highly liquid assets, having an original maturity of less than three months, to be cash equivalents. The Company maintains its cash in bank deposits which, at times, may exceed federally insured limits. The Company has not experienced any losses in such accounts. The Company believes it is not exposed to any significant credit risk on cash and cash equivalents.
Use of Estimates. The preparation of financial statements in conformity with accounting principles generally accepted in the United States of America requires management to make estimates and assumptions that affect the reported amounts of assets and liabilities, disclosure of contingent assets and liabilities at the dates of the financial statements, and the reported amounts of revenue and expenses during the reporting periods. Actual future results could differ from those estimates.
Revenue Recognition. Revenue is recognized upon the shipment of goods to customers or their agents, depending on terms, provided that there are no uncertainties regarding customer acceptance, the sales price is fixed or determinable, and collectibility is reasonably assured and not contingent upon resale.
Generally, we do not allow for product returns. We provide a negotiated allowance for breakage or defects to our customers, which is recorded when the related revenue is recognized. However, we do make occasional exceptions to this policy and consequently accrue a return allowance in gross sales based on historic return amounts and management estimates.
We also will occasionally grant credits to facilitate markdowns and sales of slow moving merchandise. These credits are recorded as a reduction of gross sales at the time of occurrence. Our reserve for sales returns and allowances increased by $15.4 million from $7.8 million as of December 31, 2003 to $23.2 million as of December 31, 2004. This increase is due primarily to the significant increase in sales in 2004, the timing of customer deductions and an increase in sales of electronic products which have higher defective rates.
Inventory. Inventory, which includes the ex-factory cost of goods, capitalized warehouse costs and in-bound freight and duty, is valued at the lower of cost (first-in, first-out) or market and consists of the following (in thousands):
December 31, 2003 2004
Raw materials $ 1,033 $ 1,557Finished goods 43,367 48,443
$ 44,400 $ 50,000
Notes to Consolidated Financial Statements December 31, 2004

2004 Annual Report
45
Marketable Securities. Marketable securities categorized as trading securities were liquidated at December 31, 2002 and related unrealized holding gains or losses are included in earnings. New investments made beginning in 2003 are categorized as available for sale and related unrealized holding gains or losses are included as a component of stockholders’ equity. At December 31, 2003 and 2004, cost approximated fair market value.
Fair Value of Financial Instruments. The Company’s cash and cash equivalents, marketable securities and accounts receivable represent financial instruments. The carrying value of these financial instruments is a reasonable approxima-tion of fair value. The fair value of the $98.0 million of convertible senior notes payable at December 31, 2004 was approximately $131.9 million based on the quoted market price.
Property and Equipment. Property and equipment are stated at cost and are being depreciated using the straight-line method over their estimated useful lives as follows:
Office equipment 5 yearsAutomobiles 5 yearsFurniture and fixtures 5–7 yearsMolds and tooling 2–4 yearsLeasehold improvements Shorter of length of lease or 10 years
Shipping and Handling Costs. The consolidated financial statements reflect, for all periods presented, the adoption of the classification or disclosure requirements pursuant to Emerging Issues Task Force (“EITF”) 00-10, “Accounting for Shipping and Handling Fees and Costs,” which was effective in the fourth quarter of fiscal 2000. Consistent with EITF 00-10, the Company has historically classified income from freight charges to customers in “Net sales.” The Company classifies shipping and handling costs in “Selling, general and administrative expenses.” Such costs amounted to approximately $8.1 million in 2002, $5.2 million in 2003 and $3.6 million in 2004.
Advertising. Production costs of commercials and programming are charged to operations in the year during which the production is first aired. The costs of other advertising, promotion and marketing programs are charged to operations in the year incurred. Advertising expense for the years ended December 31, 2002, 2003 and 2004, was approximately $12.7 million, $12.4 million and $26.4 million, respectively.
The Company also participates in cooperative advertising arrangements with some customers, whereby it allows a discount from invoiced product amounts in exchange for customer purchased advertising that features the Company’s products. Typically, theses discounts range from 1% to 5% of gross sales, and are generally based on product purchases or on specific advertising campaigns. Such amounts are accrued when the related revenue is recognized or when the advertising campaign is initiated. These cooperative advertising arrangements are accounted for as direct selling expenses.
Income Taxes. The Company does not file a consolidated return with its foreign subsidiaries. The Company files Federal and state returns and its foreign subsidiaries each file Hong Kong returns and United Kingdom returns, as applicable. Deferred taxes are provided on a liability method whereby deferred tax assets are recognized as deductible temporary differences and operating loss and tax credit carryforwards and deferred tax liabilities are recognized for taxable tempo-rary differences. Temporary differences are the differences between the reported amounts of assets and liabilities and
JAKKS Pacific, Inc. and Subsidiaries
46
Notes to Consolidated Financial Statements (cont.)December 31, 2004
their tax basis. Deferred tax assets are reduced by a valuation allowance when, in the opinion of management, it is more likely than not that some portion or all of the deferred tax assets will not be realized. Deferred tax assets and liabilities are adjusted for the effects of changes in tax laws and rates on the date of enactment.
Translation of Foreign Currencies. Monetary assets and liabilities denominated in Hong Kong dollars or British Pounds Sterling are translated into United States dollars at the rate of exchange ruling at the balance sheet date. Transactions during the period are translated at the rates ruling at the dates of the transactions.
Profits and losses resulting from the above translation policy are recognized in the consolidated statements of operations and statements of other comprehensive income.
Accounting for the Impairment of Long-Lived Assets. Long-lived assets, which include property and equipment, goodwill and intangible assets other than goodwill, are evaluated at least annually for impairment when events or changes in circumstances indicate that the carrying amount of the assets may not be recoverable through the estimated undiscounted future cash flows from the use of these assets. When any such impairment exists, the related assets will be written down to fair value.
Goodwill and Other Intangible Assets. In July 2001, the Financial Accounting Standards Board (“FASB”) issued Statement of Financial Accounting Standards “SFAS” No. 141, “Business Combinations” (“SFAS 141”) and SFAS 142, “Goodwill and Other Intangible Assets” (“SFAS 142”). SFAS 141 is effective for business combinations initiated after June 30, 2001, and requires that all business combinations completed after its adoption be accounted for under the purchase method of accounting and establishes specific criteria for the recognition of intangible assets separately from goodwill. SFAS 142 was effective for the Company on January 1, 2002 and primarily addresses the accounting for goodwill and intangible assets subsequent to their acquisition. With the adoption of SFAS 142, goodwill and certain other intangible assets are no longer amortized and are tested for impairment at least annually at the reporting unit level. Losses in value are recorded when and as material impairment has occurred in the underlying assets or when the benefits of the identified intangible assets are realized. As of December 31, 2004, there was no impairment to the underlying value of goodwill or intangible assets other than goodwill.
The carrying value of goodwill is based on management’s current assessment of recoverability. Management evaluates recoverability using both objective and subjective factors. Objective factors include management’s best estimates of projected future earnings and cash flows and analysis of recent sales and earnings trends. Subjective factors include competitive analysis and the Company’s strategic focus.
Intangible assets other than goodwill consist of product technology rights, trademarks, acquired backlog, customer relationships, product lines and license agreements. Intangible assets other than trademarks are amortized over the estimated economic lives of the related assets. Accumulated amortization as of December 31, 2003 and 2004 was $16.5 million and $30.2 million, respectively.
Stock Option Plans. In December 2002, the FASB issued SFAS 148 “Accounting for Stock-Based Compensation—Transition and Disclosure, an amendment of FASB Statement No. 123” (“SFAS 148”). SFAS 148 Statement amends SFAS 123, “Accounting for Stock-Based Compensation” (“SFAS 123”), to provide alternative methods of transition for an entity

2004 Annual Report
47
that voluntarily changes to the fair value based method of accounting for stock-based employee compensation. It also amends the disclosure provisions of that Statement to require prominent disclosure about the effects on reported net income of an entity’s accounting policy decisions with respect to stock-based employee compensation. Finally, SFAS 148 amends APB Opinion No. 28, “Interim Financial Reporting,” to require disclosure about those effects in interim financial information.
At December 31, 2004, the Company had stock-based employee compensation plans, which are described more fully in Note 14. The Company accounts for those plans under the recognition and measurement principles of APB Opinion No. 25, “Accounting for Stock Issued to Employees,” and related Interpretations. No stock-based employee compensation cost is reflected in net income, as all options granted under those plans had an exercise price equal to the market value of the underly-ing common stock on the date of grant. However, certain options had been repriced resulting in compensation adjustments, which have been reflected in net income. The following table illustrates the effect on net income and earnings per share if the Company had applied the fair value recognition provisions of SFAS 123, to stock-based employee compensation.
In 2002, 2003 and 2004 the fair value of each employee option grant was estimated on the date of grant using the Black-Scholes option-pricing model with the following assumptions used: risk-free rate of interest of 4%, 4% and 2.25%, respectively; dividend yield of 0%; with volatility of 87%, 82% and 136.9% respectively; and expected lives of five years.
Year Ended December 31, (In thousands, except per share data) 2002 2003 2004
Net income, as reported $ 27,930 $ 15,895 $ 43,559Add (Deduct): Stock-based employee compensation expense (income) included in reported net income net of related tax effects (1,061) 5 3,970Deduct: Total stock-based employee compensation expense determined under fair value method for all awards net of related tax effects (2,034) (2,796) (2,999)
Pro forma net income $ 24,835 $ 13,104 $ 44,530
Earnings per share: Basic—as reported $ 1.27 $ 0.66 $ 1.69
Basic—pro forma $ 1.13 $ 0.54 $ 1.73
Diluted—as reported $ 1.23 $ 0.66 $ 1.49
Diluted—pro forma $ 1.09 $ 0.55 $ 1.52
Earnings Per Share. The following table is a reconciliation of the weighted average shares used in the computation of basic and diluted earnings per share (“EPS”) for the periods presented (in thousands, except per share data):
2002
WeightedAverage Per
Income Shares Share
Basic EPSIncome available to common stockholders $27,930 21,963 $1.27
Effect of dilutive securitiesOptions and warrants — 784
Diluted EPSIncome available to common stockholders plus assumed exercises $27,930 22,747 $1.23

JAKKS Pacific, Inc. and Subsidiaries
48
Notes to Consolidated Financial Statements (cont.)December 31, 2004
2003
WeightedAverage Per
Income Shares Share
Basic EPSIncome available to common stockholders $15,895 24,262 $0.66
Effect of dilutive securitiesConvertible senior notes payable 2,114 2,760Options and warrants — 415
Diluted EPSIncome available to common stockholders plus assumed exercises $18,009 27,437 $0.66
2004
WeightedAverage Per
Income Shares Share
Basic EPSIncome available to common stockholders $43,559 25,797 $1.69
Effect of dilutive securitiesConvertible senior notes payable 3,354 4,900Options and warrants — 709
Diluted EPSIncome available to common stockholders plus assumed exercises $46,913 31,406 $1.49
Included in diluted EPS in 2003 and 2004 is the assumed conversion of $98.0 million of convertible senior notes payable (Note 8). In accordance with EITF Issue 04-8, “The Effect of Contingently Convertible Instruments on Diluted Earnings Per Share,” which the Company adopted in December 2004, diluted earnings per share for 2003 was restated to reflect the dilutive effect of the assumed conversion of the Company’s convertible senior notes due 2023. The diluted earnings per share calculations for the two fiscal years ended December 31, 2004 include adjustments to add back to earnings the interest expense, net of tax, incurred on the convertible senior notes and to include in diluted weighted average shares the shares potentially issuable as if the contingent conversion features were met. There was no effect on 2003 diluted earnings per share.
Recent Accounting Standards. In January 2003 and as revised in December 2003, the FASB issued FASB Interpretation No. 46, “Consolidation of Variable Interest Entities” (“Interpretation 46”) and FASB Interpretation No. 46R (“Interpretation 46R”). Interpretations 46 and 46R require companies with a variable interest in a variable interest entity to apply the guidance contained in such Interpretations as of the beginning of the first reporting period after December 15, 2003. If applicable, the application of the guidance could result in the consolidation of a variable interest entity. Interpretations 46 and 46R are not applicable to the Company, as it is not the beneficiary of any variable interest entities.

2004 Annual Report
49
In May 2003, the FASB issued SFAS 150, “Accounting for Certain Financial Instruments with Characteristics of Both Liabilities and Equity” (“SFAS 150”). SFAS 150 establishes standards for how an issuer classifies and measures certain financial instruments with characteristics of both liabilities and equity. The provisions of SFAS 150 were adopted effective June 9, 2003. The adoption of SFAS 150 did not have a material effect on the Company’s financial position or results of operations.
The Company uses the intrinsic-value method of accounting for stock options granted to employees. As required by the Company’s existing stock plans, stock options are granted at, or above, the fair market value of the Company’s stock, and, accordingly, no compensation expense is recognized for these grants in the consolidated statement of operations. The Company records compensation expense related to other stock-based awards, such as restricted stock grants, over the period the award vests. On December 16, 2004, the FASB issued SFAS 123 (revised 2004), “Share-Based Payment” (“SFAS 123R”), which amends SFAS 123, “Accounting for Stock-Based Compensation” and SFAS 95 “Statement of Cash Flows.” SFAS 123R requires companies to measure all employee stock-based compensation awards using a fair value method and record such expense in its consolidated financial statements. In addition, the adoption of SFAS 123R requires additional accounting and disclosure related to the income tax and cash flow effects resulting from share-based payment arrangements. SFAS 123R is effective for the Company as of July 1, 2005. The adoption of SFAS 123R’s fair value method will have an impact on the Company’s results of operations, although it will have no impact on its overall financial position. While the Company cannot estimate the level of share-based payments to be issued in the future, based on the stock options that are currently outstanding, the Company expects that the adoption of SFAS 123R will result in a charge to operations in the second half of 2005 of approximately $1.5 million.
In accordance with EITF Issue 04-8, “The Effect of Contingently Convertible Instruments on Diluted Earnings Per Share,” which the Company adopted in December 2004, diluted earnings per share for 2003 was restated to reflect the dilutive effect of the assumed conversion of the Company’s convertible senior notes due in 2023. The diluted earnings per share calculations for the two fiscal years ended December 31, 2004 include adjustments to add back to earnings the interest expense, net of tax, incurred on the convertible senior notes and to include in diluted weighted average shares the shares potentially issuable as if the contingent conversion features were met. There was no effect on 2003 diluted earnings per share.
Reclassifications. Certain reclassifications have been made to prior year balances in order to conform to the current year presentation.
Note 3—Business Segments, Geographic Data, Sales by Product Group, and Major Customers
The Company is a worldwide producer and marketer of children’s toys and related products, principally engaged in the design, development, production and marketing of traditional toys, including boys action figures, vehicles and playsets, craft and activity products, writing instruments, compounds, girls toys, and infant and preschool toys. The Company’s reportable segments are North America Toys, International and Other.

JAKKS Pacific, Inc. and Subsidiaries
50
Notes to Consolidated Financial Statements (cont.)December 31, 2004
The North America Toys segment, which includes the United States and Canada, and the International toy segment, which includes sales to non-North American markets, include the design, development, production and marketing of children’s toys and related products. The Company also has an additional segment classified as Other, which sells various products to the specialty markets in the United States.
Segment performance is measured at the operating income level. All sales are made to external customers, and general corporate expenses have been attributed to the North America Toy segment, which is a dominant segment. Segment assets are comprised of accounts receivable and inventories, net of applicable reserves and allowances.
The accounting policies of the segments are described in Note 2.Results are not necessarily those that would be achieved were each segment an unaffiliated business enterprise.
Information by segment and a reconciliation to reported amounts for the three years ended December 31, 2004 are as follows (in thousands):
Year Ended December 31, 2002 2003 2004
Net SalesNorth America Toys $ 263,314 $ 272,317 $ 521,292International 46,251 43,424 52,805Other 451 35 169
$310,016 $ 315,776 $ 574,266
Year Ended December 31, 2002 2003 2004
Operating IncomeNorth America Toys $ 21,246 $ 9,821 $ 48,770International 3,732 1,566 4,940Other 36 2 15
$ 25,014 $ 11,389 $ 53,725
December 31, 2003 2004
AssetsNorth America Toys $457,056 $632,489International 72,884 64,069Other 57 204
$529,997 $696,762

2004 Annual Report
51
The following tables present information about the Company by geographic area as of and for the three years ended December 31, 2004 (in thousands):
December 31, 2003 2004
Long-Lived AssetsUnited States $197,751 $278,734Hong Kong 32,382 30,484Europe 4,011 2,783
$234,144 $312,001
Year Ended December 31, 2002 2003 2004
Net Sales by Geographic AreaUnited States $256,799 $271,051 $505,803Europe 39,414 35,547 37,700Canada 6,966 5,125 15,658Hong Kong 324 1,275 4,410Other 6,513 2,778 10,695
$310,016 $315,776 $574,266
Year Ended December 31, 2002 2003 2004
Net Sales by Product GroupTraditional Toys $103,429 $106,963 $406,023Craft/Activities/Writing Products 153,370 164,087 99,779Seasonal Products 53,217 44,726 68,464
$310,016 $315,776 $574,266
Major Customers. Net sales to major customers, which are part of our North American Toys segment, were approximately as follows (in thousands, except for percentages):
2002 2003 2004
Amount Percentage
of Net Sales Amount Percentage
of Net Sales Amount Percentage
of Net Sales
Wal-Mart $ 46,396 15.0% $ 91,378 28.9% $193,776 33.7%Target 34,018 11.0 30,371 9.6 74,429 13.0Toys “R” Us 41,506 13.4 30,009 9.5 68,279 11.9Kmart 34,773 11.2 17,996 5.7 27,274 4.8Kay Bee Toys 16,077 5.1 12,670 4.0 12,756 2.2
$ 172,770 55.7% $ 182,424 57.7% $376,514 65.6%
Wal-Mart has increased its percentage of the toy industry’s sales at retail and the increase in our sales to Wal-Mart is consistent with this change. No other customer accounted for more than 2% of our total net sales.

JAKKS Pacific, Inc. and Subsidiaries
52
Notes to Consolidated Financial Statements (cont.)December 31, 2004
Note 4—Acquisitions and Joint Venture
The Company owns a fifty percent interest in a joint venture with a company that develops, publishes and distributes interactive entertainment software for the leading hardware game platforms in the home video game market. The joint venture has entered into a license agreement with an initial license period expiring December 31, 2009 under which it acquired the exclusive worldwide right to publish video games on all hardware platforms. The Company’s investment is accounted for using the cost method due to the financial and operating structure of the venture and our lack of control over the joint venture. The Company’s basis consists primarily of organizational costs, license costs and recoupable advances and is being amortized over the term of the initial license period. The joint venture agreement provides for the Company to receive guaranteed preferred returns through June 30, 2006 at varying rates of the joint venture’s net sales depending on the cumulative unit sales and platform of each particular game. For periods after June 30, 2006, the amount of the preferred return will be subject to renegotiation between the parties. The preferred return is accrued in the quarter in which the licensed games are sold and the preferred return is earned. The Company’s joint venture partner retains the financial risk of the joint venture and is responsible for the day-to-day operations, including development, sales and distribution, for which they are entitled to any remaining profits. During 2002, 2003 and 2004, the Company earned $8.0 million, $7.4 million and $7.9 million, respectively, in profit from the joint venture.
In December 2001, the Company acquired all the outstanding stock of Kidz Biz Ltd., a United Kingdom company, and Kidz Biz Far East Limited, an affiliated Hong Kong corporation, (collectively “Kidz Biz”), for an aggregate purchase price of approximately $12.4 million, which was paid by the issuance of 308,992 shares of the Company’s common stock at a value of $6.0 million and cash of $6.4 million. In addition, we agreed to pay an earn-out for each of 2002, 2003, 2004 and 2005, based on the year over year increase in Kidz Biz sales, payable by delivery of up to 25,749 shares of our common stock per year. In 2002, 2003 and 2004, no earn-outs were earned. However, the 2005 earn-out at a value of $0.5 million was paid during 2004 upon the termination of employment of a principal of the seller, which was charged to expense in 2004. Both the United Kingdom and Hong Kong based companies are distributors of toys and related products in the United Kingdom, Ireland and the Channel Islands.
The Company acquired the following entities to further enhance its existing product lines and to continue diversification into other toy categories and seasonal businesses.
In March 2002, the Company purchased a controlling interest in Toymax International, Inc. (“Toymax”) and on October 25, 2002, the Company completed that acquisition by acquiring the remaining outstanding common shares in a merger transaction. This acquisition expanded the product offerings in the Company’s traditional toy category. The total purchase price of approximately $62.8 million consisted of 1,166,360 shares of the Company’s common stock, 598,697 options and approximately $41.0 million in cash. This transaction has been accounted for by the Company under the purchase method of accounting, and the Company’s results of operations have included Toymax from March 12, 2002; however, for the period from March 12, 2002 through October 25, 2002, the minority interest’s share of Toymax’s earnings were excluded.

2004 Annual Report
53
In November 2002, the Company purchased certain product lines, assets and assumed certain specific liabilities from Trendmasters, Inc. (“Trendmasters”). This acquisition expanded the product offerings in the Company’s seasonal business, including outdoor and holiday. The total purchase price of approximately $19.2 million consisted of all cash. This transaction has been accounted for by the Company under the purchase method of accounting, and the Company’s results of operations have included Trendmasters from the date of acquisition.
In May 2003, the Company purchased the product lines and related assets and assumed certain liabilities from P&M Products USA, Inc. and an affiliated United Kingdom company, P&M Products Limited, (collectively “P&M”). The total purchase price of approximately $22.0 million consisted of cash paid in the amount of $20.7 million and liabilities assumed of $0.6 million and resulted in goodwill of $13.5 million. Additionally, the patent for Blopen, one of P&M’s significant product lines, was purchased for $1.8 million in cash in a separate transaction with the patent owner that previously licensed Blopen to P&M. This acquisition expanded the product offerings in the Company’s activities category. This transaction has been accounted for by the Company under the purchase method of accounting, and the Company’s results of operations have included P&M from the date of acquisition.
In determining the purchase price allocation of the P&M acquisition, the Company considered the acquired intangible assets that arose from contractual or other legal rights, including trademarks, copyrights, patents and license agreements, as well as potential noncontractual intangible assets, including customer lists and customer-related relationships. The Company consummated this acquisition because of the additional value of the expected synergies that would result from combining the operations of P&M into the operations of the Company.
On June 10, 2004, the Company purchased substantially all of the assets and assumed certain liabilities of Play Along. The total purchase price of $85.7 million consisted of cash paid in the amount of $70.8 million and the issuance of 749,005 shares of the Company common stock valued at $14.9 million and resulted in goodwill of $67.8 million. In addition, the Company agreed to pay an earn-out of up to $10.0 million per year for the three calendar years following the acquisition up to an aggregate amount of $30.0 million based on the achievement of certain financial performance criteria which will be recorded as goodwill when and if earned. For the year ended December 31, 2004, $10.0 million of the earn-out was earned and recorded as goodwill as of December 31, 2004. Accordingly, the annual maximum earn-out for the remaining three years through December 31, 2007 is approximately $6.7 million, or an aggregate of $20.0 million. Play Along designs and produces traditional toys, which it distributes domestically and internationally. This acquisition expands our product offerings in the preschool area and brings new product development and marketing talent to the Company. This transaction has been accounted for by the Company under the purchase method of accounting, and the Company’s results of operations have included Play Along from the date of acquisition.
In determining the purchase price allocation of the Play Along acquisition, the Company considered the acquired intangible assets that arise from contractual or other legal rights, including trademarks, copyrights, patents and license agreements, potential noncontractual intangible assets, including customer lists and customer-related relationships, as well as the value of synergies that will result from combining the operations of Play Along into the operations of the Company.

JAKKS Pacific, Inc. and Subsidiaries
54
Notes to Consolidated Financial Statements (cont.)December 31, 2004
The total purchase price of these acquisitions was allocated to the estimated fair value of assets acquired and liabilities assumed as set forth in the following table (in thousands):
P&M Play
Along Total
Estimated fair value: Current assets $ 5,616 $ 24,063 $ 29,679 Property and equipment, net 17 546 563 Other assets 11 3,184 3,195 Liabilities assumed (1,378) (31,995) (33,373) Intangible assets other than goodwill 2,900 22,100 25,000 Goodwill 13,541 67,788 81,329
$ 20,707 $ 85,686 $ 106,393
Approximately $10.8 million of the Toymax goodwill, $23.2 million of Trendmasters goodwill, $14.1 million of the P&M goodwill and $67.8 million of the Play Along goodwill is expected to be deductible for tax purposes.
The following unaudited pro forma information represents the Company’s consolidated results of operations as if the acquisitions of P&M and Play Along had occurred on January 1, 2003 and after giving effect to certain adjustments including the elimination of certain general and administrative expenses and other income and expense items not attributable to ongoing operations, interest expense, and related tax effects. Such pro forma information does not purport to be indicative of operating results that would have been reported had the acquisitions of P&M and Play Along actually occurred on January 1, 2003 or on future operating results.
Year Ended December 31, (In thousands, except per share data) 2003 2004
Net sales $ 326,105 $ 618,952Net income $ 13,693 $ 44,391Basic earnings per share $ 0.56 $ 1.69Weighted average shares outstanding 24,262 26,239Diluted earnings per share $ 0.55 $ 1.65Weighted average shares and equivalents outstanding 24,677 26,947
Note 5—Concentration of Credit Risk
Financial instruments that subject the Company to concentration of credit risk are cash and cash equivalents and accounts receivable. Cash equivalents consist principally of short-term money market funds. These instruments are short-term in nature and bear minimal risk. To date, the Company has not experienced losses on these instruments.
The Company performs ongoing credit evaluations of its customers’ financial condition, but does not require collateral to support domestic customer accounts receivables. Most goods shipped FOB Hong Kong or China are secured with irrevocable letters of credit.

2004 Annual Report
55
At December 31, 2004 and 2003, the Company’s five largest customers accounted for approximately 65.1% and 74.6%, respectively, of net accounts receivable. The concentration of the Company’s business with a relatively small number of customers may expose the Company to material adverse effects if one or more of its large customers were to experience financial difficulty. The Company performs ongoing credit evaluations of its top customers and maintains an allowance for potential credit losses.
Note 6—Accrued Expenses
Accrued expenses consist of the following (in thousands): 2003 2004
Royalties and sales commissions $ 5,043 $20,527Bonuses 1,357 9,720Acquisition earn-out — 10,000Other 4,405 15,086
$ 10,805 $55,333
Note 7—Related Party Transactions
A director of the Company is a partner in the law firm that acts as counsel to the Company. The Company incurred legal fees and expenses to the law firm in the amount of approximately $2.7 million in 2002, $4.6 million in 2003 and $3.3 million in 2004.
Note 8—Long-Term Debt
Long-term debt consists of the following (in thousands): 2003 2004
Convertible senior notes (1) $98,000 $98,000Loan payable, due in sixty monthly payments with the final payment due December 4, 2006, with interest at 6.7% per annum 61 —
98,061 98,000Less current portion of long-term debt (19) —
Long-term debt, net of current portion $98,042 $98,000
(1) Pursuant to the terms of a Purchase Agreement, dated June 9, 2003, the Company sold an aggregate of $98.0 million of 4.625% Convertible Senior Notes due June 15, 2023. The holders of the notes may convert the notes into shares of the Company’s common stock at any time at an initial conver-sion price of $20.00 per share, subject to certain circumstances described in the notes. The Company will pay cash interest on the notes at an annual rate of 4.625% of the principal amount at issuance, from the issue date to June 15, 2010, payable on June 15 and December 15 of each year, commencing on December 15, 2003. After June 15, 2010, the Company will not pay cash interest on the notes. At maturity, on June 15, 2023, the Company will redeem the notes at their accreted principal amount, which will be equal to $1,811.95 (181.195%) per $1,000 principal amount at issuance.
The Company may redeem the notes at its option in whole or in part beginning on June 15, 2010, at 100% of their accreted principal amount plus accrued and unpaid interest (including contingent interest and additional amounts), if any, payable in cash. Holders of the notes may also require the Company to repurchase all or part of their notes on June 15, 2010, for cash, at a repurchase price of 100% of the principal amount per note plus accrued and unpaid interest (including contingent interest and additional amounts), if any. Holders of the notes may also require the Company to repurchase all or part of their notes on June 15, 2013 and June 15, 2018 at a repurchase price of 100% of the accreted principal amount per note plus accrued and unpaid interest (including contingent interest and additional amounts), if any. Any repurchases at June 15, 2013 and June 15, 2018 may be paid in cash, in shares of common stock or a combination of cash and shares of common stock.

JAKKS Pacific, Inc. and Subsidiaries
56
Notes to Consolidated Financial Statements (cont.)December 31, 2004
The following is a schedule of payments for the long-term debt (in thousands):
2005 $ —2006 —2007 —2008 —2009 —Thereafter 98,000
$ 98,000
Note 9—Income Taxes
The Company does not file a consolidated return with its foreign subsidiaries. The Company files Federal and state returns and its foreign subsidiaries file Hong Kong and United Kingdom returns. Income taxes reflected in the accompanying consolidated statements of operations are comprised of the following (in thousands): 2002 2003 2004
Federal $ 2,241 $ 608 $ 696State and local 270 55 1,088Foreign 6,105 3,017 12,954
8,616 3,680 14,738Deferred (2,150) (2,240) 795
$ 6,466 $ 1,440 $ 15,533
The components of deferred tax assets/(liabilities) are as follows (in thousands): 2003 2004
Net deferred tax assets/(liabilities): Current: Reserve for sales allowances and possible losses $ 1,114 $ 1,940 Accrued expenses 182 1,044 Restricted stock grant 3,094 136 Foreign tax credit, net of valuation — 2,166 Other 132 875
4,522 6,161
Long-Term: Undistributed earnings (7,191) (7,191) Property and equipment (1,088) (983) Original issue discount interest (925) (2,761) Deductible goodwill (2,783) (2,004) Other 2,152 242 Federal net operating loss carryforwards 7,321 8,416 State net operating loss carryforwards 667 —
(1,847) (4,281)
Total net deferred tax assets/(liabilities) $ 2,675 $ 1,880

2004 Annual Report
57
The current portion of deferred tax assets is included in prepaid expenses and other.Income tax expense varies from the U.S. Federal statutory rate. The following reconciliation shows the significant
differences in the tax at statutory and effective rates: 2002 2003 2004
Federal income tax expense 35% 35% 35%State income tax expense, net of federal tax effect 0.5 0.2 1.3Effect of differences in U.S. and foreign statutory rates (18.9) (30.6) (12.1)Other 2.3 3.7 1.8
18.9% 8.3% 26%
Deferred taxes result from temporary differences between tax bases of assets and liabilities and their reported amounts in the consolidated financial statements. The temporary differences result from costs required to be capitalized for tax purposes by the U.S. Internal Revenue Code (“IRC”), and certain items accrued for financial reporting purposes in the year incurred but not deductible for tax purposes until paid.
As of December 31, 2004, the Company has federal and state net operating loss carryforwards of $19.3 million and $20.4 million, respectively, expiring through 2023. These carryforwards resulted from the acquisitions of Pentech and Toymax. The utilization of these losses to offset future income is limited under IRC§382. The Company’s management concluded that a deferred tax asset valuation allowance was not necessary.
The components of income before provision for income taxes and minority interest are as follows (in thousands):
2002 2003 2004
Domestic $ (3,433) $ (5,255) $ (22,669)Foreign 37,592 22,590 81,761
$ 34,159 $ 17,335 $ 59,092
On October 22, 2004, the American Jobs Creation Act of 2004 (the “AJC Act”) was signed into law. The AJC Act creates a one-time incentive for U.S. corporations to repatriate undistributed earnings from their international subsidiaries by providing an 85% dividends-received deduction for certain international earnings. The deduction is available to corporations during the tax year that includes October 22, 2004 or in the immediately subsequent tax year. The Company is in the process of evaluating whether it will repatriate any international earnings under the provisions of the AJC Act.
Note 10—Credit Facility
In October 2001, the Company and all of its subsidiaries jointly and severally secured a syndicated line of credit totaling $50.0 million with a consortium of banks (“Line of Credit”). The Company terminated the Line of Credit effective August 13, 2004. There had never been any outstanding borrowings under the Line of Credit since its inception.

JAKKS Pacific, Inc. and Subsidiaries
58
Notes to Consolidated Financial Statements (cont.)December 31, 2004
Note 11—Leases
The Company leases office, warehouse and showroom facilities and certain equipment under operating leases. Rent expense for the three years ended December 31, 2004 totaled $4.0 million, $5.2 million and $5.8 million, respectively. The following is a schedule of minimum annual lease payments (in thousands).
2005 $ 6,5432006 5,7142007 4,7232008 2,8192009 2,804Thereafter 6,603
$ 29,206
Note 12—Common Stock, Preferred Stock and Warrants
The Company has 105,000,000 authorized shares of stock consisting of 100,000,000 shares of $.001 par value common stock and 5,000,000 shares of $.001 par value preferred stock. In February 2003, the Company’s Board of Directors approved a buyback of up to $20.0 million of the Company’s common stock. During 2003, the Company repurchased and retired 554,500 shares of its common stock at an aggregate cost of $6.1 million. No shares were repurchased during 2004.
During 2004, the Company issued 749,005 shares of common stock at a value of $14.9 million in connection with the Play Along acquisition, 25,749 shares of common stock at a value of $0.5 million in connection with the Kidz Biz acquisition, and 4,310 shares of restricted stock to five non-employee directors of the Company at a value of approximately $59,000. The Company also issued 192,129 shares of common stock on the exercise of options for a total of $1.7 million.
During 2003, the Company awarded 2,760,000 shares of restricted stock to four executive officers of the Company pursuant to its 2002 Stock Award and Incentive Plan, of which 636,000 were earned during 2003, 396,000 were earned during 2004, 288,000 were canceled upon the termination of employment of one of our executive officers in October 2004, and the balance may be earned through 2010 based upon the achievement of certain financial criteria and continuing employment. A charge of $8.4 million was recorded as of December 31, 2003 relating to this award. The Company also issued 312,491 shares of common stock on the exercise of options for a total of $1.8 million.
During 2002, the Company issued 954,770 shares of common stock on the exercise of options and warrants for a total of $5.9 million, 1,166,360 shares of common stock at a value of $18.1 million in connection with the Toymax acqui-sition and 3,525,000 shares of common stock in connection with an underwritten public offering for net proceeds of approximately $59.1 million.

2004 Annual Report
59
During 2003, the Company issued 100,000 fully vested warrants, expiring in 2013, in connection with license costs relating to its investment in the joint venture. The fair market value of these warrants was approximately $1.1 million and has been included in the basis of the joint venture (Note 4). The Company also issued $98.0 million of convertible senior notes payable that may be converted into an aggregate of 4.9 million shares of the Company’s common stock (Note 8).
Warrant activity is summarized as follows:
Number
of Shares Weighted Average
Exercise Price
Outstanding, December 31, 2001 166,875 $ 6.67 Exercised (166,875) 6.67
Outstanding, December 31, 2002 — — Granted 100,000 11.35 Exercised — —
Outstanding, December 31, 2003 and 2004 100,000 $ 11.35
Note 13—Commitments
The Company has entered into various license agreements whereby the Company may use certain characters and properties in conjunction with its products. Such license agreements call for royalties to be paid at 1% to 18% of net sales with minimum guarantees and advance payments. Additionally, under three separate licenses, the Company has committed to spend 12.5% of related net sales up to $1.0 million, 8% of related net sales and 5% of related net sales on advertising per year on such licenses. We estimate that our minimum commitment for advertising in fiscal 2005 will be $7.4 million.
Future annual minimum royalty guarantees as of December 31, 2004 are as follows (in thousands):
2005 $13,6352006 8,8682007 1,7952008 1,4272009 1,435Thereafter —
$27,160
The Company has entered into employment agreements with certain executives expiring through December 31, 2010. The aggregate future annual minimum guaranteed amounts due under those agreements as of December 31, 2004 are as follows (in thousands):
2005 $ 5,0692006 4,5572007 4,2482008 2,1802009 2,230Thereafter 2,280
$20,564

JAKKS Pacific, Inc. and Subsidiaries
60
Notes to Consolidated Financial Statements (cont.)December 31, 2004
Note 14—Stock Award and Incentive Plan
Under its 2002 Stock Award and Incentive Plan (“the Plan”), which incorporated its Third Amended and Restated 1995 Stock Option Plan, the Company has reserved 6,025,000 shares of its common stock for issuance upon the exercise of options granted under the Plan, as well as for the awarding of restricted stock. Under the Plan, employees (including officers), non-employee directors and independent consultants may be granted options to purchase shares of common stock and shares of restricted stock (Note 12).
As of December 31, 2004, 1,728,523 shares were available for future grant. Additional shares may become available to the extent that options presently outstanding under the Plan terminate or expire unexercised. Stock option activity pursuant to the Plan is summarized as follows:
Number
of Shares Weighted Average
Exercise Price
Outstanding, December 31, 2001 2,313,556 $ 9.97 Granted 1,124,197 11.06 Exercised (787,836) 6.71 Canceled (42,030) 15.00
Outstanding, December 31, 2002 2,607,887 11.35 Granted 184,500 13.31 Exercised (312,491) 11.78 Canceled (214,630) 12.71
Outstanding, December 31, 2003 2,265,266 12.15 Granted 287,644 19.49 Exercised (192,129) 8.89 Canceled (287,775) 13.76
Outstanding, December 31, 2004 2,073,006 $ 13.22
The weighted average fair value of options granted to employees in 2002, 2003 and 2004 was $10.65, $13.28 and $19.48 per share, respectively.
The following table summarizes information about stock options outstanding and exercisable at December 31, 2004:
Outstanding Exercisable
Option Price Range Number of Shares
Weighted Average Life in Years
Weighted Average Exercise Price
Number of Shares
Weighted Average Exercise Price
$7.875–$9.125 740,941 1.38 $ 7.92 658,903 $ 7.93$11.35–$16.25 998,925 4.38 $ 14.29 489,600 $ 13.93$17.26–$20.94 433,144 5.52 $ 19.52 164,044 $ 19.05
Note 15—Employee Pension Plan
The Company sponsors for its U.S. employees, a defined contribution plan under Section 401(k) of the Internal Revenue Code. The plan provides that employees may defer up to 15% of their annual compensation, and that the Company will make a matching contribution equal to 50% of each employee’s deferral, up to 5% of the employee’s annual compensa-tion. Company matching contributions, which vest equally over a five year period, totaled $0.3 million, $0.3 million and $0.4 million for 2002, 2003 and 2004, respectively.

2004 Annual Report
61
Note 16—Supplemental Information to Consolidated Statements of Cash Flows
In 2004, 749,005 shares of common stock valued at approximately $14.9 million were issued in connection with the acquisition of Play Along and 25,749 shares of common stock valued at approximately $0.5 million were issued in connection with the 2001 Kidz Biz acquisition (Note 4). Additionally, the Company recognized a $0.7 million tax benefit from the exercise of stock options.
In 2003, the Company issued 100,000 warrants valued at approximately $1.1 million in connection with license costs relating to its investment in the joint venture (Note 12).
In 2002, 1,166,360 shares of common stock valued at approximately $18.1 million and 598,697 options valued at $3.2 million were issued in connection with the acquisition of Toymax (Note 4).
Note 17—Selected Quarterly Financial Data (Unaudited)
Selected unaudited quarterly financial data for the years 2003 and 2004 are summarized below:
2003 2004
(In thousands, except per share data)
First Quarter
Second Quarter
Third Quarter
Fourth Quarter
First Quarter
Second Quarter
Third Quarter
Fourth Quarter
Net sales $ 67,759 $ 73,290 $ 90,308 $ 84,419 $ 73,986 $ 109,395 $ 206,083 $ 184,802Gross profit $ 27,442 $ 27,906 $ 36,226 $ 34,868 $ 30,466 $ 41,281 $ 81,801 $ 72,459Income (loss) from operations $ 5,960 $ 2,522 $ 10,480 $ (7,573) $ 4,885 $ 8,321 $ 29,915 $ 10,604Income before income taxes and minority interest $ 6,299 $ 2,679 $ 10,495 $ (2,138) $ 4,764 $ 7,637 $ 30,042 $ 16,649Net income $ 4,988 $ 2,236 $ 8,248 $ 422 $ 3,791 $ 6,004 $ 23,255 $ 10,508Basic earnings per share $ 0.20 $ 0.09 $ 0.34 $ 0.02 $ 0.15 $ 0.24 $ 0.89 $ 0.40Weighted average shares outstanding 24,430 24,175 24,177 24,304 25,276 25,502 26,167 26,232Diluted earnings per share $ 0.20 $ 0.09 $ 0.28 $ 0.01 $ 0.15 $ 0.22 $ 0.75 $ 0.36Weighted average shares and equivalents outstanding 24,917 25,814 29,529 29,542 30,676 31,123 31,919 31,855
During the second quarter of 2003, the Company recorded a charge which impacted operating income by approximately $2.7 million relating to the recall of one of its products.
During the third quarter of 2003, we recovered $0.7 million of recall costs, recorded in the second quarter of 2003, from one of our factories.
During the fourth quarter of 2003, the Company recorded a non-cash charge of $8.4 million which impacted operating income relating to the grant of restricted stock and a charge of $2.1 million to provision for bad debt impacting operating income relating to the bankruptcy filing of several of its customers, including Kay Bee Toys.
During the fourth quarter of 2004, the Company recorded non-cash charges, which impacted operating income, of $5.6 million relating to the grant of restricted stock and $8.6 million relating to the amortization of short-lived intangible assets acquired in connection with the Play Along acquisition.

JAKKS Pacific, Inc. and Subsidiaries
62
Notes to Consolidated Financial Statements (cont.)December 31, 2004
Note 18—Litigation
On October 19, 2004, the Company was named as defendants in a lawsuit commenced by WWE in the U.S. District Court for the Southern District of New York concerning our toy licenses with WWE and the video game license between WWE and the joint venture company operated by THQ and the Company, encaptioned World Wrestling Entertainment, Inc. v. JAKKS Pacific, Inc., et al., 1:04-CV-08223-KMK (the “WWE Action”). The complaint also named as defendants THQ, the joint venture, certain of the Company’s foreign subsidiaries, Jack Friedman (the Company’s Chairman and Chief Executive Officer), Stephen Berman (the Company’s Chief Operating Officer, President and Secretary and a member of the Company’s Board of Directors), Joel Bennett (the Company’s Chief Financial Officer), Stanley Shenker and Associates, Inc., Bell Licensing, LLC, Stanley Shenker and James Bell.
WWE sought treble, punitive and other damages (including disgorgement of profits) in an undisclosed amount and a declaration that the video game license with the joint venture, which is scheduled to expire in 2009 (subject to joint venture’s right to extend that license for an additional five years), and an amendment to our toy licenses with WWE, which are scheduled to expire in 2009, are void and unenforceable. This action alleged violations by the defendants of the Racketeer Influenced and Corrupt Organization Act (“RICO”) and the anti-bribery provisions of the Robinson-Patman Act, and various claims under state law.
On February 16, 2005, the Company filed a motion to dismiss the WWE Action. On March 30, 2005, the day before WWE’s opposition to the Company’s motion was due, WWE amended its complaint to, among other things, add the Chief Executive Officer of THQ as a defendant and to add a claim under the Sherman Act. On March 31, 2005, the WWE sent a letter to the Court proposing, inter alia, a briefing schedule for defendants’ motions to dismiss the amended complaint.
In November 2004, several purported class action lawsuits were filed in the United States District Court for the Southern District of New York: (1) Garcia v. JAKKS Pacific, Inc. et al., Civil Action No. 04-8807 (filed on November 5, 2004), (2) Jonco Investors, LLC v. JAKKS Pacific, Inc. et al., Civil Action No. 04-9021 (filed on November 16, 2004), (3) Kahn v. JAKKS Pacific, Inc. et al., Civil Action No. 04-8910 (filed on November 10, 2004), (4) Quantum Equities L.L.C. v. JAKKS Pacific, Inc. et al., Civil Action No. 04-8877 (filed on November 9, 2004), and (5) Irvine v. JAKKS Pacific, Inc. et al., Civil Action No. 04-9078 (filed on November 16, 2004) (the “Class Actions”). The complaints in the Class Actions allege that defendants issued positive statements concerning increasing sales of our WWE licensed products which were false and misleading because the WWE licenses had allegedly been obtained through a pattern of commercial bribery, our relationship with the WWE was being negatively impacted by the WWE’s contentions and there was an increased risk that the WWE would either seek modification or nullification of the licensing agreements with us. Plaintiffs also allege that we misleadingly failed to disclose the alleged fact that the WWE licenses were obtained through an unlawful bribery scheme. The plaintiffs in the Class Actions are described as purchasers of our common stock, who purchased from as early as October 26, 1999 to as late as October 19, 2004. The Class Actions seek compensatory and other damages in an undisclosed amount, alleging violations of Section 10(b) of the Securities Exchange Act of 1934 (the “Exchange Act”) and Rule 10b-5 promulgated thereunder by each of the defendants (namely the Company and

2004 Annual Report
63
Messrs. Friedman, Berman and Bennett), and violations of Section 20(a) of the Exchange Act by Messrs. Friedman, Berman and Bennett. On January 25, 2005, the Court consolidated the Class Actions under the caption In re JAKKS Pacific, Inc. Shareholders Class Action Litigation, Civil Action No. 04-8807.
The Company believes that the claims in the WWE Action and the Class Actions are without merit and we intend to defend vigorously against them. However, because these Actions are in their preliminary stages, the Company cannot assure you as to the outcome of the Actions, nor can we estimate the range of our potential losses.
On February 16, 2005, the Company filed a motion to dismiss WWE’s Complaint in the WWE Action. The motion is currently scheduled to be fully briefed on April 14, 2005, with oral argument to be scheduled thereafter.
On December 2, 2004, a shareholder derivative action was filed in the Southern District of New York by Freeport Partner, LLC against the Company, nominally, and against Messrs. Friedman, Berman and Bennett, Freeport Partners v. Friedman, et al., Civil Action No. 04-9441 (the “Derivative Action”). The Derivative Action seeks to hold the individ-ual defendants liable for damages allegedly caused to the Company by their actions and in particular to hold them liable on a contribution theory with respect to any liability the Company incurs in connection with the Class Actions. On or about February 10, 2005, a second shareholder derivative action was filed in the Southern District of New York by David Oppenheim against us, nominally, and against Messrs. Friedman, Berman, Bennett, Blatte, Glick, Miller and Skala, Civil Action 05-2046 (the “Second Derivative Action”). The Second Derivative Action seeks to hold the individual defendants liable for damages allegedly caused to the Company by their actions as a result of alleged breaches of their fiduciary duties. On or about March 16, 2005, a third shareholder derivative action was filed. It is captioned Warr v. Friedman, Berman, Bennett, Blatte, Glick, Miller, Skala, and JAKKS (as a nominal defendant), and it was filed in the Superior Court of California, Los Angeles County (the “Third Derivative Action”). The Third Derivative Action seeks to hold the individual defendants liable for (1) damages allegedly caused to the Company by their alleged breaches of fiduciary duty, abuse of control, gross mismanagement, waste of corporate assets and unjust enrichment; and (2) restitution to the Company of profits, benefits and other compensation obtained by them.
On March 1, 2005, the Company delivered a Notice of Breach of Settlement Agreement and Demand for Indemnification to WWE (the “Notification”). The Notification asserted that WWE’s filing of the WWE Action violated A Covenant Not to Sue contained in a January 15, 2004 Settlement Agreement and General Release (“General Release”) entered into between WWE and the Company and, therefore, that the Company was demanding indemnification, pursuant to the Indemnification provision contained in the General Release, for all losses that the WWE’s actions have caused or will cause to the Company and its officers, including but not limited to any losses sustained by us in connection with the Class Actions. On March 4, 2005, in a letter from its outside counsel, WWE asserted that the General Release does not cover the claims in the WWE Action.
The Company is a party to, and certain of its property is the subject of, various other pending claims and legal proceedings that routinely arise in the ordinary course of its business, but the Company does not believe that any of these claims or proceedings will have a material effect on its business, financial condition or results of operations.

JAKKS Pacific, Inc. and Subsidiaries
64
Allowances are deducted from the assets to which they apply, except for sales returns and allowances.
(In thousands)
Balance at Beginning of Period
Charged to Costs and Expenses
Charged to Other Accounts Deductions
Balance at End
of Period
Year ended December 31, 2002: Allowance for: Uncollectible accounts $ 7,273 $ 2,373 $ — $ 2,865 $ 6,781 Reserve for potential product obsolescence 2,590 4,085 — 1,893 4,782 Reserve for sales returns and allowances 4,953 31,917 7,500(a) 30,790 13,580
$ 14,816 $ 38,375 $ 7,500 $ 35,548 $ 25,143
Year ended December 31, 2003: Allowance for: Uncollectible accounts $ 6,781 $ 2,896 $ — $ 1,800 $ 7,877 Reserve for potential product obsolescence 4,782 4,288 — 4,045 5,025 Reserve for sales returns and allowances 13,580 27,064 — 32,891 7,753
$ 25,143 $ 34,248 $ — $ 38,736 $ 20,655
Year ended December 31, 2004: Allowance for: Uncollectible accounts $ 7,877 $ 2,903 $ — $ 3,722 $ 7,058 Reserve for potential product obsolescence 5,025 5,342 — 2,325 8,042 Reserve for sales returns and allowances 7,753 49,956 — 34,536 23,173
$ 20,655 $ 58,201 $ — $ 40,583 $ 38,273
(a) Obligations assumed in conjunction with the asset acquisitions of Trendmasters and Dragon Ball Franchise.
Schedule II — Valuation and Qualifying AccountsYear Ended December 31, 2002, 2003 and 2004

2004 Annual Report
65
Management’s Annual Report on Internal Control Over Financial Reporting
Our management is responsible for establishing and maintaining adequate internal control over financial reporting. Our internal control system was designed to provide reasonable assurance to management and our board of directors regarding the preparation and fair presentation of published financial statements.
All internal control systems, no matter how well designed, have inherent limitations. Therefore, even those systems determined to be effective can provide only reasonable assurance with respect to financial statement preparation and presentation.
Our management assessed the effectiveness of our internal control over financial reporting as of December 31, 2004. In making this assessment, it used the criteria set forth by the Committee of Sponsoring Organizations of the Treadway Commission (COSO) in Internal Control—Integrated Framework. We believe that, as of December 31, 2004, our internal control over financial reporting is effective based on those criteria.
On June 11, 2004, we completed an asset purchase of Play Along, Inc., PA Distribution, Inc. and Play Along (Hong Kong) Limited, collectively known as “Play Along.” Management’s assessment did not include the internal controls of Play Along, due to the limited time between the purchase date and management’s assessment. Play Along, Inc. contributed $165.5 million in net sales and $32.6 million of net income to our consolidated operations during 2004.
Our independent auditors have issued an attestation report on management’s assessment of our internal control over financial reporting. This report appears on page 66.

JAKKS Pacific, Inc. and Subsidiaries
66
The Board of Directors and Stockholders
JAKKS Pacific, Inc. and Subsidiaries
We have audited the accompanying consolidated balance sheets of JAKKS Pacific, Inc. and Subsidiaries (Company) as of December 31, 2003 and 2004, and the related consolidated statements of operations, other comprehensive income, stockholders’ equity and cash flows and the financial statement schedule for each of the years in the three-year period ended December 31, 2004. We also have audited management’s assessment, included in the accompanying Management’s Annual Report on Internal Control Over Financial Reporting, that the Company maintained effective internal control over financial reporting as of December 31, 2004, based on criteria established in Internal Control—Integrated Framework issued by the Committee of Sponsoring Organizations of the Treadway Commission (COSO). The Company’s management is responsible for these financial statements, for maintaining effective internal control over financial reporting, and for its assessment of the effectiveness of internal control over financial reporting. Our responsibility is to express an opinion on these financial statements, an opinion on management’s assessment, and an opinion on the effectiveness of the Company’s internal control over financial reporting based on our audits.
We conducted our audits in accordance with the standards of the Public Company Accounting Oversight Board (United States). Those standards require that we plan and perform the audits to obtain reasonable assurance about whether the financial statements are free of material misstatement and whether effective internal control over financial reporting was maintained in all material respects. Our audit of the financial statements included examining, on a test basis, evidence supporting the amounts and disclosures in the financial statements, assessing the accounting principles used and significant estimates made by management, and evaluating the overall financial statement presentation. Our audit of internal control over financial reporting included obtaining an understanding of internal control over financial reporting, evaluating management’s assessment, testing and evaluating the design and operating effectiveness of internal control, and performing such other procedures as we considered necessary in the circumstances. We believe that our audits provide a reasonable basis for our opinions.
A company’s internal control over financial reporting is a process designed to provide reasonable assurance regarding the reliability of financial reporting and the preparation of financial statements for external purposes in accordance with generally accepted accounting principles. A company’s internal control over financial reporting includes those policies and procedures that (1) pertain to the maintenance of records that, in reasonable detail, accurately and fairly reflect the transactions and dispositions of the assets of the company; (2) provide reasonable assurance that transactions are recorded as necessary to permit preparation of financial statements in accordance with generally accepted accounting principles, and that receipts and expenditures of the company are being made only in accordance with authorizations of management and directors of the company; and (3) provide reasonable assurance regarding prevention or timely detection of unauthorized acquisition, use, or disposition of the company’s assets that could have a material effect on the financial statements.
Report of Independent Registered Public Accounting Firm

2004 Annual Report
67
Because of its inherent limitations, internal control over financial reporting may not prevent or detect misstatements. Also, projections of any evaluation of effectiveness to future periods are subject to the risk that controls may become inadequate because of changes in conditions, or that the degree of compliance with the policies or procedures may deteriorate.
In our opinion, the consolidated financial statements and schedule referred to above present fairly, in all material respects, the financial position of JAKKS Pacific, Inc. and Subsidiaries as of December 31, 2003 and 2004, and the results of their operations and their cash flows for each of the years in the three-year period ended December 31, 2004 in conformity with accounting principles generally accepted in the United States of America. Also in our opinion, management’s assessment that JAKKS Pacific, Inc. and Subsidiaries maintained effective internal control over financial reporting as of December 31, 2004, is fairly stated, in all material respects, based on criteria established in Internal Control—Integrated Framework issued by the Committee of Sponsoring Organizations of the Treadway Commission (COSO). Furthermore, in our opinion, JAKKS Pacific, Inc. and Subsidiaries maintained, in all material respects, effective internal control over financial reporting as of December 31, 2004, based on criteria established in Internal Control—Integrated Framework issued by the Committee of Sponsoring Organizations of the Treadway Commission (COSO).
In conducting their evaluation of the effectiveness of internal control over financial reporting, management of the Company did not include the internal controls of Play Along, Inc., PA Distribution, Inc. and Play Along (Hong Kong) Limited (collectively “Play Along”) which the Company acquired on June 11, 2004. The acquired entities constituted approximately 26% of total consolidated assets of the Company as of December 31, 2004 and approximately 29% of consolidated net sales and approximately 75% of consolidated net income for the year ended December 31, 2004. Refer to Note 4 to the consolidated financial statements for a further discussion of the acquisitions and their impact on the Company’s consolidated financial statements. Our audit of internal control over financial reporting of the Company also excluded an evaluation of the internal control over financial reporting of Play Along.
PKFCertified Public AccountantsA Professional CorporationLos Angeles, CaliforniaFebruary 21, 2005, except Notes 2, 4 and 18 for which the date is March 29, 2005

JAKKS Pacific, Inc. and Subsidiaries
68
Shareholder Information
Legal CounselFeder, Kaszovitz, Isaacson, Weber, Skala, Bass & Rhine LLP750 Lexington AvenueNew York, NY 10022
Independent AuditorsPKF400 South Hope Street, Suite 710Los Angeles, CA 90017
Investor RelationsIntegrated Corporate Relations, Inc.525 Broadway, Suite 210Santa Monica, CA 90401Tel: 310-395-2215Fax: 310-395-2217
Transfer AgentU.S. Stock Transfer Corp.1745 Gardena Avenue, 2nd FloorGlendale, CA 91204
Stock Exchange ListingCommon stock trading on the Nasdaq National Market System under the symbol “JAKK.” As of May 3, 2005, there were approximately 118 holders of record and approxi-mately 5,800 beneficial owners of the Company’s common
stock. The Company has not paid cash dividends and does not anticipate paying cash dividends in the foreseeable future.
Annual ReportA copy of the Company’s annual report on Form 10-K, as filed with the Securities and Exchange Commission, will be furnished to stockholders and interested investors free of charge upon written request to the Company, Attention: Corporate Secretary, 22619 Pacific Coast High-way, Malibu, CA 90265.
Common Stock Price Data
2003 High Low
First Quarter $ 14.49 $ 9.50Second Quarter $ 14.49 $ 10.22Third Quarter $ 14.04 $ 10.05Fourth Quarter $ 13.77 $ 11.74
2004
First Quarter $ 16.25 $ 12.72Second Quarter $ 21.00 $ 14.48Third Quarter $ 23.22 $ 18.71Fourth Quarter $ 25.55 $ 12.75
2005
First Quarter $ 23.96 $ 17.25
Products mentioned in this report are covered by the following trademarks:JAKKS Pacific®, Child Guidance®, Flying Colors®, Pentech®, Road Champs®, Go Fly a Kite®, Fly Wheels™, Funnoodle®, Color Workshop™, Play Along®, Laser Challenge™, Ultra Colors®, Fireworks®, Focus®, Syntech™, BloPens®, Vivid Velvet®, ROC Writers™, TV Games™, NRG Paintball ™, Storm®, Creepy Crawlers®, and Air Creations® are trademarks of either JAKKS Pacific, Inc. or its subsidiaries.
The following trademarks are used by JAKKS Pacific, Inc. and/or its subsidiaries under license: Nickelodeon®, Gak Splat™, Goooze®, Blue’s Clues®, Dora the Explorer™, Nicktivities®, SpongeBob SquarePants™, and all related titles, logos, and characters are trademarks of Viacom International Inc.; Hello Kitty® is a trademark of Sanrio Co., Ltd.; Finding Nemo™ is a trademark of The Walt Disney Company Limited; Winnie the Pooh characters are trademarks of Disney Enterprises; World Wrestling Entertainment™, its logos and all character likenesses are trademarks of World Wrestling Entertainment, Inc.; THQ® and logo are trademarks of THQ Inc.; Nintendo GameCube™ and Nintendo Game Boy Advance™ and logos are trademarks of Nintendo of America, Inc.; PlayStation 2™ and the PlayStation® logos are trademarks of Sony Corporation of America; Xbox™ is a trademark of Microsoft Corporation; Activision® is a trademark of Activision, Inc.; Atari® is a trademark of Atari Interactive, Inc.; Namco®, Pac-Man®, Ms. Pac-Man® and Galaga® are trademarks of Namco Hometek, Inc.; Dragon Ball ®, Dragon Ball GT ™, and Dragon Ball Z® are trademarks of FUNimation Productions, Ltd.; Cabbage Patch Kids® is a trademark of Original Appalachian Artworks, Inc.; World Poker Tour® is a trademark of World Poker Tour, LLC; Capcom® is a trademark of Capcom Co., Ltd.; Care Bears™ is a trademark of Those Characters From Cleveland, Inc.; Star Wars® is a trademark of Lucasfilm Ltd.; Marvel ®, Spiderman® and the distinc-tive likenesses thereof are trademarks of Marvel Characters, Inc.; Batman® and Justice League of America® are trademarks of DC Comics; Shrek 2™ is a trademark of DreamWorks LLC; Teletubbies® is a trademark of Ragdoll, Inc.; Midway® is a trademark of Midway Games, Inc.; Ford Mustang® is a trademark of Ford Motor Company Corporation; EA Sports® is a trademark of Electronic Arts, Inc.; Wheel of Fortune® is a trademark of Califon Productions, Inc.; Jeopardy!® is a trademark of Jeopardy Productions, Inc.; Family Feud® is a trademark of Mark Goodson Productions, LLC; Price is Right® is a trademark of FremantleMedia Operations B.V. All Rights Reserved in the foregoing words by their respective owners.
All other product names and associated designs mentioned or shown in this annual report are trademarks and copyrighted properties of their respective owners.© 2005 JAKKS Pacific, Inc.

Executive Management
de
sig
ned
by
curr
an &
co
nno
rs, i
nc. /
ww
w.c
urra
n-c
onn
ors
.co
m
Board of DirectorsJack FriedmanChairmanChief Executive OfficerJAKKS Pacific, Inc.
Stephen G. BermanPresident and SecretaryChief Operating OfficerJAKKS Pacific, Inc.
Dan AlmagorChairmanACG Inc.
David C. BlatteManaging DirectorCentre Partners Management LLP
Robert E. GlickApparel Manufacturing Executive
Michael G. MillerAdvertising Executive
Murray L. SkalaPartnerFeder, Kaszovitz, Isaacson, Weber, Skala, Bass & Rhine LLP
Corporate OfficersJack FriedmanChief Executive Officer
Stephen G. BermanPresidentChief Operating Officer
Joel M. BennettExecutive Vice PresidentChief Financial Officer
Senior Executive TeamMichael BernsteinSenior Vice President, Marketing—Boys Action
Jim ChristiansonSenior Vice President, Sales—Go Fly A Kite
Mike DwyerVice President, General Counsel— JAKKS Pacific
Charlie EmbyCo-President, Play Along
Jay ForemanCo-President, Play Along
Larry GellerSenior Vice President, General Counsel— Play Along
Wills HonManaging Director, Asia
David JohnstonSenior Vice President, National Accounts
Bruce KatzSenior Vice President, Sales
Irene LiManaging Director, Play Along Hong Kong
Jack McGrathSenior Vice President, Operations
Ken PriceSenior Vice President, Sales
Jennifer RichmondSenior Vice President, Licensing and Media
Carmine RussoSenior Vice President, International Sales
J.R. ShatleySenior Vice President, Sales—Play Along
Tamre SutphenSenior Vice President, Marketing and Sales—Girls Toys and Activities
Rick WatkinsSenior Vice President, Product Development—Play Along
Corporate OfficesCorporate Headquarters22619 Pacific Coast Highway Suite 250Malibu, CA 90265Tel: 310-456-7799Fax: 310-317-8527
New York Sales Office and Showroom200 Fifth Avenue, Suite 634 and Suite 1434New York, NY 10010Tel: 212-929-9222Fax: 212-929-9278
JAKKS Distribution Center Warehouse21558 Ferrero ParkwayWalnut, CA 91789Tel: 909-594-1379Fax: 909-594-2179
Hong Kong HeadquartersNew World Centre,Room 718,20 Salisbury Road,Tsimshatsui,Kowloon, Hong KongTel: 852-2-311-1386Fax: 852-2-366-8247
Go Fly A KiteBox AA, Route 151East Haddam, CT 06423Tel: 800-243-3370Fax: 860-873-8724
Play Along800 Fairway Drive, Suite 295Deerfield Beach, FL 33441Tel: 954-596-2210Fax: 954-596-8710
Play Along Hong Kong10F, Blk B. Chung Mei CentreNo. 15 Hing Yip StreetKwun Tong, Kowloon, Hong KongTel: 852-2-797-8844Fax: 852-2-797-2468
2004 Annual Report

22619 Pacific Coast Highway, Suite 250Malibu, California 90265
T: 310-456-7799 F: 310-317-8527
www.jakkspacific.com
20
04
An
nu
al Rep
ort
JAK
KS P
acific, Inc.
Som
ethin
g for Every
one.