Society of Extension Education, Anand (Gujarat)
72
Transcript of Society of Extension Education, Anand (Gujarat)

Society of Extension Education, Anand (Gujarat) Executive Council
(Reg. No. GUj. 737/ Kheda & F/ 478/ Kheda/ 1990)
1. Dr. B. T. Patel, President 2. Shri P. K. Patel, Vice President Director of Extension Education Sr. Area Manager, GAU, Ahmedabad-380 004 Area Office, KRIBHCO, Vadodara
3. Dr. K. F. Patel, Secretary-cum-Treasurer 4. Dr. H. U. Vyas, Joint Secretary Asso. Dir. of Extension Education, Agri. Officer,A.D.E.E.(Zone) Office, GAU, Anand -388 110 G.A.U., Anand -388 110
5. Dr. Ashok A. Patel, Chief Editor 6. Dr. A. O. Kher, Member Asso. Prof., Cyber Extension Cell, Asso. Dir. of Extension Education, DEE., GAU, Gandhinagar - 382 030 Junagadh - 362 001
7. Dr. R. B. Patel, Member 8: Dr. M. C. Soni, Member Prof. of Extension Education, Asso. Dir. of Extension Education, GAU, Navsari - 396450 GAU, S.K.Nagar.385 506
9. Dr. M. S. Trivedi, Member 10. Dr. B. R. Karkar, Member Asso. Extension Educationist, EEl, Asst. Extension Educationist, GAU, Anand- 388 110 SSK, GAU, Junagadh - 362 001
11. Dr. M. R. Prajapati, Member 12. Dr. P. R. Kanani, Member Asso. Prof., Ext. Edu. Deptt, Asst. Prof., Ext. Edu. Deptt., c.P. College of Agri., GAU, College of Agri. GAU, S.K.Nagar - 385 506 Junagadh-362 001
Editorial Board
1. Dr. Ashok A. Patel, Chief Editor Asso. Prof., Cyber Extension Cell, DEE., GAU, Gandhinagar - 382 030 I
/ 2. Dr. M. S. Trivedi, Asso. Editor 3. Dr. B. R. Karkar, Asso. Editor
Asso. Extension Educationist, EEl, Asst. Extension Educationist, GAU,Anand- 388 110 SSK, GAU, Junagadh - 362 001
4. Dr. M. R. Prajapati, Asso. Editor 5. Dr. G. R. Patel, Asso. Editor Asso. Prof., Ext. Edu. Deptt, Asst. Extension Educationist, c.P. College of Agri., GAU, A.D.E.E. (Zone) Office, GAU, S.K. Nagar - 385 506 Navsari - 396 450

From editor's desk .
Seventy-five per cent of the world's poor live in rural areas. Only a half century ago, farmer was not governed by many external forces as he is today. Technological development in agriculture and market oriented farming made the farmer dependent on many external players like information of technology and market; inputs and technological advancement; new skills; packaging, transportation and marketing of produce; etc. Reducing knowledge gap and increasing knowledge-sharing for farmers is an essential first step for increasing productivity and boosting growth in rural areas.
Empowering farmers with relevant, timely information about different crop varieties, including details about their ability to withstand a-biotic stresses like drought, salinity, nutrient deficient growing conditions, water logging, etc., as well as biotic stresses like pests and diseases can significantly reduce farming risks.
The forthcoming era will be an information era. The new FM radio; of course presently not concentrating on agriculture; would prove to be an effective local mass media. Private TV channels have started telecasting agricultural information even in regional language. The Doordarshan is also planning to put 1200 LPTs in the country which will have'a small coverage area of a radious of 60 kms. and that will also serve to be a locale specific mass media.
New information communication technologies (ICT) including GIS can help such information available more widely in rural areas in user friendly manner through various models of information dissemination. More and more web sites are now focusing agri .. culture. Human Development Report 2001 noted that internet use is growing exponentially, from 16 million users in 1995 to more than 400 million users in 2000. Use of computer and multimedia is also increasing day by day.
Those engaged in agriculture development shall utilize all these sources of information transmission so as to take latest information to the ultimate users in time. The extension researchers shall also concentrate on such areas whereby they can suggest the more efficient use of such media.
In the present issue, 10 research papers and 9 research notes have been included. Only a few contributors have sent their E-mail addresses and I am still waiting for response from others. Further, all those who have sent only paper copy of their articles are requested to send a soft copy of their article (either in floppy or by email). As committed in last issue, this volume has been turned out as targeted. With the kind cooperation of all the members and the contributors, the next issue of the journal will be published regularly.
Prof. Ashok Patel, Ph. D., Date: December 12,2002 Chief Editor

FOURTH EXECUTIVE COUNCIL (from 1-5-2001 onwards)
t Dr. B. T. Patel
President Shri P. K. Patel Vice-President
DR. K. F. Patel SecretarylTreasurer
Dr. H. U. Vyas Joint Secretary
Dr. Ashok A. Patel Chief-Editor
Dr. A. O. Kher Member
Dr. R. B. Patel Member
Dr. M. C. Soni Member
Dr. M. S. Trivedi Member

Dr. M. R. Prajapati Member
;'Jj/., .t. .,
Dr. P. R. Kanani Member
Dr. B. R. Karkar Member
Dr. Ashok A. Patel DR. M. R. Prajapati Chief-Editor Asso. Editor
Dr. M. S. Trivedi Asso. Editor
Dr. G. R. Patel Asso. Editor
Dr. B. R. Karkar Asso. Editor

Society of Extension Education, Anand Gujarat
". -'. -.- ..
HAPPY TO ANNOUNCE
SHRI KHUSHALBHAI REVABHAI PATEL MEDAL -CUM -CASH PRIZE
FROM: APRIL -1992
For the students of B. Se. (Agri.) ofGAU
For Details Contact:
SECRETARY-CUM-TREASURER, SOCIETY OF EXTENSION EDUCATION, GUJARAT
OFFICE OF ASSOCIATE DIRECTOR OF EXTENSION EDUCATION, GUJARAT AGRICULTURAL UNIVERSITY,
ANAND CAMPUS, ANAND -388 110 INDIA

Gujarat Journal of Extension Education
Vol. XII & XIII December 2001 & 2002
CONTENTS
1. Effectiveness of Multimedia in Educational System 1 - Ashok A. Patefl and D. D. PateP
2. Socio-economic Impact of Social Forestry in 6 .--- Tribal Area of Rajasthan
- M. C. Chaudhary and N. K. Panjabi
3. Evaluation of Master Trainers' Training Course 10 - S. K. Maharana , N. R. Patel and S. R. Patel
4. Constraints in Fertilizer Utilization by the Farmers of 14 Udaipur District of Rajasthan
- Purnesh Mathur, P. N. Kalla and F. L. Sharma
5. Correlates of Knowledge of Sugarcane Production Technology 18 - M. M. Patel, R. S. Khatediya and Amit Chatterjee
6. Sway of Selected Factors on Entrepreneurial Behaviour of 22 Dairy Women
- A. B. Mundhwa , K. A. Thakkar and A. S. Sheikh
7. Association of Personality Traits of Poultry Entrepreneurs 26 with their Management Orientation
- N. B. Chauhan, b. S. D. Siddhartha and J. G. Patel
8. Farmers' Characteristics Influencing their Knowledge and 29 Adoption of Lily Cultivation
- Meena Trivedi and J. C. Trivedi
9. Corollary of Cultivators' Managerial Ability on Adoption of 32 Plant Protection Technology of Chilli
- Ashok A. Patel and R. K. Patel
10. Variables Influencing Tribal Leaders' Knowledge and 35 Adoption Gap for Improved Paddy Cultivation Technologies
- J. D. Sarkar, P. K. Sangode and K. K. Shrivastava

RESEARCH NOTES:
1. Extent of Knowledge and Attitude of Dairy Farmers towards AI in Milch Animals .
- G. K. Temkar and N. B. Chauhan
39
2. An Analysis of Agricultural Exhibition - B. N. Kalsariya, B. R. Karkar and N. D. Bharad
42
3. A Critical Study of Community Gobar Gas Plant, Methan - V. T. Patel, M. R. Prajapati, M. C. Soni and N. V. Chaudhary
45
4~ Correlates of Modernization of Farmers - M. R. Prajapati and D. L. Jadhao
48
5. Adoption of Watershed Management Technology by Farmers - R. C. Patel A. S. Saiyad and N. B. Chauhan
50
6. Constraints in Adoption of Well Recharging Practice - D. M. Thakrar and A. O. Kher
54
7. Constraints Experienced by Growers in Adoption of Recommended Chilli Technology
- M. R. Prajapati, V. T. Patel, N. V. Chaudhary and M. C. Soni
56
8. Daily Work Schedole of Rural Women ofJunagadh District - M. K. Bariya and K. A. Thakkar
59

1 GUj. J. Extn. Edu. XII & XIII 2001 & 2002
EFFECTIVENESS OF MULTIMEDIA IN EDUCATIONAL SYSTEM
Ashok A. PateP and D. D. PateP
ABSTRACT
Assessment of impact is generally regarded as an essential part of any project and is equally applicable to agricultural information and communication of new technologies. The effectiveness of multimedia of paddy cJ/tivation in education system has been measured. There was a substantial net gain in knowledge for seedling rising of paddy crop of the students of selected agricultural diploma schools on viewing the multimedia. The results reflected that the knowledge level before viewing the multimedia was correlated with some of the personal characteristics of the students; while no such correlation was observed after viewing the multimedia. This it self express the effectiveness of the multimedia.
INTRODUCTION population on whom such an audiovisual
The rural sector is confronted by a period medium would have profound impact, but of rapid change. Technological advances, also to the students in educational system. corporate restructuring and altered It conveys flavors of reality as it can community expectations are just some of produce an event with its. sound and the challenges faced. To help ensure motions simultaneously with the actual success in these uncertain times, effective occurrence. It has an added advantage communications of useful technologies are to be demand driven as well as can be essential for the farmers. Communication used at the convenience of the user.
is the very essence of all institutions, basic 1. To measure the knowledge level for to the society. The group, the community, seedling rising of paddy crop of the the nation, even the cultivator exist only students of selected agricultural by virtue of good means of communication. diploma schools.
For development of any sector of the 2. To assess the change in the knowledge society, use of new technologies is a level before and after viewing the primary factor and the communication multimedia. media provides necessary tool for carrying 3. To find out the relationship between the technolbgies up to the ultimate users. selected personal characteristics of the In the 21't century, among all the means respondents with their knowledge level. of mass communication multimedia is one
RESEARCH METHODOLOGYof the most versatile audiovisual medium of communication (Brun, 2001). It is an The GAU run the course of agricultural ideal mean to convey information not only diploma through 14 agricultural schools in to the huge illiterate segment of the Gujarat State. Out of these four schools
1 Associate Director of Extension Education, Cyber Extension Cell. GAU, Gandhinagar 2 Technical Officer, Directorate of Extension Education, GAU, Ahmedabad

2
i.e. Anand, Chharodi, Dahod andVadodara are in Anand zone of GAU. Two schools of
. Anand zone of GAU; namely Vadodara and Anand were selected purposively for the purpose of this study since computer facility was available only at the two schools.
The students studying in the second year of diploma course, who have already studied the course of paddy crop during
their educational syllabus, were selected. The total numbers of respondents selected from the two schools were 66.
To collect information regarding knowledge level of students regarding paddy seedling rising; an interview schedule was prepared in Gujarati. Questions and statements on every aspect under study were framed with maximum accuracy, clarity and objectivity.
The respondents were interviewed in the class room settings. The interview schedule was supplied to the respondents and sufficient time was given to fill it up.They
were then allowed to view the seedling raising part of the multimedia CD on paddy. After six hours of viewing the CD, data for part II of the schedule was again retrieve to measure the level of knowledge after viewing the multimedia.
The scoring was done on the basis of the
Effectiveness of Multimedia
procedure prescribed by Jha & Singh (1970). One score was given to correct response, while zero score was given to incorrect answer. The data were analyzed by using mean, standard deviation, percent and paired 't' test. The co-efficient of correlation 'r' was used to find out the relationshtp of selected personal characteristics with the knowledge level of the respondents.
RESULTS AND DISCUSSION
LEVEL OF KNOWLEDGE
The level of knowledge of the respondents regarding seedling raising of paddy crop was measured twice, i.e. before viewing the multimedia and after six hours of viewing the multimedia. All the scores were taken in to consideration and on the basis of mean and standard deviation; the
respondents were classified in to three groups of low, medium and high level of knowledge. The data in this regard are presented in Table 1.
It is obvious from the data that there was no respondent in high score group before viewing the multimedia. Almost 30 per cent possessed low level of knowledge, whereas the remaining possessed medium level of knowledge. Whi Ie after viewing the
multimedia, there was not a single student
Table 1: Distribution of respondents on the basis of knowledge level before and after viewing the multimedia
Level of knowledge Before viewing After viewing No. of Percent No. of Percent
respondents respondents
Low (less than 5) 20 30.30 o 0.00
Medium (5 to 23) 46 69.70 40 60.60
High (24 to 40) o 0.00 26 39.40
Total 66 100.00 66 100.00

3 Effectiveness of Multimedia
Table 2: Distribution of respondents according to increase in knowledge due to exposure of multimedia
Increase in knowledge No. of respondents Per cent
Low (up to 27 per cent) 11 16.67
Medium (28 to 65 per cent) 43 65.15
High (above 65 per cent) 12 18.18
Total 66 100.00
having low level of knowledge whereas almost 40 per cent possessed high level of knowledge. This clearly indicates high impact of the multimedia in getting knowledge. The results are in line with those of Patel, 1996; that in class room teaching, the combination of different teaching methods has significant impact on gain in knowledge. Similar results were observed by Thakur, 1996 and Madan, 1996 even in non-class room settings.
Those respondents who had medium gain in knowledge by viewing the multimedia (28 to 65 per cent increase in knowledge) were 65 per cent. While almost 18 per cent respondents could gain more than 65 per cent in their level of knowledge by viewing the multimedia. The results are quite encouraging and one could conclude that the multimedia can play an important role in gaining knowledge.
Further, it was also tried to calculate the
Table 3: Extent of increase in knowledge due to exposure of multimedia
Time of Test Level of knowledge
Pre-test i.e. knowledge level before viewing the multimedia 6.9091
Post test i.e. knowledge level after viewing the multimedia 22.2576
't' value 18.5563** ** Significant at 0.01 level of probability
GAIN IN KNOWLEDGE
To assess the gain in knowledge, the data of individual respondents for level of knowledge before and after viewing the multimedia were analyzed. Net increase in knowledge was calculated for each respondent. They were then classified as low, medium and high gain in knowledge. The data in this regards are presented in Table 2, which clearly indicated that only 17 per cent respondents had low gain in knowledge (increase in knowledge up to 27 per cent).
significance of difference in level of knowledge before and after viewing the multimedia by app'1ying paired 't' test. The data in Table 3 clearly indicated that there is highly significant increase in the level of knowledge of the respondents as a result of viewing the multimedia.
RELATIONSHIP BETWEEN INDEPENDENT
AND DEPENDENT VARIABLES
The correlation of the selected independent variables with knowledge level of the

4 Effectiveness of Multimedia
Table 4: Relationship of independent variables with knowledge level of respondents before and after viewing the multimedia
Sr. No. Independent variables Correlation co-efficient Cr) Before viewing After viewing
multimedia multimedia
1 Age
2. Caste
3. RuraVUrban background
4. Percentage in SSC examination
5. Agriculture subje<;ts in secondary school
6. Type of family
7. Participation in extra curriculum activities
8. Land holding of the family
9. Occupation of the father
10. Farming experience
11. Growing paddy crop at home
12. Educational status of the family
13. Reading habit
* Significant at 0.05 level of probability
respondents regarding seedling raising of paddy crop was measured for both the conditions i.e. before and after viewing the multimedia. In order to study the simple relationship between these independent and dependent variables, the zero order co-relation co-efficient was computed for each independent variable. The values of co-relation co-efficient (r) were then tested for their statistical significance.
It is apparent from the Table 4 that the coefficient of co-relation value of three independent variables (caste, type of family and reading habit) were found significantly correlated with the knowledge level of raising of seedling before viewing the multimedia. This shows that before viewing the multimedia, the caste, the type of family and reading habit influenced the level of knowledge. .
- 0.13292 - 0.11258
0.27764 * 0.14822
- 0.04873 - 0.09114
- 0.12298 0.02539
0.05283 0.05878
0.24505 * - 0.05201
·0.19956 0.00952
- 0.00211 0.20289
- 0.14302 0.03901
- 0.07212 0.07792
0.01898 - 0.08909
- 0.10188 0.01550
0.31177 * 0.02644
Contrarily, none of the personal characteristics were found to be correlated with the level of knowledge of the respondents after viewing the multimedia. This implies that the multimedia viewing eliminates impact of personal characteristics of the respondents on their level of knowledge.
This pose for great opportunity for using multimedia in educational system so that the barriers like caste, type of family and even like reading habit can be eradicated and the knowledge of the students can be escalated by using multimedia in educational system.
CONCLUSION
It can be concluded that there was no respondent in high score group before

5 Effectiveness of Multimedia
viewing the multimedia. While after viewing the multimedia, there was not a single student having low level of knowledge. Majority of students possessed medium level of knowledge regarding the paddy crop with special reference to seedling raising. Majority of the respondents had medium gain in knowledge by viewing the multimedia.
Variables like caste, family type and reading habit were positive correlation with knowledge level before viewing the multimedia. Contrarily, after viewing the multimedia, not a single independent variable was found to be correlated with knowledge level of the respondents.
It could be concluded that not only that the viewing of the multimedia has increased the level of knowledge of the students but also that it eliminates the impact of personal characteristics on knowledge gain, thus provides a common learning platform for all the students.
REFERENCE
Brun, C and Mangstl, A. 2001. Worldwide access to ICT: ~he digital divide in Villages in the future: 'Crops, jobs and livelihood edited by D Virchow and J von Braun (Springer- Verlag, Berlin): 259-262.
Jha, P. N. and Singh, K. N. 1970. A test to measure farmers' knowledge about high yielding variety programme. Interdiscipline VII (I): 65-67.
Madan, Asha, Verma, Shashi Kanta and Jain, Vinita 1996. Impact of educational media to promote soakage pit in rural Haryana. GUjarat Journal of Extension Education VI & VII: 44-50.
Patel, R. B. 1996. Effective teaching methods for under graduate and postgraduate level of education. GUjarat Journal of Extension Education VI & VII: 197-199.
Thakur, Sonia, Verma, Shashi Kanta and Verma, S. K. 1996. Impact of media on indigenous post-harvest technology in Haryana. Gujarat Journal of Extension Education VI & VII: 51-55.

6 Guj. J. Extn. Edu. XII & XIII 2001 & 2002
SOCIO-ECONOMIC IMPACT OF SOCIAL FORESTRY IN
TRIBAL AREA OF RAJASTHAN
M. C. Chaudharyl and N. K. PanjabP
ABSTRACT
The forestry has a definite impact on environment. To extend these benefits to rural areas and also to share the socio-economic benefits with them, social forestry programme has been started. The present research was intended to study the socio-economic benefits derived by the beneficiaries on account of their involvement in social forestry programme. The majority of respondents received medium social as well as economic benefit through social forestry. The respondents also felt that as a result of social forestry, their interest towards community development has been aroused. The fodder requirement of the respondents was also fulfilled due to the programme.
INTRODUCTION the beneficiaries on account of their involvement in social forestry programme. In the state of Rajasthan, social forestry
programme begun in the sixth five year METHODOLOGY plan period. The overall expenditures on
The study was undertaken in threedevelopment of social forestry during the districts of Southern Rajasthan, selected plan amounted to Rs. 250 million. 'A large purposely, namely Banswara, Dungarpursum of this money was received from World and Udaipur. Two panchayat samities from Bank. Social forestry programme aimed at each district were selected on the basisassuring the peoples' participation in of maximum area covered under plantation developing forests by their cooperation and by the forest department. Thus, theactive support. investigation was carried out in six tribal
The foremost benefit of the social forestry panchayat samities. Two Villages from is the favorable impact on environment each identified panchayat samiti were and on the quality of life of people. It is chosen, also on the basis of maximum area
. also imperative for improving the socio covered under social forestry plantation economic conditions of downtrodden by the forest department. Accordingly, in sections of society. No other measure all, 12 villages were chosen for the present would be so effective and important, for investigation. the poor farmers to develop them To select the respondents, a economically and socially. Social fotestry . comprehensive list of all those can achieve a spectacular success by beneficiaries (tribal and non-tribal) who involvement of the Villagers in the were actively involved in forestry activities programme. An effort was made to study was prepared with help of local forest the socia-economic benefits derived by 1 Ph. D. Scholar, Department of Extension Education, MPUAT, Udaipur 2 Associate Professor, Department of Extension Education, MPUAT, Udaipur

7 Socio-economic Impact of Social Forestry
Table 1: Distribution of respondents on the basis of socio-econOmic benefits derived through social forestry
Types of benefits Tribal Non-tribal Pooled Score (in relative term) .F 0/0 F 0/0 F 0/0
a) Social benefits Low 28 23.33
Medium 83 69.17
High 9 7.50
Total 20 100.00
(b) Economic benefits Low 35 29.17
Medium 69 57.50
High 16 13.33
Total 20 100.00
F = frequency 0/0 = per cent
officials and sarpanchas of the respective gram panchayat. As many as 20 respondents (i.e. 10 tribal and 10 nontribal farmers from each chosen village) were selected randomly from each identified villages. Thus, the study sample consists of total 240 respondents. The data were collected by employing personal interview technique with help of specially designed questionnaire.
RESULTS AND DISCUSSION
SOCIO-ECONOMIC BENEFITS
To get an overview of socio-economic benefits derived by the respondents, they were categorized into three socioeconomic group viz., low, medium and high. These groups were formed on the basis of calculated mean score and S.D. of the overall score obtained by the respondents; separately for both social as well as economic benefits. The results are depicted in Table 1.
Respondents in general, received social benefits from social forestry as evident from the data in Table 1. It was noted that three-fourth of respondents (75%)
11
97
12
9.17
80.83
10.00
39
180
21
16.25
75.00
8.75
120 100.00 240 100.00
27
71
22
22.50
59.17
18.33
62
140
38
25.83
58.33
15.83
120 100.00 240 100.00
fell in the medium social benefit group. Whereas remaining one-fourth of the respondents (25%) were distributed in high and low social benefit groups.
A perusal of data in Table 1 reveals that more than half of the respondents (58.33%) fell in the group of medium economic benefit. The remaining one-sixth of them could be placed in high economic benefit group. The number of respondents reported in the group of low economic benefit was found to be 25.83 per cent.
SOCIAL BENEFITS
It can be observed from the data in Table 2 that the social benefit 'aroused interest towards community development' was ranked first as expressed by both the category of respondents. The respondents have reported that their social prestige among the community members is increased on account of participation in social forestry. likeWise, their opinion/ suggestions were given due weightage by the community members after their involvement in the pr:ogramme.

8 Socio-economic Impact of Social Forestry
Table 2: Social benefits derived by the respondents through social forestry
Improved Practices Tribal Non-tribal Total
(120) (120) (240)
MS Rank MS Rank MS Rank 1. Earned social prestige 2.21 II 2.03 III 2.12 II
2. Opinion were given due weightage 1.90 III 2.29 II 2.09 III by the community members
3. Registered as member of various 1.61 IV 1.43 VI 1.52 V agencies / institutions
4. Aroused interest towards community 2.39 I 2.53 I 2.46 development work
5. Increased interaction with various 1.41 V 1.77 IV 1.59 IV agencies and organizations
6. Realized the need and importance of 1.23 VI 1.55 V 1.39 VI education
Rank correlation co-efficient (rs) = 0.78 NS MS = Mean Score NS = Non-significant
ECONOMIC BENEFITSThe rank correlation coefficient value (rs )
of the ranks accorded to the response of It is interesting to note (Table 3) that tribal and non-tribal respondents was social forestry has been able to cater to found to be 0.78. This value was the domestic demands of rural communities statistically non-significant. It infers that in the villages of study area. The important there is no variation in the social benefits economic benefits perceived by the tribal derived by tribal and non-tribal and non tribal respondents were 'fulfillment respondents in the study area. of demand of fodder for livestock' and
'increase in income'.
Table 3: Economic benefits derived by the respondents through social forestry
Benifits derived Tribal (120) Non-tribal (120) To
tal (240)
MS Rank MS Rank MS Rank
1. Employment generated through social 2.49 I 2.27 II 2.38 II forestry have increased the family income
2. Demand of fodder for livestock was 2.28 II 2.49 I 2.39 fulfilled from the social forestry
3. The by-products obtained. from social 1.67 IV 1.55 V 1.61 V forestry i.e. honey, gum, plants of medicinal valu'e, etc. have catered the need of family
4. Timber wood for domestic purposes 1.33 VI 1.43 VI 1.38 VI was obtained from social forestry
5. Money, time and energy being spent for 1.85 III 1.97 III 1.91 III procurement of fodder during long dry spell from distant places was saved
6. Sufficient fire-wood for domestic use 1.50 V 1. 75 IV 1.63 IV was obtained form social forestry
Rank correlation co-efficient (rl5) = 0.89 * MS = Mean Score * = Significant at 5 per cent level of probability

9 Socio-economic Impact of Social Forestry
Table 4: Analysis of difference in the respondents due to locale about socioeconomic benefits
Indicator Social Benefit Economic Benefit
Mean Score Banswara 3.87 3.87
Dungarpur 3.71 3.67 Udaipur 3.59 3.75
'F'Value 5.30 ** 2.47 NS CD 0.498 0.534 CV 4.81 5.13 Sem 0.180 0.193
**=Significant at 1 per cent level of probability
Further analyses of the data indicate that the value of rank correlation coefficient between tribal and non-tribal respondents was found to be 0.89, which is statistically significant at 5 per cent level of probability. This leads to an inference that the tribal and non-tribal respondents differed significantly in deriving economic benefits from social forestry.
DIFFERENCE IN RESPONSE DUE TO
LOCALE
It has been also tried to analyze whether the respondents of different districts perceived the benefits of social forestry in the same manner or not. The data are presented in Table 4.
The statistically significant value of calculated 'F' for social benefits signify that there exists a notable difference in the opinion of the respondents of different districts. The mean score of different districts show that the respondents of Banswara perceived the highest sodal benefits received from social forestry,;;
I .".
programme. .
The calculated 'F' value was not significant for economic benefits derived by them through social forestry programme. This indicates that there was no variation
NS = Non-significant
between the respondents of selected districts. This may be due to the equitable distribution of short term benefits of the social forestry programme.
CONCLUSION
It can be concluded that the majority of respondents received medium social as well as economic benefit through social forestry.
The tribal and non-tribal beneficiaries have shown their inclination towards community development as the main social benefit. SImilarly, employment generation was perceived as firstranked economic benefit by the tribal beneficiaries; where as fulfillment ofdemand of fodder for livestod was reported as a first ranked economic benefit by the non-tribal respondents in the study area.
There was a significant variation between the respondents of selected districts about the social benefits derived through social forestry. A non-significant variation was observed between the respondents of selected districts about economic benefits derived by them through social forestry programme.

10 Guj. J. Extn. Edu. XII & XIII 2001 & 2002
EVALUATION OF MASTER TRAINERS' TRAINING COURSE
s. K. Maharana1 , N. R. PateF and s. R. PateP
ABSTRACT
A series of specialized courses on advance training methods for the scientists/ teachers ofSAUs who act as master trainers in technology transfer programmes was conducted by EEl, Anand. An effort has been made to evaluate the trainings. The results of the study depict that majority of the master trainers possessed medium level of knowledge and also using training methodology to a medium extent. These were found to be influenced by their job involvement, extension role perception and attitude towards bi-monthly workshop. Concurrently, the extent of use of information sources and job satisfaction were also found to influence their extent of use of training methodology.
tINTRODUCTION Agriculture Extension (1992) indicated that
Training is a powerful means to catalyses monthly workshop had become routine
human resource development. Significance work with little flow of location 'specific
of training has been well established in technology (Anonymous, 1992).
the field of agriculture. For training to be After 1992, looking to the needs of GAU, productive, training programmes should be the Extension Education Institute, Anand well planned, well managed and appropriate conducted specialized courses on advance training methodology be used which in turn training methods for the scientists/ require competent trainers. In training and teachers of SAUs who act as master visit system, scientists of the state trainers in technology transfer programmes. agricultural universities (SAUs) impart To determine how far such training has training to the subject matter specialists helped master trainers in their training who in turn train AEOs and VEWs. These endeavor, the present investigation was scientists cum master trainers are engaged aimed with the following specific in research or teaching work. As a master objectives: trainer one must have sufficient knowledge 1. To know the level of knowledge of the and skill in training methodology without master trainers regarding training which the training effort will be a failure. methodology. In this context, Gupta and Patel (1991 2. To study the extent of use of training92) rightly observed that master trainers methodology by the· master trainers of Gujarat Agricultural University (GAU) while giving training.should be trained in proper use of audio
3. To find out the relationship between visual aids in order to communicate
independent variables and the level of message effectively to SMSs. Moreover
knowledge of master trainers regarding the agenda notes of National Seminar on
training methodology. 1 Ex. P. G~ Student, B. A. College of Agriculture, G.A.U., Anand 2 . Associate Extension Educationist, EEl, G.A.U., Anand 3 Agriculture Officer, EEl, G.A.U., Anand

11 Evaluation of Master Trainers' Training
Table 1: Distribution of the master trainers according to their level of knowledge regarding training methodology N=120
Category Score range No Per cent
Low Below 68-10 17 14.17
Medium 68.10- 94.38 91 75.83
High Above 94-38 12 10.00
Total 120 100.00
Mean = 81.24 5.0. = 13.14
4. To find out the relationship between structured questionnaire which contained independent variables and use of fifteen key strategies of various principles/ training methodology by the master functions and aspects of training required trainers. for effective training management. The
data were collected with the help of aMETHODOLOGY
well structured and pre-testellThe present study was conducted in the questionnaire through personal contact as GAU. The participants of the said training well as mail. The data collected were' programme were from various colleges/ tabulated, analyzed and interpreted in the projects/ schemes of GAU, scattered all light of objectives. around the state. In total 200 master trainers had participated in the training RESULTS AND DISCUSSION
programme conducted during year 1995 LEVEL OF KNOWLEDGE 96 and 1996-97. All of them were asked The data in Table 1 reveals that more than for responses. Out of them, complete three fourth (75.83 per cent) of the master response in all respect was received from trainers had medium level of knowledge,120 master trainers which were used for while 10.00 per cent respondents had hi9.h analysis. level of knowledge. The above finding The study was based on ex-post facto points out that most of the master trainers research design. A teacher made test was (85.83 per cent) were better equipped with developed to measure the extent of the knowledge of training methodology and knowledge of master trainers regarding it is expected that they conduct training training methodology. Extent of use of programme in a better way. training methodology was measured by a
Table 2: Distribution of the master trainers according to their extent Use of training methodology N=120
Category Score Range No Percent Low Below 32.13 18 15.00 Medium 31.13 42.37 86 71.67 High Above 42.37 16 13.33
Total 120 100.00 Mean== 32.25 S.D. == 5.12

12 Evaluation of Master Trainers' Training
Table 3: Relationship of independent variables of master trainers with their knowledge level and extent of use of training methodology
Sr. Characteristics Extent of knowledge Use of methodology
NO (U r " value) (U r " value)
1 Age -0.00650 0.08871 2 Education -0.00839 -0.05988 3 Cadre -0.07233 -0.02870 4 Family background 0.00538 0.04437 5 Length of service -0.03713 0.08198 6 Training received -0.09721 0.03140 7 Membership in professional 0.06304 -0.05451
organization 8 Scientific productivity -0.14941 -0.26567 * 9 Extent of use of information source. 0.10314 0.29918 * 10 Communication load -0.02498 -0.01429 11 Job satisfaction 0.14158 0.25054 * 12 Job involvement 0.29599 * 0.44999 * 13 Present aspiration 0.09140 -0.03548 14 Future aspiration 0.22955 * -0.00458 15 Extension role perception 0.23077 * 0.38649 * 16 Attitude towards bi-monthly workshop 0.20988 * 0.40964 * 17 Extent of knowledge 0.42060 * 18 Extent use of training methodology 0.42060 *
* Significant at 0.01 level of probability
Extent of use of training methodology
It is observed from Table 2 that majority (71.67 per cent) of the master trainers were moderate users of training methodology, whereas 17.00 per cent used it to a low extent and 13.33 per cent used it to a high extent.
Relationship of independent variables with knowledge level and extent use of training method()logy
. ..'.' ..: -1'-;.~. _: ".' ," .. ..
The 'r' value pre'sentedin Table 3 indicates that the independent variables viz. job involvement, future aspiration, extension role perception and attitude towards biomonthly workshop had positive and significant relationship with the knowledge. level of the master trainers.
In case of extent of use of training methodology, th~ independent variables
such as extent of use of information sources, job satisfaction, job involvement, extension role perception and attitude towards bi-monthly workshop showed positive and significant relationship. Surprisingly, the scientific productivity showed negative and significant relationship with the extent of use of training methodology.
Further, knowledge level of master trainers and their extent use of training methodology were positively and significantly related with each other.
CONCLUSION
The findings led to conclude that majority ofthe master trainers possessed medium level of knowledge and also using training methodology to a medium extent. These were found to be influenced by their job involvement, extension role percep~ion and
13 Evaluation of Master Trainers' Training
attitude towards bi-monthly workshop.'In addition to this, future aspiration was found to influence the knowledge level. At the same time, the extent of use of information sources and job satisfaction were also found to influence their extent of use of training methodology. It indicates that these variables should be taken into consideration while organizing training programme for master trainers.
REFERENCES
Anonymous, 1992. Agenda Notes. National Seminar on Agricultural Extension, Directorate of Extension, Ministry of . Agriculture, Govt. of India, New Delhi: 3942.
Gupta, Ashok K. and Patel, B. T. 1991. An analysis ot Monthly Workshop conducted.. by Gujarat Agricultural University. Gujarat Journal of Extension Education, 2 & 3 : 152-153.

14 Guj. J. Extn. Edu. XII & XIII 2001 & 2002
CONSTRAINTS IN FERTILIZER UTILIZATION BY THE
FARMERS OF UDAIPUR DISTRICT OF RAJASTHAN
Purnesh Mathur1 P. N. Kalla 2 andF. L. Sharma3I
ABSTRACT
The present study was undertaken with the objective to find out the constraints in purchasing and use of fertilizer as perceived by the farmers. It has been planned to find out institutional, socio-economic, psychological and technical constraints that obstruct the use of chemical fertilizers. The findings of the study concluded that 'unavailability of credit for purchasing fertilizers~ 'high cost of fertilizers~ 'fertilizers deteriorates the quality ofsoil'and 'fertilizer creates weed problem' were the most important constraints perceived by the farmers in purchase and use of chemical fertilizers.
INTRODUCTION METHODOLOGY
Fertilizer consumption in India during the The present irvestigation was conducted year 1950-51 to 1990-91 revealed that in purposively selected Bhinder panchayat there was good increase in consumption samiti of Udaipur district of Rajasthan. Ten of fertilizers but this increasing rate has villages were selected on the basis of lowered down after the year 1990-91. It maximum fertilizer consumption from the is also evident that fertilizer consumption identified panchayat samiti. For selection in India is very low as compared to of respondents, a list of farmers was developed countries. Further, the state of prepared from each selected village. From Rajasthan is trailing far behind when the list, 12 respondents (i.e. four each compared with other states of the country. from small, medium and large farmers' The utilization behavior of fertilizer among category) were randomly selected for the farmers is uneven and some times there is present study. Thus, in all 120 respondents great gulf between conviction of farmers were included in the sample of the study. about the fertilizer purchase and its actual Data were collecred by personal interview use in fields. This leads to think and analyze at the home or farm of the respondent in the reasons for the wide gap between the local dialect. Respondents were asked to recommended dose of fertilizers and the respond on each aspect on a two point actual use by the farmers in the state. continuum. The collected data were then With this point in view the present study analyzed, tabulated and interpreted in light was undertaken with the specific objective of the objective of the study. to "find out the constraints in purchasing RESUL TS AND DISCUSSION and use of fertilizer as perceived by the
An attempt has been made to identify thefarmers". institutional, socio-economic, psychological
Senior Research Fellow, Directorate of Extension Education, M.P. University of Agriculture and Technology, Udaipur (Rajasthan)
2 Professor (Agricultural Extension), Alemaya University of Agriculture, Ethopia 3 Assistant Professor, Department of Extension Education, R.C.A., Udaipur
.~

15 Constraints in Fertilizer Utilization
Table 1: Institutional constraints in purchasing and utilization offertilizers as perceived by different categories of farmers
Institutional Small farmers Medium farmers Large farmers Over
constraints N=40 N=40 N=40 all
F P.C. Rank F P.C. Rank F P.C. Rank Rank
Unavailability of 7 17.50 I 7 17.50 I 3 7.50 IV fertilizer in time
Unavailability of fertilizer 6 15.00 II 5 12.50 III 4 10.00 III II at nearby market
Lack of gUidance for the 4 10.00 III 6 15.00 II 5 12.50 II II use of fertilizer
Lack of assured irrigation 3 7.50 IV 4 10.00 IV 6 15.00 I III
F = Frequency P.e. = Percentage
and technical constraints, which prevent the farmers from purchasing and utilization of chemical fertilizers. The results regarding constraints faced by the farmers are presented hereunder:
INSTITUTIONAL CONSTRAINTS
The data in Table 1 reveals that of the four institutional constraints, "unavailability of fertilizer in time" was realized as the most important constraint by the small farmers as well as the medium farmers (17.50%). The "lack of assured irrigation" (15.00%) was considered to be the most important institutional constraint by the large farmers.
While considering the all over picture of constraints, it appears that "unavailability of fertilizer in time" followed by "unavailability of fertilizer at near by market" and "lack of guidance for the use of fertilizer" were the major institutional constraints in use of balance fertilizers by the farmers. The findings are in the line with the findings of Verma and Kumar (1991).
SOCIO-ECONOMIC CONSTRAINTS
The "unavailability of credit for fertilizer at a time" was perceived (Table 2) as most important constraint by the small farmers (27.50%) and the large farmers (15.00%).
Table 2: Socio-economic constraints in purchasing and utilization of fertilizers as perceived by different categories of farmers
Socio-economic Small farmers Medium farmers Large farmers Over
constraints N=40 N=40 N=40 all
F P.C. Rank F P.C. Rank F P.C. Rank Rank
High cost of fertilizer 10
Unavailability of credit for 11 fertilizer at a time
25.00
27.50
II I
8
7
20.00
17.50
I II
4
6
10.00
15.00
III I
II I
Use of fertilizer in 4 10.00 recommended dose is not profitable F = Frequency P. e. = PercentaQe
III 5 12.50 III 5 12.50 II III
0

16 Constraints in Fertilizer Utilization
Table 3:. Psychological constraints in purchasing and utilization of fertilizers as perceived by different categories of farmers
Psychological Small farmers
constraints N=40
F P.C. Rank
Fertilizer deteriorates the 9 22.50 II quality of soil
Crop becomes susceptible 6 18.00 IV to disease
Crop becomes susceptible 7 17.50 III to insect pests
Fertilizer creates weed problem
Fertilizer deteriorates quality of grain produce
10 25.00 I
5 12.50 V
F = Frequency P.c. = Percentage
The "high cost of fertilizer" was ranked first by the medium farmers (20.00%).
While considering the over all picture of socio-economic constraints, "unavailability of credit for fertilizer at a time" followed by "high cost of fertilizers" were the major constraints hindering the use of balance fertilizer by the farmers. The findings are in line with the findings of Waghamare and Pandit (1982) and Sundaraman (1986).
PSYCHOLOGICAL CONSTRAINTS
Data in Table 3 show that in view of small farmers, "fertilizer creates weed problem"
Medium farmers Large farmers Over
N=40 N=40 all
F P.C. Rank F P.C. Rank Rank
6 15.00 I 5 12.50
4 10.00 III 4 10.00 II III
3 7.50 IV 3 7.50 III IV
5 12.50 II 2 5.00 IV II
2 5.00 V 2 5.00 IV V
deteriorates the quality of soil" was considered as .... n important psychological constraint by medium (15.00%) as well as large farmers (12.50%).
At the same time, considering the over all picture of psychological constraints, it appears that "fertilizer deteriorates the quality of soil" followed by "fertilizer creates weed problem" were the major psychological constraints for the use of balanced fertilizer by all of the farmers.
TECHNICAL CONSTRAINTS
It could be realize from Table 4 that 15.00 (25.00%) was a key psychological per cent small farmers were not using the constraint. Contrarily, the "fertilizer Table 4: Technical constraints in purchasing and utilization of fertilizers as
perceived by different categories of farmers
Technical Small farmers Medium farmers Large farmers . Over
constraints N=40 N=40 N=40 all
F P.C. Rank F P.C. Rank F P.C. Rank Rank
Fertilizer not needed due 4 10.00 III 2 5.00 IV 2 5.00 IV IV to high soil fertility
Problematic soil 3 7.50 IV 3 7.50 III 3 7.50 III III Fertilizer is washed away 6 15.00 I 4 10.00 II 4 10.00 II II due to run off water
Fertilizer is leached down 5 12.50 II 5 12.50 I 5 12.50 with irrigation water F = Frequency P.c. = Percentage

17 Constraints in Fertilizer Utilization
recommended dose of fertilizers due to the fear that it may be washed away due to run off water. Though, it may be noted that "fertilizer is leached down with irrigation water~' was perceived to be the most important technical constraint in use of fertilizer by medium farmers as well as large farmers (12.50%).
Looking to the all over picture of technical constraints, it appears that "fertilizer is leached down with irrigation water" followed by "fertilizer is washed away due to runoff water" were the major technical constraints whi"ch affect the proper utilization of fertilizers by the farmers.
CONCLUSION
From the above findings it could be concluded that "unavailability of credit for purchasing fertilizers", "high cost of fertilizers", "fertilizers deteriorates the quality of soil" and "fertilizer creates weed problem" were the most important constraints perceived by the farmers in purchase and use of chemical fertilizers. On the basis of results it could be
suggested that to increase the fertilizer consumption availability of adequate credit facilities be ensured. Efforts should be made to educate farmers regarding the importance of balanced use of fertilizer in maintaining the soil fertility. The governmer'lt should take necessary action to strengthen and re-organize the village cooperative societies so that farmers may receive inputs and credit. This will lead to better adoption of fertilizer with improved agricultural production technology in the study area.
REFERENCES
Waghmare, S. K. and Pandit, V. K. 1982. Constraints in adoption of wheat technology by the tribal farmers of Madhya Pradesh. Indian Journal of Extension Education, 18 (1 &2) : 95-98.
Sunderman, V. 1986. Block delivering scheme. Fertilizer News, 31 (8) : 30.
Verma, H. K. and Kumar, K. 1991. Subsidy on plant protection for oilseeds, a case study. Indian Journal of Extension Education, 27 (1 & 2) : 91-96.

18 Guj. J. Extn. Edu. XII & XIII 2001 & 2002
CORRELATES OF KNOWLEDGE OF SUGARCANE
PRODUCTION TECHNOLOGY
M. M. PateP , R. S. Khatediya2 and Amit Chatterjee3
ABSTRACT
The knowledge of any technology is a key factor for its' adoption. The present study was conducted in Sehore district of Madhya Pradesh, with a view to study growers' level of knowledge and to analyze correlates of their level ofknowledge for sugarcane production technology. It was evident that majority of the respondents possess medium level of knowledge. The small farmers possessed higher knowledge than medium and large farmers. The growers' age, education, area under sugarcane, irrigation potentiality, economic motivation and management orientation were correlated with their level of knowledge.
INTRODUCTION production technologies is a crucial input for increasing the productivity ofSugarcane is one of the important sugarcane. Hence, to examine the extentcommercial crops in India grown for of knowledge possessed by sugarcanesweeteners. Indian population is the growers, the present investigation waslargest consumer of sugar in the world. carried out with the following objectives: According to the estimates of National
Commission on Agriculture, by 2020 A.D., 1. To study the level of knowledge of the increase of demand of sweeteners may sugarcane production technology go up to 54.4 million tones. To achieve possessed by sugarcane growers. this target the sugarcane production has 2. To analyze the relationship between to be increased to about 450 million tones characteristics of sugarcane growers with 100 tones/ha productivity and 11.00 and their level of knowledge for per cent recovery level (Yadav and Singh, sugarcane production technology. 1997). In spite of the growing demand,
METHODOLOGYthe productivity level of the sugarcane in Madhya Pradesh is very low (43 tones/ The study was conducted in ten randomly ha.) This may be due to non-adoption of selected Villages of three selected technologies of sugarcane production. development blocks in Sehore district of
Madhya Pradesh by using 'ex post facto'The knowledge of an innovation can create research design during year 2001. Fifteen motivation for its adoption (Rogers, 1983). respondents (five small, five medium andIn order to increase the level of adoption, five large holding farmers) from each offarmers must be made knowledgeable these vi lIage, selected ra ndom Iy,about technologies. The knowledge of constitutes the sample of 150sugarcane growers for sugarcane respondents.
1 Associate Professor, Deptt. of Extn. Educ., RAK College of Agriculture, JNKVV, Sehore (MP) 2 Ex; M.Sc. Student, Deptt. of Extn. Educ., RAK College of Agriculture, JNKVV, Sehore (MP) 3 Associate Professor, Deptt. of Extn. Educ., RAK College of Agriculture, JNKVV, Sehore (MP)

19 Correlates of Knowledge of Sugarcane
To know the knowledge level of the sugarcane growers, a knowledge test was developed. The test consisted of 22 questions called items. The items were taken from available literature and in consultation with the concerned specialists. The items were assigned a score of' l' for correct answer and '0' for incorrect response. A respondent's total score was obtained by summing his score for all the items on the test.
The data presented in Table 1 indicate that majority of the respondents (70.66 per cent) possessed medium level of knowledge, while 15.33 and 14.00 per cent respondents possessed high and low level of knowledge respectively. The data in Table :l also reveal that the overall mean score of knowledge was 13.89. The 't' test reported that the mean score of small versus medium and medium versus
Table 1: Distribution of the respondents according to their knowledge about sugarcane production technology
Categeries Small Farmers Medium Farmers Large Farmers Total N=150
N=50 N=50 N=50
No. % No. % No. % No. %
Low 4 8.00 12 24.00 5 10.00 21 14.00 ( <11040)
Medium 39 78.00 31 62.00 36 72.00 106 70.66 (11.4 to 16.38)
High 7 14.00 7 14.00 9 18.00 23 15.33 (> 16.38)
Mean 14.20 13.32 14.16 13.89
SD 2.17 2.66 2.57 2.49 t (for SF & MF) = 3.7531 ** t (for MF & LF) = 3.0712 ** t (for SF & LF) = 0.1769 NS
** Significant at 0.01 level of probability NS = Non significant
The respondents were personally interviewed with pre-tested schedule consisting of the knowledge test. To assess the level of knowledge of respondents, knowledge index was calculated for each of the respondents. On the basis of the knowledge index, the respondents were divided in to three different knowledge groups i.e. low « 11.40), medium (11.40 to 16:38) and high (> 16.38) knowledge group.
RESULTS AND DISCUSSION
LEVEL OF KNOWLEDGE
The frequency distribution of the respondents based on their knowledge index is presented in Table 1.
large holding farmers varied with each other, where as mean score of small versus large holding farmers did not vary.
Thus, it can be concluded that the knowledge level of the small holding farmers was higher than medium and large holding farmers. This might be due to more consciousness of small holding farmers for getting more production out of small unit of land.
CORRELATES OF KNOWLEDGE
In order to determine the relationship of the antecedent variables with the knowledge of the respondents regarding sugarcane production technology, the

20 Correlates of Knowledge of Sugarcane
Table 2: Correlates of knowledge about sugarcane production technology
Sr. No.Characteristics Correlation Partial Regression 't' value
Coefficient (r) Coefficient (b)
1 Age - 0.1839 - 0.021 0.662
2 Education 0.5191 ** 1.098 4.033
3 Farm size - 0.0216 - 0.006 0.403
4 Area under sugarcane 0:0646 0.632 2.134
5 Farming Experience 0.2004 * - 0.001 0.028
6 Annual Income 0.0093 0.070 0.175
7 Farm Mechanization - 0.0060 - 0.012 0.928
8 Irrigation Potentiality 0.2071 0.024 2.015
9 Credit orientation - 0.0269 - 0.040 0.403
10 Economic motivation 0.0710 0.065 1.035
11 Scientific orientation 0.0340 - 0.009 0.134
12 Risk orientation 0.0325 - 0.022 0.420
13 Management orientation 0.1895 0.039 1.328
14 Information seeking behaviour 0.3599 ** 0.081 0.798
15 Extension Participation 0.3599 ** 0.018 0.621
16 Mass media exposure 0.2530 ** - 0.006 0.087
Multiple R' = 0.3578, Multiple R = 0.5782, F = value for R = 4.63 ** * Significant at 0.05 level of probability ** Significant at 0.01 level of probability
. regression analysis and results are reported by Reddy and Swaroop (1995) in presented in Table 2. case of sunflower cultivation; Kubde et.
a!. (1999) in case of soybean; and byIt is apparent from the table that out of Borker et. al. (2000) in case of bio15 independent variables, only five fertilizers.variables have shown their significant and
positive relationship with the knowledge The regression analyses were carried out score. These five variables are education, with all the sixteen variables and the results farming experience, information seeking are presented in Table 2. The data in Table behavior, extension participation and mass 3 revealed that out of sixteen variables, media exposure. Similar findings were also only three variables namely education, area
Table 3: Optimum model of multiple regression analysis of six variables with knowledge
Independent variable Regression Standard error Computed
Coefficient (byz) of "b" 't' value
Age - 0.028 0.015 1.849
Education 1.222 0.184 ** 6.648
Area under sugarcane 0.495 0.206 ** 2.398
Irrigation potential 0.026 0.011 ** 2.405
Economic motivation 0.063 0.060 1.055
Management orientation ·0.038 0.028 1.364
R' = 0.3441, R = 0.5866, F value for R = 12.51 ** ** Significant at 0.01 level of probability

21 Correlates of Knowledge of Sugarcane
under sugarcane and irrigation potential were significant in explaining the variation in knowledge. Thus these three variables could be termed as good predictors of knowledge of sugarcane growers. The coefficient of determination R2 = 0.3578 indicated that all the sixteen variables together explained 35.78 per cent variation in the knowledge of sugarcane growers regarding sugarcane production technology which was found to be significant.
For arriving at an optimum model of prediction; analysis of knowledge with only those selected variables which significantly contributed to R2 was made. The variables which had least contribution were deleted from regression analysis on the basis of low 't' value. Thus, finally only six variables namely age, education, area under sugarcane, irrigation potentiality, economic motivation and management orientation were remained. The coefficient of determination R2 = 0.3441 indicated that these six variables jointly expressed 34.41 per cent variation in knowledge which was found to be significant (Table 3).
CONCLUSION
The study concluded that majority of the respondent sugarcane producers possessed medium level of knowledge. The small farmers possessed higher knowledge than medium and large farmers. Out of
the sixteen selected factors; six viz., age, education, area under sugarcane, irrigation potentiality, economic motivation and management orientation were relatively more important indicators since these six factors produced nearly equal variation (34.41 per cent) to that of the sixteen factors (35.78 per cent).
REFERENCES
Sorkar, M. M., Chothe, G. D. and Lanjewar, A. D. 2000. Characteristics of farm women influencing their knowledge about use of bio-fertilizers. Maharashtra Journal of Extension Education, 19 : 130-131.
Kubde, V. R., Tekale, V. S. and Shopale, R. S. 1999. Knowledge and adoption of soybean production technology by the farmers. Maharashtra Journal of Extension Education, 18 : 185-188.
.Reddy, M. S. and Swaroop, M. S. 1995. Knowledge of farmers on sunflower production technology. Maharashtra Journal of Extension Education, 15 : 17-20.
Rogers, E. M. 1983. Diffusion of innovation. Free press, a division of McMillan Pub!. Co. Inc., New York.
Yadav, D. V. and Singh, G. S. 1997. Appropriate agro-techniques to enhance sugar productivity. Indian Journal of Sugar Technology, 12 (1) : 1-16.
,;
22 Guj. J. Extn. Edu. XII & XIII 2001 & 2002
SWAY OF SELECTED FACTORS ON ENTREPRENEURIAL
BEHAVIOUR OF DAIRY WOMEN
A. B. Mundhwa1 , K. A. Thakkar2 and A. S. Sheikh3
ABSTRACT
The women dairy entrepreneur is a key entrepreneur in rural India. The entrepreneurial behaviour ofdairywomen is governed by various personal, social and situational characteristics. To determine the effects of selected characteristics on entrepreneurial behaviour of dairywomen, this study was conducted in Mehsana district of Gujarat. The study concluded that the income from dairy farming, experience ofdairy farming and milk yield were the important variables affecting entrepreneurial behaviour of dairywomen.
INTRODUCTION desirably modify such characteristics with
The entrepreneurship is a crucial quality a view to cO("l~ribute in the development
that visualize new opportunities, new of a rural d<..irywomen. The specific
technologies, new production techniques objectives of the present research were
and co-ordinate the efforts with various as under:
other activities. The women dairy 1. To determine the relationship entrepreneur is one with a determination between the selected personal, to act and to bring about desirable change social and situational characteristics by systematized human efforts. In rural of a rural dairywomen and their India, dairywomen possess good knowledge entrepreneurial behaviour. about dairy management. The dairywoman 2. To study the direct, indirect and may come across many problems pertaining substantial effects of selected to her responsibilities in management of characteristics on entrepreneurialdairy farming. Those with good behaviour of dairywomen and also entrepreneurial capabilities are essentially to identify variables that can helpprogressive dairywomen. predicting the entrepreneurial It is observed that entrepreneurial behaviour of dairywomen. behaviour, being a personal capability; it may be governed by various personal, social METHODOLOGY
and situational characteristics of a The present study was conducted in dairywomen.. The purpose of the present Mehsana district of GUjarat State. Out of study was to assess the existence and eleven talukas of the districts, three the extent of such relationship with talukas namely Mehsana, Vijapur and Kalol entrepreneurial behaviour of a dairywomen; were selected purposively as these talukas that in turn will provide a guideline for the are having maximum dairy co-operative development agencies to make effort to societies. Lists of villages having dairy col Associate Research Scientist, PME Cell, GAU, Gandhinagar 2 Associate Extension Educationist, ASPEE College of Home Science, GAU, Sardar krushinagar 3 Assistant Research Scientist, PUlse Research Station, GAU, Sardar krushinagar

23 Sway of Selected Factors on Entrepreneurial Behaviour
Table 1: Relationship between selected independent variables and entrepreneurial behaviour (n= 225)
Sr. No. Variables Correlation
Co-efficient (r)
1 Age -0.0248 NS. 2 Education 0.3442 ** 3 Type of family 0.2716 ** 4 Family size 0.2870 ** 5 Land holding 0.3581 ** 6 Fodder crops area 0.0362 NS. 7 Herd size 0.2342 ** 8 Social participation 0.1913 ** 9 Infrastructural facilities 0.3025 ** 10 Experience of dairy farming 0.7175 ** 11 Income from dairy farming 0.9360 ** 12 Milk yield 0.9152 **
** = Significant at 1 per cent level of probability
operatives in these talukas were obtained. Five villages from each taluka were selected randomly. From each selected village, 15 dairywomen were randomly selected making a sample of 225 dairywomen.
The entrepreneurial behaviour scale was used to measure the entrepreneurial behaviour of dairywomen. An interview schedule was specially structured to measure dependent variable (entrepreneurial behaviour) as well as independent variables namely age, education, type of family, size of family, land holding, herd size, area under fodder crops, social participation, income from dairy farming, experience of dairy farming, total milk yield and infrastructure facilities.
NS = Non-significant
The selected dairywomen were personally interviewed with the help of interview schedule. The statistical analysis like correlation coefficient, stepwise regression, and path analysis were used to analyze the data.
RESULTS AND DISCUSSION
RELA TIONSHIP BETWEEN SELECTED
VARIABLES
Information pertaining to the relationship between entrepreneurial behaviour of dairywomen and their personal, social and situationa I characteristics has been presented in Table 1.
It is clear from Table 1 that out of 12 independent variables, 10 variables were
Table 2: Stepwise regression analysis showing variables predicting entrepreneurial behaviour
In-dependent Partial Standard 't' 'F'value Standard Rank Co-efficient variable regression error of value partial of
coefficient regression regres-sion determination coefficient co- efficient
Experience of 0.6363 0.0764 3.208 69.280** 0.2378 II 0.9056 dairy farming ** Income from 0.1199 0.0098 2.660 150.116** 0.4034 dairy farming **
** = Significant at 1 per cent level of probability

24 Sway of Selected Factors on Entrepreneurial Behaviour
Table 3: Step-wise variation accounted for different independent variables
Sr. No. Variables included Multiple 'R' Total variation
accounted
1. Income from dairy farming 0.9360 0.8762 (87.62)
2. Experience of dairy farming 0.9516 0.9056 (90.56)
Note: Figures in parenthesis indicate percentage
found to be positively and significantly related with entrepreneurial behaviour of dairywomen. These include education, type of family, size of family, land holding, herd size, social participation, infrastructure facilities, experience of dairy farming, dairy income and total milk yield. The calculated correlation coefficient of these attributes was found statistically highly significant at 1 per cent level of probability.
As far as the variables 'age' and 'fodder crops area' were concerned, the computed correlation coeffici~nt was found nonsignificant, which indicated that neither the age ofa dairywomen nor the area under fodder crop has any significant relationship with her entrepreneurial behaviour.
VARIABLES THAT VISUALIZE I
ENTREPRENEURIAL BEHAVIOUR
Stepwise regression analysis with entrepreneurial behaviour as dependent variable and 12 independent variables was carried out and the results have been presented in Table 2.
It is clear from Table 2 that, about 90.56 per cent of variation in entrepreneurial behaviour was on account of two independent variables viz. experience of dairy farming and income from dairy farming.
It is evident from partial regression coefficient that every unit increase in independent variable namely 'experience of dairy farming' increases almost 0.6363 unit of entrepreneurial behaviour of dairywomen. Similarly, every unit increase
Table 4: Path coefficient showing the effects of independent variables on entrepreneurial behaviour of dairy women
Sr. Independent Direct Total indirect Substantial indirect effect
No. variable effect effect 1 5t 2nd
X2 Education 0.0197 0.3254 0.2295 (Xli) 0.1157 (X10
)
X3 Type of family - 0.0217 0.2933 0.1702 (Xli) 0.1102 (X10
)
X4 Size of family 0.0482 0.2388 0.1624 (Xli) 0.1079 (X 10 )
X5 Land holding - 0.0089 0.3672 0.2444 (Xli) 0.1306 (X10
)
X7 Herd size 0.0066 0.2275 0.1447 (Xli) 0.0840 (X10
)
X8 Social participation 0.0136 0.1778 0.1238 (Xli) 0.5771 (X 10 )
X9 Infrastructural facilities 0.0161 0.2864 0.1898 (Xli) 0.1057 (X 10 )
X10 Experience of dairy farming 0.3856 0.5329 0.5815 (Xli) -0.0676 (X 12 )
Xll Income from dairy farming 0.6458 0.9366 0.3472 (X10 ) -0.0752 (X12
)
X12 Milk yield - 0.0767 0.9919 0.6334 (X,,) 0.3400 (X,n)

25 Sway of Selected Factors on Entrepreneurial Behaviour
in 'income from dairy farming' increases 0.1199 unit of entrepreneurial behaviour.
The 't' value given in Table 2 indicate that 'experience of dairy farming' and 'income from dairy farming' had significant effect on entrepreneurial behaviour of dairywomen at 0.01 level of probability. 'F' test also supported the significant effect of these two independent variables.
On the basis of the values of standard partial regression coefficient given in Table 2, it can be inferred that the contribution of 'experience of dairy farming' (0.4034) and 'income from dairy farming' (0.2378) hold first and second ranks respectively.
It was clear from the data given in Table 3 that the two significant independent variables collectively make 90.56 per cent influence on the dependent variable. These values were significant at 0.01 level of probability. However about 87.62 per cent change in dependent variable has observed due to the variable 'income from dairy farming' alone.
DIRECT EFFECT
The results of path analysis presented in Table 4 indicated that 'income from dairy farming' (0.6458) had the highest direct and positive effect on entrepreneurial behaviour of dairy women. It was followed by 'experience of dairy farming' (0.3856) and 'family size' (0.0482).
On the other hand, the variable 'milk yield' exercise the largest negative direct effect (-0.0767) followed by 'type of family' (0.0217) and 'land holding' (-0.0089) of dairy women.
TOTAL INDIRECT EFFECT
It is interesting to note that 'milk yield' (0.9919) exerted highest total indirect effect followed by 'income from dairy farming' (0.9366), 'experience of dairy farming' (0.5329) and 'land holding' (0.3672). The impact of other attributes was observed to be comparatively less. Further, it was obvious to note that the variables, which did not show much direct effect on entrepreneurial behaviour; played an important role by indirect effect.
SUBSTANTIAL INDIRECT EFFECT
With regard to substantial indirect effect, the first highest substantial positive indirect effect on entrepreneurial behaviour was put forth by 'milk yield' (0.6334) through 'income from dairy farming', followed by 'experience· of dairy farming' (0.5815) also through 'income from dairy farming'. The second largest substantial indirect effect was exerted by 'milk yield' (0.3400) through 'experience of dairy farming'.
CONCLUSION
The study indicated that the variables viz. 'income from dairy farming', 'experience of dairy farming' and 'milk yield' were the important variables affecting entrepreneurial behaviour. Considering the logic underlying the relationship of certain variables, their practical relevance and their contribution in explaining entrepreneurial behaviour, it is necessary to take into account these variables for better understanding and promoting entrepreneurial behaviour of dairy women.

26 Guj. J. Extn. Edu. XII & XIII 2001 & 2002
ASSOCIATION OF PERSONALITY TRAITS OF POULTRY
ENTREPRENEURS WITH THEIR MANAGEMENT ORIENTATION
N. B. Chauhan1, D. S. D. Siddhartha 2 and J. G. PateP
ABSTRACT
The present study to learn association of personality traits of poultry entrepreneurs on their management orientation was undertaken in Anand district of Gujarat state. Of the 80 poultry entrepreneurs from 14 villages, majority had medium to high level of management orientation. Personality traits of poultry entrepreneurs like, economic motivation, risk orientation, planning orientation, production orientation, market orientation, competition orientation and orientation towards management of skill in farm worker pay significant contribution in improving their level ofmanagement orientation. A person with high management orientation will have a high degree of adoption of modern practices,of the poultry enterprise.
INTRODUCTION farming is such a business that requires high level of management ability. Whether The entrepreneur is an economic man, who the person involved in poultry shouldtries to maximize his profits by methodical comprise some basic entrepreneurialuse of innovations. He is not simply qualities or the one with commoninnovator but he is the person with will to characters like a simple farmer can achieveact, to assume risk and to bring about a best results from poultry? To answer thischange through systematic organization question, the present study onof human efforts. Entrepreneurs playa key consequence of personality traits of poultryrole in economic development of country entrepreneurs on their managementlike India. orientation was undertaken. India shall have to concentrate her
production efforts in areas like fish farming, METHODOLOGY piggery, poultry, etc., so as to have a safe The present study was undertaken in guard against the likely shortage of the Anand district of Gujarat State. A random food in the years to come. The importance sample of 80 poultry entrejJreneurs from of poultry in meeting the food reqUirement 14 Villages was selected for the purpose of the nation was also recognized by an of this study. All the respondents were Agricultural Production Team sponsored by personally interviewed with the help of a the Ford Foundation. Development of specially structured interview schedule. For poultry in rural area has definite answer the measurement of various variables, to widespread poverty, disparity and un suitable scales developed by various social employment at country side and scientists were used. Mean, standard marginalization in farming. The poultry 1 P. G. Student, Department of Extension Education, BACA, GAU, Anand 2 Associate Professor, Department of Extension Education, BACA, GAU, Anand 3 Associate Extension Educationist, Office of ADEE, GAU, Anand

27 Association of Personality Traits of Poultry Entrepreneurs
deviation and co- efficient of correlation motivation, risk orientation, innovation were used to analyze the data. proneness, planning orientation, production
orientation, marketing orientation, RESUL TS AND DISCUSSION competition orienti3tion and orientation
towards development of skill in farmLEVEL OF MANAGEMENT ORIENTATION workers were positively and significantly
The data regarding level of management correlated with management orientation
orientation of the poultry entrepreneurs
Table 1: Distribution of poultry entrepreneurs as per their level of management orientation
Sr. No. Level of management orientation Numbers Per cent
1 Low 15 18.75 2 Medium 37 46.25 3 High 28 35.00
Total 80 100.00
are presented in Table 1. The data reveal that slightly less than half (46.25 per cent) of the poultry entrepreneurs had medium level of management orientation. There were 35.00 percent and 18.75 percent poultry entrepreneurs who possess high and low level of management orientation.
CORRELATION OF PERSONALITY TRAITS
WITH MANAGEMENT ORIENTATION
The data in Table 2 indicate that economic
of the poultry entrepreneurs. The data also disclose that the management orientation of the poultry entrepreneurs had positive and significant correlation with the adoption of modern practices of poLlltry enterprise.
The age, education, size of poultry farm, mass media exposure, achievement motivation and supervision orientation did not found to be significantly correlated with the management orientation of the
Table 2 : Relationship of personality traits of the poultry entrepreneurs with their Management Orientation. N=80
Sr. No. Personality traits of the poultry entrepreneurs "r" Values
1 Age 0.0054 NS 2 Education 0.1335 NS 3 Size of Poultry Farm 0.1071 NS 4 Mass Media Exposure 0.0759 NS 5 Economic Motivation 0.5747* 6 Risk Orientation 0.3242* 7 Scientific Orientation -0.0682 NS 8 Achieve Motivation 0.1551 NS 9 Innovation Proneness 0.4759*
10 Planning Orientation 0.7943* 11 Production Orientation 0.8202* 12 Marketing Orientation 0.6907* 13 Competition Orientation 0.3749* 14 Orientation of development of farm workers' Skill 0.6348* 15 Supervision Orientation 0.1946 NS 16 Adoption of modern practices of poultry enterprise 0.4888*
* Significant at 0.05 level of probability

28 Association of Personality Traits of Poultry Entrepreneurs
poultry entrepreneurs. The scientific orientation was negatively but nonsignificantly correlated with management orientation of the poultry entrepreneurs.
The results clearly indicated that entrepreneur oriented with risks and economic will have a tendency and inclination to know scientific methods which leads them towards high level of management orientation to achieve preferred economical end. The results also reveal that the person who is oriented to make necessary arrangement of all the needed ingredients well in advance and the one with high degree of interest in new technology will naturally have high degree of management orientation. Further, the data also portray that management orientation of the poultry entrepreneur is governed by his higher interest in improving the poultry production as well as market.
Further, the competition orientation of poultry entrepreneur, which, in turn will lead to incline him to develop some innovative skills to their farm workers, that helps him in improving performance of the workers. So naturally the level of management orientation of such entrepreneurs will be higher.
CORRELATION OF MANAGEMENT
ORIENTATION WITH ADOPTION
The management orientation of the poultry entrepreneurs and their level of adoption of modern practices of the poultry enterprise were correlated with each other. It means that high degree of management orientation of poultry entrepreneurs played important role in improving their level of adoption. A person with high management
orientation will have a high degree of adoption since desired level of orientation towards scientific farm management includes good orientation for planning, production, and market. This might be the reason for the above findings.
CONCLUSION
From the above study it can be concluded that majority of the poultry entrepreneurs had medium to high level of management orientation. Personality traits of poultry entrepreneurs like, economic motivation, risk orientation, planning orientation, production orientation, market orientation, competition nrientation and orientation towards management of skill in farm worker pay significant contribution in improving their level of management orientation. A person with high management orientation will have a high degree of adoption.
Efforts should be made by organizing short tern or medium term training programmes to improve the overall personality of the poultry entrepreneurs so that they can be made able to manage somewhat difficult and high tech modern innovations of poultry enterprise.

29 Guj. J. Extn. Edu. XII & XIII 2001 & 2002
FARMERS' CHARACTER1STICS INFLUENCING THEIR
KNOWLEDGE AND ADOPTION OF LILY CULTIVATION
Meena Trivedi! and J. C. TrivedF
ABSTRACT
With a view to know the correlates ofknowledge and adoption of the lily growers, this study was undertaken in Anand district. Majority of the respondents possessed medium level of knowledge and adoption of lily cultivation. The significant and positive cOrrelation was observed between economic motivation and scientific orientation with extent ofknowledge of lily cultivation; and also of risk preference with the extent of adoption of lily cultivation.
INTRODUCTION Considering the importance of floriculture
Flowers are symbol of beauty, love and as a new agribusiness; efforts have been
tranquility. Besides their aesthetic value made to study the farmer's characteristics
they are important for their economic uses with respect to their knoWledge and
such as cut blooms and for extracting adoption of lily cultivation with the following objectives. perfumes and other essential oils.
A variety of flowers like roses, gladiolus, 1. To study the extent of knowledge
tuberose, carnation etc; are being grown and adoption of lily cultivation of the
on commercial scale. The major farmers.
metropolitan cities have shown tremendous 2. To study the relationship of different growth for market of these flowers. characteristics of farmers with there However market for these precious flowers extent of knowledge and adoption. did not expanded on large scale in cities
METHODOLOGYand towns. In these areas, customers' preference is for little less costly and such The present investigation was carried out
flowers that can be used for worship or in ten villages of Anand and Umreth talukas
marriages. Cultivators are also now of Anand District, selected purposively. One
calculating economic realization of the hundred lily growers were randomly
flowers. This led to cultivation of other selected for this study. The information
flowers including lily. was collected with the help of structured interview schedule. Extent of knowledge
Table 1: Distribution of the respondents according to their knowledge level N=100
Sr. No. Categories Number Per cent
1 Low level 13 13 2 Medium level 67 67 3 High level 20 20
Total 100 100
1 P. G. Student, B. A. College of Agriculture, GAU, Anand 2 Retired Professor, EEl, GAU, Anand
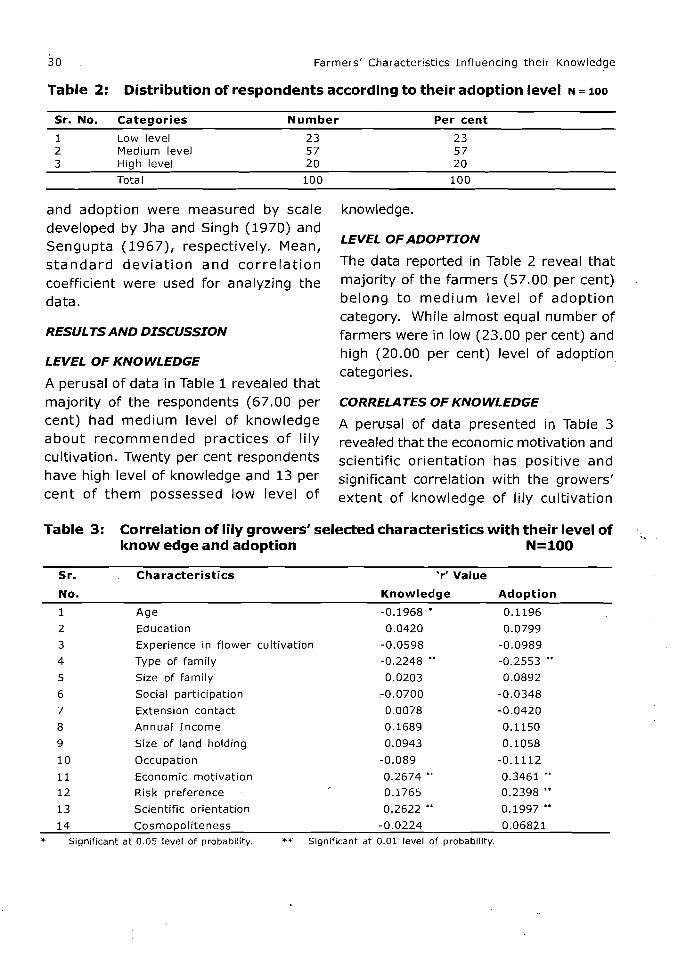
30 Farmers' Characteristics Influencing their Knowledge
Table 2: Distribution of respondents according to their adoption level N =100
Sr. No. Categories Number Per cent
1 Low level 23 23 2 Medium level 57 57 3 High level 20 20
Total 100 100
and adoption were measured by scale developed by Jha and Singh (1970) and Sengupta (1967), respectively. Mean, standard deviation and correlation coefficient were used for analyzing the data.
RESUL TS AND DISCUSSION
LEVEL OF KNOWLEDGE
A perusal of data in Table 1 revealed that majority of the respondents (67.00 per cent) had medium level of knowledge about recommended practices of lily cultivation. Twenty per cent respondents have high level of knowledge and 13 per cent of them possessed low level of
knowledge.
LEVEL OF ADOPTION
The data reported in Table 2 reveal that majority of the farmers (57.00 per cent) belong to medium level of adoption category. While almost equal number of farmers were in low (23.00 per cent) and high (20.00 per cent) level of adoption categories.
CORRELATES OF KNOWLEDGE
A perusal of data presented in Table 3 revealed that the economic motivation and scientific orientation has positive and significant correlation with the growers' extent of knowledge of lily cultivation
Table 3: Correlation of lily growers' selected characteristics with their level of know edge and adoption N=100
Sr. Characteristics 'r'Value
No. Knowledge Adoption
1 Age -0.1968 • 0.1196
2 Educatlon 0.0420 0.0799
3 Experience in flower cultivation -0.0598 -0.0989
4 Type of family -0.2248 •• -0.2553 ••
5 Size of family 0.0203 0.0892
6 Social participation .-0.0700 -0.0348
7 Extension contact 0.0078 -0.0420
8 Annual Income 0.1689 0.1150
9 Size of land holding 0.0943 0.1058
10 Occupatlon -0.089 -0.1112
11 Economic motivation 0.2674 •• 0.3461 ••
12 Risk preference 0.1765 0.2398 ••
13 Scientific orientation 0.2622 .. 0.1997 ..
14 Cosmopoliteness -0.0224 0.06821
* Significant at 0.05 level of probability. ** Significant at 0.01 level of probability.

31 Farmers' Characteristics Influencing their Knowledge
technology. This clearly indicates that growers having economic motivation and scientific orientation tend to acquire more knowledge of lily cultivation, Contrary to this, age and type of family were significantly but negatively correlated with the growers' extent of knowledge of lily cultivation technology,
CORRELATES OF ADOPTION
The data in Table 3 reveal that economic motivation, risk preference and scientific orientation were positively and significantly correlated with the growers' extent of adoption of lily cultivation. The factors that playa significant role for increasing knowledge of lily cultivation technology namely economic motivation and scientific orientation, along with risk preference leads to adoption of lily cultivation. Surprisingly, the type of family had negative but
significant correlation with the adoption of lily cultivation; while the labour requirements in lily cultivation is high than most of the traditional crops.
CONCLUSION
From the above "findings it can be concluded that majority of the farmers possessed medium level of knowledge and adoption of lily cultivation technology, Itcould also be concluded-from the results that the knowledge of lily cultivation was found to be correlated with independent characteristics like economic motivation and scientific orientation. The results further reveal that the extent of adoption of lily cultivation was correlated with scientificorientation, economic motivation and risk preference,

32 Guj. J. E«tn. Edu. XII & XIII 2001 & 2002
COROLLARY OF CULTIVATORS' MANAGERIAL ABILITY ON
ADOPTION OF PLANT PROTECTION TECHNOLOGY OF CHILLI
Ashok A. PateP and R. K. PateF
ABSTRACT
With a view to know whether the managerial ability of the growers had any influence on adoption of plant protection technology by the chilli growers, this study was undertaken. The majority of the respondent chilli growers possessed medium level of managerial ability of plant protection measures in chilli. Similar trend was observed in the extent of adoption of plant protection technology of chilli. The significant and positive correlation was observed between the literacy level, social participation, extension participation & managerial ability; and the extent of adoption.
INTRODUCTION 1. To study managerial ability of growers in regard to plant protectionChilli is an important cash crop of India technology in chilli crop. and also important earner of foreign
exchange. Khan et. al. (1976) revealed 2. To find out the extent of adoption
that the productivity of chilli is low due to of plant protection measures in chilli impact of pests and diseases. In Gujarat, crop by growers.
plant protection measures are the most 3. To investigate the relationship important input to boost up production of between the personal characteristics chilli crop. In order to get sustainable yield, including managerial ability of the the IPM shall be adopted as per growers and their extent of adoption recommendation. of plant protection measures in chilli For adoption of any technology, over and crop. above technological knowledge and
METHODOLOGYavailability of necessary input; the The Gandhinagar district was purposivelymanagerial ability plays an important role. selected for the present study with aThe research efforts are futile, unless it consideration not only as chilli is importantfetch sustainable high yields at farmer's crop of the area but also as the producefield. The present study was undertaken from this area has achieved premium quality with a view to know whether the reputation in the market. A two stagemanagerial ability of the growers had any simple random sampling technique wasinfluence on adoption of plant protection used for this study for selection oftechnology of chilli; with the following respondents. The Gandhinagar and Kalol specific objectives: taluka were purposively selected. From the list of important chilli growing villages, five
Associate Director of Extension Education, Cyber Extension Cell, Directorate of Extension Education, GAU, Gandhinagar. Ex PG Student, College of AgricUlture, GAU, SKNagar. 2

33 Corollary of Cultivators' Managerial Ability
Table 1: Distribution offarmers on the basis of level of managerial ability
Level of Managerial Ability No. of farmers Per cent
Low 17 14.91 Medium 80 70.18 High 17 14.91
Total 114 100.00
villages in each taluka were randomly selected. The lists of chilli growers were obtained from each village panchayat. In all 114 respondents were selected by proportionate random sampling.
An interview schedule for collecting information was specifically constructed. It also consist a specially designed test to measure the growers' managerial ability for use of plant protection measures in chilli crop. The test consist high value of reliability (reliability coefficient 0.8352) and also a high value of validity (validity coefficient 0.9138). For every respondent, managerial ability index was calculated. To measure the extent of adoption of respondents, a simple test was structured and used and "adoption quotient" (AQ) was calculated. On the basis of mean and standard deviation, all the respondents were classified into low, medium and high categories of adoption.
Correlation of coefficient was used to measure relationship between the personal characteristics including the managerial ability of the growers and their extent of adoption of plant plant protection measures in chilli.
RESULTS AND DISCUSSION
MANAGERIAL ABILITY
The managerial ability offarmers may help them to take decision at the right time for adoption of any technology. A specially constructed test was applied to know the level of managerial ability of chilli growers. From the test values, managerial ability index was calculated for each respondent and on the basis of that the respondents were grouped into three categories of managerial ability.
The distribution of respondents as per their level of managerial ability is presented in Table 1. It is obvious from the Table 1 that majority of the respondents possessed medium level of managerial ability. An equal number of respondents fall in the categories of low and high level of managerial ability.
ADOPTION OF PLANT PROTECTION
MEASURES
The data in regard to the extent of adoption of plant protection measures were collected. On the basis of the response values, adoption quotient was calculated for each of the respondents. Owing to AQ values, the respondents were
Table 2: Distribution of the chilli growers according to their extent of adoption
Extent of adoption Number Per cent
Low (up to 10) 21 18.42 Medium (Above 10 to 42) 75 65.79 High (Above 42) 18 15.79
Total 114 100.00

34 Corollary of Cultivators' Managerial Ability
classified in three groups. The data in this technology and also in improving their regard are presented in Table 2. managerial ability (Ashok Patel & R.K. Patel,
Data presented in Table 2 indicate that 2000). Further, the level of knowledge of
nearly two third of the respondents (65.79 the farmers is also significantly contributes
per cent) were categorized under medium in increasing their managerial ability (Patel
level of adoption whereas, 18.42 per cent R. K. & Ashok Patel, 2000).
Table 3: Relationship between personal characteristics of chilli growers and their extent of adoption of plant protection measures
Sr. No.Personal characteristics Correlation Coefficient
1. Age 2. Literacy 3. Social participation 4. Extension participation 5. Size of land holding 6. Economic condition 7. Level of knowledge 8. Managerial ability
(-) 0.157 NS 0.169 NS 0.306 ** 0.403 ** 0.030 NS
(-) 0.004 NS 0.610 ** 0.885 **
** Significant at 0.01 level of probability
of the respondents with low level of adoption and 15.79 per cent of the respondents had high level of adoption.
RELA TIONSHIP BETWEEN PERSONAL CHARACTERISTICS AND ADOPTION
The data pertinent to relationship between personal characteristics of the chilli growers including their managerial ability and their extent of adoption of plant protection measures in chilli crop are presented in Table 3.
It was observed from Table 3 that personal characteristics namely, age, literacy, size of land holding and economic condition of chilli growers had no significant correlation with extent of adoption of plant protection measures in chilli. Contrarily, it is highly correlated with social participation, extension participation, level of knowledge and managerial ability of chilli growers. The social participation and extension participation are the key components for enhancing the knowledge and changing the growers' attitude towerds a
NS Non-significant even at 0.05 level of probability
CONCLUSION
It is clear from the results of the study that majority of the respondents possessed medium level of managerial ability. Similarly, majority of the respondents had a medium level of adoption of plant protection measures. Further, adoption of plant protection measures was associated with social participation, extension participation, level of knowledge and managerial ability of the chilli growers indicating that any increase in these variable were found to elevate adoption level.
REFERENCES Khan, M. M., Rajagopal, D. and Hanumappa, P. 1978. Plant protection practices and problems of chilli growers in Kolar district. Mysore Journal of Agriculture Science, 12: 163 - 169. Patel Ashok A. and Patel R. K. 2000. Growers Managerial Ability for Plant Protection Measures in Chilli Crop. Gujarat Journal of Extension
. Education, 10&11: 1-4. Patel R. K. and Patel Ashok A. 2000. Influence of Knowledge on Decision-Making Ability of Chilli Growers. Gujarat Journal of Extension Education, 10&11: 62-64.

35 GUj. J. Extn. Edu. XII & XIII 2001 & 2002
V~RIABLES INFLUENCING TRIBAL L~ADERS' KNOWLEDGE
AND ADOPTION GAP FOR IMPROVED PADDY CULTIVATION
TECHNOLOGIES
J. D. Sarkar1 , P. K. Sangode2 and K. K. Shrivastava3
ABSTRACT
The present study was conducted in the Manpur block of Rajnandgaon district with the 85 tribal leaders who were selected from 17 villages of the block. The results of the- research reveals that majority of the tribal leaders were having medium level of knowledge as well as adoption. The most of the tribal leaders were having no knowledge and a high gap in adoption for seed treatment and plant protection measures ofpaddy technologies. The variables age, occupation, sub caste and sources of information were having positive and significant r~/ationship with adoption of recommended paddy technologies.
INTRODUCTION METHODOLOGY
Manpur is considered as tribal block of The present study was conducted in Rajnandgaon district. Rice is the staple Rajnandgaon district of Chattisgadh state. food and kodo-kutki is secondary minor The Manpur block, being a tribal block, millet of the tribes of the block. The was selected purposively. Out of total 70 agriculture department of the state pays villages in Manpur block, 17 (i.e. 10 per more emphasis on transfer of improved cent) villages were randomly selected. Five technologies of paddy. Th'e present study most popular leaders from each selected was conducted to assess the extent of village were considered as respondents. knowledge and adoption of the tribal Thus, a total of 85 tribal leaders were leaders of improved paddy cultivation selected for this study. technologies with following specific
The four improved technologies of paddyobjectives: namely use of improved varieties, seed
1. To study the level of knowledge of treatment, use of fertilizer and planttribal leaders regarding selected protection measures were selected for the paddy technologies. purpose of this study.
2. To study the extent of adoption of The level of knowledge and extent oftribal leaders regarding selected adoption for each of these technologiespaddy technologies. by the respondents were assessed with
3. To study the relationship between the help of a specially structured interview
independent variables and extent of schedule. The knowledge index and adoption of improved paddy adoption index were calculated for each technologies by tribal leaders. of the respondents.
1 Head, Department of Agricultural Extension, IGAU, Raipur 2 EX-P.G.student, Department of Agricultural Extension, IGAU, Raipur 3 Associate Professor, Department of Agricultural Extension, IGAU, Raipur
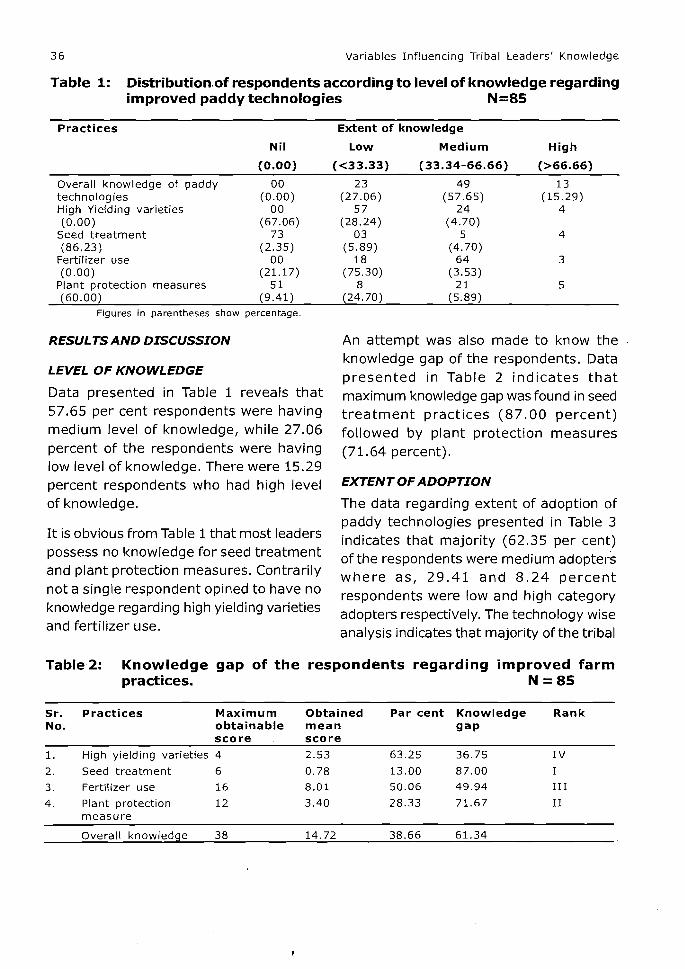
36 Variables Influencing Tribal Leaders' Knowledge
Table 1: Distribution.of respondents according to level of knowledge regarding improved paddy technologies N=85
Practices Extent of knowledge
Nil Low Medium High
(O.OO) «33.33) (33.34-66.66) (>66.66)
Overall knowledge of paddy 00 23 49 13 technologies (0.00 ) (27.06) (57.65) (15.29) High Yielding varieties 00 57 24 4 (0.00 ) (67.06) (28.24) (4.70)
Seed treatment 73 03 5 4 (86.23) (2.35) (5.89) (4.70)
Fertilizer use 00 18 64 3 (0.00) (21.17) (75.30) (3.53)
Plant protection measures 51 8 21 5 (60.00) (9.41) (24.70) (5.89)
Figures in parentheses show percentage.
RESULTS AND DISCUSSION An attempt was also made to know the knowledge gap of the respondents. Data
LEVEL OF KNOWLEDGE presented in Table 2 indicates that Data presented in Table 1 reveals that maximum knowledge gap was found in seed 57.65 per cent respondents were having treatment practices (87.00 percent) medium level of knowledge, while 27.06 followed by plant protection measures percent of the respondents were having (71.64 percent). low level of knowledge. There were 15.29
EXTENT OF ADOPTIONpercent respondents who had high level of knowledge. The data regarding extent of adoption of
paddy technologies presented in Table 3 It is obvious from Table 1 that most leaders indicates that majority (62.35 per cent) possess no knowledge for seed treatment of the respondents were medium adoptersand plant protection measures. Contrarily where as, 29.41 and 8.24 percent not a single respondent opined to have no respondents were low and high categoryknowledge regarding high yielding varieties adopters respectively. The technology wise and fertilizer use. analysis indicates that majority of the tribal
Table 2: Knowledge gap of the respondents regarding improved farm practices. N =85
Sr. Practices Maximum Obtained Par cent Knowledge Rank No. obtainable mean gap
score score
1. High yielding varieties 4 2.53 63.25 36.75 IV
2. Seed treatment 6 0.78 13.00 87.00 I
3. Fertilizer use 16 8.01 50.06 49.94 III
4. Plant protection 12 3.40 28.33 71.67 II measure
Overall knowledge 38 14.72 38.66 61.34

37 Variables Influencing Tribal Leaders' Knowledge
Table 3: D~stributionof respondents according to extent of adoption, regarding improved farm practices N =85
Practices Extent of Adoption
Nil Low Medium High
(0.00) «33.33) (33.34-66.66) (>66.66)
Overall adoption of paddy technolog ies
High yielding varieties
Seed Treatment
Fertilizer use
Plant protection measures
00 (0.00)
00 (0.00)
76 (89.65)
00 (0.00)
53 (62.40)
25 53 07 (29.41) (62.36) (8.24)
57 26 02 (67.96) (30.04 ) (3.00)
01 05 03 ( 0.25) ( 6.76) (3.34)
22 56 07 (25.39) (66.10) (8.51)
23 09 00 (27.60) (10.00) (0.00)
Figures in parentheses show the percentage.
leaders did not adopt the paddy technologies namely seed treatment (89.65 per cent) and plant protection measures (62.40 per cent). The highest adoption was observed for fertilizer use, followed by high yielding varieties.
The further analysis of adoption gap (presented in table 4) indicate that the maximum adoption gap was found in seed treatment practices (85.50 percent) followed by plant protection measures (78.09 percent). Similarly, the adoption gap was also found in high yielding varieties (61. 75 percent) and fertilizers use (54.93
percent).
RELATIONSHIP OF INDEPENDENT
VARIABLES AND EXTENT OF ADOPTION
The correlations of selected independent variables with the extent of adoption of paddy technologies by the tribal leaders are presented in Table 5. The results indicate that the variables namely age, occupation, land holding, sub caste and sources of information were found to be positively and significantly correlated with the extent of adoption of paddy technologies. Surprisingly, the contact with extension agent and level of aseiration
Table 4: Adoption gap of respondents regarding improved farm practices
Sr. No.
1.
Practices
High yielding varieties
Maximum obtainable score
4
Obtained mean score
1.53
Per cent
38.25
Adoption gap
61. 75
Rank
III
2. Seed treatment 4 0.58 14.50 85.50
3. Fertilizer use 16 7.21 45.06 54.93 IV
4. Plant protection measures 24 5.26 21.91 78.09 II
Overall adoption 40 3.64 29.93 70.07

38 Variables Influencing Tribal Leaders' Knowledge
Table 5: Relationship between independent variables and extent of adoption of recommended paddy technologies
Sr. No. Independent variables Correlation Coefficient
Xl Age 0.399 * X2 Education 0.027
X3 Occupabon 0.371 * X4 Annual income 0.047
X5 Land holding 0.047
X6 Sub caste 0.215 * X7 Sources of information 0.215 * X8 Contact with extension agent -0.376
X9 Level of aspiration -0.038
X10 Level of knowledge 0.143
*Significant at 0.05 % level
showed negative relationship with the extent of adoption of paddy technologies.
CONCLUSION
Majority of the tribal leaders were having overall medium level of knowledge regarding improved paddy technologies. There were 86.23 per cent local leaders who have no knowledge for seed treatment, while 62.40 per cent has no knowledge for plant protection measures of paddy cultivation.
In case of overall adoption 62.35 percent tribal leaders were found to be medium adopters regarding improved paddy technologies. In case of level of adoption of fertiUzers, 66.10 per cent tribal leaders were medium level adopters of fertilizers,
while 67.96 per cent were found to possess low level of adoption of high yielding varieties.
The analysis of adoption gap show that 85.50 and 78.09 per cent of the tribal leaders have adoption gap for seed treatment and plant protection measures of paddy technology, respectively.
The variables age, occupation, sub caste and sources of information were having positive and significant relationship with adoption of recommended paddy technologies. Contrarily, the contact with extension agent and level of aspiration has negative but non-significant relationship with extent of adoption of paddy technology.
39 Guj. J. Extn. Edu. XII & XIII 2001 & 2002
EXTENT OF KNOWLEDGE AND AlTITUDE OF DAIRY FARMERS
TOWARDS AI IN MILCH ANIMALS
G. K. Temkar1 and N. B. Chauhan2
INTRODUCTION
The modern dairy farming is based on four pillars namely innovative breeding, appropriate feeding, excellent management and well supervised healthcare practices of cattle and buffaloes. Among many breeding practices, artificial insemination (AI) is a key practice of modern dairy farming.
The role of AI in improving productivity of farm animal is well known, but in India, even after 4-5 decades of the introduction of AI, it hardly covers about 10 per cent of breedable cattle population. (Ganeshkumar and Prabhakaran, 2000). It is universally accepted fact that improvement in adoption of any innovation can be brought through bringing positive change in the knowledge, skill and attitude of the innovators in terms of new innovations. Further there are certain factors that restrict individual adopters to adopt an innovation.
Considering the above facts it was thought worthwhile to study the level of knowledge and attitude of the dairy farmers towards artificial insemination and the factors that are responsible for that.
METHODOLOGY
The study was conducted in Anand district of GUjarat state. A random sample of 120 dairy farmers was selected from the twelve villages of Anand district.
The data were collected with the help of interview schedule. The scales developed by Jha and Singh (1970) and Koura and Si ngh (1968), were incl uded in the interview schedule to measure the variables of knowledge and attitude respectively. The co-efficient of correlation (r) was used to find out the relationship of independent variables of dairy farmers with their knowledge regarding and attitude towards AI.
RESUL TS AND DISCUSSION
LEVEL OF KNOWLEDGE AND ATTITUDE
The data in Table 1 indicate that majority (65.00 per cent) of the dairy farmers had medium to high level of knowledge regarding AI. The probable reasons for the above findings may be high rate of literacy, high level of mass media exposure and good extension contacts.
In case of attitude of the dairy farmers towards AI, the data in Table 1 shows that majority (76.67 per cent) of them had medium to high level of favorable attitude towards AI. This might be due to their medium to high level of knowledge of AI and advantages of AI experienced by them as compared to the natural service. The high rate of literacy, good extension contact and high level of mass media exposure might have also influenced the favora ble attitude.
1 Ph.D. Student, Department of Extension Education, B.A. College of Agriculture, GAU., Anand 2 Associate Professor, Department of Extension Education, B.A. College of Agriculture, GAU., Anand

40 Extent of Knowledge and Attitude of Dairy Farmers
Table 1: Distribution of respondents according to their level of knowledge and attitude towards Artificial insemination N =120
Sr. Level Knowledge regarding Attitude towards AI No. AI
No. Per cent No. Per cent
1. Low 42 35.00 28 23.33
2. Medium 31 25.84 58 48.34
3. High 47 39.16 34 28.33
TOTAL 120 100.00 120 100.00
RELATIONSHIP OF INDEPENDENT
VARIABLES WITH KNOWLEDGE AND
ATTITUDE
It could be inferred from the results in Table 2 that extent of knowledge regarding AI was found significantly correlated with education, mass media exposure, extension contact, herd size and psychological variables. However, it was found negatively but significantly correlated with age. It means younger dairy farmers seemed to be better in knowledge of AI as compared to the elderly farmers.
So far as attitude towards AI is concerned, it was found significantly correlated with education, mass media exposure, extension contact, economic motivation, risk orientation, scientific orientation and achievement motivation. However, it was found negatively but significantly correlated with age.
This revealed that dairy farmers who had positive orientation towards education; higher mass media exposure; extension contact and economic motivation; high risk orientation, achievement motivation
Table 2: Relationship between independent variables of the dairy farmers and their level of knowledge and attitude towards AI
Sr. Independent variables Correlation coefficient (r)
No. Knowledge Attitude
I. Personal 1. Age -0.79153* -0.86465* 2. Education 0.63024* 0.61098* II. Social-Communicational 3. Caste -0.05825 0.01236 4. Organizational participation -0.07219 -0.05193 5. Mass media exposure 0.46403* 0.44182* 6. Extension contact 0.25576* 0.23065* III. Economical 7. Land holding -0.08038 -0.14707 8. Herd size 0.24167* 0.17407 IV. Psychological 9. Economic motivation 0.55933* 0.55706* 10. Risk orientation 0.56189* 0.58363* 11. Scientific orientation 0.55169* 0.52136* 12. Achievement motivation 0.54072* 0.51231 * 13. Attitude towards AI 0.78241 *
* Significant at 0,05 per cent level of probability

41 Extent of Knowledge and Attitude of Dairy Farmers
and scientific orieDtation: had high level of knowledge and positive attitude towards AI. Probable reason for the significant role of some of the personal, social, communication and all psychological variables might be their high literacy rate, good mass media exposure and extension contact which made them more aware and compelled them to take livestock enterprise as profit making enterprise.
CONCLUSION
It is observed that majority of the dairy farmers had medium to high level of" knowledge and attitude towards artificial insemination. At the same time some of the personal, social communication and
psychological variables contributed significantly to improve their level of knowledge and in changing their attitude positively towards AI.
It is therefore, recommended that extra efforts should be made by different agencies to change the psychology of the dairy farmers in positive direction by the improvement in their level of knowledge and a favorable attitude towards artificial insemination practices.
REFERENCE
Ganeshkumar, B. and Prabhakaran, R. 2000. Dairying in India (Thrust for 21 st Century). Indian Economic Panorama, 9(4): 18-21.

42 Guj. J. Extn. Edu. XII & XIII 2001 & 2002
AN ANALYSIS OF AGRICULTURAL EXHIBITION
B. N. Kalsariya 1 , B. R. Karkar2 and N. D. Bharad3
INTRODUCTION
Agricultural exhibition is an important mass media method for the transfer of technology. It is a systematic display of models, specimens, charts, graphs, improved implements and method demonstrations. Shree U. K. V. Mahila Arts and Home Science College, Keshod has organised a NSS Camp at Tarshingda village of Maliya Taluka of Junagadh distridt. During this camp, a one day training programme for farm women was organized by Sardar Smruti Kendra, GAU, Junagadh. Besides this programme, farmers' group meeting and agricultural exhibition was also organized. It was considered worth-while to analyze the agricultural exhibition with the following objectives:
1. To know perception of the visiting farmers about the level of usefulness of agricultural exhibition.
2. To ascertain the relationship between the selected characteristics
of respondents and usefulness of agricultural exhibition.
3. To seek suggestions from beneficiary farmers for effective organization of agricultural exhibition.
METHODOLOGY
Th.e study was undertaken at Tarshingda village of Maliya Hatina taluka of Junagadh district (Gujarat State). From amongst the 150 farmers who visited the agricultural exhibition, 44 were randomly selected and interviewed for the purpose of the study. An interview schedule was specifically prepared considering the objectives of the study. To know the usefulness of agricultural exhibition, a three point rating scale was used.
Data thus collected were analyzed and salient interpretations were drawn. The statistical measures like frequency, percentage, ranking and chi-square were used.
Table 1: Usefulness of agricultural exhibition as perceived by the beneficiary farmers N=44
Sr. Level of usefulness No. of Per cent Rank
No. . respondents
1. Useful 10 22.72 III
2. More useful 22 50.00
3. Most useful 12 27.28 II
1 Agricultural officer, SSK, GAU, Junagadh 2 Assistant Extension Educationist (information), SSK, GAU, Junagadh 3 Assistant Extension Educationist (information), SSK, GAU, Junagadh

43 Analysis of Agricultural Exhibition
Table 2: Distribution of respondents according to their characteristics and level of usefulness N=44
Sr. No. Independent variables Chi-square
1 Age 11.603
2 Size of land holding 5.451
3 Level of education 10.586
RESULTS AND DISCUSSION RELATIONSHIP BETWEEN SELECTED
CHARACTERISTIC AND THE LEVEL OF USEFULNESS OF AGRICULTURAL USEFULNESS EXHIBITION The results pertaining to the relationship The results pertaining to the usefulness between selected characteristics and of agricultural exhibition are presented in the level of usefulness are presented in Table 1. Table 2.
The data of Table 1 clearly indicated that The data depicted in Table 2 clearly indicate fifty percent respondents were opined that that the level of education and age of the the exhibition was more useful. More than respondents were found to be correlated twenty seven percent respondents with the level of usefulness of agricultural expressed the exhibition as most useful. exhibition. Though, the size of land holding While about 23 per cent respondents was not found to be correlated with the indicated the exhibition as a useful level of usefulness. The probable reason activity. It can be inferred from the results may be that the agricultural exhibition may that agricultural exhibition is a very useful prove to be useful to all farmers, activity for the farmers. irrespective of their size of land holding.
Table 3: Distribution of respondents according to suggestion offered for effective organization of agricultural exhibition N-44
Sr. Suggestions No. Per cent Rank No.
1. Plants specimens should be exhibited 42 95.45 with seed samples.
2. Models and specimens should be displayed 39 88.63 II with detailed information
3. Publicity of exhibition should be done well in 39 88.63 II advance and insecticides & pesticides should be displayed with related information
4. Containers of insecticides & pesticides should 38 86.36 IV be displayed with related information
5. How to diagnose the main pest and diseases 35 79.54 V of major crops should be demonstrated
6. Agricultural exhibition should be organized 34 77.27 VI for at least 2-3 days
7. There must be demonstration of improved 33 75.00 VII implements in the exhibition

44 Analysis of Agricultural Exhibition
SUGGESTION OF FARMERS FOR EFFECTIVE
ORGANIZATION OF AGRICULTURAL
EXHIBITION
The views of farmers regarding effective organization of agricultural exhibition are presented in Table 3.
It can be inferred from the data of Table 3 that all the seven suggestions for effective organization of agricultural exhibition are given by mor€' than 75 percent of the respondents. However, the three important suggestions given by them were 'plant specimens should be exhibited with seed sample'; 'models and specimens should be
displayed with detail information' and 'publicity of exhibition should be done well in advance'.
CONCLUSION
The results of study clearly indicated that the agricultural exhibition is proved useful to all farmers irrespective of their size of land holding. Therefore, it should be used on wider scale for the purpose of transfer of technology. Further, for effective organization of agricultural exhibition; the models and specimens should be displayed with detailed information and publicity of exhibition should be done well in advance.

45 Guj. J. Extn. Edu. XII & XIII 2001 & 2002
A CRITICAL STUDY OF
COMMUNITY GOBAR GAS PLANT, METHAN
V. T. PateP, M. R. Prajapati2, M. C. SonP and N. V. Chaudhary4
INTRODUCTION
Gobar gas seems to be the ultimate answer to the energy crisis at present. It carries simple technology; involves less cost and requires such a raw material that is constantly available in rural areas. Gobar gas has many advantages including it is a unpolluted source of energy.
At Methan village of Patan district in Gujarat State, there is a unique community gobar gas plant working since 1987, run by a co-operative society of bio-gas users. The present investigation was an attempt to acquire reflections of members as well as executive body towards community gobar gas plant with the fo11owing specific objectives:
1 To know the attitude of the user members towardscommunitrgobar gas plant.
2 To study the constraints expressed by the users members in adoption of community gobar gas plant.
3 To know the suggestions of the user members to overcome the constraints.
METHODOLOGY
The present study was undertaken in Methan village of Siddhpur Taluka of Patan district. The Methan village was selected purposively as there is a unique community gobar gas plant working since 1987, run by a "Co-operative society of bio-gas users. At present there are 155 user members of the society. Out of these, more than half i.e. 80 user members were randomly selected for the study. The data were collected with the help of well-structured interview schedule. The data were analyses in the light of the objectives for meaningful interpretation.
Table 1: Distribution of respondent$ according to their attitude towards community gobar gas plant (N=80)
Sr. Level of Attitude Number Per cent No.
lo Highly favorable (above 54 score) 9 11.25
2. Favorable (46 to 54 score) 65 81.25
3. Unfavorable (below 46 score) 6 7.50
Mean = 50.4000 SD = 3.8140
1 Assistant Professor, Department of Extension Education, CPCA, GAU, SKNagar 2 Associate Professor, Department of Extension Education, CPCA, GAU, SKNagar 3 Professor, Department of Extension Education, CPCA, GAU, SKNagar 4 Assistant Professor, Department of Extension Education, CPCA, GAU, SKNagar

46 Study of Community Gobar Gas Plant
Table 2: Constraints faced by the member respondents
Sr. Constraint Score Per cent No.
1 Society fails to take strict action against the defaulters 212
2 One has to give priority for cooking as there is fixed 150 II time for release of gas
3 selsonal variation in gas production 149 III
4 Complains are not attended timely for repair of burner 144 IV and leakage of gas
5 Cooking is delayed due to low pressure of gas 142 V
6 Lack of technical staff for maintenance and repair of plant 137 VI
7 Time of gas release is not suitable 135 VII
8 Gas supply is inadequate and irregular 131 VIII
9 Lack of guidance and services from the inspiring institutions 121 IX after establishment of plant
10 Looking to the non working and sick plant, there is a doubt 110 X about the running of plant
RESULTS AND DISCUSSION
ATTITU/JE TOWARDS COMMUNITYGOBAIl.
GAS PLANT
The data presented in Table 1 indicate that a majority of the user members (81.25 per cent) possessed favorable attitude towards community ~obargas plant. There were 11.25 per cent and 7.50 per cent of the members who possessed htghly favorable and unfavorable attitude, respectively. The probable reason for
favorable attitude may be due to cheap and easy availability of gas from the society.
CONSTRAINTS FACED BY THE
RESPONDENTS
It can be observed from the Table 2 that the foremost constraint realized by the members is that the society fails to take strict action against the defaulters. Another important constraint is fixed time for release of gas, and as such, one has
Table 3: . Suggestions of the member respondents to overcome the constraints
Sr. Suggestions No.
1 Every members should pay gas consumption bill timely
2 Every member should use the gas carefully and economically
3 Society should take strict actions against defaulters
4 Members should take care to elect enthusiastic and interested members in the executive body
5 Cattle owners should give cow dung for the plant
6 Need to appoint technical staff to look after the plant
Number
80
80
80
77
72
46
Rank
I
II
III
IV

47 Guj. J. Extn. Edu. XII & XIII 2001 & 2002
to give top priority for cooking. 'Seasonal variation in gas production', 'not to pay attention to complains in time' and 'low pressure of gas' were the other constraints experienced by the members.
SUGGESTIONS OF THE MEMBERS TO
OVERCOME THE CONSTRAINTS
The members were asked to give their constructive suggestions for better running of the community gobar gas plant. The data in Table 3 revealed that the three suggestions namely 'every member should pay the consumption bill timely'; 'every member should use the gas carefully and economically' and 'society should take strict action against defaulters' were the most important suggestions made by all the respondents. Most of the respondents also suggested taking care to elect enthusiastic and interested members in executive body.
CONCLUSION
Based on the findings, it may be concluded that majority of the member possessed favorable attitude towards the community gobar gas plant. As regards the constraints, the members feel that society fails to take strict action against defaulters. While giving suggestions, all of them agreed to the fact that 'every member should pay the consumption bill timely'; 'every member should use the gas carefully and economically' and 'society should take strict action against defaulters'. Thus, for better running of the plant there is a need to have still better cooperation and coordination among the members of the society..

48 Guj. J. Extn. Edu; XII & XIII 2001 & 2002
CORRELATES OF MODERNIZATION OF FARMERS
M. R. PrajapatP and D. L. Jadha02
INTRODUCTION
Present age is the age of science and technology. It is recognized that if farmers are to progress, they have to be updated in knowledge, attitude & skills and are to adopt modern scientific technologies. It is therefore, necessary, to find out the ways and means for conveying innovative technologies to farmers so that, they may put those in to practice. For increasing farm productivity, use of modern inputs. and adoption of latest agricultural technologies is crucial. Agricultural modernization is intimately linked with the application of science and technology in the farming.
The extent of modernization is the degree to which a farmer is modern in thinking and outlook. It had two components, general advancement regarding modern thinking and openness to new ideas and practices. Keeping the above facts in view, the present study was intended to know the extent of modernization of farmers, with the following specific objectives:
1. To study the extent of modernization of the farmers.
2. To find out the relationship between personal, socio-psychological, communicational, economic and situational characteristics of farmers and their extent of modernization.
METHODOLOGY
The present study was conducted in Mehsana district of Gujarat state. Among all the talukas of Mehsana district, Mehsana and Vijapur talukas are considered as progressive in agriculture and animal husbandry. Hence, these two talukas were selected purposively for the study. Twelve villages (six villages from each taluka) were selected randomly. Proportionate random sampling technique was employed to select 120 respondents from the selected villages.
For this study, indicators of modernization like extent of use of improved agricultural technologies viz., improved seeds, chemical fertilizers, plant protection measures, improved agricultural implements and irrigation practices were selected for major crops (bajra, mustard, potato and castor) along with the use of improved dairy practices. An interview schedule was developed for collecting information, The
Table 1: Distribution of respondents according to their level of modernization
Level of modernization No. of farmers Per cent
Low 28 23.34
Medium 70 58~33
High 22 18.33
Total 120 100.00
Mean: 51.28 S.D,: 19.38
1 Associate Professor, Department of Extension Education, CPCA, GAU, SKNagar 2 Post-Graduate Student, CPCA, GAU, SKNagar

49 Guj. J. Extn. Edu. XII & XIII 2001 & 2002
Table 2: Correlates of modernization of the farmers
Sr. Correlates of modernization 'r' value No. 1. Age -0.23342** 2. Education 0.41855** 3. Social participation 0.30720** 4. Urban orientation 0.23193** 5. Mass media exposure 0.34224** 6. Extension contact 0.36211** 7. Achievement motivation 0.35846** 8. Innovatlveness 0.59629** 9. Scientific orientation 0.40573** 10. Risk preference 0.30496** 11. Attitude 0.27931 ** 12. Market orientation 0.23130** 13. Annual income 0.51609** 14. Farm size 0.17970* 15. Farm power 0.31871 ** 16. Livestock possession 0.30904**
* Significant at 0.05 per cent level of probability
data were tabulated and analyzed. Modernization score for each individual respondent was calculated. Correlation coefficient was used to measure relationship between dependent and independent variables.
RESULTS AND DISCUSSION
EXTENT OF MODERNIZATION
Based on the response for each statement, modernization score for each individual respondent was calculated. All the respondents were grouped into three levels of modernization. The results are depicted in Table 1.
It is apparent from the table that majority of the respondents (76.66)· possessed medium to high level of modernization. While only 23.34 per cent of them had low level of modernization.
CORRELATES OF MODERNIZATION
It is obvious from Table 2 that education, social participation, urban orientation,
**Significant at 0.01 per cent level of probability
mass media exposure, extension contact, achievement motivation, innovativeness, scientific orientation, risk preference, attitude, market orientation, annual income, farm power and livestock possession exhibited positive and highly (0.01 level of probability) significant relationship with modernization. Farm size exhibited positive and significant relationship with modernization. Contrary to this, age exhibited negative and highly significant relationship with modernization.
CONCLUSION
Based on the findings, it may be concluded that majority of the respondents ·possessed medium to high level of modernization. The innovativeness and annual income of the farmer were the key correlates of modernization beyond many others. Efforts shall be made to properly nourish the innovativeness of the farmers to make them modernize. This will add to their income and the increased income will in turn make them more modern.

50 Guj. J. Extn. Edu. XII & XIII 2001 & 2002
ADOPTION OF WATERSHED MANAGEMENT
TECHNOLOGY BY FARMERS
R. C. PatellA. S. Saiyad2 and N. B. Chauhan 3
INTRODUCTION
Gujarat is predominantly the state for dry land agriculture. Out of 96 lakh hectares of its cultivable area, about 77.00 per cent area is rainfed. The National Watershed Development Programme for Rainfed Area (NWDPRA) was started by the state government in 1986-87 to enhance the production efficiency of dry land area.
Adoption of watershed management technology considered as a best mean to increase. agricultural production and improve standard of living of beneficiaries in watershed area. It varies from farmer to farmer according to their knowledge and understanding. It is also influenced by socio-personal, agro-economic, psychological and communicational qualities of the farmers. The present study was undertaken to examine the pattern of adoption of watershed management technology with following specific objectives:
1. To examine the extent of adoption of watershed management technology by the beneficiaries of NWDPRA.
2. To ascertain the association between selected socio-personal, agroeconomic, psychological and communicational characteristics of beneficiaries and their extent of adoption of watershed management technology.
METHODOLOGY
The study was conducted in Kapadwanj and Balashinor watersheds of Kheda district of Gujarat state. All the 10 Villages covered under programme were included in the study. A random sample of 217 beneficiary farmers was drawn by proportionate random sampling method. The data were collected with the help of a specially structured schedule by personal interview. To measure the level of adoption of watershed management technology, the scale developed by Sengupta (1967) was used. The association between some of the characteristics of the beneficiary farmers and extent of adoption of watershed management technology was tested by applying coefficient of correlation.
Table 1: Distribution of respondents according to extent of adoption of watershed management technologies· . N= 217
Sr. No. Extent of adoption Frequency Per cent
1. Low Adoption (up to 49 score) 37 17.05
2. Medium Adoption (50 to 59 score) 145 66.82 3. High Adoption (above 59 score) 35 16.13
I Assistant Professor, Department of Extension Education, BACA, GAU, Anand 2 Assistant Professor, Department of Extension Education, BACA, GAU, Anand 3 Associate Professor, Department oJ Extension Education, BACA, GAU, Anand

51 Guj. J. Extn. Edu. XII & XIII 2001 & 2002
Table 2~ Practice wise adoption of watershed management technology by beneficiary farmers
Sr. No. Recommended technology
1 Contour banding
2 Land leveling
3 Summer ploughing
4 Construction- of farm pond
5 Recharging of wells
6 Sowing across the slope
7 Tillage across the slope
8 Use of shot duration varieties
9 Timely sowing
10 Mid season correction
11 Ipter cropping
12 Use of organic manures
13 Use of chemical fertilizers
14 Weed management (1) Hand weeding (II) Use of herbicides
15 Inter culturing
16 Plant protection measures (I) Seed treatment (II) Pest .control (III) Diseases control
17 Supplementary irrigation
18 Mulching
19 Planting of trees on farm boundary
20 Sprinkler or drip irrigation
RESULTS AND DISCUSSION
EXTENT OF ADOPTION
It is observed from the data presented in Table 1 that majority (66.82 percent) of the beneficiaries of NWDPRA had medium level of adoption of watershed managementtechnology followed by 17.05 percent with low and 16.13 percent with high level of adoption of watershed management technology. This finding is also in conformity with the results reported by Karkar( 1998).
N=217
Frequency Per cent Rank
54 24.88 XIV
85 39.17 XI
185 85.25 VII
05 2.30 XX
00 00
30 13.82 XVII
30 13.82 XVII
210 96.77 I
195 89.86 V
75 34.56 XII
152 70.00 IX
200 92.17 III
188 86.63 VI
198 91.24 IV 32 14.75 XVI
206 94.93 II
40 18.43 XV 162 74.65 VIII 58 26.63 XIII
87 40.00
0 0.00
25 11.52 XIX
0 0.00
ADOPTION OF TECHNOLOGIES
The practices wise adoption of watershed management technology was ascertained and the data obtained have been reported in Table 2. A critical perusal of the data in the table discloses that, significant numbers of respondents had adopted watershed management technologies namely, short duration varieties of crops, inter culturing, use of organic manure and weed management through hand weeding. The findings are in conformity with the findings reported by Shah and Patel (1996)
X

52 Guj. J. Extn. Edu. XII & XIII 2001 & 2002
Table 3: Association between personal traits and extent of adoption of watershed management technology N=217
Sr. No. Characteristics 'r' value
Socio-personal characteristics 1 Xl. Age -0.1813**
2 X2. Education 0.5111 **
3 X3 Social participation 0.3646**
Agro-economic characteristics 4 X4 Occupation -0.2740**
5 X5 Land holding 0.4855**
6 X6 Herd size 0.3947**
7 X7 Irrigation potentiaHty 0.2846**
8 X8 Cropping intensity 0.3103**
9 X9 Annual income 0.4795**
Psychological characteristics 10 X10 Economic motivation 0.3233**
11 X11 Risk preferences 0.4812**
12 X12 Scientific orientation 0.3913**
13 X13 Attitude towards NWDPRA 0.4694**
14 X14 Knowledge about WMT 0.5965**
Communicational characteristics 15 X1S Sources of information 0.5479**
16 X16 Extension participation 0.5666**
**Significant at 0.1 level of probability
sources
that higher adoption was observed for extension participation of beneficiaries of
simple and no cost or low cost NWDPRA had positive and significant
technologies. Contrary to this, association with their extent of adoption
technologies .Iike recharging of. well, of watershed management technologies.
mulching and sprinkler or drip irrigation was However, age and occupation had negative
not adopted by any respondent. association with extent of adoption of watershed management technologies.
and Karkar(1998). The results indicated technology, of information and
CORRELATION WITH PERSONAL This means that extent of adoption of
ATTRIBUTES watershed management technology was It could be observed from Table 3 that, observed better among those farmers who the characteristics namely education, are young in age and are dependent on social participation, land holding, herd size agriculture occupation only; having higher possessed, irrigation potentiality, cropping level of education; good social intensity, annual income, economic' participation; big size of land holding; motivation, risk preferences, scientific possessed more number of animals; orientation, attitude towards NWDPRA, availability of irrigation water; higher knowledge about watershed management cropping intensity; high annual income;

53 Guj. J. Extn. Edu. XII & XIII 2001 & 2002
high level of economic motivation; risk taking capacity; scientific orientation; positive attitude towards NWDPRA; and good knowledge of watershed management technology; higher involvement with information sources and better contact with extension agencies.
CONCLUSION
It can be concluded that majority of the beneficiaries of NWDPRA had medium level of extent of adoption of watershed management technology. Majority of them had adopted simple and no cost or low cost technologies such as short duration varieties, inter culturing, hand weeding and use of organic manures. It was interesting to note that none of the beneficiaries had adopted costly and complex technology such as sprinkler/drip irrigation, recharging of well and use of herbicides.
REFERENCES
Karkar, B. R. 1998. Impact of National Watershed Development Project for Rain fed Areas on farmers l knowledge and adoption of rain fed agro technology.
Shah, V. D. and Pate~, V. G. 1996. Impact of National Watershed Development Project for Rain fed Areas in Gujarat, Agro Economic Research Centre, S. P. University, V. V. Nagar; Res. Study No. 102.
Sengupta. 1967. A simple adoption scale used for H. Y. V. Programme for rice, Indian Journal of Extension Education, 3(3): 107115.
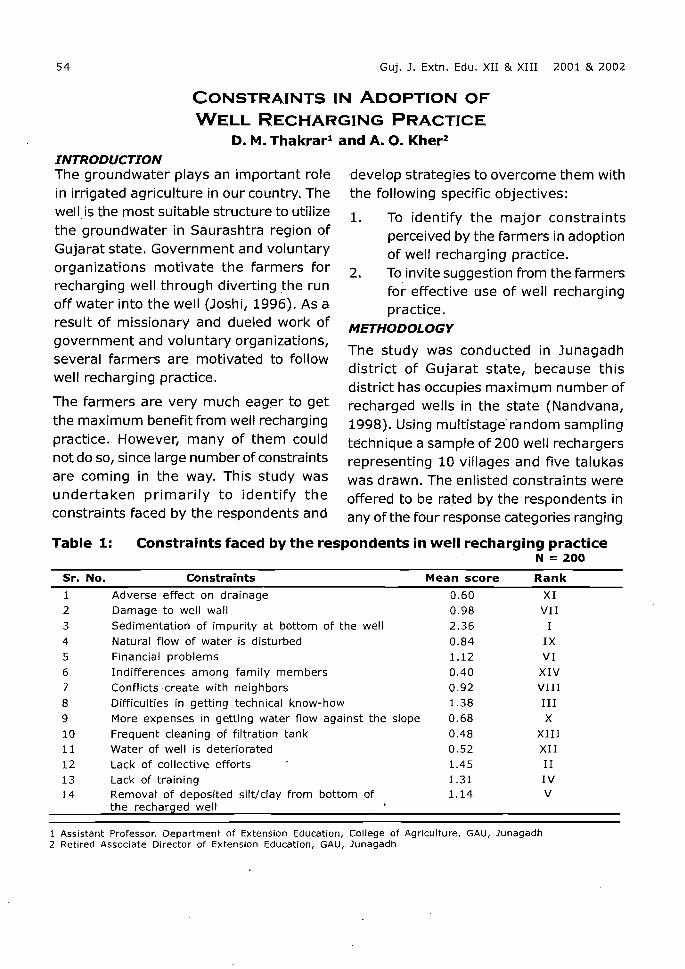
54 Guj. J. Extn. Edu. XII & XIII 2001 & 2002
CONSTRAINTS IN ADOPTION OF
WELL RECHARGING PRACTICE D. M. Thakrar1 and A. O. Kher2
INTRODUCTION . The groundwater plays an important role -develop strategies to overcome them with in irrigated agriculture in our country. The the following specific objectives:
well. is the most suitable structure to utilize 1. To identify the major constraints the groundwater in Saurashtra region of perceived by the farmers in adoption Gujarat state. Government and voluntary of well recharging practice. organizations motivate the farmers for 2. To invite suggestion from the farmers recharging well through diverting the run for effective use of well recharging off water into the well (Joshi, 1996). As a practice. result of missionary and dueled work of METHODOLOGY
government and voluntary organizations, The study was conducted in Junagadh several farmers are motivated to follow district of Gujarat state, because this
well recharging practice. district has occupies maximum number of
The farmers are very much eag.er to get recharged wells in the state (Nandvana, the maximum benefitfrom well recharging 1998). Using multistage· random sampling practice. However, many of them could technique a sample of 200 well rechargers not do so, since large number of constraints representing 10 villages and five talukas are coming in the way. This study was was drawn. The enlisted constraints were undertaken primarily to identify the offered to be rated by the respondents in constraints faced by the respondents and any of the four response categories ranging
Table 1: Constraints faced by the respondents in well recharging practice N =200
Sr. No. Constraints Mean score Rank
1 Adverse effect on drainage 0.60 XI 2 Damage to well wall 0.98 VII 3 Sedimentation of impurity at bottom of the well 2.36 I
4 Natural flow of water is disturbed 0.84 IX 5 Financial problems 1.12 VI 6 Indifferences among family members 0.40 XIV 7 Conflicts create with neighbors 0.92 VIII 8 Difficulties in getting technical know-how 1.38 III 9 More expenses in getting water flow against the slope 0.68 X
10 Frequent cleaning of filtration tank 0.48 XIII 11 Water of well is deteriorated 0.52 XII 12 Lack of collective efforts 1.45 II 13 Lack of training 1.31 IV 14 Removal of deposited silt/clay from bottom of 1.14 V
the recharged well
1 Assistant Professor, Department of Extension Education, College of Agriculture, GAU, Junagadh 2 Retired Associate Director of Extension Education, GAU, Junagadh

55 Guj. J. Extn. Edu. XII & XIII 2001 & 2002
Table 2: Suggestion to overcome the constraints in well recharging practice N = 200
Sr. No. Suggestions Per cent Rank 1 Ideal demonstration should be organized at each village 70.0 III 2 Inner will should be created among farmers to 61.0 IV
follow this practice 3 NGOs and Govt. should come forward to 45.50 V
campaign intensively 4 Training should be imparted to farmers 77.0 I 5 Collective efforts should be made for 72.0 II
obtaining maximum benefits 6 Enough financial help should be provided by 19.0 VII
Govt./NGOs to mitigate big expenses
from most important to not important. The mean score was work out for each constraint and on the basis of mean score, ranks were assigned. The suggestions to overcome the constraints were invited openly from respondents. The frequency and percentage were calculated and ranked were assigned. The data were collected by personal interview and analyzed in the light of objectives.
RESUL7'sAND DISCUSSION
CONSTRAINTS
The constraints perceived by the farmers with respect to well recharging practice are presented in form of mean score and rank in Table l.
It is obvious from Table 1 that the major constraints faced by the respondents include sedimentation of impurity at bottom of the well, lack of collective efforts, difficulties in getting technical know-how and lack of training.
SUGGESTIONS TO OVERCOME
CONSTRAINTS
To overcome the constraints in adoption of well recharge practice, suggestions were invited openly from well recharges. The suggestions received are presented in Table 2.
The data in Table 2 indicate that the major suggestions to overcome the constraints in adoption of well recharging practices offered by the respondents were that 'training should be imparted to farmers' and 'collective efforts should be made' for obtaining maximum benefits. It was also been suggested that 'ideal demonstration should be organized at each village'.
CONCLUSION
The farmers perceived the sedimentation of impurities in well and lack of collective efforts of well recharging as the key constraints. It was suggested by the respondents to impart training on the aspect and to put collective efforts for well recharging to be effective.
REFERENCE
Joshi, B.H. 1996. Innovation towards
resource utilization - recharging of Well in
Saurashtra region, thesis (Ph. D.), Saurashtra
University, Rajkot.
Nandvana, S. N. 1998. A study on farmers
knowledge about well recharge practice,
Special problem (unpublished), Department
of Extension Education, College of
Agriculture, GAU, Junagadh.

56 Guj. J. Extn. Edu. XII & XIII 2001 & 2002
CONSTRAINTS EXPERIENCED BY GROWERS IN ADOPTION OF
RECOMMENDED CHILLI TECHNOLOGY
M. R. PrajapatP, V. T. PateF, N. V. Chaudhary3 and M. C. Soni4
INTRODUCTION
Chilli crop occupies a large area in Banaskantha District. However, the yield per hectare is low as compared to the yield harvested in other districts of the state. Further, the yield of chilli crop is decreasing since last three to four years. Low yield per unit area can be attributed to the number of yield affecting factors such as low productivity of land, lack of knowledge of technology on the part of chilli growers, low adoption of recommended cultivation technology, etc. An attempt has been made to make a complete analysis of the factors affecting process of adoption of innovations with the following specific objectives:
(1) To study the extent of adoption of recommended practices of chilli crop.
(2) To study the constraints experienced by the chilli growers in adoption of recommended practices.
(3) To acquire the suggestions of chilli growers to overcome the constraints in adoptiori of recommended practices.
METHODOLOGY
The present study was conducted in the Banaskantha district of Gujarat State. The
district consists of eleven talukas from which Kankrej taluka was selected purposively, as it covers more area under chilli crop. Twelve villages from the taluka and ten farmers from each village were selected randomly, that constituted a sample of 120 respondents. An interview schedule was prepared in view of the objectives of the study and data were collected by personal interview of the selected chilli growers.
RESULTS AND DISCUSSION
EXTENT OF ADOPTION
It is evident from the Tabel 1 that majority of the chilli growers (70.nO per cent) had moderately adopted the recommended chilli cultivation technology. There were 20.83 and 9.17 per cent of the farmers having low and high level of adoption, respectively.
CONSTRAINTS EXPERIENCED BY THE FARMERS
The constraints experienced by the chilli
growers in adoption of recommended chilli
cultivation practices are presented in Table
2. Almost all the respondents come across
constraints in adoption of recommended
1 Associate Professor, Department of, Extension Education, CPCA, GAU, SKNagar 2 Assistant Professor, Department of Extension Education, CPCA, GAU, SKNagar 3 Assistant Professor, Department of Extension Education, CPCA, GAU, SKNagar 4 Professor, Department of Extension Education, CPCA, GAU, SKNagar

57 Guj. J. Extn. Edu. XII & XIII 2001 & 2002
Table 1: Distribution of respondents according to their extent of adoption of chilli cultivation practices N =120
Sr. No. Extent of adoption Frequency Per cent
1. Low level (up to 7) 25 20.83
2. Medium level (7.1 to 13) 84 70.00
3. High level (above 13) 11 9.17
Total 120 100.00 Mean = 9.7917 S.D. = 2.7794
chilli cultivation practices. The lack of considered to be important constraints by knowledge pertaining to recommended chilli growers. variety (94.16 per cent) and recommended fertilizers (85.00 per cent) were the key SUGGESTIONS EXPRESSED BY CHILLI
GROWERSconstraints experienced by chilli growers.
The chilli growers were also asked to giveThe 'unavailability of fertilizers in time and their constructive suggestions for gettinginadequate quantity' (85.83 per cect); better yield of chilli crop. The data given 'erratic and inadequate power supply' in Table :3 indicate that for increasing yield (84.16 per cent); 'lack of knowledge of chilli, leaf curl disease resistant varietyregarding plant protection measures' should be developed and chemical(84.16 per cent) and 'high rates of chemical fertilizers should be made available to thefertilizers' (84.16 per cent) were also
Table 2: Constraints faced by farmers in adoption of recommended chilli cultivation practices
Sr. No. Constraints Frequency Per cent Rank
1. Lack of knowledge regarding recommended variety 113 94.16 I
2. Unavailability of fertilizers in time and 103 85.83 II in adequate quantity
3. Lack of knowledge pertaining to 102 85.00 III recommended fertilizers
4. Erratic & inadequate power supply 101 84.16 IV
5. Lack of knowledge regarding plant 101 84.16 IV protection measures
6. High rates of chemical fertilizers 101 84.16 IV
7. High rates of pesticides 93 77.5 V
8. Lack of knowledge about recommended 89 74.16 VI irrigation practices
VII9. High rates of electricity 83 69.16
10. Non availability of seed of recommended variety 76 63.33 VIII
11. Poor germination of seed 68 56.66 IX

58 Guj. J. Extn. Edu. XII & XIII 2001 & 2002
Table 3: Suggestions expressed by chilli growers to overcome the constraints regarding adoption ofthe recommended chilli cultivation technology
Sr. No. Suggestions Frequency Per cent Rank
1. Resistant variety of chilli crop against leaf curl disease should be developed
97 80.83
2. Chemical fertilizers should timely and adequately
be available 82 68.33 II
3. Seed of recommended variety should available timely and adequately
be 72 60.00 IV
4. Training regarding chilli cultivation technology should be imparted
69 57.50 V
5. Power supply should be regular and adequate 67 55.83 VI
6. Pesticides should be available at lower rate 62 51.67 VII
farmers in time and in adequate quantity were the most important suggestions expressed by the farmers.
CONCLUSION
Based on the findings of the study it can be concluded that majority of the chilli growers had medium level of adoption of recommended chilli cultivation practices. Lack knowledge about recommended variety of chilli and unavailability of
chemical fertilizers in time and in adequate quantity were the major constraints faced by the farmers in adoption of chilli cultivation practices.
Number of suggestions were expressed by the farmers for getting better yield of chilli crop include developing leaf curl resistant variety, timely supply of chemical fertilizers in adequate quantity and removal of middleman from chilli marketing.
59 Guj. J. Extn. Edu. XII & XIII 2001 & 2002
DAILY WORK SCHEDULE OF RURAL WOMEN OF
JUNAGADH DISTRICT
M. K. Bariya1 and K. A. Thakkar2
INTRODUCTION RESUL TS AND DISCUSSION
Women perform variety of tasks both on The results regarding time spent by rural farm as well as at home. They have not women on household task, livestock only to attend to various field operations management and agricultural operation are like transplanting, weeding crops and presented below: scaring birds but also are practically in AVERAGE TIME SPENT ON HOUSEHOLD complete charge of many harvest and post WORK harvest operations like harvesting, Ten different types of activities were threshing, winnowing and storage. earmarked, in which rural women remain Attending the farm animals and saving farm engaged for their daily, weekly and waste for use either as fuel or manure all seasonal works. The information regarding have been predominantly considered as this aspect is presented in Table 1. work of women. The entire management A perusal of Table 1 reveal that on an of livestock starting from cutting, average; 6.23 hours were spent by rural collection, carrying and chaffing of fodder; women in completing the household chores to feeding and milking; preparation of milk daily of which maximum time i.e. 2.53 hours products; cleaning cattle shed; collection were spent on cooking and serving food. of urine and cow dung for manure pits; On the other hand, very less time i.e. 17 preparation of cow dung cakes and their minutes were spent in bringing water. storage; are done by women. Rural women spent 1.45 hours for care of Over and above food preparation, rural their children. It was observed that older women also do all cleaning operations like women are to look after young children. removal of stones, de-husking and other Women spent only 1.24 hours for activities laborious household duties. Thus, they carry related to their personal care. a great deal of work in agriculture as well Washing clothes is generally done every as in livestock management. The present alternate day. Women were found spending study is therefore, planned to know the 52 minutes for this task. This clearly daily work schedule of the rural women. indicated that on an average 26 minutes/ METHODOLOGY day were being consumed for washing the The present was conducted in Junagadh clothes. district of Gujarat State. Two talukas and The weekly work include ghee making, five villages from each taluka were selected plastering floors, drying and cleaning grains, at random. Using proportionate random etc. Rural women took up drying and sampling technique, 105 respondents were cleaning of grains on weekly basis. The selected from the 10 selected villages. average time spent on ghee making, 1 Lecturer, Home Science College, Mahesana 2 Associate Extension Educationist, ASPEE College of Home Science, GAU, S. K. Nagar

60 Guj. J. Extn. Edu. XII & XIII 2001 & 2002
Table 1: Average time spent bY.rural women on household tasks N = 105
Sr. Household work Hours Spent No. Daily Weekly Seasonal
1 Cleaning and arranging house 0.55
2. Washing clothes 0.26
3. Bringing water 0.17
4. Cooking and serving 2.35
5. Churning milk and ghee making 0.21 0.50
6. Preparation of non-perishable food 20-25 (pickles, dal, papad, masala, etc.)
7. Plastering floors 1.16
8. Grain storage (drying, cleaning etc.) 1.19 14-15
9. Child cares (bathing, feeding, make 1.45 them ready for school, etc.)
10. Personal cares (taking meal, rest, etc.) 1.24
TOTAL 6.23 2.85 34-40
plastering floors, and grain storage was 0.50, 1.16, and 1.19 hours per week respectively.
The household activities carried seasonally include preparation of non-perishable foods (making dal, papad, pickles, masala, etc.) and grain storage (drying and cleaning) which accounted for 20-25 hours and 1415 hours per season respectively.
TIME SPENT IN UVESTOCK MANAGEMENT
The data regarding time spent by the rural women on livestock management are presented in Table 2. The data in Table 2 reveal that on an average, rural women spent 3.49 hours per day for animal based tasks. It has been observed that very little
time (31 minutes) was spent on brining fodder for the cattle because most of the rural women were found living at the farms. On the other hand, women were found to spent higher time (1.40 hours) in cleaning cattle shed, dung collection, dung removing, and in making dung cakes.
TIME SPENT ON AGRICULTURAL
ACTIVITIES
The data presented in Table 3 show that agricultural work was seasonal. During the peak season of harvesting operations, rural women spent 7.30 hours in the field, which is almost a full day. The operations include harvesting the crop, collecting the crop, threshing winnowing, drying & cleaning of
Table 2: Average time spent by rural women in livestock managementN = 105
Sr. No. Livestock activities Hours spent (daily)
1. Cleaning cattle shed, dung collection, 1.40 dung removing, making dung cakes, etc.
2. Feeding cattle, watering cattle, cattle milking, etc. 1.37
3. Bringing fodder for the cattle 0.31
TOTAL 3.49

61 Guj. J. Extn. Edu. XII & XIII 2001 & 2002
Table 3: Average time spent by rural women on agricultural activitie N =105
Sr. No. Agricultural work Time spent ( hours)
1 Pre sowing and sowing operations
1. Application of manure 5.31 2. Maintenance of agricultural implements 0.39 3. Selection and treatment of seeds 1. 50 4. To help farmers at sowing time 6.43
2. Intercultural operations
1. Filling gaps after transplantation 3.50 2. Irrigation 1.33 3. Weeding 7.12 4. Fertilizer application 3.32 5. Watching standing crop 1.22
3. Harvest and post harvest operations
1. Harvesting the crops 7.30 2. Collecting the crops 7.30 3. 'Threshing 7.30 4. Winnowing 7.30 5. Drying and cleaning grains 7.30 6. Storing and treating the grains of the seeds 7.30
TOTAL 73.93
grains, storing and treating the grains & seeds. As a result, during peak season, women could not pay any attention to her daily work including taking care of her children.
The analysis of data on time spent by rural women for pre sowing and sowing operations were carried out and the results are depicted in the table 3. It has been observed that the average' time spent by rural women for application of manure was 5.32 hours and for maintenance of agricultural implements was 0.39 hours. The corresponding values for the other operations viz., selection and treatment of seeds and to help farmers at sowing time were 1.50 hours and 6.43 hours respectively.
It was further observed that for various intercultural activities like filling gaps after transplantation and weeding; rural women were spending 3.50 hours and 7.30 hours respectively. It was also observed that in the absence of male members, the women
contribute 3.32 hours for fertilizer application and 1.33 hours for irrigation. Elderly people of the community exclusively take the job of watching standing crop for nearly 1.30 hours.
CONCLUSION
Rural women were found to spend 6.37 hours a day in completing household chores and 3.49 hours per day on animal based tasks. During the peak season of agriculture, women spent almost full day for various agricultural operations. The present study clearly indicated that in addition to household tasks, the rural women contribute a lot in various agricultural operations. The rural women also perform most of the animal based tasks.
Hence, they should be trained in various skills related to scientific farming and daring. It will help to boost up present agricultural production.


Society of Extension Education,
Office of Associate Director of Extension Education,
G.A.U., Anand - 388 110 INDIA
The membership fees of S. E. E.G. and Rates of Advertisement are as under with effect from 1St May 2001.
A. Membership Fees:
i) Ordinary/student member Rs. 150/ - Yearly
ii) Life member Rs. 800/
iii) Corporate / institutional member Rs. 1000/- for 15 years
iv) Patrons (Individual or Institution) Rs. 5000/- or more
v) Library subscription Rs. 150/- (annually for single volume)
vi) Library subscription Rs. 250/- (Combined volume of two
years)
B. Seminar Participation Fees: (for one day seminar)
i) Member of S.E.E.G Rs. 100/
ii) For Non-members Rs. 200/
C. Rates of Advertisements (Journal or Souvenir)
i) Full Page (inner) Rs. 1200/
ii) Half Page (inner) Rs. 600/
iii) Quarter Page (inner) Rs. 300/
iv) Cover Page (3rd) Rs. 1500/
v) Cover Page (4th) Rs. 2500/
All remittances and correspondence relating to subscription, membership, advertisement etc. should be addressed to Secretary-cum- Treasurer, Society of Extension Education, Office of Associate Director of Extension Education (zone), Gujarat Agricultural University, Anand-388 110 (Gujarat). The Demand Draft should be issued in favor of 'SOCIETY OF EXTENSION EDUCATION, ANAND, (GUJARAT)' payable at Anand.
Secretary / Treasurer

Published by : Dr. Ashok Patel for the Society of Extension Education, Anand (Gujarat) Printed by: Neel Design, 12 Vijay Shopping Centre, Sector-ii, Gandhinagar. Tel. : (079) 3241863