Skewness in Stock Returns: Reconciling the Evidence on Firm versus Aggregate Returns Rui Albuquerque...
23
Skewness in Stock Returns: Skewness in Stock Returns: Reconciling the Evidence on Firm Reconciling the Evidence on Firm versus Aggregate Returns versus Aggregate Returns Rui Albuquerque Rui Albuquerque Discussion by: Discussion by: Ma Ma rcin Kacperczyk rcin Kacperczyk (NYU and NBER) (NYU and NBER)
-
Upload
alexina-may -
Category
Documents
-
view
218 -
download
3
Transcript of Skewness in Stock Returns: Reconciling the Evidence on Firm versus Aggregate Returns Rui Albuquerque...

Skewness in Stock Returns: Reconciling the Skewness in Stock Returns: Reconciling the Evidence on Firm versus Aggregate ReturnsEvidence on Firm versus Aggregate Returns
Rui AlbuquerqueRui Albuquerque
Discussion by: Discussion by: MaMarcin Kacperczykrcin Kacperczyk (NYU and NBER) (NYU and NBER)

22
Motivation: Firm-Level SkewnessMotivation: Firm-Level Skewness

33
Motivation: Aggregate SkewnessMotivation: Aggregate Skewness
44
This Paper: Firm SkewnessThis Paper: Firm Skewness
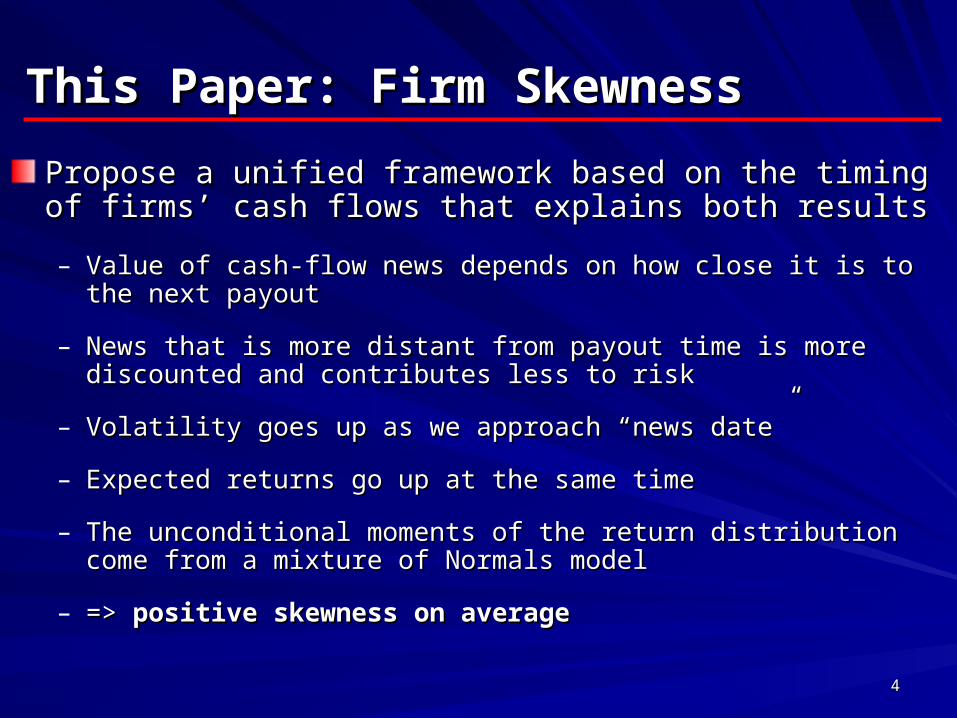
Propose a unified framework based on the timing of firms’ Propose a unified framework based on the timing of firms’ cash flows that explains both resultscash flows that explains both results
– Value of cash-flow news depends on how close it is to the next payoutValue of cash-flow news depends on how close it is to the next payout
– News that is more distant from payout time is more discounted and News that is more distant from payout time is more discounted and contributes less to riskcontributes less to risk
– Volatility goes up as we approach “news date”Volatility goes up as we approach “news date”
– Expected returns go up at the same timeExpected returns go up at the same time
– The unconditional moments of the return distribution come from a The unconditional moments of the return distribution come from a mixture of Normals modelmixture of Normals model
– => => positive skewness on averagepositive skewness on average

55
This Paper: Aggregate SkewnessThis Paper: Aggregate Skewness
Implications for aggregate skewnessImplications for aggregate skewness
– Skewness of aggregate returns = Skewness of aggregate returns =
– average stock skewness (positive on average) +average stock skewness (positive on average) +
– coskewness (negative on average) [low return on one stock coincides coskewness (negative on average) [low return on one stock coincides with high volatility of the remaining stocks]with high volatility of the remaining stocks]
– Negative coskewness induced by heterogeneity in news timing Negative coskewness induced by heterogeneity in news timing => => negative portfolio skewnessnegative portfolio skewness

66
Summary of the ResultsSummary of the Results
Firm-level skewness is positive on averageFirm-level skewness is positive on average
Firm-level skewness is greater than the aggregate skewnessFirm-level skewness is greater than the aggregate skewness
Market skewness is almost always negativeMarket skewness is almost always negative
Skewness of a portfolio of first-week announcers and k-week Skewness of a portfolio of first-week announcers and k-week announcers (within quarter) is U-shaped in kannouncers (within quarter) is U-shaped in k
Industries with greater dispersion of earnings announcement Industries with greater dispersion of earnings announcement dates have more negative coskewnessdates have more negative coskewness
Skewness of a portfolio with different k’s decreases in the Skewness of a portfolio with different k’s decreases in the number of k’s and can be negativenumber of k’s and can be negative

77
Comment 1: MotivationComment 1: Motivation
The paper lays out a model to explain particular features of the The paper lays out a model to explain particular features of the data (skewness)data (skewness)– Why is this particular focus economically important? (negative skewness Why is this particular focus economically important? (negative skewness
can arise naturally in a statistical exercise)can arise naturally in a statistical exercise)
Suggestions:Suggestions:– Focus the paper on the mechanism rather than outcome (few of the Focus the paper on the mechanism rather than outcome (few of the
previous “skew” papers aim to merely explain skewness)previous “skew” papers aim to merely explain skewness)
– Derive asset pricing predictions that nest skewness results (e.g., following Derive asset pricing predictions that nest skewness results (e.g., following Kraus & Litzenberger (1976) and other studies)Kraus & Litzenberger (1976) and other studies)
– Implications for portfolio diversification / volatility patterns in optionsImplications for portfolio diversification / volatility patterns in options
– Does your framework reject competing hypotheses (leverage effect; Does your framework reject competing hypotheses (leverage effect; asymmetric volatility)? Where do they fail?asymmetric volatility)? Where do they fail?
– Why do firms not internalize the impact of their disclosure on equilibrium Why do firms not internalize the impact of their disclosure on equilibrium pricing (cost of capital)? How about dividend policy? Do managers alter pricing (cost of capital)? How about dividend policy? Do managers alter their policy?their policy?

88
Comment 2: Theoretical SetupComment 2: Theoretical Setup
This is a model in which skewness plays a central role, yet This is a model in which skewness plays a central role, yet the preferences do not incorporate it directlythe preferences do not incorporate it directly– Justifiable from modeling perspective, but this is a paper about Justifiable from modeling perspective, but this is a paper about
skewness…and investors do not care about itskewness…and investors do not care about it
In the model, volatility and conditional mean returns increase In the model, volatility and conditional mean returns increase as we come closer to the payout dateas we come closer to the payout date– Effect on volatility is pretty clear (discounting of news)Effect on volatility is pretty clear (discounting of news)
– Effect on mean less clear: why do variance terms (↑ with k) dominate Effect on mean less clear: why do variance terms (↑ with k) dominate covariance terms (ambiguous)? In the paper, only 12 stocks form the covariance terms (ambiguous)? In the paper, only 12 stocks form the market, so volatility may dominate; diversification should matter more market, so volatility may dominate; diversification should matter more as we increase N. Need to explain better how N affects conditional as we increase N. Need to explain better how N affects conditional mean (otherwise the positive skewness story is not clear)mean (otherwise the positive skewness story is not clear)
– A possible effect on kurtosis (fat tails)A possible effect on kurtosis (fat tails)
Market is defined as an equal-weighted portfolio. Why?Market is defined as an equal-weighted portfolio. Why?
99
Comment 3: Model-Data MappingComment 3: Model-Data Mapping
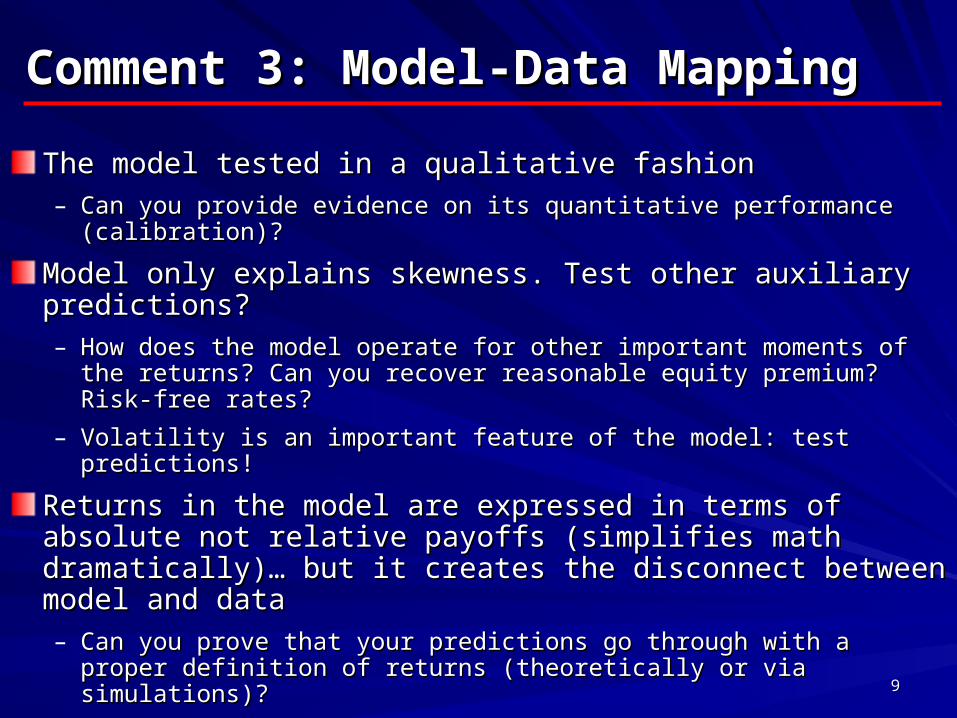
The model tested in a qualitative fashionThe model tested in a qualitative fashion– Can you provide evidence on its quantitative performance (calibration)?Can you provide evidence on its quantitative performance (calibration)?
Model only explains skewness. Test other auxiliary predictions?Model only explains skewness. Test other auxiliary predictions?– How does the model operate for other important moments of the How does the model operate for other important moments of the
returns? Can you recover reasonable equity premium? Risk-free rates?returns? Can you recover reasonable equity premium? Risk-free rates?
– Volatility is an important feature of the model: test predictions!Volatility is an important feature of the model: test predictions!
Returns in the model are expressed in terms of absolute not Returns in the model are expressed in terms of absolute not relative payoffs (simplifies math dramatically)… but it creates relative payoffs (simplifies math dramatically)… but it creates the disconnect between model and datathe disconnect between model and data– Can you prove that your predictions go through with a proper definition Can you prove that your predictions go through with a proper definition
of returns (theoretically or via simulations)?of returns (theoretically or via simulations)?

1010
Comment 3: Time-Series VariationComment 3: Time-Series Variation
The motivating regularities change over time. Can you explain The motivating regularities change over time. Can you explain these differences within your (static) model?these differences within your (static) model?
Period Aggregate Skew Firm Skew1973-1986 0.0176 0.2790***
(0.0608) (0.0257)1987-1999 -0.5778*** 0.1622***
(0.0892) (0.0433)2000-2010 -0.0575 0.1655***
(0.0527) (0.0273)

1111
Comment 4: Empirical ResultsComment 4: Empirical Results
This paper: relate skewness to heterogeneity in This paper: relate skewness to heterogeneity in announcements (dividends/earnings)announcements (dividends/earnings)– Model: All companies pay out dividends; Data: ~50% pay outModel: All companies pay out dividends; Data: ~50% pay out
– Focus on earnings announcements (less sample selection bias)Focus on earnings announcements (less sample selection bias)
1212
Comment 4: Empirical ResultsComment 4: Empirical Results
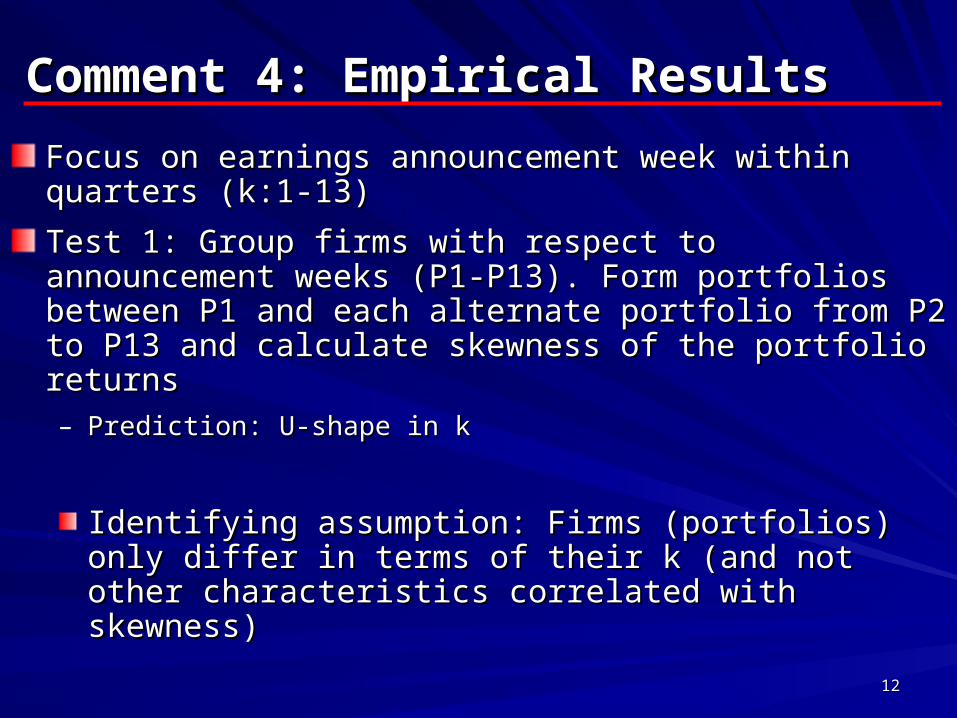
Focus on earnings announcement week within quarters (k:1-13)Focus on earnings announcement week within quarters (k:1-13)
Test 1: Group firms with respect to announcement weeks (P1-Test 1: Group firms with respect to announcement weeks (P1-P13). Form portfolios between P1 and each alternate portfolio P13). Form portfolios between P1 and each alternate portfolio from P2 to P13 and calculate skewness of the portfolio returnsfrom P2 to P13 and calculate skewness of the portfolio returns– Prediction: U-shape in kPrediction: U-shape in k
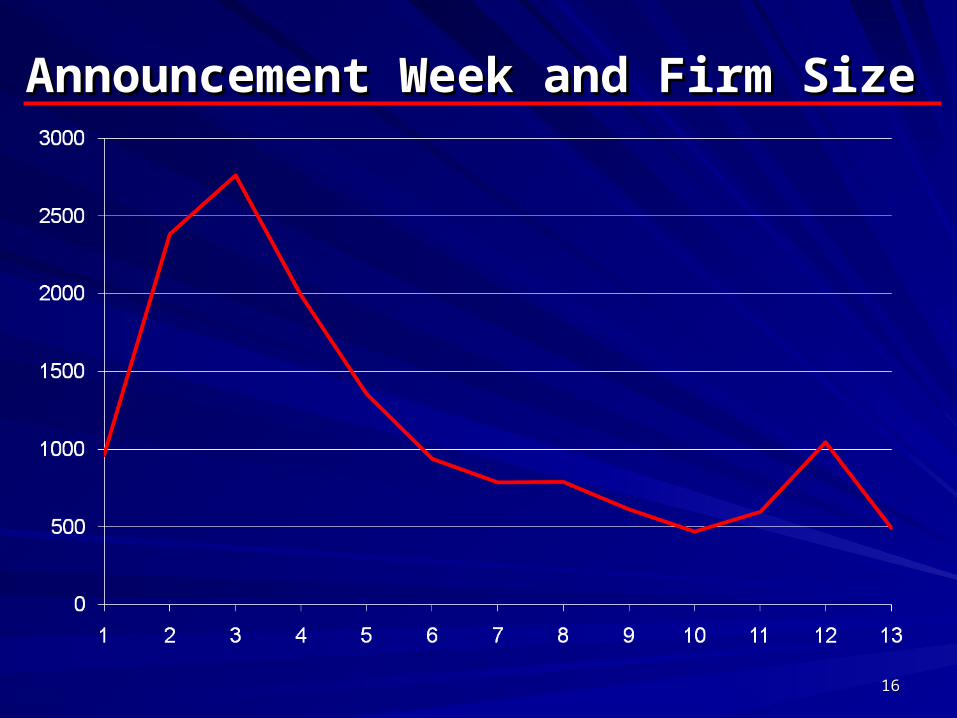
Identifying assumption: Firms (portfolios) only differ in terms Identifying assumption: Firms (portfolios) only differ in terms of their k (and not other characteristics correlated with of their k (and not other characteristics correlated with skewness)skewness)

1313
Distribution of AnnouncementsDistribution of Announcements

1414
Test 1: ResultsTest 1: Results

1515
Announcement Week and SkewnessAnnouncement Week and Skewness
1616
Announcement Week and Firm SizeAnnouncement Week and Firm Size

1717
Announcement Week and Firm VolumeAnnouncement Week and Firm Volume

1818
Announcement Week and Firm B/MAnnouncement Week and Firm B/M

1919
Comment 4: Empirical ResultsComment 4: Empirical Results
Test 2: Form portfolios between P1 and each additional Test 2: Form portfolios between P1 and each additional portfolio from P2 to P13portfolio from P2 to P13– Prediction: Decreasing in kPrediction: Decreasing in k
Earnings are assumed to be the only news items. Other news Earnings are assumed to be the only news items. Other news items might be relevant: Information flow becomes continuousitems might be relevant: Information flow becomes continuous– Portfolios with more continuous flow should have less declining patternPortfolios with more continuous flow should have less declining pattern
– Condition on firm size: large firms are likely to have more continuous Condition on firm size: large firms are likely to have more continuous flowflow
– Large (Small) portfolio: 33% largest (smallest) firms in the empirical Large (Small) portfolio: 33% largest (smallest) firms in the empirical distributiondistribution

2020
Test 2: ResultsTest 2: Results

2121
Test 2: Small StocksTest 2: Small Stocks

2222
Test 2: Large StocksTest 2: Large Stocks

2323
ConclusionsConclusions
Ambitious model with interesting predictionsAmbitious model with interesting predictions
Room for improvement:Room for improvement:– Economic motivationEconomic motivation
– Theoretical setupTheoretical setup
– Calibration to the dataCalibration to the data
– Empirical evidenceEmpirical evidence