What Does Risk-Neutral Skewness Tell Us About … Does Risk-Neutral Skewness Tell Us About Future...
31
What Does Risk-Neutral Skewness Tell Us About Future Stock Returns? University of Miami School of Business Stan Stilger, Alex Kostakis and Ser-Huang Poon MBS 23rd March 2015, Miami Alex Kostakis (MBS) RNS and Stock Returns 23rd March 2015, Miami 1 / 31
Transcript of What Does Risk-Neutral Skewness Tell Us About … Does Risk-Neutral Skewness Tell Us About Future...

What Does Risk-Neutral Skewness Tell Us About FutureStock Returns?
University of Miami School of Business
Stan Stilger, Alex Kostakis and Ser-Huang Poon
MBS
23rd March 2015, Miami
Alex Kostakis (MBS) RNS and Stock Returns 23rd March 2015, Miami 1 / 31
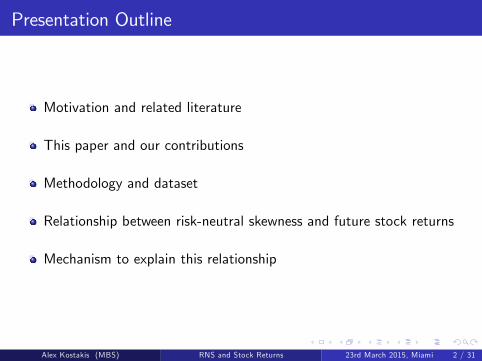
Presentation Outline
Motivation and related literature
This paper and our contributions
Methodology and dataset
Relationship between risk-neutral skewness and future stock returns
Mechanism to explain this relationship
Alex Kostakis (MBS) RNS and Stock Returns 23rd March 2015, Miami 2 / 31
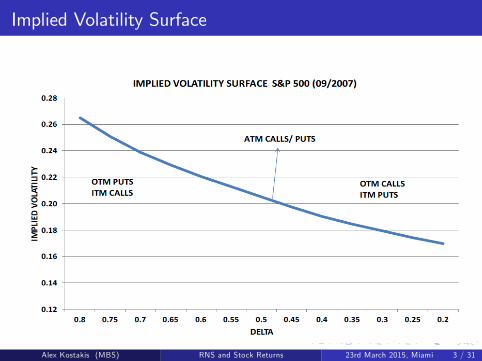
Implied Volatility Surface
Alex Kostakis (MBS) RNS and Stock Returns 23rd March 2015, Miami 3 / 31

Implied Volatility Slope
Alex Kostakis (MBS) RNS and Stock Returns 23rd March 2015, Miami 4 / 31

Implied Volatility Slope and RNS
Alex Kostakis (MBS) RNS and Stock Returns 23rd March 2015, Miami 5 / 31

Motivation and Related Literature
Option-implied information is inherently forward-looking, embeddinginvestors�expectations under Q (Bates, 1991, Jackwerth andRubinstein, 1996)
Option prices contain information for:
1 Future stock returns
Xing et al. (2010): �ve relation between steepness of implied volsmirk and future stock returnsCremers and Weinbaum (2010): +ve relation between call-put impliedvolatility spread and future stock returnsBali and Hovakimian (2009): no relation between RN volatility andfuture stock returns
2 Investment strategies
Kostakis et al. (2011) use option-implied dbns for market timingDe Miguel et al. (2014) use option-implied moments for assetallocation
Alex Kostakis (MBS) RNS and Stock Returns 23rd March 2015, Miami 6 / 31

Related studies on Risk-Neutral Skewness
Bali and Murray (2013) �nd �ve relation between RNS and optionportfolios�returns
Bali et al. (2014) �nd +ve relation between RNS and expected stockreturns derived from �nancial analysts�price targets
Conrad et al. (2013) �nd �ve relation between past quarter averagesof daily RNS values and future realized stock returns.Justify results using standard asset pricing results for (co)skewnessunder P. But RNS is extracted under Q )arguments not applicable.
Rehman and Vilkov (2012) �nd +ve relation between latest availableRNS values and future realized stock returns.Conclusion: Highly �ve RNS is a proxy for overvaluation.
Alex Kostakis (MBS) RNS and Stock Returns 23rd March 2015, Miami 7 / 31
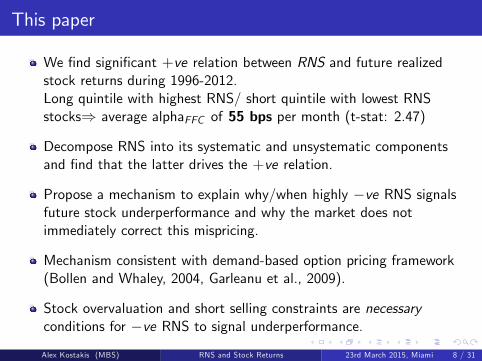
This paper
We �nd signi�cant +ve relation between RNS and future realizedstock returns during 1996-2012.Long quintile with highest RNS/ short quintile with lowest RNSstocks) average alphaFFC of 55 bps per month (t-stat: 2.47)
Decompose RNS into its systematic and unsystematic componentsand �nd that the latter drives the +ve relation.
Propose a mechanism to explain why/when highly �ve RNS signalsfuture stock underperformance and why the market does notimmediately correct this mispricing.
Mechanism consistent with demand-based option pricing framework(Bollen and Whaley, 2004, Garleanu et al., 2009).
Stock overvaluation and short selling constraints are necessaryconditions for �ve RNS to signal underperformance.Alex Kostakis (MBS) RNS and Stock Returns 23rd March 2015, Miami 8 / 31
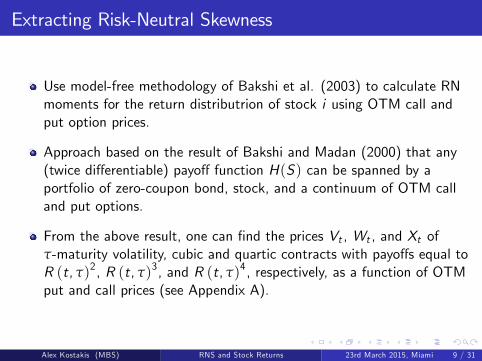
Extracting Risk-Neutral Skewness
Use model-free methodology of Bakshi et al. (2003) to calculate RNmoments for the return distributrion of stock i using OTM call andput option prices.
Approach based on the result of Bakshi and Madan (2000) that any(twice di¤erentiable) payo¤ function H(S) can be spanned by aportfolio of zero-coupon bond, stock, and a continuum of OTM calland put options.
From the above result, one can �nd the prices Vt , Wt , and Xt ofτ-maturity volatility, cubic and quartic contracts with payo¤s equal toR (t, τ)2, R (t, τ)3, and R (t, τ)4, respectively, as a function of OTMput and call prices (see Appendix A).
Alex Kostakis (MBS) RNS and Stock Returns 23rd March 2015, Miami 9 / 31
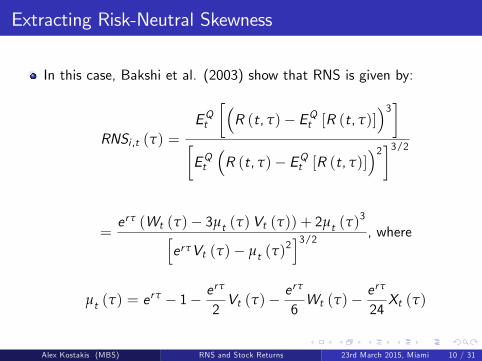
Extracting Risk-Neutral Skewness
In this case, Bakshi et al. (2003) show that RNS is given by:
RNSi ,t (τ) =EQt
��R (t, τ)� EQt [R (t, τ)]
�3��EQt
�R (t, τ)� EQt [R (t, τ)]
�2�3/2
=erτ (Wt (τ)� 3µt (τ)Vt (τ)) + 2µt (τ)
3herτVt (τ)� µt (τ)
2i3/2 , where
µt (τ) = erτ � 1� e
rτ
2Vt (τ)�
erτ
6Wt (τ)�
erτ
24Xt (τ)
Alex Kostakis (MBS) RNS and Stock Returns 23rd March 2015, Miami 10 / 31
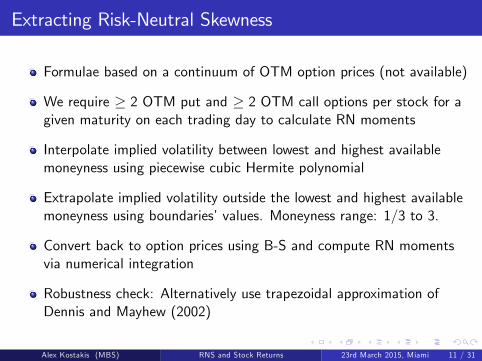
Extracting Risk-Neutral Skewness
Formulae based on a continuum of OTM option prices (not available)
We require � 2 OTM put and � 2 OTM call options per stock for agiven maturity on each trading day to calculate RN moments
Interpolate implied volatility between lowest and highest availablemoneyness using piecewise cubic Hermite polynomial
Extrapolate implied volatility outside the lowest and highest availablemoneyness using boundaries�values. Moneyness range: 1/3 to 3.
Convert back to option prices using B-S and compute RN momentsvia numerical integration
Robustness check: Alternatively use trapezoidal approximation ofDennis and Mayhew (2002)
Alex Kostakis (MBS) RNS and Stock Returns 23rd March 2015, Miami 11 / 31

Dataset
Daily option data with maturities between 10 and 180 days fromOptionMetrics during 1996-2012
Discard options with zero open interest, negative strike, zero bid priceand prices < $0.50
Filter out �rms with < 2 OTM put/ call options for a given maturity
Choose the set of OTM options with shortest maturity
Discard �rms with illiquid options (<10 daily RNS obs in a month)
Benchmark results: 128,960 RNS observations on the last trading dayof the month
CRSP, Compustat and ExecuComp used for �rm characteristics
Alex Kostakis (MBS) RNS and Stock Returns 23rd March 2015, Miami 12 / 31

Descriptive statistics
Alex Kostakis (MBS) RNS and Stock Returns 23rd March 2015, Miami 13 / 31
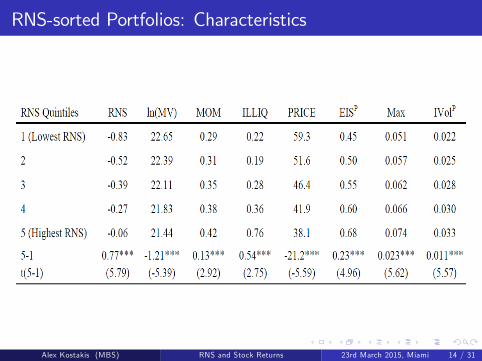
RNS-sorted Portfolios: Characteristics
Alex Kostakis (MBS) RNS and Stock Returns 23rd March 2015, Miami 14 / 31
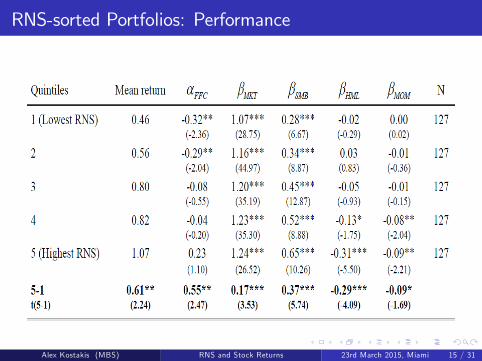
RNS-sorted Portfolios: Performance
Alex Kostakis (MBS) RNS and Stock Returns 23rd March 2015, Miami 15 / 31

Robustness checks
Alex Kostakis (MBS) RNS and Stock Returns 23rd March 2015, Miami 16 / 31

Fama-MacBeth regressions
Alex Kostakis (MBS) RNS and Stock Returns 23rd March 2015, Miami 17 / 31
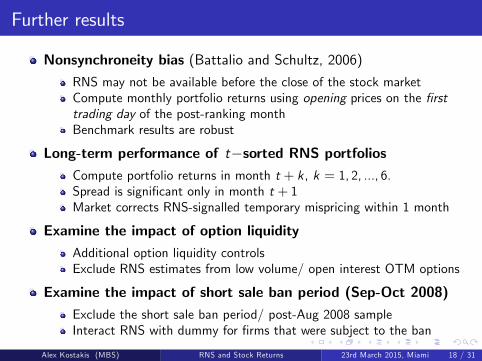
Further results
Nonsynchroneity bias (Battalio and Schultz, 2006)RNS may not be available before the close of the stock marketCompute monthly portfolio returns using opening prices on the �rsttrading day of the post-ranking monthBenchmark results are robust
Long-term performance of t�sorted RNS portfoliosCompute portfolio returns in month t + k, k = 1, 2, ..., 6.Spread is signi�cant only in month t + 1Market corrects RNS-signalled temporary mispricing within 1 month
Examine the impact of option liquidityAdditional option liquidity controlsExclude RNS estimates from low volume/ open interest OTM options
Examine the impact of short sale ban period (Sep-Oct 2008)Exclude the short sale ban period/ post-Aug 2008 sampleInteract RNS with dummy for �rms that were subject to the ban
Alex Kostakis (MBS) RNS and Stock Returns 23rd March 2015, Miami 18 / 31

Decomposing RNS
Following Bakshi et al. (2003), we further decompose RNS into itssystematic and unsystematic components.
Starting from the single-index model under Q, Bakshi et al. (2003)show that:
RNSi ,d ,Systematic = b3i RNV
3/2m,d RNSm,d/RNV 3/2
i ,d ,
where bi is the risk-neutral beta of stock i , and
RNSi ,d ,Unsystematic = RNSi ,d � RNSi ,d ,Systematic
Construct portfolios on the basis of systematic and unsystematic RNSestimates on the last trading day of month t.
Alternative decomposition into RN Coskewness and idiosyncratic RNS
Alex Kostakis (MBS) RNS and Stock Returns 23rd March 2015, Miami 19 / 31

Systematic RNS-sorted portfolios
Alex Kostakis (MBS) RNS and Stock Returns 23rd March 2015, Miami 20 / 31
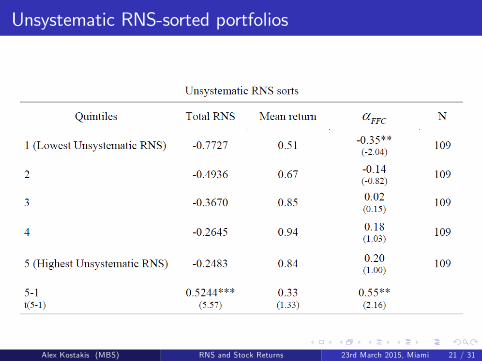
Unsystematic RNS-sorted portfolios
Alex Kostakis (MBS) RNS and Stock Returns 23rd March 2015, Miami 21 / 31

Conjectured Mechanism
1 Why portfolios with highly �ve RNS stocks subsequentlyunderperform?
2 Do all stocks with highly �ve RNS subsequently underperform?If not, which?
3 Why the market does not correct this pattern?
Alex Kostakis (MBS) RNS and Stock Returns 23rd March 2015, Miami 22 / 31
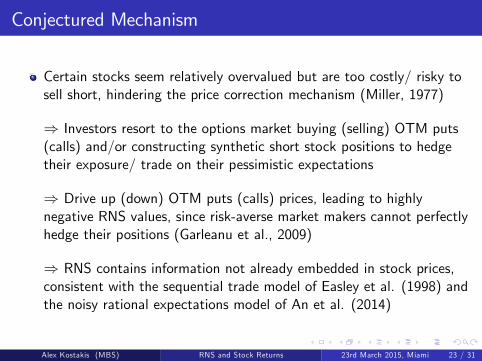
Conjectured Mechanism
Certain stocks seem relatively overvalued but are too costly/ risky tosell short, hindering the price correction mechanism (Miller, 1977)
) Investors resort to the options market buying (selling) OTM puts(calls) and/or constructing synthetic short stock positions to hedgetheir exposure/ trade on their pessimistic expectations
) Drive up (down) OTM puts (calls) prices, leading to highlynegative RNS values, since risk-averse market makers cannot perfectlyhedge their positions (Garleanu et al., 2009)
) RNS contains information not already embedded in stock prices,consistent with the sequential trade model of Easley et al. (1998) andthe noisy rational expectations model of An et al. (2014)
Alex Kostakis (MBS) RNS and Stock Returns 23rd March 2015, Miami 23 / 31

Hedging Motive and Risk-Neutral Skewness
Stocks with stronger hedging motive exhibit more �ve RNS
Alex Kostakis (MBS) RNS and Stock Returns 23rd March 2015, Miami 24 / 31

Proxies for relative overvaluation
Reasons for relative stock overvaluation:Over-optimistic growth expectations/ investors with strong preferencefor lottery-like payo¤s drive up their prices
Such stocks may subsequently underperform if the price correctionmechanism reverses overvaluation
Proxies:
1 EISP : Expected Idiosyncratic Skewness of realized stock returns(Boyer et al., 2011)
2 Max: Maximum daily stock return in past month (Bali et al., 2011)3 Probability of a Jackpot (>100%) stock return over next year(Conrad et al., 2014)
Alex Kostakis (MBS) RNS and Stock Returns 23rd March 2015, Miami 25 / 31

The role of overvaluation: Conditional sorts
Alex Kostakis (MBS) RNS and Stock Returns 23rd March 2015, Miami 26 / 31
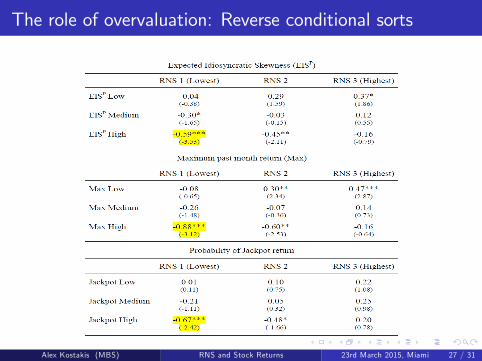
The role of overvaluation: Reverse conditional sorts
Alex Kostakis (MBS) RNS and Stock Returns 23rd March 2015, Miami 27 / 31
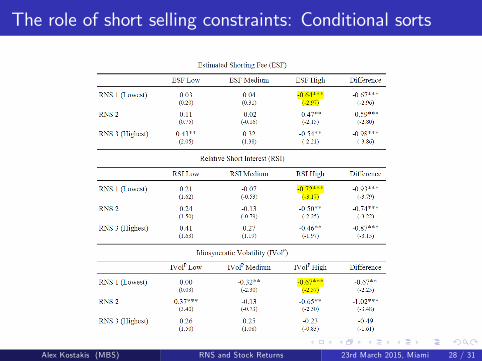
The role of short selling constraints: Conditional sorts
Alex Kostakis (MBS) RNS and Stock Returns 23rd March 2015, Miami 28 / 31
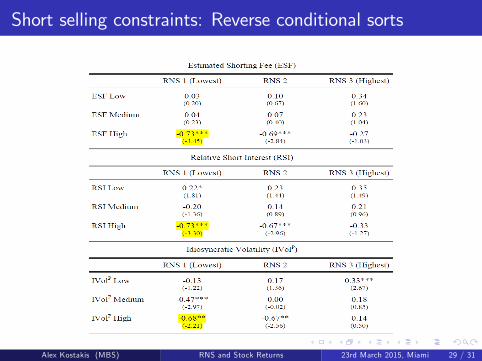
Short selling constraints: Reverse conditional sorts
Alex Kostakis (MBS) RNS and Stock Returns 23rd March 2015, Miami 29 / 31

Trivariate independent portfolio sorts
Overvaluation proxy EISP Max Jackpot
Short selling constraints proxy ESF RSI IVolP ESF RSI IVolP ESF RSI IVolP
P1RNS L &
Overvaluation L &Constraints L
0.13(0.89)
0.17(1.30)
0.03(0.28)
0.19(1.52)
0.21*(1.75)
0.07(0.65)
0.05(0.42)
0.11(0.93)
0.03(0.31)
P2RNS L &
Overvaluation L &Constraints H
0.27(1.34)
0.35*(1.81)
0.10(0.41)
0.30*(1.71)
0.36*(1.89)
0.00(0.02)
0.35*(1.66)
0.63***(3.01)
0.05(0.14)
P3RNS L &
Overvaluation H &Constraints L
0.05(0.28)
0.15(0.99)
0.03(0.20)
0.12(0.73)
0.12(0.71)
0.49***(2.58)
0.19(0.73)
0.29(0.90)
0.11(0.42)
P4RNS L &
Overvaluation H &Constraints H
0.49**(2.45)
0.61***(3.18)
0.87***(3.48)
0.65***(3.20)
0.64***(3.33)
0.76***(2.73)
0.63***(3.15)
0.57***(2.89)
0.66**(2.46)
P5RNS H &
Overvaluation L &Constraints L
0.30(1.52)
0.32(1.58)
0.48***(3.26)
0.50***(2.76)
0.52***(2.73)
0.36**(2.50)
0.40**(2.03)
0.41*(1.95)
0.26(1.58)
P6RNS H &
Overvaluation L &Constraints H
0.15(0.65)
0.16(0.70)
0.07(0.27)
0.09(0.41)
0.12(0.65)
0.31(1.10)
0.09(0.33)
0.00(0.02)
0.07(0.22)
P7RNS H &
Overvaluation H &Constraints L
0.36(1.60)
0.11(0.43)
0.27*(1.65)
0.12(0.54)
0.07(0.28)
0.06(0.26)
0.31(1.15)
0.40(1.35)
0.30(1.19)
P8RNS H &
Overvaluation H &Constraints H
0.41*(1.85)
0.22(1.09)
0.28(1.23)
0.47**(2.12)
0.38*(1.80)
0.31(1.31)
0.37(1.63)
0.31(1.40)
0.07(0.29)
Alex Kostakis (MBS) RNS and Stock Returns 23rd March 2015, Miami 30 / 31
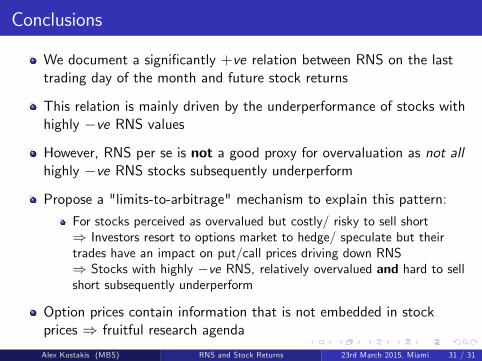
Conclusions
We document a signi�cantly +ve relation between RNS on the lasttrading day of the month and future stock returns
This relation is mainly driven by the underperformance of stocks withhighly �ve RNS values
However, RNS per se is not a good proxy for overvaluation as not allhighly �ve RNS stocks subsequently underperform
Propose a "limits-to-arbitrage" mechanism to explain this pattern:
For stocks perceived as overvalued but costly/ risky to sell short) Investors resort to options market to hedge/ speculate but theirtrades have an impact on put/call prices driving down RNS) Stocks with highly �ve RNS, relatively overvalued and hard to sellshort subsequently underperform
Option prices contain information that is not embedded in stockprices ) fruitful research agenda
Alex Kostakis (MBS) RNS and Stock Returns 23rd March 2015, Miami 31 / 31