Site Map - Retail Leasing...
28
Site Map 4681 Jonesboro Rd, Forest Park, GA, 30297 Prepared by Amanda SteidtmannRLA Ring: 1, 3, 5 Miles Latitude: 33.626478 Longitude: -84.355366 October 24, 2013 ©2013 Esri
Transcript of Site Map - Retail Leasing...

Site Map4681 Jonesboro Rd, Forest Park, GA, 30297 Prepared by Amanda SteidtmannRLARing: 1, 3, 5 Miles Latitude: 33.626478
Longitude: -84.355366
October 24, 2013
©2013 Esri
Shannon
Rectangle

2010 Census Profile
4681 Jonesboro Rd, Forest Park, GA, 30297 Prepared by Amanda SteidtmannRLARing: 1 mile radius Latitude: 33.626478118
Longitude: -84.35536613
2000-2010 2000 2010 Annual Rate
Population 10,511 8,913 -1.64%Households 3,414 2,918 -1.56%Housing Units 3,613 3,566 -0.13%
Population by Race Number PercentTotal 8,914 100.0%
Population Reporting One Race 8,669 97.3%White 2,700 30.3%Black 3,665 41.1%American Indian 46 0.5%Asian 485 5.4%Pacific Islander 1 0.0%Some Other Race 1,772 19.9%
Population Reporting Two or More Races 245 2.7%
Total Hispanic Population 2,919 32.8%
Population by SexMale 4,546 51.0%Female 4,367 49.0%
Population by AgeTotal 8,914 100.0%
Age 0 - 4 865 9.7%Age 5 - 9 765 8.6%Age 10 - 14 619 6.9%Age 15 - 19 621 7.0%Age 20 - 24 664 7.4%Age 25 - 29 742 8.3%Age 30 - 34 706 7.9%Age 35 - 39 646 7.2%Age 40 - 44 582 6.5%Age 45 - 49 651 7.3%Age 50 - 54 566 6.4%Age 55 - 59 432 4.8%Age 60 - 64 336 3.8%Age 65 - 69 240 2.7%Age 70 - 74 165 1.9%Age 75 - 79 130 1.5%Age 80 - 84 103 1.2%Age 85+ 81 0.9%
Age 18+ 6,304 70.7%Age 65+ 719 8.1%
Median Age by Sex and Race/Hispanic OriginTotal Population 31.3
Male 30.4Female 32.4
White Alone 38.9Black Alone 30.9American Indian Alone 29.6Asian Alone 37.1Pacific Islander Alone 0.0Some Other Race Alone 25.5Two or More Races 20.2Hispanic Population 24.7
Data Note: Hispanic population can be of any race. Census 2010 medians are computed from reported data distributions.Source: U.S. Census Bureau, Census 2010 Summary File 1. Esri converted Census 2000 data into 2010 geography.
October 24, 2013
©2013 Esri Page 1 of 12
Shannon
Rectangle

2010 Census Profile
4681 Jonesboro Rd, Forest Park, GA, 30297 Prepared by Amanda SteidtmannRLARing: 1 mile radius Latitude: 33.626478118
Longitude: -84.35536613
Households by TypeTotal 2,918 100.0%
Households with 1 Person 714 24.5%Households with 2+ People 2,204 75.5%
Family Households 1,984 68.0%Husband-wife Families 1,038 35.6%
With Own Children 528 18.1%Other Family (No Spouse Present) 946 32.4%
With Own Children 462 15.8%Nonfamily Households 220 7.5%
All Households with Children 1,195 41.0%Multigenerational Households 232 8.0%Unmarried Partner Households 237 8.1%
Male-female 219 7.5%Same-sex 18 0.6%
Average Household Size 3.03
Family Households by Size
Total 1,983 100.0%
2 People 605 30.5%
3 People 439 22.1%
4 People 347 17.5%
5 People 262 13.2%
6 People 170 8.6%
7+ People 160 8.1%
Average Family Size 3.56
Nonfamily Households by SizeTotal 934 100.0%
1 Person 714 76.4%2 People 152 16.3%3 People 35 3.7%4 People 18 1.9%5 People 7 0.7%6 People 1 0.1%7+ People 7 0.7%
Average Nonfamily Size 1.38
Population by Relationship and Household TypeTotal 8,913 100.0%
In Households 8,849 99.3%In Family Households 7,563 84.9%
Householder 1,990 22.3%Spouse 1,040 11.7%Child 3,216 36.1%Other relative 815 9.1%Nonrelative 500 5.6%
In Nonfamily Households 1,287 14.4%In Group Quarters 64 0.7%
Institutionalized Population 29 0.3%Noninstitutionalized Population 35 0.4%
Data Note: Households with children include any households with people under age 18, related or not. Multigenerational households are families with 3 or moreparent-child relationships. Unmarried partner households are usually classified as nonfamily households unless there is another member of the household related to thehouseholder. Multigenerational and unmarried partner households are reported only to the tract level. Esri estimated block group data, which is used to estimate polygonsor non-standard geography. Average family size excludes nonrelatives.Source: U.S. Census Bureau, Census 2010 Summary File 1.
October 24, 2013
©2013 Esri Page 2 of 12
Shannon
Rectangle

2010 Census Profile
4681 Jonesboro Rd, Forest Park, GA, 30297 Prepared by Amanda SteidtmannRLARing: 1 mile radius Latitude: 33.626478118
Longitude: -84.35536613
Family Households by Age of HouseholderTotal 1,984 100.0%
Householder Age 15 - 44 995 50.2%Householder Age 45 - 54 453 22.8%Householder Age 55 - 64 276 13.9%Householder Age 65 - 74 146 7.4%Householder Age 75+ 114 5.7%
Nonfamily Households by Age of HouseholderTotal 934 100.0%
Householder Age 15 - 44 278 29.8%Householder Age 45 - 54 239 25.6%Householder Age 55 - 64 177 19.0%Householder Age 65 - 74 125 13.4%Householder Age 75+ 115 12.3%
Households by Race of HouseholderTotal 2,918 100.0%
Householder is White Alone 1,022 35.0%Householder is Black Alone 1,313 45.0%Householder is American Indian Alone 11 0.4%Householder is Asian Alone 131 4.5%Householder is Pacific Islander Alone 0 0.0%Householder is Some Other Race Alone 383 13.1%Householder is Two or More Races 58 2.0%
Households with Hispanic Householder 623 21.4%
Husband-wife Families by Race of HouseholderTotal 1,037 100.0%
Householder is White Alone 386 37.2%Householder is Black Alone 331 31.9%Householder is American Indian Alone 8 0.8%Householder is Asian Alone 81 7.8%Householder is Pacific Islander Alone 0 0.0%Householder is Some Other Race Alone 213 20.5%Householder is Two or More Races 18 1.7%
Husband-wife Families with Hispanic Householder 343 33.0%
Other Families (No Spouse) by Race of HouseholderTotal 947 100.0%
Householder is White Alone 254 26.8%Householder is Black Alone 518 54.7%Householder is American Indian Alone 2 0.2%Householder is Asian Alone 34 3.6%Householder is Pacific Islander Alone 0 0.0%Householder is Some Other Race Alone 114 12.0%Householder is Two or More Races 25 2.6%
Other Families with Hispanic Householder 190 20.1%
Nonfamily Households by Race of HouseholderTotal 934 100.0%
Householder is White Alone 382 40.9%Householder is Black Alone 464 49.7%Householder is American Indian Alone 1 0.1%Householder is Asian Alone 16 1.7%Householder is Pacific Islander Alone 0 0.0%Householder is Some Other Race Alone 56 6.0%Householder is Two or More Races 15 1.6%
Nonfamily Households with Hispanic Householder 90 9.6%Source: U.S. Census Bureau, Census 2010 Summary File 1.
October 24, 2013
©2013 Esri Page 3 of 12
Shannon
Rectangle

2010 Census Profile
4681 Jonesboro Rd, Forest Park, GA, 30297 Prepared by Amanda SteidtmannRLARing: 1 mile radius Latitude: 33.626478118
Longitude: -84.35536613
Total Housing Units by OccupancyTotal 3,565 100.0%
Occupied Housing Units 2,918 81.9%Vacant Housing Units
For Rent 370 10.4%Rented, not Occupied 15 0.4%For Sale Only 80 2.2%Sold, not Occupied 9 0.3%For Seasonal/Recreational/Occasional Use 7 0.2%For Migrant Workers 0 0.0%Other Vacant 166 4.7%
Total Vacancy Rate 18.2%
Households by Tenure and Mortgage StatusTotal 2,918 100.0%
Owner Occupied 1,444 49.5%Owned with a Mortgage/Loan 1,013 34.7%Owned Free and Clear 431 14.8%Average Household Size 2.91
Renter Occupied 1,474 50.5%Average Household Size 3.16
Owner-occupied Housing Units by Race of HouseholderTotal 1,443 100.0%
Householder is White Alone 651 45.1%Householder is Black Alone 532 36.9%Householder is American Indian Alone 6 0.4%Householder is Asian Alone 108 7.5%Householder is Pacific Islander Alone 0 0.0%Householder is Some Other Race Alone 124 8.6%Householder is Two or More Races 22 1.5%
Owner-occupied Housing Units with Hispanic Householder 215 14.9%
Renter-occupied Housing Units by Race of HouseholderTotal 1,474 100.0%
Householder is White Alone 370 25.1%Householder is Black Alone 781 53.0%Householder is American Indian Alone 5 0.3%Householder is Asian Alone 23 1.6%Householder is Pacific Islander Alone 0 0.0%Householder is Some Other Race Alone 259 17.6%Householder is Two or More Races 36 2.4%
Renter-occupied Housing Units with Hispanic Householder 409 27.7%
Average Household Size by Race/Hispanic Origin of HouseholderHouseholder is White Alone 2.71Householder is Black Alone 2.76Householder is American Indian Alone 4.00Householder is Asian Alone 3.64Householder is Pacific Islander Alone 0.00Householder is Some Other Race Alone 4.49Householder is Two or More Races 3.78Householder is Hispanic 4.57
Source: U.S. Census Bureau, Census 2010 Summary File 1.
October 24, 2013
©2013 Esri Page 4 of 12
Shannon
Rectangle

2010 Census Profile
4681 Jonesboro Rd, Forest Park, GA, 30297 Prepared by Amanda SteidtmannRLARing: 3 mile radius Latitude: 33.626478118
Longitude: -84.35536613
2000-2010 2000 2010 Annual Rate
Population 45,662 41,448 -0.96%Households 14,702 13,521 -0.83%Housing Units 15,700 16,693 0.62%
Population by Race Number PercentTotal 41,447 100.0%
Population Reporting One Race 40,284 97.2%White 11,365 27.4%Black 19,345 46.7%American Indian 192 0.5%Asian 3,154 7.6%Pacific Islander 21 0.1%Some Other Race 6,207 15.0%
Population Reporting Two or More Races 1,163 2.8%
Total Hispanic Population 11,712 28.3%
Population by SexMale 20,815 50.2%Female 20,633 49.8%
Population by AgeTotal 41,448 100.0%
Age 0 - 4 3,863 9.3%Age 5 - 9 3,292 7.9%Age 10 - 14 2,860 6.9%Age 15 - 19 3,317 8.0%Age 20 - 24 3,555 8.6%Age 25 - 29 3,482 8.4%Age 30 - 34 3,244 7.8%Age 35 - 39 3,086 7.4%Age 40 - 44 2,719 6.6%Age 45 - 49 2,713 6.5%Age 50 - 54 2,434 5.9%Age 55 - 59 1,944 4.7%Age 60 - 64 1,540 3.7%Age 65 - 69 1,153 2.8%Age 70 - 74 788 1.9%Age 75 - 79 629 1.5%Age 80 - 84 457 1.1%Age 85+ 370 0.9%
Age 18+ 29,690 71.6%Age 65+ 3,397 8.2%
Median Age by Sex and Race/Hispanic OriginTotal Population 30.5
Male 29.6Female 31.7
White Alone 36.2Black Alone 30.4American Indian Alone 28.4Asian Alone 35.9Pacific Islander Alone 23.5Some Other Race Alone 24.9Two or More Races 20.1Hispanic Population 24.4
Data Note: Hispanic population can be of any race. Census 2010 medians are computed from reported data distributions.Source: U.S. Census Bureau, Census 2010 Summary File 1. Esri converted Census 2000 data into 2010 geography.
October 24, 2013
©2013 Esri Page 5 of 12
Shannon
Rectangle

2010 Census Profile
4681 Jonesboro Rd, Forest Park, GA, 30297 Prepared by Amanda SteidtmannRLARing: 3 mile radius Latitude: 33.626478118
Longitude: -84.35536613
Households by TypeTotal 13,522 100.0%
Households with 1 Person 3,499 25.9%Households with 2+ People 10,023 74.1%
Family Households 9,098 67.3%Husband-wife Families 4,749 35.1%
With Own Children 2,388 17.7%Other Family (No Spouse Present) 4,349 32.2%
With Own Children 2,222 16.4%Nonfamily Households 925 6.8%
All Households with Children 5,591 41.4%Multigenerational Households 1,072 7.9%Unmarried Partner Households 1,106 8.2%
Male-female 1,016 7.5%Same-sex 90 0.7%
Average Household Size 2.99
Family Households by Size
Total 9,098 100.0%
2 People 2,633 28.9%
3 People 2,102 23.1%
4 People 1,800 19.8%
5 People 1,224 13.5%
6 People 667 7.3%
7+ People 672 7.4%
Average Family Size 3.57
Nonfamily Households by SizeTotal 4,424 100.0%
1 Person 3,499 79.1%2 People 659 14.9%3 People 133 3.0%4 People 77 1.7%5 People 31 0.7%6 People 7 0.2%7+ People 18 0.4%
Average Nonfamily Size 1.33
Population by Relationship and Household TypeTotal 41,448 100.0%
In Households 40,368 97.4%In Family Households 34,469 83.2%
Householder 9,151 22.1%Spouse 4,777 11.5%Child 14,810 35.7%Other relative 3,748 9.0%Nonrelative 1,985 4.8%
In Nonfamily Households 5,899 14.2%In Group Quarters 1,080 2.6%
Institutionalized Population 545 1.3%Noninstitutionalized Population 536 1.3%
Data Note: Households with children include any households with people under age 18, related or not. Multigenerational households are families with 3 or moreparent-child relationships. Unmarried partner households are usually classified as nonfamily households unless there is another member of the household related to thehouseholder. Multigenerational and unmarried partner households are reported only to the tract level. Esri estimated block group data, which is used to estimate polygonsor non-standard geography. Average family size excludes nonrelatives.Source: U.S. Census Bureau, Census 2010 Summary File 1.
October 24, 2013
©2013 Esri Page 6 of 12
Shannon
Rectangle

2010 Census Profile
4681 Jonesboro Rd, Forest Park, GA, 30297 Prepared by Amanda SteidtmannRLARing: 3 mile radius Latitude: 33.626478118
Longitude: -84.35536613
Family Households by Age of HouseholderTotal 9,098 100.0%
Householder Age 15 - 44 4,741 52.1%Householder Age 45 - 54 1,871 20.6%Householder Age 55 - 64 1,303 14.3%Householder Age 65 - 74 714 7.8%Householder Age 75+ 469 5.2%
Nonfamily Households by Age of HouseholderTotal 4,423 100.0%
Householder Age 15 - 44 1,713 38.7%Householder Age 45 - 54 993 22.5%Householder Age 55 - 64 719 16.3%Householder Age 65 - 74 543 12.3%Householder Age 75+ 455 10.3%
Households by Race of HouseholderTotal 13,521 100.0%
Householder is White Alone 4,084 30.2%Householder is Black Alone 6,949 51.4%Householder is American Indian Alone 51 0.4%Householder is Asian Alone 796 5.9%Householder is Pacific Islander Alone 5 0.0%Householder is Some Other Race Alone 1,370 10.1%Householder is Two or More Races 266 2.0%
Households with Hispanic Householder 2,560 18.9%
Husband-wife Families by Race of HouseholderTotal 4,748 100.0%
Householder is White Alone 1,600 33.7%Householder is Black Alone 1,766 37.2%Householder is American Indian Alone 25 0.5%Householder is Asian Alone 525 11.1%Householder is Pacific Islander Alone 1 0.0%Householder is Some Other Race Alone 736 15.5%Householder is Two or More Races 95 2.0%
Husband-wife Families with Hispanic Householder 1,375 29.0%
Other Families (No Spouse) by Race of HouseholderTotal 4,349 100.0%
Householder is White Alone 1,011 23.2%Householder is Black Alone 2,655 61.0%Householder is American Indian Alone 11 0.3%Householder is Asian Alone 175 4.0%Householder is Pacific Islander Alone 1 0.0%Householder is Some Other Race Alone 400 9.2%Householder is Two or More Races 96 2.2%
Other Families with Hispanic Householder 773 17.8%
Nonfamily Households by Race of HouseholderTotal 4,423 100.0%
Householder is White Alone 1,472 33.3%Householder is Black Alone 2,528 57.2%Householder is American Indian Alone 15 0.3%Householder is Asian Alone 96 2.2%Householder is Pacific Islander Alone 3 0.1%Householder is Some Other Race Alone 234 5.3%Householder is Two or More Races 75 1.7%
Nonfamily Households with Hispanic Householder 411 9.3%Source: U.S. Census Bureau, Census 2010 Summary File 1.
October 24, 2013
©2013 Esri Page 7 of 12
Shannon
Rectangle

2010 Census Profile
4681 Jonesboro Rd, Forest Park, GA, 30297 Prepared by Amanda SteidtmannRLARing: 3 mile radius Latitude: 33.626478118
Longitude: -84.35536613
Total Housing Units by OccupancyTotal 16,611 100.0%
Occupied Housing Units 13,521 81.4%Vacant Housing Units
For Rent 1,785 10.7%Rented, not Occupied 47 0.3%For Sale Only 305 1.8%Sold, not Occupied 35 0.2%For Seasonal/Recreational/Occasional Use 35 0.2%For Migrant Workers 0 0.0%Other Vacant 883 5.3%
Total Vacancy Rate 19.0%
Households by Tenure and Mortgage StatusTotal 13,520 100.0%
Owner Occupied 6,509 48.1%Owned with a Mortgage/Loan 4,807 35.6%Owned Free and Clear 1,703 12.6%Average Household Size 2.95
Renter Occupied 7,011 51.9%Average Household Size 3.02
Owner-occupied Housing Units by Race of HouseholderTotal 6,509 100.0%
Householder is White Alone 2,377 36.5%Householder is Black Alone 2,970 45.6%Householder is American Indian Alone 22 0.3%Householder is Asian Alone 648 10.0%Householder is Pacific Islander Alone 2 0.0%Householder is Some Other Race Alone 396 6.1%Householder is Two or More Races 94 1.4%
Owner-occupied Housing Units with Hispanic Householder 776 11.9%
Renter-occupied Housing Units by Race of HouseholderTotal 7,011 100.0%
Householder is White Alone 1,706 24.3%Householder is Black Alone 3,979 56.8%Householder is American Indian Alone 30 0.4%Householder is Asian Alone 148 2.1%Householder is Pacific Islander Alone 3 0.0%Householder is Some Other Race Alone 974 13.9%Householder is Two or More Races 171 2.4%
Renter-occupied Housing Units with Hispanic Householder 1,784 25.4%
Average Household Size by Race/Hispanic Origin of HouseholderHouseholder is White Alone 2.79Householder is Black Alone 2.69Householder is American Indian Alone 3.39Householder is Asian Alone 3.90Householder is Pacific Islander Alone 3.00Householder is Some Other Race Alone 4.41Householder is Two or More Races 3.60Householder is Hispanic 4.46
Source: U.S. Census Bureau, Census 2010 Summary File 1.
October 24, 2013
©2013 Esri Page 8 of 12
Shannon
Rectangle

2010 Census Profile
4681 Jonesboro Rd, Forest Park, GA, 30297 Prepared by Amanda SteidtmannRLARing: 5 mile radius Latitude: 33.626478118
Longitude: -84.35536613
2000-2010 2000 2010 Annual Rate
Population 144,224 140,736 -0.25%Households 49,261 49,336 0.02%Housing Units 52,303 59,192 1.25%
Population by Race Number PercentTotal 140,736 100.0%
Population Reporting One Race 137,367 97.6%White 24,816 17.6%Black 91,115 64.7%American Indian 545 0.4%Asian 8,520 6.1%Pacific Islander 63 0.0%Some Other Race 12,308 8.7%
Population Reporting Two or More Races 3,369 2.4%
Total Hispanic Population 22,695 16.1%
Population by SexMale 67,606 48.0%Female 73,130 52.0%
Population by AgeTotal 140,735 100.0%
Age 0 - 4 12,851 9.1%Age 5 - 9 11,195 8.0%Age 10 - 14 10,075 7.2%Age 15 - 19 10,740 7.6%Age 20 - 24 11,587 8.2%Age 25 - 29 12,103 8.6%Age 30 - 34 11,094 7.9%Age 35 - 39 10,692 7.6%Age 40 - 44 9,976 7.1%Age 45 - 49 9,630 6.8%Age 50 - 54 8,453 6.0%Age 55 - 59 7,034 5.0%Age 60 - 64 5,390 3.8%Age 65 - 69 3,688 2.6%Age 70 - 74 2,344 1.7%Age 75 - 79 1,750 1.2%Age 80 - 84 1,186 0.8%Age 85+ 949 0.7%
Age 18+ 100,350 71.3%Age 65+ 9,917 7.0%
Median Age by Sex and Race/Hispanic OriginTotal Population 30.8
Male 29.6Female 32.0
White Alone 39.9Black Alone 29.9American Indian Alone 28.4Asian Alone 35.8Pacific Islander Alone 27.7Some Other Race Alone 24.9Two or More Races 20.3Hispanic Population 24.7
Data Note: Hispanic population can be of any race. Census 2010 medians are computed from reported data distributions.Source: U.S. Census Bureau, Census 2010 Summary File 1. Esri converted Census 2000 data into 2010 geography.
October 24, 2013
©2013 Esri Page 9 of 12
Shannon
Rectangle

2010 Census Profile
4681 Jonesboro Rd, Forest Park, GA, 30297 Prepared by Amanda SteidtmannRLARing: 5 mile radius Latitude: 33.626478118
Longitude: -84.35536613
Households by TypeTotal 49,336 100.0%
Households with 1 Person 13,620 27.6%Households with 2+ People 35,716 72.4%
Family Households 32,320 65.5%Husband-wife Families 15,166 30.7%
With Own Children 7,381 15.0%Other Family (No Spouse Present) 17,153 34.8%
With Own Children 9,398 19.0%Nonfamily Households 3,396 6.9%
All Households with Children 20,182 40.9%Multigenerational Households 3,787 7.7%Unmarried Partner Households 4,183 8.5%
Male-female 3,791 7.7%Same-sex 392 0.8%
Average Household Size 2.80
Family Households by Size
Total 32,319 100.0%
2 People 10,134 31.4%
3 People 8,057 24.9%
4 People 6,414 19.8%
5 People 3,888 12.0%
6 People 2,004 6.2%
7+ People 1,822 5.6%
Average Family Size 3.42
Nonfamily Households by SizeTotal 17,015 100.0%
1 Person 13,620 80.0%2 People 2,664 15.7%3 People 420 2.5%4 People 157 0.9%5 People 92 0.5%6 People 29 0.2%7+ People 33 0.2%
Average Nonfamily Size 1.29
Population by Relationship and Household TypeTotal 140,736 100.0%
In Households 138,377 98.3%In Family Households 116,488 82.8%
Householder 32,419 23.0%Spouse 15,207 10.8%Child 51,386 36.5%Other relative 11,545 8.2%Nonrelative 5,930 4.2%
In Nonfamily Households 21,889 15.6%In Group Quarters 2,359 1.7%
Institutionalized Population 1,723 1.2%Noninstitutionalized Population 636 0.5%
Data Note: Households with children include any households with people under age 18, related or not. Multigenerational households are families with 3 or moreparent-child relationships. Unmarried partner households are usually classified as nonfamily households unless there is another member of the household related to thehouseholder. Multigenerational and unmarried partner households are reported only to the tract level. Esri estimated block group data, which is used to estimate polygonsor non-standard geography. Average family size excludes nonrelatives.Source: U.S. Census Bureau, Census 2010 Summary File 1.
October 24, 2013
©2013 Esri Page 10 of 12
Shannon
Rectangle

2010 Census Profile
4681 Jonesboro Rd, Forest Park, GA, 30297 Prepared by Amanda SteidtmannRLARing: 5 mile radius Latitude: 33.626478118
Longitude: -84.35536613
Family Households by Age of HouseholderTotal 32,320 100.0%
Householder Age 15 - 44 17,356 53.7%Householder Age 45 - 54 6,792 21.0%Householder Age 55 - 64 4,632 14.3%Householder Age 65 - 74 2,267 7.0%Householder Age 75+ 1,273 3.9%
Nonfamily Households by Age of HouseholderTotal 17,016 100.0%
Householder Age 15 - 44 7,709 45.3%Householder Age 45 - 54 3,668 21.6%Householder Age 55 - 64 2,917 17.1%Householder Age 65 - 74 1,532 9.0%Householder Age 75+ 1,190 7.0%
Households by Race of HouseholderTotal 49,336 100.0%
Householder is White Alone 9,580 19.4%Householder is Black Alone 33,669 68.2%Householder is American Indian Alone 173 0.4%Householder is Asian Alone 2,217 4.5%Householder is Pacific Islander Alone 15 0.0%Householder is Some Other Race Alone 2,823 5.7%Householder is Two or More Races 859 1.7%
Households with Hispanic Householder 5,230 10.6%
Husband-wife Families by Race of HouseholderTotal 15,166 100.0%
Householder is White Alone 3,741 24.7%Householder is Black Alone 8,206 54.1%Householder is American Indian Alone 73 0.5%Householder is Asian Alone 1,409 9.3%Householder is Pacific Islander Alone 5 0.0%Householder is Some Other Race Alone 1,470 9.7%Householder is Two or More Races 262 1.7%
Husband-wife Families with Hispanic Householder 2,677 17.7%
Other Families (No Spouse) by Race of HouseholderTotal 17,154 100.0%
Householder is White Alone 2,145 12.5%Householder is Black Alone 13,271 77.4%Householder is American Indian Alone 51 0.3%Householder is Asian Alone 502 2.9%Householder is Pacific Islander Alone 5 0.0%Householder is Some Other Race Alone 847 4.9%Householder is Two or More Races 333 1.9%
Other Families with Hispanic Householder 1,585 9.2%
Nonfamily Households by Race of HouseholderTotal 17,016 100.0%
Householder is White Alone 3,694 21.7%Householder is Black Alone 12,192 71.7%Householder is American Indian Alone 49 0.3%Householder is Asian Alone 306 1.8%Householder is Pacific Islander Alone 5 0.0%Householder is Some Other Race Alone 506 3.0%Householder is Two or More Races 264 1.6%
Nonfamily Households with Hispanic Householder 969 5.7%Source: U.S. Census Bureau, Census 2010 Summary File 1.
October 24, 2013
©2013 Esri Page 11 of 12
Shannon
Rectangle

2010 Census Profile
4681 Jonesboro Rd, Forest Park, GA, 30297 Prepared by Amanda SteidtmannRLARing: 5 mile radius Latitude: 33.626478118
Longitude: -84.35536613
Total Housing Units by OccupancyTotal 59,140 100.0%
Occupied Housing Units 49,336 83.4%Vacant Housing Units
For Rent 5,896 10.0%Rented, not Occupied 148 0.3%For Sale Only 1,012 1.7%Sold, not Occupied 115 0.2%For Seasonal/Recreational/Occasional Use 115 0.2%For Migrant Workers 3 0.0%Other Vacant 2,515 4.3%
Total Vacancy Rate 16.7%
Households by Tenure and Mortgage StatusTotal 49,336 100.0%
Owner Occupied 22,805 46.2%Owned with a Mortgage/Loan 18,264 37.0%Owned Free and Clear 4,541 9.2%Average Household Size 2.85
Renter Occupied 26,531 53.8%Average Household Size 2.76
Owner-occupied Housing Units by Race of HouseholderTotal 22,804 100.0%
Householder is White Alone 5,995 26.3%Householder is Black Alone 13,759 60.3%Householder is American Indian Alone 70 0.3%Householder is Asian Alone 1,779 7.8%Householder is Pacific Islander Alone 6 0.0%Householder is Some Other Race Alone 869 3.8%Householder is Two or More Races 326 1.4%
Owner-occupied Housing Units with Hispanic Householder 1,700 7.5%
Renter-occupied Housing Units by Race of HouseholderTotal 26,532 100.0%
Householder is White Alone 3,585 13.5%Householder is Black Alone 19,911 75.0%Householder is American Indian Alone 102 0.4%Householder is Asian Alone 438 1.7%Householder is Pacific Islander Alone 9 0.0%Householder is Some Other Race Alone 1,954 7.4%Householder is Two or More Races 533 2.0%
Renter-occupied Housing Units with Hispanic Householder 3,530 13.3%
Average Household Size by Race/Hispanic Origin of HouseholderHouseholder is White Alone 2.59Householder is Black Alone 2.66Householder is American Indian Alone 3.09Householder is Asian Alone 3.80Householder is Pacific Islander Alone 3.27Householder is Some Other Race Alone 4.31Householder is Two or More Races 3.18Householder is Hispanic 4.23
Source: U.S. Census Bureau, Census 2010 Summary File 1.
October 24, 2013
©2013 Esri Page 12 of 12
Shannon
Rectangle

Executive Summary4681 Jonesboro Rd, Forest Park, GA, 30297 Prepared by Amanda SteidtmannRLARings: 1, 3, 5 mile radii Latitude: 33.626478118
Longitude: -84.35536613
1 mile 3 miles 5 milesPopulation
2000 Population 10,511 45,662 144,224
2010 Population 8,913 41,448 140,736
2013 Population 8,972 41,924 141,730
2018 Population 9,283 43,547 147,386
2000-2010 Annual Rate -1.64% -0.96% -0.24%
2010-2013 Annual Rate 0.20% 0.35% 0.22%
2013-2018 Annual Rate 0.68% 0.76% 0.79%2013 Male Population 51.1% 50.3% 48.1%2013 Female Population 48.9% 49.7% 51.9%2013 Median Age 31.6 31.0 31.2
In the identified area, the current year population is 141,730. In 2010, the Census count in the area was 140,736. The rate of change since2010 was 0.22% annually. The five-year projection for the population in the area is 147,386 representing a change of 0.79% annually from2013 to 2018. Currently, the population is 48.1% male and 51.9% female.
Median Age
The median age in this area is 31.2, compared to U.S. median age of 37.3.
Race and Ethnicity2013 White Alone 30.7% 28.1% 18.1%
2013 Black Alone 38.2% 44.2% 63.0%2013 American Indian/Alaska Native Alone 0.6% 0.5% 0.4%2013 Asian Alone 5.4% 7.5% 6.0%2013 Pacific Islander Alone 0.0% 0.1% 0.1%2013 Other Race 22.1% 16.5% 9.8%2013 Two or More Races 3.0% 3.1% 2.6%2013 Hispanic Origin (Any Race) 36.4% 31.2% 18.1%
Persons of Hispanic origin represent 18.1% of the population in the identified area compared to 17.4% of the U.S. population. Persons ofHispanic Origin may be of any race. The Diversity Index, which measures the probability that two people from the same area will be fromdifferent race/ethnic groups, is 69.5 in the identified area, compared to 62.1 for the U.S. as a whole.
Households
2000 Households 3,414 14,702 49,2612010 Households 2,918 13,521 49,3362013 Total Households 2,935 13,679 49,6882018 Total Households 3,038 14,242 51,8112000-2010 Annual Rate -1.56% -0.83% 0.02%2010-2013 Annual Rate 0.18% 0.36% 0.22%2013-2018 Annual Rate 0.69% 0.81% 0.84%2013 Average Household Size 3.04 2.99 2.80
The household count in this area has changed from 49,336 in 2010 to 49,688 in the current year, a change of 0.22% annually. The five-yearprojection of households is 51,811, a change of 0.84% annually from the current year total. Average household size is currently 2.80,compared to 2.80 in the year 2010. The number of families in the current year is 32,273 in the specified area.
October 24, 2013
©2013 Esri Page 1 of 2
Data Note: Income is expressed in current dollarsSource: U.S. Census Bureau, Census 2010 Summary File 1. Esri forecasts for 2013 and 2018. Esri converted Census 2000 data into 2010 geography.
Shannon
Rectangle

Executive Summary4681 Jonesboro Rd, Forest Park, GA, 30297 Prepared by Amanda SteidtmannRLARings: 1, 3, 5 mile radii Latitude: 33.626478118
Longitude: -84.35536613
1 mile 3 miles 5 milesMedian Household Income
2013 Median Household Income $30,349 $32,627 $35,4152018 Median Household Income $32,708 $35,557 $37,8072013-2018 Annual Rate 1.51% 1.73% 1.32%
Average Household Income
2013 Average Household Income $37,739 $41,310 $44,8102018 Average Household Income $41,905 $46,782 $50,5512013-2018 Annual Rate 2.12% 2.52% 2.44%
Per Capita Income
2013 Per Capita Income $12,395 $13,833 $15,9302018 Per Capita Income $13,736 $15,654 $17,9782013-2018 Annual Rate 2.08% 2.50% 2.45%
Households by Income
Current median household income is $35,415 in the area, compared to $51,314 for all U.S. households. Median household income isprojected to be $37,807 in five years, compared to $59,580 for all U.S. households
Current average household income is $44,810 in this area, compared to $71,842 for all U.S households. Average household income isprojected to be $50,551 in five years, compared to $83,667 for all U.S. households
Current per capita income is $15,930 in the area, compared to the U.S. per capita income of $27,567. The per capita income is projected tobe $17,978 in five years, compared to $32,073 for all U.S. households Housing
2000 Total Housing Units 3,613 15,700 52,3032000 Owner Occupied Housing Units 1,900 7,370 23,0162000 Owner Occupied Housing Units 1,514 7,332 26,2452000 Vacant Housing Units 199 998 3,042
2010 Total Housing Units 3,566 16,693 59,1922010 Owner Occupied Housing Units 1,444 6,509 22,8052010 Renter Occupied Housing Units 1,474 7,011 26,5312010 Vacant Housing Units 648 3,172 9,856
2013 Total Housing Units 3,581 16,685 59,3442013 Owner Occupied Housing Units 1,340 6,135 21,3482013 Renter Occupied Housing Units 1,595 7,543 28,3402013 Vacant Housing Units 646 3,006 9,656
2018 Total Housing Units 3,717 17,284 61,4612018 Owner Occupied Housing Units 1,416 6,489 22,5522018 Renter Occupied Housing Units 1,622 7,753 29,2592018 Vacant Housing Units 679 3,042 9,650
Currently, 36.0% of the 59,344 housing units in the area are owner occupied; 47.8%, renter occupied; and 16.3% are vacant. Currently, inthe U.S., 56.4% of the housing units in the area are owner occupied; 32.3% are renter occupied; and 11.3% are vacant. In 2010, therewere 59,192 housing units in the area - 38.5% owner occupied, 44.8% renter occupied, and 16.7% vacant. The annual rate of change inhousing units since 2010 is 0.11%. Median home value in the area is $80,450, compared to a median home value of $177,257 for the U.S.In five years, median value is projected to change by 1.66% annually to $87,352.
October 24, 2013
©2013 Esri Page 2 of 2
Data Note: Income is expressed in current dollarsSource: U.S. Census Bureau, Census 2010 Summary File 1. Esri forecasts for 2013 and 2018. Esri converted Census 2000 data into 2010 geography.
Shannon
Rectangle
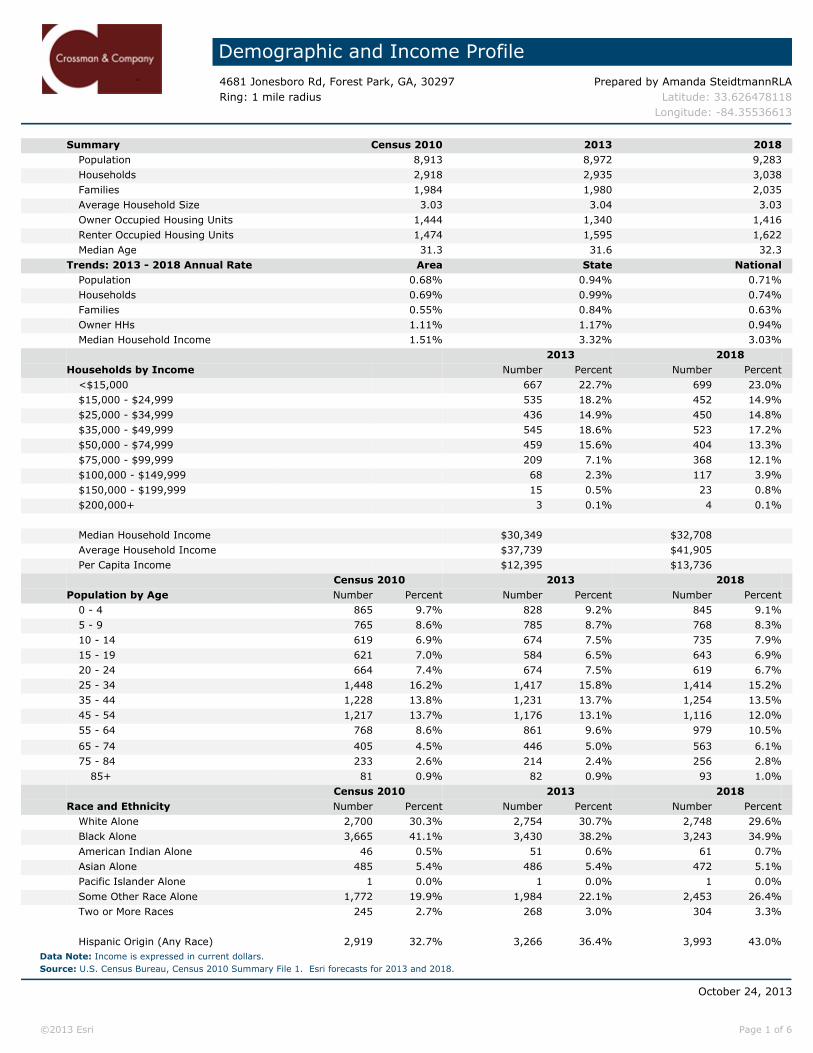
Demographic and Income Profile4681 Jonesboro Rd, Forest Park, GA, 30297 Prepared by Amanda SteidtmannRLARing: 1 mile radius Latitude: 33.626478118
Longitude: -84.35536613
Summary Census 2010 2013 2018Population 8,913 8,972 9,283Households 2,918 2,935 3,038Families 1,984 1,980 2,035Average Household Size 3.03 3.04 3.03Owner Occupied Housing Units 1,444 1,340 1,416Renter Occupied Housing Units 1,474 1,595 1,622Median Age 31.3 31.6 32.3
Trends: 2013 - 2018 Annual Rate Area State NationalPopulation 0.68% 0.94% 0.71%Households 0.69% 0.99% 0.74%Families 0.55% 0.84% 0.63%Owner HHs 1.11% 1.17% 0.94%Median Household Income 1.51% 3.32% 3.03%
2013 2018 Households by Income Number Percent Number Percent
<$15,000 667 22.7% 699 23.0%$15,000 - $24,999 535 18.2% 452 14.9%$25,000 - $34,999 436 14.9% 450 14.8%$35,000 - $49,999 545 18.6% 523 17.2%$50,000 - $74,999 459 15.6% 404 13.3%$75,000 - $99,999 209 7.1% 368 12.1%$100,000 - $149,999 68 2.3% 117 3.9%$150,000 - $199,999 15 0.5% 23 0.8%$200,000+ 3 0.1% 4 0.1%
Median Household Income $30,349 $32,708Average Household Income $37,739 $41,905Per Capita Income $12,395 $13,736
Census 2010 2013 2018 Population by Age Number Percent Number Percent Number Percent
0 - 4 865 9.7% 828 9.2% 845 9.1%5 - 9 765 8.6% 785 8.7% 768 8.3%10 - 14 619 6.9% 674 7.5% 735 7.9%15 - 19 621 7.0% 584 6.5% 643 6.9%20 - 24 664 7.4% 674 7.5% 619 6.7%25 - 34 1,448 16.2% 1,417 15.8% 1,414 15.2%35 - 44 1,228 13.8% 1,231 13.7% 1,254 13.5%45 - 54 1,217 13.7% 1,176 13.1% 1,116 12.0%55 - 64 768 8.6% 861 9.6% 979 10.5%
65 - 74 405 4.5% 446 5.0% 563 6.1%75 - 84 233 2.6% 214 2.4% 256 2.8%
85+ 81 0.9% 82 0.9% 93 1.0%Census 2010 2013 2018
Race and Ethnicity Number Percent Number Percent Number PercentWhite Alone 2,700 30.3% 2,754 30.7% 2,748 29.6%Black Alone 3,665 41.1% 3,430 38.2% 3,243 34.9%American Indian Alone 46 0.5% 51 0.6% 61 0.7%Asian Alone 485 5.4% 486 5.4% 472 5.1%Pacific Islander Alone 1 0.0% 1 0.0% 1 0.0%Some Other Race Alone 1,772 19.9% 1,984 22.1% 2,453 26.4%Two or More Races 245 2.7% 268 3.0% 304 3.3%
Hispanic Origin (Any Race) 2,919 32.7% 3,266 36.4% 3,993 43.0%Data Note: Income is expressed in current dollars.
October 24, 2013
©2013 Esri Page 1 of 6
Source: U.S. Census Bureau, Census 2010 Summary File 1. Esri forecasts for 2013 and 2018.
Shannon
Rectangle

Demographic and Income Profile4681 Jonesboro Rd, Forest Park, GA, 30297 Prepared by Amanda SteidtmannRLARing: 1 mile radius Latitude: 33.626478118
Longitude: -84.35536613
AreaStateUSA
Trends 2013-2018
Population Households Families Owner HHs Median HH Income
Annual
Rat
e (i
n p
erce
nt)
3
2.5
2
1.5
1
0.5
0
20132018
Population by Age
0-4 5-9 10-14 15-19 20-24 25-34 35-44 45-54 55-64 65-74 75-84 85+
Perc
ent
14
12
10
8
6
4
2
0
2013 Household Income
<$15K22.7%
$15K - $24K18.2%
$25K - $34K14.8%
$35K - $49K18.6% $50K - $74K
15.6%
$75K - $99K7.1%
$100K - $149K2.3%
$150K - $199K0.5%$200K+
0.1%
2013 Population by Race
White Black Am. Ind. Asian Pacific Other Two+
Perc
ent
35
30
25
20
15
10
5
0
2013 Percent Hispanic Origin: 36.4%
October 24, 2013
©2013 Esri Page 2 of 6
Source: U.S. Census Bureau, Census 2010 Summary File 1. Esri forecasts for 2013 and 2018.
Shannon
Rectangle

Demographic and Income Profile4681 Jonesboro Rd, Forest Park, GA, 30297 Prepared by Amanda SteidtmannRLARing: 3 mile radius Latitude: 33.626478118
Longitude: -84.35536613
Summary Census 2010 2013 2018Population 41,448 41,924 43,547Households 13,521 13,679 14,242Families 9,098 9,126 9,426Average Household Size 2.99 2.99 2.98Owner Occupied Housing Units 6,509 6,135 6,489Renter Occupied Housing Units 7,011 7,543 7,753Median Age 30.5 31.0 31.6
Trends: 2013 - 2018 Annual Rate Area State NationalPopulation 0.76% 0.94% 0.71%Households 0.81% 0.99% 0.74%Families 0.65% 0.84% 0.63%Owner HHs 1.13% 1.17% 0.94%Median Household Income 1.73% 3.32% 3.03%
2013 2018 Households by Income Number Percent Number Percent
<$15,000 2,943 21.5% 3,062 21.5%$15,000 - $24,999 2,255 16.5% 1,870 13.1%$25,000 - $34,999 2,018 14.8% 2,068 14.5%$35,000 - $49,999 2,414 17.6% 2,285 16.0%$50,000 - $74,999 2,281 16.7% 1,969 13.8%$75,000 - $99,999 1,026 7.5% 1,770 12.4%$100,000 - $149,999 623 4.6% 1,038 7.3%$150,000 - $199,999 89 0.7% 139 1.0%$200,000+ 29 0.2% 40 0.3%
Median Household Income $32,627 $35,557Average Household Income $41,310 $46,782Per Capita Income $13,833 $15,654
Census 2010 2013 2018 Population by Age Number Percent Number Percent Number Percent
0 - 4 3,863 9.3% 3,750 8.9% 3,835 8.8%5 - 9 3,292 7.9% 3,400 8.1% 3,407 7.8%10 - 14 2,860 6.9% 2,965 7.1% 3,183 7.3%15 - 19 3,317 8.0% 3,156 7.5% 3,260 7.5%20 - 24 3,555 8.6% 3,724 8.9% 3,495 8.0%25 - 34 6,726 16.2% 6,570 15.7% 6,766 15.5%35 - 44 5,805 14.0% 5,772 13.8% 5,745 13.2%45 - 54 5,147 12.4% 5,115 12.2% 5,125 11.8%55 - 64 3,484 8.4% 3,870 9.2% 4,331 9.9%
65 - 74 1,941 4.7% 2,131 5.1% 2,668 6.1%75 - 84 1,086 2.6% 1,091 2.6% 1,298 3.0%
85+ 370 0.9% 380 0.9% 434 1.0%Census 2010 2013 2018
Race and Ethnicity Number Percent Number Percent Number PercentWhite Alone 11,365 27.4% 11,787 28.1% 12,029 27.6%Black Alone 19,345 46.7% 18,544 44.2% 18,168 41.7%American Indian Alone 192 0.5% 208 0.5% 236 0.5%Asian Alone 3,154 7.6% 3,162 7.5% 3,148 7.2%Pacific Islander Alone 21 0.1% 25 0.1% 31 0.1%Some Other Race Alone 6,207 15.0% 6,912 16.5% 8,450 19.4%Two or More Races 1,163 2.8% 1,286 3.1% 1,485 3.4%
Hispanic Origin (Any Race) 11,712 28.3% 13,076 31.2% 15,844 36.4%Data Note: Income is expressed in current dollars.
October 24, 2013
©2013 Esri Page 3 of 6
Source: U.S. Census Bureau, Census 2010 Summary File 1. Esri forecasts for 2013 and 2018.
Shannon
Rectangle

Demographic and Income Profile4681 Jonesboro Rd, Forest Park, GA, 30297 Prepared by Amanda SteidtmannRLARing: 3 mile radius Latitude: 33.626478118
Longitude: -84.35536613
AreaStateUSA
Trends 2013-2018
Population Households Families Owner HHs Median HH Income
Annual
Rat
e (i
n p
erce
nt)
3
2.5
2
1.5
1
0.5
0
20132018
Population by Age
0-4 5-9 10-14 15-19 20-24 25-34 35-44 45-54 55-64 65-74 75-84 85+
Perc
ent
14
12
10
8
6
4
2
0
2013 Household Income
<$15K21.5%
$15K - $24K16.5%
$25K - $34K14.8%
$35K - $49K17.6%
$50K - $74K16.7%
$75K - $99K7.5%
$100K - $149K4.6%
$150K - $199K0.7%
$200K+0.2%
2013 Population by Race
White Black Am. Ind. Asian Pacific Other Two+
Perc
ent
40
35
30
25
20
15
10
5
0
2013 Percent Hispanic Origin: 31.2%
October 24, 2013
©2013 Esri Page 4 of 6
Source: U.S. Census Bureau, Census 2010 Summary File 1. Esri forecasts for 2013 and 2018.
Shannon
Rectangle

Demographic and Income Profile4681 Jonesboro Rd, Forest Park, GA, 30297 Prepared by Amanda SteidtmannRLARing: 5 mile radius Latitude: 33.626478118
Longitude: -84.35536613
Summary Census 2010 2013 2018Population 140,736 141,730 147,386Households 49,336 49,688 51,811Families 32,320 32,273 33,381Average Household Size 2.80 2.80 2.80Owner Occupied Housing Units 22,805 21,348 22,552Renter Occupied Housing Units 26,531 28,340 29,259Median Age 30.8 31.2 31.8
Trends: 2013 - 2018 Annual Rate Area State NationalPopulation 0.79% 0.94% 0.71%Households 0.84% 0.99% 0.74%Families 0.68% 0.84% 0.63%Owner HHs 1.10% 1.17% 0.94%Median Household Income 1.32% 3.32% 3.03%
2013 2018 Households by Income Number Percent Number Percent
<$15,000 9,125 18.4% 9,496 18.3%$15,000 - $24,999 7,047 14.2% 5,868 11.3%$25,000 - $34,999 8,318 16.7% 8,497 16.4%$35,000 - $49,999 8,789 17.7% 8,279 16.0%$50,000 - $74,999 9,095 18.3% 7,759 15.0%$75,000 - $99,999 3,831 7.7% 6,460 12.5%$100,000 - $149,999 2,917 5.9% 4,632 8.9%$150,000 - $199,999 363 0.7% 555 1.1%$200,000+ 204 0.4% 266 0.5%
Median Household Income $35,415 $37,807Average Household Income $44,810 $50,551Per Capita Income $15,930 $17,978
Census 2010 2013 2018 Population by Age Number Percent Number Percent Number Percent
0 - 4 12,851 9.1% 12,474 8.8% 12,820 8.7%5 - 9 11,195 8.0% 11,337 8.0% 11,351 7.7%10 - 14 10,075 7.2% 10,200 7.2% 10,723 7.3%15 - 19 10,740 7.6% 10,173 7.2% 10,430 7.1%20 - 24 11,587 8.2% 12,130 8.6% 11,463 7.8%25 - 34 23,197 16.5% 22,925 16.2% 24,049 16.3%35 - 44 20,668 14.7% 20,058 14.2% 19,756 13.4%45 - 54 18,083 12.8% 18,021 12.7% 18,001 12.2%55 - 64 12,424 8.8% 13,444 9.5% 14,750 10.0%
65 - 74 6,032 4.3% 6,953 4.9% 9,039 6.1%75 - 84 2,936 2.1% 3,027 2.1% 3,837 2.6%
85+ 949 0.7% 987 0.7% 1,167 0.8%Census 2010 2013 2018
Race and Ethnicity Number Percent Number Percent Number PercentWhite Alone 24,816 17.6% 25,690 18.1% 26,268 17.8%Black Alone 91,115 64.7% 89,226 63.0% 89,991 61.1%American Indian Alone 545 0.4% 580 0.4% 652 0.4%Asian Alone 8,520 6.1% 8,521 6.0% 8,667 5.9%Pacific Islander Alone 63 0.0% 74 0.1% 97 0.1%Some Other Race Alone 12,308 8.7% 13,885 9.8% 17,287 11.7%Two or More Races 3,369 2.4% 3,754 2.6% 4,424 3.0%
Hispanic Origin (Any Race) 22,695 16.1% 25,609 18.1% 31,612 21.4%Data Note: Income is expressed in current dollars.
October 24, 2013
©2013 Esri Page 5 of 6
Source: U.S. Census Bureau, Census 2010 Summary File 1. Esri forecasts for 2013 and 2018.
Shannon
Rectangle

Demographic and Income Profile4681 Jonesboro Rd, Forest Park, GA, 30297 Prepared by Amanda SteidtmannRLARing: 5 mile radius Latitude: 33.626478118
Longitude: -84.35536613
AreaStateUSA
Trends 2013-2018
Population Households Families Owner HHs Median HH Income
Annual
Rat
e (i
n p
erce
nt)
3
2.5
2
1.5
1
0.5
0
20132018
Population by Age
0-4 5-9 10-14 15-19 20-24 25-34 35-44 45-54 55-64 65-74 75-84 85+
Perc
ent
16
14
12
10
8
6
4
2
0
2013 Household Income
<$15K18.4%
$15K - $24K14.2%
$25K - $34K16.7%
$35K - $49K17.7%
$50K - $74K18.3%
$75K - $99K7.7%
$100K - $149K5.9%
$150K - $199K0.7%
$200K+0.4%
2013 Population by Race
White Black Am. Ind. Asian Pacific Other Two+
Perc
ent
60
55
50
45
40
35
30
25
20
15
10
5
0
2013 Percent Hispanic Origin: 18.1%
October 24, 2013
©2013 Esri Page 6 of 6
Source: U.S. Census Bureau, Census 2010 Summary File 1. Esri forecasts for 2013 and 2018.
Shannon
Rectangle

Market Profile4681 Jonesboro Rd, Forest Park, GA, 30297 Prepared by Amanda SteidtmannRLARings: 1, 3, 5 mile radii Latitude: 33.626478118
Longitude: -84.35536613
1 mile 3 miles 5 milesPopulation Summary
2000 Total Population 10,511 45,662 144,2242010 Total Population 8,913 41,448 140,7362013 Total Population 8,972 41,924 141,730
2013 Group Quarters 64 1,080 2,3622018 Total Population 9,283 43,547 147,386
2013-2018 Annual Rate 0.68% 0.76% 0.79%Household Summary
2000 Households 3,414 14,702 49,2612000 Average Household Size 2.94 3.01 2.88
2010 Households 2,918 13,521 49,3362010 Average Household Size 3.03 2.99 2.80
2013 Households 2,935 13,679 49,6882013 Average Household Size 3.04 2.99 2.80
2018 Households 3,038 14,242 51,8112018 Average Household Size 3.03 2.98 2.802013-2018 Annual Rate 0.69% 0.81% 0.84%
2010 Families 1,984 9,098 32,3202010 Average Family Size 3.56 3.57 3.42
2013 Families 1,980 9,126 32,2732013 Average Family Size 3.58 3.59 3.44
2018 Families 2,035 9,426 33,3812018 Average Family Size 3.59 3.60 3.442013-2018 Annual Rate 0.55% 0.65% 0.68%
Housing Unit Summary2000 Housing Units 3,613 15,700 52,303
Owner Occupied Housing Units 52.6% 46.9% 44.0%Renter Occupied Housing Units 41.9% 46.7% 50.2%Vacant Housing Units 5.5% 6.4% 5.8%
2010 Housing Units 3,566 16,693 59,192Owner Occupied Housing Units 40.5% 39.0% 38.5%Renter Occupied Housing Units 41.3% 42.0% 44.8%Vacant Housing Units 18.2% 19.0% 16.7%
2013 Housing Units 3,581 16,685 59,344Owner Occupied Housing Units 37.4% 36.8% 36.0%Renter Occupied Housing Units 44.5% 45.2% 47.8%Vacant Housing Units 18.0% 18.0% 16.3%
2018 Housing Units 3,717 17,284 61,461Owner Occupied Housing Units 38.1% 37.5% 36.7%Renter Occupied Housing Units 43.6% 44.9% 47.6%Vacant Housing Units 18.3% 17.6% 15.7%
Median Household Income2013 $30,349 $32,627 $35,4152018 $32,708 $35,557 $37,807
Median Home Value2013 $61,948 $68,319 $80,4502018 $62,319 $71,437 $87,352
Per Capita Income2013 $12,395 $13,833 $15,9302018 $13,736 $15,654 $17,978
Median Age2010 31.3 30.5 30.82013 31.6 31.0 31.22018 32.3 31.6 31.8
Data Note: Household population includes persons not residing in group quarters. Average Household Size is the household population divided by total households.Persons in families include the householder and persons related to the householder by birth, marriage, or adoption. Per Capita Income represents the income received byall persons aged 15 years and over divided by the total population.
October 24, 2013
©2013 Esri Page 1 of 7
Source: U.S. Census Bureau, Census 2010 Summary File 1. Esri forecasts for 2013 and 2018. Esri converted Census 2000 data into 2010 geography.
Shannon
Rectangle

Market Profile4681 Jonesboro Rd, Forest Park, GA, 30297 Prepared by Amanda SteidtmannRLARings: 1, 3, 5 mile radii Latitude: 33.626478118
Longitude: -84.35536613
1 mile 3 miles 5 miles2013 Households by Income
Household Income Base 2,935 13,679 49,688<$15,000 22.7% 21.5% 18.4%$15,000 - $24,999 18.2% 16.5% 14.2%$25,000 - $34,999 14.9% 14.8% 16.7%$35,000 - $49,999 18.6% 17.6% 17.7%$50,000 - $74,999 15.6% 16.7% 18.3%$75,000 - $99,999 7.1% 7.5% 7.7%$100,000 - $149,999 2.3% 4.6% 5.9%$150,000 - $199,999 0.5% 0.7% 0.7%$200,000+ 0.1% 0.2% 0.4%
Average Household Income $37,739 $41,310 $44,8102018 Households by Income
Household Income Base 3,038 14,242 51,811<$15,000 23.0% 21.5% 18.3%$15,000 - $24,999 14.9% 13.1% 11.3%$25,000 - $34,999 14.8% 14.5% 16.4%$35,000 - $49,999 17.2% 16.0% 16.0%$50,000 - $74,999 13.3% 13.8% 15.0%$75,000 - $99,999 12.1% 12.4% 12.5%$100,000 - $149,999 3.9% 7.3% 8.9%$150,000 - $199,999 0.8% 1.0% 1.1%$200,000+ 0.1% 0.3% 0.5%
Average Household Income $41,905 $46,782 $50,5512013 Owner Occupied Housing Units by Value
Total 1,340 6,135 21,329<$50,000 39.4% 30.6% 19.9%$50,000 - $99,999 44.5% 52.9% 49.4%$100,000 - $149,999 9.9% 10.4% 16.6%$150,000 - $199,999 2.7% 2.5% 8.5%$200,000 - $249,999 0.7% 0.7% 2.4%$250,000 - $299,999 0.7% 0.4% 0.7%$300,000 - $399,999 0.8% 0.6% 0.7%$400,000 - $499,999 0.7% 0.9% 0.6%$500,000 - $749,999 0.1% 0.4% 0.5%$750,000 - $999,999 0.0% 0.0% 0.1%$1,000,000 + 0.2% 0.5% 0.6%
Average Home Value $74,633 $82,650 $101,1762018 Owner Occupied Housing Units by Value
Total 1,416 6,489 22,533<$50,000 42.4% 33.7% 22.1%$50,000 - $99,999 31.0% 37.9% 37.3%$100,000 - $149,999 10.6% 12.7% 14.6%$150,000 - $199,999 7.4% 6.9% 13.7%$200,000 - $249,999 2.1% 1.9% 5.2%$250,000 - $299,999 2.1% 1.1% 1.7%$300,000 - $399,999 1.8% 1.4% 1.5%$400,000 - $499,999 1.7% 2.0% 1.5%$500,000 - $749,999 0.5% 1.3% 1.4%$750,000 - $999,999 0.0% 0.1% 0.2%$1,000,000 + 0.5% 0.9% 0.9%
Average Home Value $93,313 $106,174 $125,472
Data Note: Income represents the preceding year, expressed in current dollars. Household income includes wage and salary earnings, interest dividends, net rents,pensions, SSI and welfare payments, child support, and alimony.
October 24, 2013
©2013 Esri Page 2 of 7
Source: U.S. Census Bureau, Census 2010 Summary File 1. Esri forecasts for 2013 and 2018. Esri converted Census 2000 data into 2010 geography.
Shannon
Rectangle

Market Profile4681 Jonesboro Rd, Forest Park, GA, 30297 Prepared by Amanda SteidtmannRLARings: 1, 3, 5 mile radii Latitude: 33.626478118
Longitude: -84.35536613
1 mile 3 miles 5 miles2010 Population by Age
Total 8,914 41,448 140,7350 - 4 9.7% 9.3% 9.1%5 - 9 8.6% 7.9% 8.0%10 - 14 6.9% 6.9% 7.2%15 - 24 14.4% 16.6% 15.9%25 - 34 16.2% 16.2% 16.5%35 - 44 13.8% 14.0% 14.7%45 - 54 13.7% 12.4% 12.8%55 - 64 8.6% 8.4% 8.8%65 - 74 4.5% 4.7% 4.3%75 - 84 2.6% 2.6% 2.1%85 + 0.9% 0.9% 0.7%
18 + 70.7% 71.6% 71.3%2013 Population by Age
Total 8,972 41,924 141,7290 - 4 9.2% 8.9% 8.8%5 - 9 8.7% 8.1% 8.0%10 - 14 7.5% 7.1% 7.2%15 - 24 14.0% 16.4% 15.7%25 - 34 15.8% 15.7% 16.2%35 - 44 13.7% 13.8% 14.2%45 - 54 13.1% 12.2% 12.7%55 - 64 9.6% 9.2% 9.5%65 - 74 5.0% 5.1% 4.9%75 - 84 2.4% 2.6% 2.1%85 + 0.9% 0.9% 0.7%
18 + 70.6% 71.9% 71.9%2018 Population by Age
Total 9,285 43,547 147,3860 - 4 9.1% 8.8% 8.7%5 - 9 8.3% 7.8% 7.7%10 - 14 7.9% 7.3% 7.3%15 - 24 13.6% 15.5% 14.9%25 - 34 15.2% 15.5% 16.3%35 - 44 13.5% 13.2% 13.4%45 - 54 12.0% 11.8% 12.2%55 - 64 10.5% 9.9% 10.0%65 - 74 6.1% 6.1% 6.1%75 - 84 2.8% 3.0% 2.6%85 + 1.0% 1.0% 0.8%
18 + 70.4% 72.1% 72.2%
2010 Population by SexMales 4,546 20,815 67,606Females 4,367 20,633 73,130
2013 Population by SexMales 4,586 21,078 68,179Females 4,386 20,846 73,551
2018 Population by SexMales 4,745 21,916 71,063Females 4,538 21,630 76,323
October 24, 2013
©2013 Esri Page 3 of 7
Source: U.S. Census Bureau, Census 2010 Summary File 1. Esri forecasts for 2013 and 2018. Esri converted Census 2000 data into 2010 geography.
Shannon
Rectangle

Market Profile4681 Jonesboro Rd, Forest Park, GA, 30297 Prepared by Amanda SteidtmannRLARings: 1, 3, 5 mile radii Latitude: 33.626478118
Longitude: -84.35536613
1 mile 3 miles 5 miles2010 Population by Race/Ethnicity
Total 8,914 41,447 140,736White Alone 30.3% 27.4% 17.6%Black Alone 41.1% 46.7% 64.7%American Indian Alone 0.5% 0.5% 0.4%Asian Alone 5.4% 7.6% 6.1%Pacific Islander Alone 0.0% 0.1% 0.0%Some Other Race Alone 19.9% 15.0% 8.7%Two or More Races 2.7% 2.8% 2.4%
Hispanic Origin 32.7% 28.3% 16.1%Diversity Index 85.2 82.2 66.9
2013 Population by Race/EthnicityTotal 8,974 41,924 141,730
White Alone 30.7% 28.1% 18.1%Black Alone 38.2% 44.2% 63.0%American Indian Alone 0.6% 0.5% 0.4%Asian Alone 5.4% 7.5% 6.0%Pacific Islander Alone 0.0% 0.1% 0.1%Some Other Race Alone 22.1% 16.5% 9.8%Two or More Races 3.0% 3.1% 2.6%
Hispanic Origin 36.4% 31.2% 18.1%Diversity Index 86.9 84.0 69.5
2018 Population by Race/EthnicityTotal 9,282 43,547 147,386
White Alone 29.6% 27.6% 17.8%Black Alone 34.9% 41.7% 61.1%American Indian Alone 0.7% 0.5% 0.4%Asian Alone 5.1% 7.2% 5.9%Pacific Islander Alone 0.0% 0.1% 0.1%Some Other Race Alone 26.4% 19.4% 11.7%Two or More Races 3.3% 3.4% 3.0%
Hispanic Origin 43.0% 36.4% 21.4%Diversity Index 89.2 86.3 72.9
2010 Population by Relationship and Household TypeTotal 8,913 41,448 140,736
In Households 99.3% 97.4% 98.3%In Family Households 84.9% 83.2% 82.8%
Householder 22.3% 22.1% 23.0%Spouse 11.7% 11.5% 10.8%Child 36.1% 35.7% 36.5%Other relative 9.1% 9.0% 8.2%Nonrelative 5.6% 4.8% 4.2%
In Nonfamily Households 14.4% 14.2% 15.6%In Group Quarters 0.7% 2.6% 1.7%
Institutionalized Population 0.3% 1.3% 1.2%Noninstitutionalized Population 0.4% 1.3% 0.5%
Data Note: Persons of Hispanic Origin may be of any race. The Diversity Index measures the probability that two people from the same area will be from differentrace/ethnic groups.
October 24, 2013
©2013 Esri Page 4 of 7
Source: U.S. Census Bureau, Census 2010 Summary File 1. Esri forecasts for 2013 and 2018. Esri converted Census 2000 data into 2010 geography.
Shannon
Rectangle
Market Profile4681 Jonesboro Rd, Forest Park, GA, 30297 Prepared by Amanda SteidtmannRLARings: 1, 3, 5 mile radii Latitude: 33.626478118
Longitude: -84.35536613
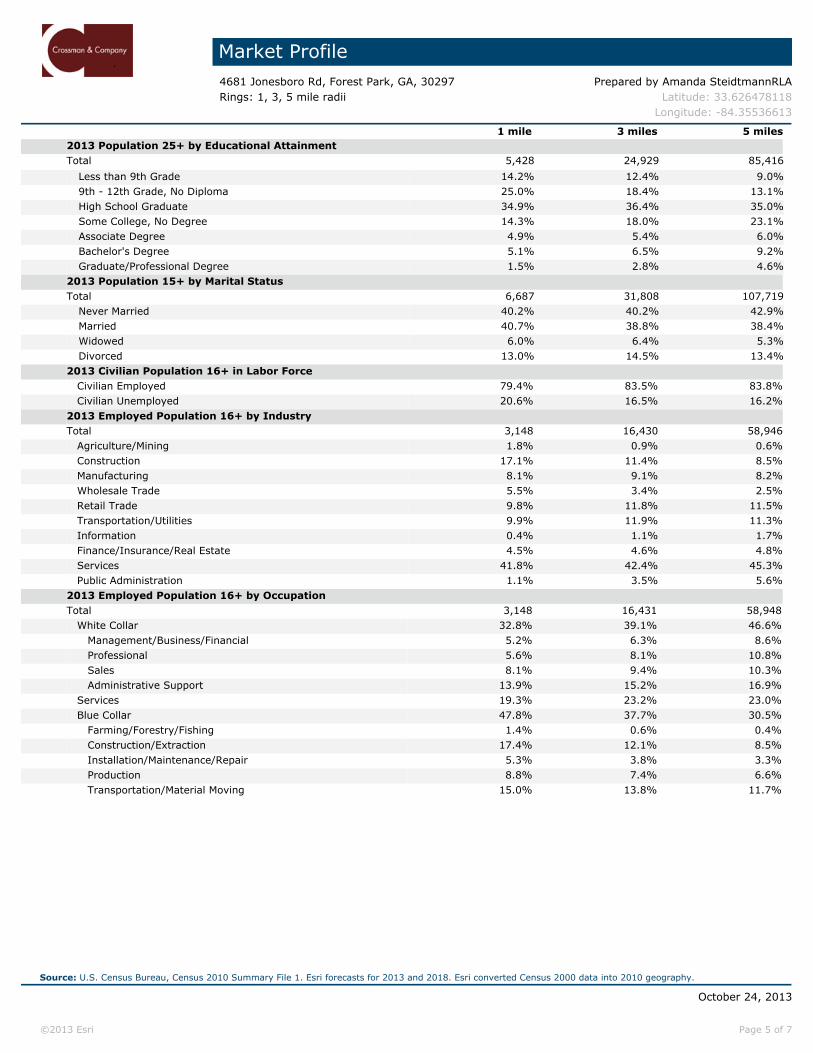
1 mile 3 miles 5 miles2013 Population 25+ by Educational AttainmentTotal 5,428 24,929 85,416
Less than 9th Grade 14.2% 12.4% 9.0%9th - 12th Grade, No Diploma 25.0% 18.4% 13.1%High School Graduate 34.9% 36.4% 35.0%Some College, No Degree 14.3% 18.0% 23.1%Associate Degree 4.9% 5.4% 6.0%Bachelor's Degree 5.1% 6.5% 9.2%Graduate/Professional Degree 1.5% 2.8% 4.6%
2013 Population 15+ by Marital StatusTotal 6,687 31,808 107,719
Never Married 40.2% 40.2% 42.9%Married 40.7% 38.8% 38.4%Widowed 6.0% 6.4% 5.3%Divorced 13.0% 14.5% 13.4%
2013 Civilian Population 16+ in Labor Force Civilian Employed 79.4% 83.5% 83.8% Civilian Unemployed 20.6% 16.5% 16.2%2013 Employed Population 16+ by IndustryTotal 3,148 16,430 58,946 Agriculture/Mining 1.8% 0.9% 0.6% Construction 17.1% 11.4% 8.5% Manufacturing 8.1% 9.1% 8.2% Wholesale Trade 5.5% 3.4% 2.5% Retail Trade 9.8% 11.8% 11.5% Transportation/Utilities 9.9% 11.9% 11.3% Information 0.4% 1.1% 1.7% Finance/Insurance/Real Estate 4.5% 4.6% 4.8% Services 41.8% 42.4% 45.3% Public Administration 1.1% 3.5% 5.6%2013 Employed Population 16+ by OccupationTotal 3,148 16,431 58,948 White Collar 32.8% 39.1% 46.6% Management/Business/Financial 5.2% 6.3% 8.6% Professional 5.6% 8.1% 10.8% Sales 8.1% 9.4% 10.3% Administrative Support 13.9% 15.2% 16.9% Services 19.3% 23.2% 23.0% Blue Collar 47.8% 37.7% 30.5% Farming/Forestry/Fishing 1.4% 0.6% 0.4% Construction/Extraction 17.4% 12.1% 8.5% Installation/Maintenance/Repair 5.3% 3.8% 3.3% Production 8.8% 7.4% 6.6% Transportation/Material Moving 15.0% 13.8% 11.7%
October 24, 2013
©2013 Esri Page 5 of 7
Source: U.S. Census Bureau, Census 2010 Summary File 1. Esri forecasts for 2013 and 2018. Esri converted Census 2000 data into 2010 geography.
Shannon
Rectangle

Market Profile4681 Jonesboro Rd, Forest Park, GA, 30297 Prepared by Amanda SteidtmannRLARings: 1, 3, 5 mile radii Latitude: 33.626478118
Longitude: -84.35536613
1 mile 3 miles 5 miles2010 Households by Type
Total 2,918 13,522 49,336Households with 1 Person 24.5% 25.9% 27.6%Households with 2+ People 75.5% 74.1% 72.4%
Family Households 68.0% 67.3% 65.5%Husband-wife Families 35.6% 35.1% 30.7%
With Related Children 19.7% 19.8% 16.8%Other Family (No Spouse Present) 32.4% 32.2% 34.8%
Other Family with Male Householder 9.6% 9.0% 8.0%With Related Children 5.4% 4.9% 4.4%
Other Family with Female Householder 22.8% 23.2% 26.8%With Related Children 14.9% 15.9% 19.1%
Nonfamily Households 7.5% 6.8% 6.9%
All Households with Children 41.0% 41.4% 40.9%
Multigenerational Households 8.0% 7.9% 7.7%Unmarried Partner Households 8.1% 8.2% 8.5%
Male-female 7.5% 7.5% 7.7%Same-sex 0.6% 0.7% 0.8%
2010 Households by SizeTotal 2,917 13,522 49,334
1 Person Household 24.5% 25.9% 27.6%2 Person Household 26.0% 24.3% 25.9%3 Person Household 16.2% 16.5% 17.2%4 Person Household 12.5% 13.9% 13.3%5 Person Household 9.2% 9.3% 8.1%6 Person Household 5.9% 5.0% 4.1%7 + Person Household 5.7% 5.1% 3.8%
2010 Households by Tenure and Mortgage Status
Total 2,918 13,520 49,336Owner Occupied 49.5% 48.1% 46.2%
Owned with a Mortgage/Loan 34.7% 35.6% 37.0%Owned Free and Clear 14.8% 12.6% 9.2%
Renter Occupied 50.5% 51.9% 53.8%
Data Note: Households with children include any households with people under age 18, related or not. Multigenerational households are families with 3 or more parent-child relationships. Unmarried partner households are usually classified as nonfamily households unless there is another member of the household related to thehouseholder. Multigenerational and unmarried partner households are reported only to the tract level. Esri estimated block group data, which is used to estimatepolygons or non-standard geography.
October 24, 2013
©2013 Esri Page 6 of 7
Source: U.S. Census Bureau, Census 2010 Summary File 1. Esri forecasts for 2013 and 2018. Esri converted Census 2000 data into 2010 geography.
Shannon
Rectangle

Market Profile4681 Jonesboro Rd, Forest Park, GA, 30297 Prepared by Amanda SteidtmannRLARings: 1, 3, 5 mile radii Latitude: 33.626478118
Longitude: -84.35536613
1 mile 3 miles 5 milesTop 3 Tapestry Segments
1. City Dimensions City Dimensions Inner City Tenants
2. Rustbelt Traditions Inner City Tenants Rustbelt Traditions
3. Home Town Rustbelt Traditions Young and Restless
2013 Consumer Spending Apparel & Services: Total $ $2,516,653 $12,725,620 $50,144,436
Average Spent $857.46 $930.30 $1,009.19Spending Potential Index 38 41 45
Computers & Accessories: Total $ $393,317 $2,023,072 $8,022,687Average Spent $134.00 $147.90 $161.46Spending Potential Index 54 60 65
Education: Total $ $2,434,477 $11,951,839 $45,940,296Average Spent $829.46 $873.74 $924.58Spending Potential Index 57 60 63
Entertainment/Recreation: Total $ $5,137,685 $26,164,068 $102,896,739Average Spent $1,750.49 $1,912.72 $2,070.86Spending Potential Index 54 59 64
Food at Home: Total $ $8,361,744 $42,316,750 $164,861,415Average Spent $2,848.98 $3,093.56 $3,317.93Spending Potential Index 57 61 66
Food Away from Home: Total $ $5,170,039 $26,560,667 $105,287,035Average Spent $1,761.51 $1,941.71 $2,118.96Spending Potential Index 55 61 66
Health Care: Total $ $6,621,499 $33,646,521 $131,107,917Average Spent $2,256.05 $2,459.72 $2,638.62Spending Potential Index 51 55 59
HH Furnishings & Equipment: Total $ $2,455,166 $12,621,661 $50,085,417Average Spent $836.51 $922.70 $1,008.00Spending Potential Index 46 51 56
Investments: Total $ $2,086,627 $11,672,344 $46,818,978Average Spent $710.95 $853.30 $942.26Spending Potential Index 34 41 45
Retail Goods: Total $ $36,276,167 $185,325,190 $728,059,895Average Spent $12,359.85 $13,548.15 $14,652.63Spending Potential Index 51 56 61
Shelter: Total $ $25,874,983 $131,828,031 $519,765,220Average Spent $8,816.01 $9,637.26 $10,460.58Spending Potential Index 54 59 64
TV/Video/Audio:Total $ $2,122,711 $10,800,439 $42,584,904Average Spent $723.24 $789.56 $857.05Spending Potential Index 56 61 66
Travel: Total $ $2,644,457 $13,515,995 $53,217,776Average Spent $901.01 $988.08 $1,071.04Spending Potential Index 49 54 58
Vehicle Maintenance & Repairs: Total $ $1,710,773 $8,803,303 $34,759,467Average Spent $582.89 $643.56 $699.55Spending Potential Index 53 59 64
Data Note: Consumer spending shows the amount spent on a variety of goods and services by households that reside in the area. Expenditures are shown by broadbudget categories that are not mutually exclusive. Consumer spending does not equal business revenue. Total and Average Amount Spent Per Household represent annualfigures. The Spending Potential Index represents the amount spent in the area relative to a national average of 100.Source: Consumer Spending data are derived from the 2010 and 2011 Consumer Expenditure Surveys, Bureau of Labor Statistics. Esri.
October 24, 2013
©2013 Esri Page 7 of 7
Source: U.S. Census Bureau, Census 2010 Summary File 1. Esri forecasts for 2013 and 2018. Esri converted Census 2000 data into 2010 geography.
Shannon
Rectangle