SFD Promotion Initiative Patna India
27
SFD Promotion Initiative Patna India Final Report This SFD Report was created through field-based research by Population Services International (PSI) Date of production: 10 Jan 2017 Last update: 06 Feb 2018
Transcript of SFD Promotion Initiative Patna India
SFD Promotion Initiative
Patna
India
Final Report
This SFD Report was created through field-based
research by Population Services International (PSI)
Date of production: 10 Jan 2017
Last update: 06 Feb 2018

Last Update: 06/02/2018 I
Patna
India Produced by: PSI Executive Summary
SFD Report Patna, India, 2018
Produced by:
Putul Thakur and Sanjay Singh
Edited by:
Population Services International (PSI)
© Copyright The tools and methods for SFD production were developed by the SFD Promotion Initiative and are available from:
www.sfd.susana.org. All SFD materials are freely available following the open-source concept for capacity development
and non-profit use, so long as proper acknowledgement of the source is made when used. Users should always give
credit in citations to the original author, source and copyright holder.

Last Update: 06/02/2018 II
Patna
India Produced by: PSI Executive Summary
1. The Diagram
2. Diagram information
Desk or field based:
This is a field-based SFD.
Produced by:
This SFD is prepared by Population Services International (PSI).
Status:
Final report.
Date of production:
10/01/2017
3. General city information
Patna, the state capital of Bihar, is situated on the southern bank of Ganga River. The city is surrounded by two other rivers on two other sides: Sone River and Pun-Pun River.
Patna is the second largest city in eastern India after Kolkata. For the preparation of the SFD, the territory of Patna Municipal Corporation (PMC) is selected.
The city of Patna is divided into four circles under control of executive officers, with 72 wards, administered by PCM. The names of the four circles are New Capital Circle, Bankipur
Circle, Kankarbagh Circle and Saidpur Circle (KII-PMC, 2016).
The total population of the city is 1.68 million with decadal growth rate of 22% and annual growth rate of 2.1%, as per the 2011 census. The population density of the PMC area is 15,640 persons per square kilometre. The total area under PMC is 109.21 km2, which is 23 km in length and 18 km wide (PMC, 2016).
Patna has road and train connectivity to other districts, so a lot of people commute to other parts of Bihar through Patna. Many people also come to Patna for education and availing advanced medical services. The diurnal population of Patna is 0.3 million per day (PMC, 2016).
PMC area is distributed as follows: 48% is residential, 17% is vacant/agricultural and 10% is public and semi-public area.

Last Update: 06/02/2018 II
Patna
India Produced by: PSI Executive Summary
4. Service delivery context
The Ministry of Urban Development (MoUD) formulated the National Urban Sanitation Policy (NUSP) in 2009. Recognizing sanitation as state subject, this policy provides an overall framework for all towns and cities for becoming totally sanitized. NUSP program was facilitated by PMC under the Supported Program for Urban Reformation (SPUR), sponsored by the Department for International Development (DFID).
The key components of the policy include: (1) generating awareness and policy change towards sanitation, (2) achieving open defecation free cities, (3) developing city sanitation plans and (4) achieving sanitary and safe disposal of 100% human excreta.
The Atal Mission for Rejuvenation Urban Transformation (AMRUT) mission was formulated in 2015 for 500 cities of India, including Patna and conceding funds from central and state government. AMRUT has five mandates: 1) water supply, 2) sewerage facilities and septage management, 3) storm water drain to reduce flooding, 4) pedestrian, 5) creating green spaces and parks.
The National Ganga Basin Rejuvenation Program (NGBRP) was launched in June 2014 for cities and gram panchayats (a village council) from the Ganga River basin. The key mandate of the program is ensuring sustainable municipal sewage management where the central government allocated funds for successful implementation of this program. This program is a subsequent program of the Ganga Action Plan launched in 1985.
The 74th Constitutional Amendment Act of 1992 reformed the sector by transferring responsibility of domestic and commercial Water Supply and Sewerage (WSS) from state agencies to Urban Local Bodies (ULBs). The expectations arising from the 74th amendment have not been fully met. Of the 18 functions to be devolved to the ULBs, the Twelfth Schedule of the Bihar Municipal Act 2007 has mandated 16 functions. In this regard, water, sewerage and solid waste management have been transferred to ULBs.
Planning for water supply and sanitation in PMC is carried out by the Bihar Rajya Jal Parishad (BRJP) based on mandates developed by the Urban Development and Housing Department (UD&HD). Operation and management of water pumping stations and sewer treatment plants are also maintained by BRJP. While the tariff and revenue collection is regulated by PMC, the Bihar Pollution Control Board (BPCB) regulates the pollution control in PMC area.
There are four Sewerage Treatment Plants (STPs) in the city, maintained and operated by BRJP. The total capacity of all the STPs is 109 Million Litres per Day (MLD). Individual treatment capacities are 45 MLD, 35 MLD, 25 MLD and 4 MLD. However, all STPs do not operate at their full capacity. Only 21% of the Households (HHs) in the city are connected through a sewer network. The remaining HHs are dependent on on-site sanitation systems.
There is no regulation for construction of septic tanks in city. The majorly of the Faecal Sludge (FS) from septic tanks is emptied by private emptiers and discharged into open drains connected to rivers.
Population Services International (PSI), an international NGO, has taken initiative of establishing decentralized FS treatment plants in Patna. PSI is also engaged with private emptiers for safe collection and discharge of FS.
5. Service outcomes
The Census of India from 2011 was the first census to include a section on HH sanitation facilities (Census, 2011). The census focused on the containment technologies present in HHs. Connections to the central sewer system were also included.
• Containment. As per census, 92.3% of HHs in Patna have toilet facilities with 21.5% of the toilets connected to the sewer system, 65.5% of the toilets connected to septic tanks and 2.8% with pit latrines and other systems. Moreover, 2.4% of the HHs are dependent on public toilets and 5% practice open defecation.
• Emptying. PMC has a total of 8 vacuum tankers with jetting and suction pump assembled with a truck/tractor. The capacity of the vacuum tankers is 1,000 or 3,000 litres. Emptying of the pits is carried out based on HHs a requisition. An amount of INR 1,000 (USD 15) is charged for each service. In general, septic tanks are emptied by private emptiers with emptying fees ranging from INR 1,500 to 1,800 (USD 18-23) per service.
• Transportation. For off-site sanitation systems, the user interface is connected to the sewer network and wastewater (WW) is transported to the STPs. For on-site containment systems, FS collected is generally discharged into open drains, sewer manholes or canals connected to the rivers.

Last Update: 06/02/2018 III
Patna
India Produced by: PSI Executive Summary
• Treatment. Treatment of WW carried
through sewers is carried out by Activated Sludge Process (ASP) technology. The total volume of WW transported to STP for treatment is not known.
• End-use/Disposal. Treated WW has a Biological Oxygen Demand (BOD) of 80-100 mg/l whereas the Chemical Oxygen Demand (COD) is around 250mg/l. Treated WW is disposed-off to Pun-Pun and Ganga Rivers.
Figure 1: Treated WW from a STP to Pun-Pun River
(Credit: Rabhesh & Abhishek)
In terms of supply of safe drinking water, almost
40% of HHS are dependent on treated source
of drinking water (Census, 2011), 45% of HHs
draw water from hand pumps or deep bore-
wells of depth between 40 to 100 feet. The
remaining 15% is dependent on another
untreated source of water (EIA Saidpur, 2015).
PMC also pumps water through deep tube-well
for drinking water supply to households. Hence,
there is a possibility that contaminated water is
consumed by people of Patna.
6. Overview of stakeholders
The Indian constitution classifies questions
concerning the water and sanitation sector as
state subjects. Both state-level and
municipality-level agencies such as ULBs share
responsibilities for the water and sanitation
sector. Several private sector organizations and
development partners are also involved.
Sulabh International, a non-profit organization,
plays a crucial role in providing public toilets in
the city at areas with high mobility such as
railway stations, bus stands or auto stands. Key
stakeholders interviewed to produce the SFD of
Patna are outlined in Table 1.
Table 1: Sanitation Sector Stakeholder
Table 2 shows the PMC departments or agencies responsible for sanitation service delivery, divided in 4 sectors.
Table 2: Institutional framework for sanitation sector in
Patna
7. Credibility of data
Data concerning the containment facilities in
Patna was drawn from the Census of India
2011. Data concerning the further steps of the
sanitation chain such as emptying, transport,
treatment and end-use/disposal were collected
from official reports, secondary literature review
and the outcomes of Key Informant Interviews
(KIIs) that were conducted during a visit to the
PMC and BRJP headquarters in December
2016. These data are accounted as mostly
qualitative. No focus group discussions were
conducted.
Assumptions:
✓ Census 2011 data was regarded as
correct.
✓ Data gap is found in total WW
transported to the STPs. Considering
the leakage in sewer networks, WW
transported to STPs is taken as 50%.
✓ Data gap was found on the proportion
of FS discharged in sewer/open drains
and open ground. It was assumed of
50%.
Key Stakeholders Institutions/Organizations
Public Institutions PMC, BRJP
Private Sector Private pit emptier
Non-Government
Organization PSI
Service Responsible Agencies
Planning BRJP, PMC
Implementation BRJP, PMC
Operation and
maintenance
(O&M)
BRJP, PMC
Tariff Setting PMC

Last Update: 06/02/2018 IV
Patna
India Produced by: PSI Executive Summary
8. Process of SFD development
This SFD is based on data derived from outcomes of the census of India from 2011. Wherever possible, census data were cross-checked with data from secondary sources such as the City Sanitation Plan (CSP), its review, several organizations and the city development plan.
The SFD calculation tool was then used to calculate the percentage of safely and unsafely managed WW and FS.
Limitations of SFD:
SFD is developed based on the risk of groundwater contamination which was difficult to validate.
9. List of data sources
-BRJP, 2016. "lab Technician Interview". (27
Dec 2016).
-Census, 2011. “Census of India”. Patna: GoI.
-EIA Saidpur, 2015. "Revised EIA Report of
Design Construction, Operation and,
maintenance of STP & Sewer Network at
Saidpur, Patna: s.n."
-KII-PMC, 2016. "Interview with Additional
Municipal Commissioner" (27 Dec 2016).
-MD-BRJP, 2016. "Interview with Managing
Director, BRJP-KII" (21 Dec 2016).
-PMC, P. M. C.,2016. Wikipedia.
SFD Patna, India, 2018 Produced by: Population Services International (PSI)
Copyright
The tools and methods for SFD production were
developed by the SFD Promotion Initiative and are
available from: www.sfd.susana.org .
All SFD materials are freely available following the
open-source concept, so long as proper
acknowledgement of the source is made when
used. Users should always give credit in citations
to the original author, source and copyright holder.

Last Update: 06/02/2018 1
Patna
India SFD Report
Produced by: PSI
Table of Contents
1 City context .................................................................................................................... 4
2 Service delivery context.................................................................................................. 5
2.1 Policy, legislation and regulations............................................................................ 5
2.1.1 Policy legislation and regulation at national level .............................................. 5
2.1.2 Policy, legislation and regulation at state and ULB level ................................... 6
2.1.3 Institutional roles .............................................................................................. 6
2.1.4 Service provision .............................................................................................. 8
2.1.5 Service standards ............................................................................................ 8
3 Service Outcome ............................................................................................................ 8
3.1 Overview ................................................................................................................. 8
3.2 Off-site technologies................................................................................................ 9
3.3 On-site technologies................................................................................................ 9
3.3.1 Septic tanks ..................................................................................................... 9
3.3.2 Pit latrines .......................................................................................................10
3.3.3 Open defecation ..............................................................................................10
3.4 Emptying ................................................................................................................10
3.5 Transportation ........................................................................................................11
3.6 Treatment and disposal ..........................................................................................11
4 SFD Matrix ....................................................................................................................13
4.1 SFD for Patna ........................................................................................................13
4.2 Off-site sanitation systems .....................................................................................13
4.3 On-site sanitation systems .....................................................................................14
5 Risk of groundwater contamination ...............................................................................17
6 Uncertainty of the data ..................................................................................................17
7 Key Informant Interviews ...............................................................................................17
8 Acknowledgements .......................................................................................................18
9 References ....................................................................................................................19
10 Appendix....................................................................................................................20
10.1 Appendix 1: Stakeholder identification ....................................................................20
10.2 Appendix 2: Tracking of engagement .....................................................................21

Last Update: 06/02/2018 2
Patna
India SFD Report
Produced by: PSI
List of tables
Table 1: Population and decadal population growth rate of Patna. ........................................ 5
Table 2: Institutional roles and responsibilities ....................................................................... 7
Table 3: Institutional framework for water and sanitation. ...................................................... 8
Table 4: Treated WW quality at Beur STP. ...........................................................................11
Table 5: STPs design capacity and current volume of WW being treated. ............................12
Table 6: Final estimations for the SFD matrix calculation of containment systems. ..............12
Table 7: Summary of sanitation systems and the WW/FS fate through the sanitation chain,
including all assumptions made ............................................................................................16
List of figures
Figure 1: Administrative map of Patna ................................................................................... 4
Figure 2: Solid waste in storm drain. ...................................................................................... 9
Figure 3: SFD Selection Grid for Patna. ...............................................................................10
Figure 4: Government tanker belonging to PMC. ..................................................................11
Figure 5: SFD of Patna. ........................................................................................................13
Figure 6: Raw sewage in collection tank with solid waste shows leakage in sewer network. 14
Figure 7: Private tanker operator discharging FS into open drains. ......................................15

Last Update: 06/02/2018 3
Patna
India SFD Report
Produced by: PSI
Abbreviations
ASP Activated Sludge Process
AMRUT Atal Mission for Rejuvenation and Urban Transformation
BIS Bureau of Indian Standard
BOD Biological Oxygen Demand
BPCB Bihar Pollution Control Board
BRJP Bihar Rajya Jal Parishad
BUIDCO Bihar Urban Infrastructure Development Corporation
COD Chemical Oxygen Demand
CPHEEO Central Public Health Engineering and Environment Organization
CSP City Sanitation Plan
CRSP Central Rural Sanitation Program
DFID Department for International Development
EPA Environmental Protection Act
FS Faecal Sludge
FSM Faecal Sludge Management
HH Household
INR Indian Rupee
JNNURM Jawaharlal Nehru National Urban Rejuvenation Mission
KII Key Informant Interview
MoUD Ministry of Urban Development
MLD Million Liter Day
NBA Nirmal Bharat Abhiyan
NUSP National Urban Sanitation Program
NGBRP National Ganga Basin Rejuvenation Program
O&M Operation and Management
PMC Patna Municipal Corporation
PSI Population Services International
SFD Shit Flow Diagram
SMP Septage Management Sub-Plan
STP Sewerage Treatment Plant
SBM Swacch Bharat Mission
SN Supernatant
SPUR Supported Program for Urban Reformation
TSC Total Sanitation Campaign
TSS Total Suspended Solid
UD & HD Urban Development and Housing Development
ULB Urban Local Body
USD United States Dollar
WSS Water Supply and Sewerage
WW Wastewater
Last Update: 06/02/2018 4
Patna
India Produced by: PSI SFD Report
1 City context
Patna, state capital of Bihar, is one of the oldest inhabited and civilized places in the world
(Wikipedia, 2016). It is located between the Ganga River in the North, the Pun-Pun River in
the South and the Sone River in the west (Wikipedia, 2017).
The city is approximately 25 km long and 9 to 10 km wide, being the second highest populated
city in eastern region after Kolkata (EIA Saidpur, 2015). The city is divided into four circles
under control of executive officers, with 72 wards, administered by Patna Municipal
Corporation (PMC). Names of the four circles are New Capital Circle, Bankipur Circle,
Kankarbagh Circle and Saidpur Circle. Total area under PMC is 109.21 km2 which is 23 km in
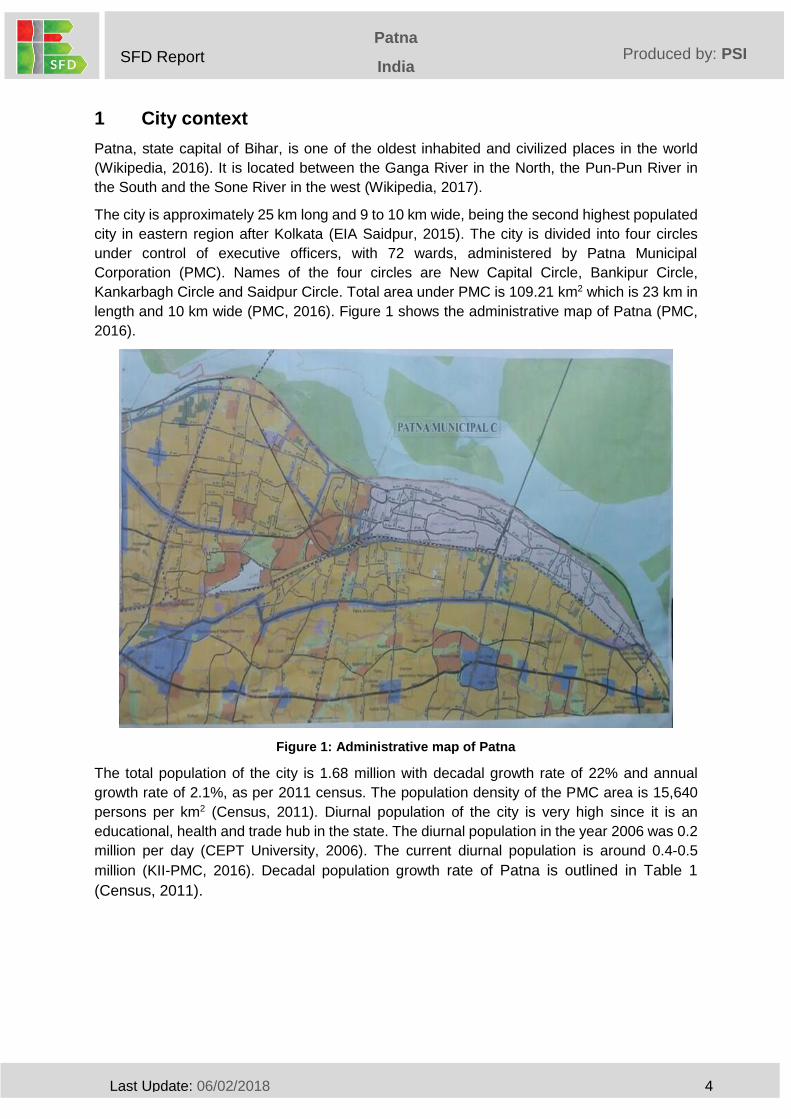
length and 10 km wide (PMC, 2016). Figure 1 shows the administrative map of Patna (PMC,
2016).
Figure 1: Administrative map of Patna
The total population of the city is 1.68 million with decadal growth rate of 22% and annual
growth rate of 2.1%, as per 2011 census. The population density of the PMC area is 15,640
persons per km2 (Census, 2011). Diurnal population of the city is very high since it is an
educational, health and trade hub in the state. The diurnal population in the year 2006 was 0.2
million per day (CEPT University, 2006). The current diurnal population is around 0.4-0.5
million (KII-PMC, 2016). Decadal population growth rate of Patna is outlined in Table 1
(Census, 2011).

Last Update: 06/02/2018 5
Patna
India Produced by: PSI SFD Report
Table 1: Population and decadal population growth rate of Patna
Year Population Decadal
growth rate (%)
1951 283,000 -- 1961 365,000 29 1971 473,000 30 1981 776,371 64 1991 917,243 18 2001 1,366,444 49 2011 1,683,200 24
The city has an elevation of 53m above sea level. A characteristic feature of the geography of
Patna is at the confluence of rivers. Ganga River flows a total of 445km of its total length of
2,525km through the entire state. It has a narrow strip of high land of about 8km in width along
the southern bank of the Ganga River, having very fertile soil and alluvial fertile plains in the
remaining portions (Wikipedia, 2016).
Patna has a humid subtropical climate with an extremely hot summer from late March to early
June, monsoon season from late June to late September and chilly winter nights and foggy or
sunny days from November to February (Wikipedia, 2016).
2 Service delivery context
The need for sanitation for all was first addressed through the Central Rural Sanitation Policy
(CRSP) in 1986 (Department of drinking water supply, 2007). This flagship program was
followed by many other central and state programs like the Total Sanitation Campaign (TSC),
the Nirmal Bharat Abhiyan (NBA) and the Swacch Bharat Mission (SBM).
2.1 Policy, legislation and regulations
2.1.1 Policy legislation and regulation at national level
In 2008, the Ministry of Urban Development (MoUD) issued the National Urban Sanitation
Policy (NUSP). The policy aims to: (1) raise awareness, (2) promote behaviour change, (3)
achieve open defecation free cities, (4) develop citywide sanitation plans and (5) provide 100%
safe containment, transport, treatment and disposal of human excreta and liquid wastes. The
NUSP mandates states to develop state urban sanitation strategies and work with cities to
develop City Sanitation Plans (CSPs). NUSP specifically highlights the importance of safe and
hygienic facilities with proper disposal and treatment of sludge from on-site systems (septic
tanks, pit latrines, etc.) and proper Operation and Maintenance (O&M) of all sanitary facilities
and elimination of manual scavenging. Furthermore, it explicitly states that cities and states
must issue policies and technical solutions that address on-site sanitation, including the safe
containment of Faecal Sludge (FS). The objectives of NUSP are implemented through CSPs
and state sanitation strategies (MoUD, 2008). As of now, there are very few cities which have
completed their CSPs, meaning that those plans are also not implemented yet. This remains
a major drawback in the implementation of NUSP.

Last Update: 06/02/2018 6
Patna
India Produced by: PSI SFD Report
The advisory note on septage management in urban India, issued by MoUD in 2013,
recommends supplementing CSPs with the Septage Management Sub-Plan (SMP) as a part
of the CSP, and being prepared and implemented by cities. Septage here broadly refers not
only to FS removed from septic tanks but also FS removed from pit latrines and similar on-site
toilets. This advisory note also provides references to the Central Public Health and
Environmental Engineering Organization (CPHEEO) guidelines, the Bureau of Indian Standard
(BIS) standards, and other resources that users of this advisory may refer to while preparing
their SMP. It clearly discusses on techno-managerial and socio-economic aspects of septage
management in India and provides guidelines for Urban Local Bodies (ULBs) to plan and
implement SMP (MoUD, 2013).
The Water (Prevention and Control of Pollution) Act, 1974 and the Environmental (Protection)
Act (EPA), 1986 together empower the government to take all such measures as it deems
necessary or expedient for protecting and improving the quality of the environment and
preventing, controlling and abating environmental pollution. However, most of the states of
India have not used the provisions of the EPA to introduce specific rules for managing FS (GoI,
1986).
Under the Water Act and the EPA, the central government supports programs/schemes for
wastewater (WW) management to limit environmental pollution. Launched in 2005, The
Jawaharlal Nehru National Urban Renewal Mission (JNNURM) encouraged investments in
centralized sewerage systems. Faecal Sludge Management (FSM) and on-site sanitation
improvements, were, in general, not covered (Gol and MoUD, 2006).
The Swachh Bharat Mission (SBM), launched in 2014, supports the goals expressed in the
NUSP financially, focusing on the needs of the urban poor. The Atal Mission for Rejuvenation
and Urban Transformation (AMRUT), launched in 2015, considers FSM as one of its mission
components and concedes financial support for the urban poor (GoI and MoUD, 2015).
2.1.2 Policy, legislation and regulation at state and ULB level
According to the constitution of India, water and sanitation is a state subject. Statutory powers
are conferred to the state for making laws on water and sanitation. The expectations arising
from the 74th amendment have not been fully met. Of the 18 functions to be devolved to the
ULBs, the Twelfth Schedule of the Bihar Municipal Act 2007 has mandated 16 functions. While
water, sewerage and solid waste management have been transferred to ULBs, inadequate
capacities at local government level have hindered effective service delivery (CEPT University,
2006)
As part of NUSP implementation, the government of Bihar initiated the Support Programme
for Urban Reforms (SPUR), funded by the Department for International Development (DFID).
The program focus was to develop citywide sanitation plans and implement them by integrating
all aspects of sanitation in an effective way (GoB, 2010).
2.1.3 Institutional roles
The Urban Development and Housing Department (UD&HD) of Bihar is the nodal department
for policy formulation and guidance for the urban Water Supply and the Sewerage (WSS)
Last Update: 06/02/2018 7
Patna
India Produced by: PSI SFD Report
sector. The UD&HD allocates resources to ULBs through various centrally-sponsored
schemes, providing finance support through national financial institutions. It also supports
various external assistance programs for housing and urban development in the state,
establishing coordination between various departments of the state such as BRJP and PMC,
among others, to develop water and sanitation facilities in the state.
The CPHEEO, created in 1953, is the technical wing of the MoUD, advising the ministry on all
technical matters and collaborating with the state agencies in water supply and sanitation
activities. CPHEEO plays a critical role in externally-funded and special programmes and in
setting design standards and norms for urban water supply and sanitation (CPHEEO, 2006)
The 74th Constitutional Amendment Act of 1992 reformed the sector by transferring
responsibility for domestic, industrial, and commercial WSS from state agencies, such as the
public health engineering department and the state water boards, to ULBs. This reform
mandated the transfer of WSS management and solid waste management as a core area of
the PMC act, 2007. This resulted in a variety of implementation models, as well as a lack of
clarity in the allocation of roles and responsibilities between state and local agencies, leaving
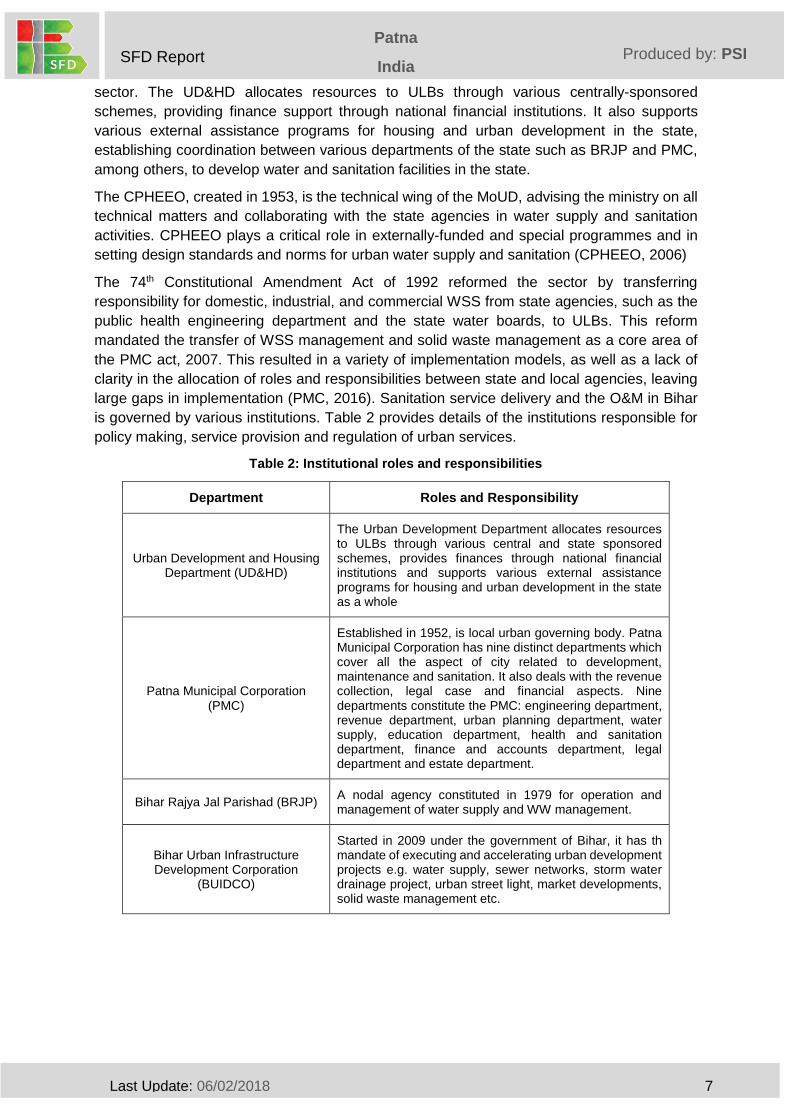
large gaps in implementation (PMC, 2016). Sanitation service delivery and the O&M in Bihar
is governed by various institutions. Table 2 provides details of the institutions responsible for
policy making, service provision and regulation of urban services.
Table 2: Institutional roles and responsibilities
Department Roles and Responsibility
Urban Development and Housing Department (UD&HD)
The Urban Development Department allocates resources to ULBs through various central and state sponsored schemes, provides finances through national financial institutions and supports various external assistance programs for housing and urban development in the state as a whole
Patna Municipal Corporation (PMC)
Established in 1952, is local urban governing body. Patna Municipal Corporation has nine distinct departments which cover all the aspect of city related to development, maintenance and sanitation. It also deals with the revenue collection, legal case and financial aspects. Nine departments constitute the PMC: engineering department, revenue department, urban planning department, water supply, education department, health and sanitation department, finance and accounts department, legal department and estate department.
Bihar Rajya Jal Parishad (BRJP) A nodal agency constituted in 1979 for operation and management of water supply and WW management.
Bihar Urban Infrastructure Development Corporation
(BUIDCO)
Started in 2009 under the government of Bihar, it has th mandate of executing and accelerating urban development projects e.g. water supply, sewer networks, storm water drainage project, urban street light, market developments, solid waste management etc.

Last Update: 06/02/2018 8
Patna
India Produced by: PSI SFD Report
2.1.4 Service provision
Institutional arrangements for water supply, sanitation and sewerage management vary in
different cities. State level government department is responsible for planning and fund
allocation of WSS management while ULBs manage O&M. Table 3 shows the planning, O&M,
tariff and regulation of various facilities in Patna by different departmental institutions (KII-PMC,
2016).
Table 3: Institutional framework for water and sanitation
State department
Planning Implementation Operation and Management
Tariff Regulation
Water Supply UD&HD BRJP ULB & BRJP ULBs BPCB
FSM UD&HD BRJP ULB & BRJP ULBs BPCB
On-site Sanitation
Nil Nil Nil Nil Nil
Taxes levied for water and sanitation by ULBs are minimal and are collected in the form of
holding tax. Holding tax include water tax (2%), sanitation tax (2.5%), education tax (1.5%),
health tax (1%) and other taxes (KII-PMC, 2016).
2.1.5 Service standards
Though the central government has prescribed service level benchmarks for urban areas,
there are no standards being executed/followed for service delivery, health, water, waste water
management and solid waste management at state level (GoB, 2010).
3 Service Outcome
The analysis of service outcomes is based on data gathered from desk- and field-based
studies. Census 2011 data were used to produce the Shit Flow Diagram (SFD) of Patna.
Census data were validated through field based research by conducting various Key Informant
Interviews (KIIs). Data on sewer network and treatment of WW were collected by visiting the
office of BRJP and visits to the Sewerage Treatment Plants (STPs). Data on on-site
containment were taken from the census, whereas transportation, treatment and disposal of
FS/WW were collected by meetings with relevant people from the sanitation sector in the city.
The objective of developing a SFD for Patna is to present a clear picture of the sanitation
situation in the city.
3.1 Overview
This section provides an overview of the range of containment systems and sanitation
infrastructure in the city. Almost 92% of the households have individual toilets in their
households (HHs). Only 3 % of the population is dependent on community toilets, maintained
by ULBs. The remaining 5% practice open defecation (Census, 2011).
Last Update: 06/02/2018 9
Patna
India Produced by: PSI SFD Report
3.2 Off-site technologies
One-fifth (21.7%) of the population is connected to sewer lines. WW flows to the STPs through
the sewer network (MD-BRJP, 2016).
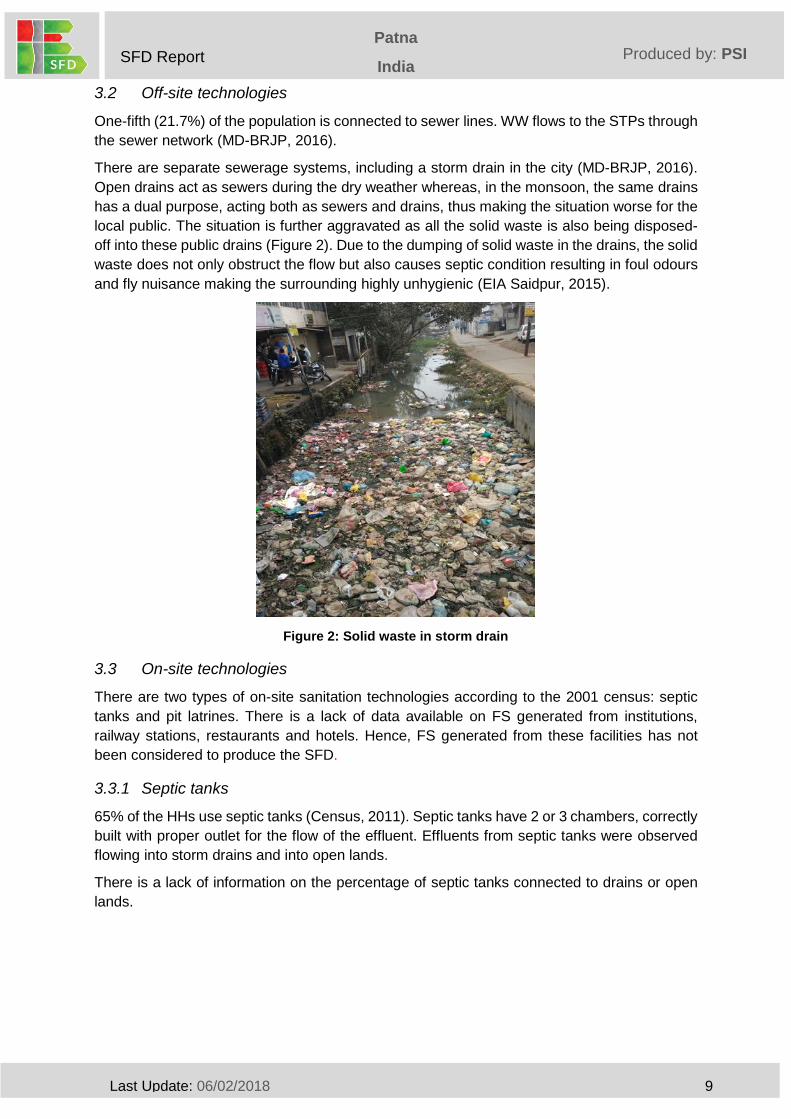
There are separate sewerage systems, including a storm drain in the city (MD-BRJP, 2016).
Open drains act as sewers during the dry weather whereas, in the monsoon, the same drains
has a dual purpose, acting both as sewers and drains, thus making the situation worse for the
local public. The situation is further aggravated as all the solid waste is also being disposed-
off into these public drains (Figure 2). Due to the dumping of solid waste in the drains, the solid
waste does not only obstruct the flow but also causes septic condition resulting in foul odours
and fly nuisance making the surrounding highly unhygienic (EIA Saidpur, 2015).
Figure 2: Solid waste in storm drain
3.3 On-site technologies
There are two types of on-site sanitation technologies according to the 2001 census: septic
tanks and pit latrines. There is a lack of data available on FS generated from institutions,
railway stations, restaurants and hotels. Hence, FS generated from these facilities has not
been considered to produce the SFD.
3.3.1 Septic tanks
65% of the HHs use septic tanks (Census, 2011). Septic tanks have 2 or 3 chambers, correctly
built with proper outlet for the flow of the effluent. Effluents from septic tanks were observed
flowing into storm drains and into open lands.
There is a lack of information on the percentage of septic tanks connected to drains or open
lands.

Last Update: 06/02/2018 10
Patna
India Produced by: PSI SFD Report
3.3.2 Pit latrines
Four percent of the toilets are either unlined pits or lined pits with semi-permeable walls and
open/closed bottom (Census, 2011). Generally, these pits are manually emptied by private
emptiers (KII-PMC, 2016). Emptied FS is discharged into nearby open drains or open grounds.
3.3.3 Open defecation
Five percent of the population practice open defecation.
Combining the previous assumptions, Figure 3 shows the selection grid of the containment
technologies for Patna.
Figure 3: SFD Selection Grid for Patna
3.4 Emptying
Emptying of septic tanks is generally carried out by private emptiers. An amount of INR 1,200-
1,500 (USD 18-23) is charged for each emptying.
Patna Municipal Corporation has two vacuum tankers in each municipal circle with jetting and
suction machine assembled with a truck/tractor (Figure 4). Between two or three tanks are
emptied on demand per day (KII-PMC, 2016). Emptying of septic tanks is generally carried out
early morning or at night. PMC charges INR 1,000 (USD 15) for emptying a septic tank (KII-
PMC, 2016).
Last Update: 06/02/2018 11
Patna
India Produced by: PSI SFD Report
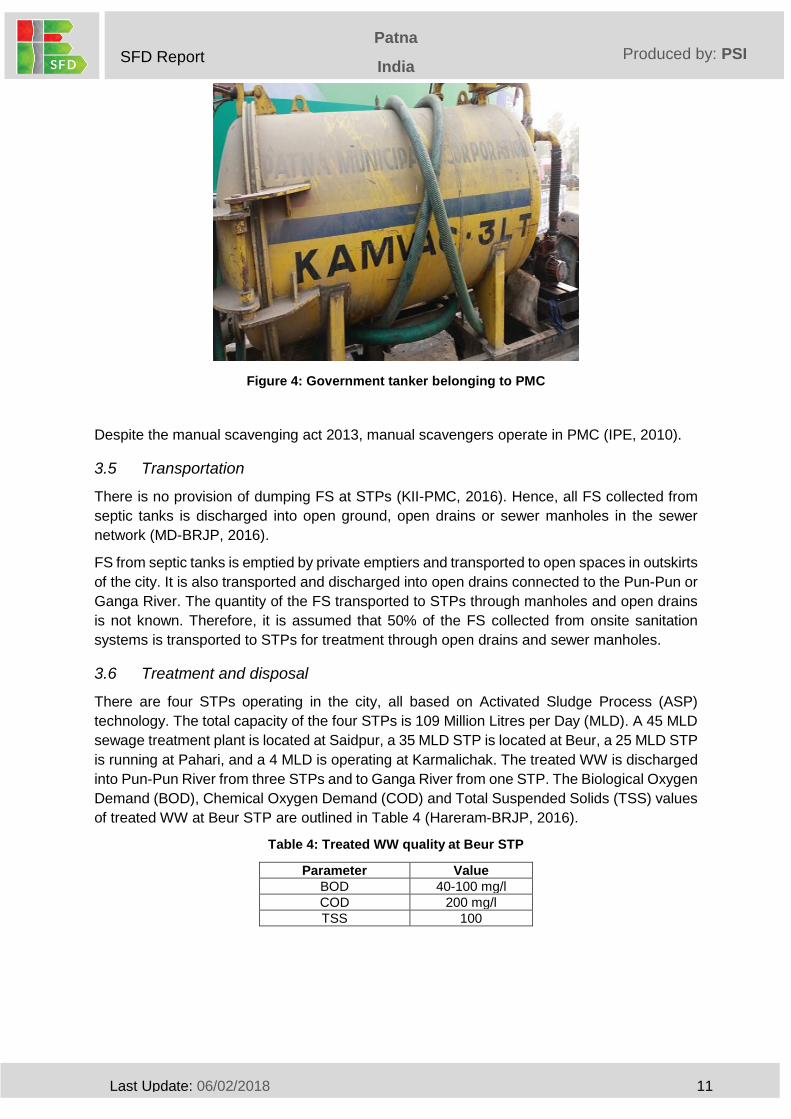
Figure 4: Government tanker belonging to PMC
Despite the manual scavenging act 2013, manual scavengers operate in PMC (IPE, 2010).
3.5 Transportation
There is no provision of dumping FS at STPs (KII-PMC, 2016). Hence, all FS collected from
septic tanks is discharged into open ground, open drains or sewer manholes in the sewer
network (MD-BRJP, 2016).
FS from septic tanks is emptied by private emptiers and transported to open spaces in outskirts
of the city. It is also transported and discharged into open drains connected to the Pun-Pun or
Ganga River. The quantity of the FS transported to STPs through manholes and open drains
is not known. Therefore, it is assumed that 50% of the FS collected from onsite sanitation
systems is transported to STPs for treatment through open drains and sewer manholes.
3.6 Treatment and disposal
There are four STPs operating in the city, all based on Activated Sludge Process (ASP)
technology. The total capacity of the four STPs is 109 Million Litres per Day (MLD). A 45 MLD
sewage treatment plant is located at Saidpur, a 35 MLD STP is located at Beur, a 25 MLD STP
is running at Pahari, and a 4 MLD is operating at Karmalichak. The treated WW is discharged
into Pun-Pun River from three STPs and to Ganga River from one STP. The Biological Oxygen
Demand (BOD), Chemical Oxygen Demand (COD) and Total Suspended Solids (TSS) values
of treated WW at Beur STP are outlined in Table 4 (Hareram-BRJP, 2016).
Table 4: Treated WW quality at Beur STP
Parameter Value
BOD 40-100 mg/l
COD 200 mg/l
TSS 100
Last Update: 06/02/2018 12
Patna
India Produced by: PSI SFD Report
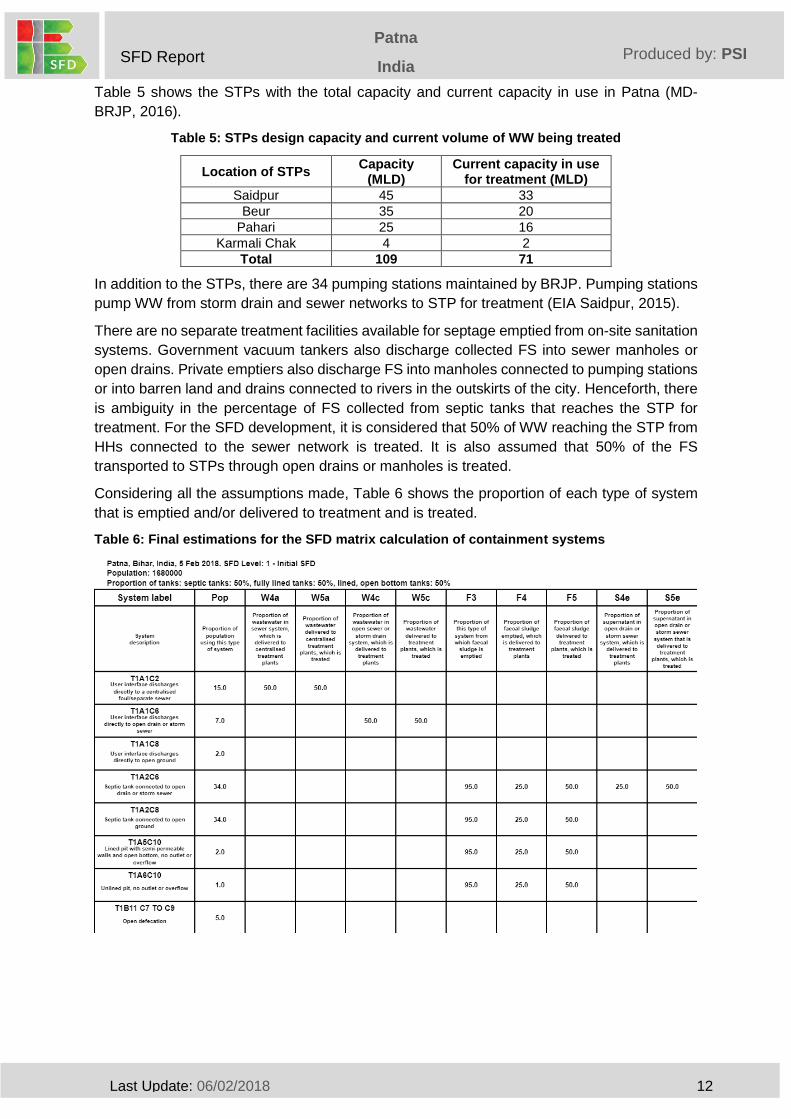
Table 5 shows the STPs with the total capacity and current capacity in use in Patna (MD-
BRJP, 2016).
Table 5: STPs design capacity and current volume of WW being treated
Location of STPs Capacity
(MLD) Current capacity in use
for treatment (MLD)
Saidpur 45 33
Beur 35 20
Pahari 25 16
Karmali Chak 4 2
Total 109 71
In addition to the STPs, there are 34 pumping stations maintained by BRJP. Pumping stations
pump WW from storm drain and sewer networks to STP for treatment (EIA Saidpur, 2015).
There are no separate treatment facilities available for septage emptied from on-site sanitation
systems. Government vacuum tankers also discharge collected FS into sewer manholes or
open drains. Private emptiers also discharge FS into manholes connected to pumping stations
or into barren land and drains connected to rivers in the outskirts of the city. Henceforth, there
is ambiguity in the percentage of FS collected from septic tanks that reaches the STP for
treatment. For the SFD development, it is considered that 50% of WW reaching the STP from
HHs connected to the sewer network is treated. It is also assumed that 50% of the FS
transported to STPs through open drains or manholes is treated.
Considering all the assumptions made, Table 6 shows the proportion of each type of system
that is emptied and/or delivered to treatment and is treated.
Table 6: Final estimations for the SFD matrix calculation of containment systems
Last Update: 06/02/2018 13
Patna
India Produced by: PSI SFD Report
4 SFD Matrix
4.1 SFD for Patna
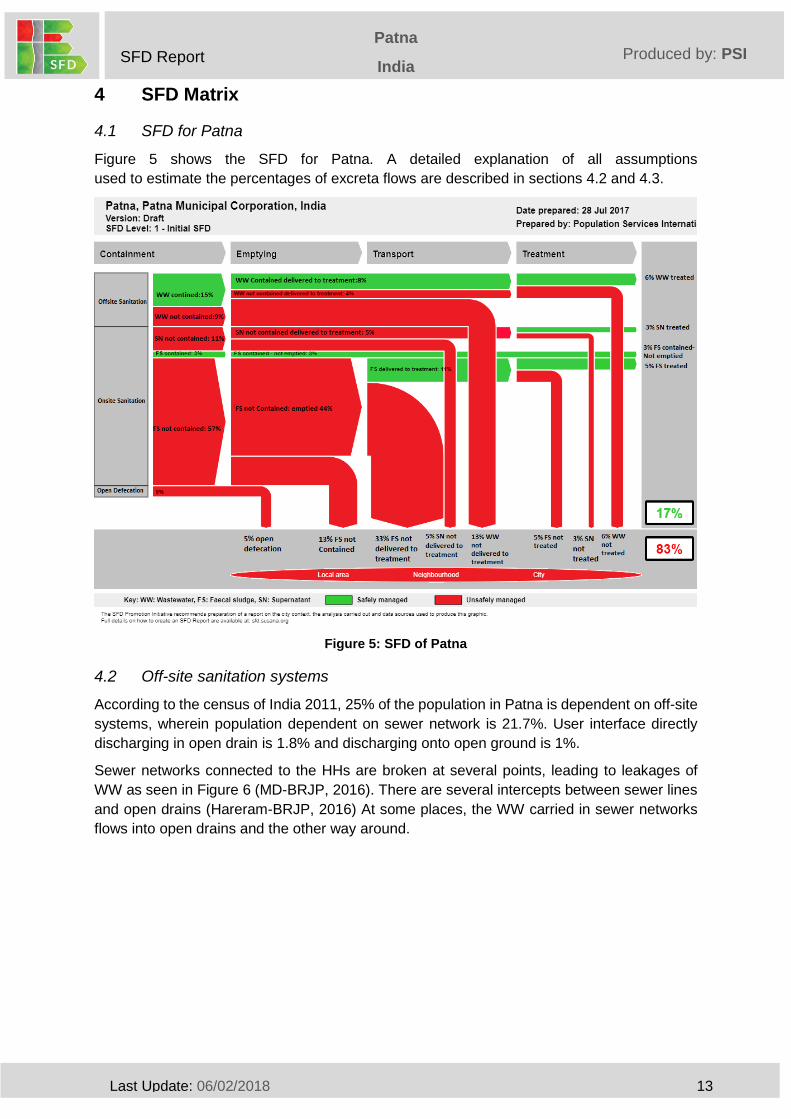
Figure 5 shows the SFD for Patna. A detailed explanation of all assumptions
used to estimate the percentages of excreta flows are described in sections 4.2 and 4.3.
Figure 5: SFD of Patna
4.2 Off-site sanitation systems
According to the census of India 2011, 25% of the population in Patna is dependent on off-site
systems, wherein population dependent on sewer network is 21.7%. User interface directly
discharging in open drain is 1.8% and discharging onto open ground is 1%.
Sewer networks connected to the HHs are broken at several points, leading to leakages of
WW as seen in Figure 6 (MD-BRJP, 2016). There are several intercepts between sewer lines
and open drains (Hareram-BRJP, 2016) At some places, the WW carried in sewer networks
flows into open drains and the other way around.

Last Update: 06/02/2018 14
Patna
India Produced by: PSI SFD Report
Figure 6: Raw sewage in collection tank with solid waste shows leakage in sewer network
The percentage of WW discharged into open drains and sewer network is not known.
Therefore, it is assumed that 70% of the WW generated from HHs connected to piped sewer
system (15%) is discharged into the sewer network and 30% to open drains (7%). Additionally,
WW from 2% of the HHs is discharged directly to open ground.
It is also assumed that only 50% of the WW discharged into the sewer network goes for
treatment to STPs. From all the WW discharged into open drains, only 50% is transported to
the STPs, 50% of which is treated.
4.3 On-site sanitation systems
68% of the population is dependent on on-site sanitation systems. This includes 2.8% of the
population dependent on community toilets, maintained by PMC (KII-PMC, 2016). Effluents of
septic tanks are either discharged into open or storm drains or into open ground. Percentage
of Supernatant (SN) discharged into open drains or open ground is not known. Hence, it is
assumed that 50% of the SN is discharged into open drains and 50% goes into open ground
(Kumar, 2016)
Emptying of on-site sanitation systems is managed by private players. Vacuum tankers from
the government provide services to very few HHs. Since there is no data available on the
percentage of the septic tanks emptied in the city, it is assumed that 95% of the septic tanks
are emptied. It is also assumed that the 5% remaining are abandoned or not being emptied
regularly.
Collected FS is transported and discharged either into drains or open lands after emptying by
vacuum tankers (Figure 7). It is assumed that 50% of FS reach the STPs for treatment through
drains (private tanker operators or government tanker operators discharge FS into manholes)
and 50% is discharged into open ground (Kumar, 2016). It is also assumed that only 50% of
the FS transported through open drains is treated at the STPs. Similarly, 50% of the FS
discharged into open ground is treated.

Last Update: 06/02/2018 15
Patna
India Produced by: PSI SFD Report
Figure 7: Private tanker operator discharging FS into open drains
Almost 2% of the HHs use lined pits with semi-permeable walls or unlined pit types of
containment systems. It is assumed that 95% of the FS generated is emptied, 25% is
transported and 50% is treated at the STPs.
One percent of the population uses unlined pits. Out of that 1%, it is assumed that 95% of the
FS generated is discharged into open drains, 25% of the FS is transported to the STPs and
50% of the transported FS is treated. Open defecation is practiced by 5% of the population.

Last Update: 06/02/2018 16
Patna
India Produced by: PSI SFD Report
As a summary, Table 7 outlines all sanitation systems and the WW/FS fate through the sanitation chain as well as all the assumptions made
to draw the SFD for the city.
Table 7: Summary of sanitation systems and the WW/FS fate through the sanitation chain, including all assumptions made
Sanitation technologies and systems as defined by: SFD
Reference variable
Percentage of
population % emptied
% going for treatment
% treated Assumption Census 2011 SFD promotion initiative
Offsite
Piped sewer system
User interface discharges directly to centralized separate foul/sewer system
T1A1C2 15% - 50% 50%
Considering leakages in piped sewer system, it is assumed that only 70% is transported to STP for treatment
Piped sewer system + No onsite container, night soil discharged to open drain
To open drain T1A1C6 7% - 50% 50%
Remaining 30% of sewage discharged into open drain, including 1% of night soil disposed in open drain
Other system-No onsite containment
User interface discharged directly to open ground
T1A1C8 2% - 50% 50% Discharges to pond or open land
Onsite
Septic tank Storm Drain T1A2C6 34% 95% 25% 50% It is assumed that 50% of the SN goes to storm drain and 50% to open ground. Around 95% is emptied. 50% of the FS collected is discharged in storm drain and 50% is discharged on open ground
Septic Tank Open ground T1A2C8 34% 95% 25% 50%
Pit Latrine with slab
Lined pit with semi-permeable walls and open bottom, no outlet or overflow, general situation
T1A5C10 2% 95% 25% 50%
Due to lack of information, it is assumed that almost 95% of this type of toilet is emptied. 25% FS is transported. 50% of the transported is treated
Pit Latrine without slab
Unlined pit no outlet or overflow, general situation
T1A6C10 1% 95% 25% 50%
Open Defecation Open defecation T1B11C7 to C9 5% - - -

Last Update: 06/02/2018 17
Patna
India SFD Report
Produced by: PSI
5 Risk of groundwater contamination
There are many factors that increase the risk of groundwater contamination. Large part of the
excreta waste is unsafely managed, discharged to open ground or rivers. In a study conducted
by CPHEEO to test the ground water contamination, a significant number of bacterial
contamination was found, suggesting possible groundwater contamination (CPHEEO, 2006).
Almost 36% of the population is dependent on either hand pumps or bore wells (Census,
2011). Remaining 48% of the population consumes tapped water from treated source. BRJP
pumps water from Ganga River for piped water supply for HHs (MD-BRJP, 2016).
Since no accurate data were available and ground water is drawn from more than 100 feet
depth for drinking purposes, ground water risk is considered as low-risk for SFD development.
6 Uncertainty of the data
This report is produced based on desk- as well as field-based data collection. For considering
the type of containment system/technology, census 2011 data has been considered. However,
field visits for data collection were also performed to collect and understand the actual
treatment capacity of STPs, effluents discharged in drains and the place of discharging the FS
by tanker operators after emptying. Moreover, some data were validated from relevant
departments through desk research.
Current data on the percentage of sewage transported and treated was not found. Hence, it
was assumed that only 50% of the total sewage generated from the HHs connected to the
sewer network reaches the STPs. Moreover, due to leakages and inefficiency of the STP, it is
assumed that only 50% of the of the sewage is treated.
Current data on number of septic tanks connected to sewer network is also lacking. Also,
percentage of septic tanks emptied and not emptied was not found. It was assumed that 95%
of the septic tanks are getting emptied by either private or government tanker operator(s). Also,
it was assumed that 50% of the FS extracted from septic tanks is transported to STPs through
open drains or manholes.
7 Key Informant Interviews
Key informant interviews (KIIs) were conducted in accordance with the methodology to verify
the information retrieved from various reports. The aim of the interviews were the validation
and the actualization of data derived from the reports. The interviews were conducted face-to-
face with Mr. Shirshat Kapil Ashok (MD- BRJP and Acting Municipal commissioner), Mr. Vinay
Kumar Mandal (Additional Municipal Commissioner-sanitation) and Mr. Arvind Kumar (Chief
Engineer, BRJP- Patna Municipal Corporation).

Last Update: 06/02/2018 18
Patna
India SFD Report
Produced by: PSI
8 Acknowledgements
This SFD is dedicated to the citizens of Patna. Its production would not have been possible
without the support of Mr. Shirshat Kapil Ashok (MD - BRJP and Acting Municipal
commissioner), Mr. Arvind Kumar (Chief Engineer- BRJP), Mr. Arvind (Supply Chain Manager,
PSI), Mr. Surojeet Chandan (FSM Manager, PSI) and, especially, Mr. Sanjay Singh (Associate
Director- PSI).

Last Update: 06/02/2018 19
Patna
India SFD Report
Produced by: PSI
9 References
Census, 2011. "Census of India". Patna: GoI.
CEPT University, 2006. "Urban Development& Housing Department-Master plan for Patna
2031". Available at: http://jnnurm.nic.in/wp-content/uploads/2010/12/Patna_CEPT.pdf
CPHEEO, 2006. MoUD. Available at: http://cpheeo.nic.in/
CPHEEO, 2006. "City Appraisal-Patna". Available at: http://cpheeo.nic.in/SDWQ%20-
%2025/14%20PATNA.PDF
Department of drinking water supply, 2007. "Central Rural Sanitation Program". Delhi: Ministry
of Rural Development.
EIA Saidpur, 2015. "Revised EIA Report of Design Construction, Operation and, maintenance
of STP & Sewer Network at Saidpur, Patna: s.n."
GoB, 2010. "NUSP- Urban sanitation strategy, Patna: s.n".
GoI, MoUD, 2006. "JnNURM". Available at: http://urban.bih.nic.in/Docs/UIG-Guidelines.pdf
GoI, MoUD, 2015. "AMRUT-Mission Statement and Guideline". Available at:
http://amrut.gov.in/writereaddata/AMRUT%20Guidelines%20.pdf
GoI, 1986. "Environment protection Act". Available at:
http://jkforest.gov.in/act/Environment_Protection_Rules.pdf
Hareram-BRJP, 2016. "lab Technician Interview" (27 Dec 2016).
Infrastructure Professionals Enterprise Private Limited (IPE), Dec 2010. "Bihar Strengthening
Urban Management". Patna: Government of Bihar.
KII-PMC, 2016. "Interview with Additional Municipal Commissioner" (27 Dec 2016).
Kumar, S., 2016. "Private tanker operator interview" (Dec 2016).
MD-BRJP, 2016. "Interview with Managing Director, BRJP-KII" (21 Dec 2016).
MoUD, 2008. "NUSP Guidelines". Available at:
http://moud.gov.in/sites/upload_files/moud/files/NUSP_0.pdf
MoUD, 2013. "MoUD,GOI". Available at:
http://moud.gov.in/pdf/584e4e81a4fa457f1ef4c63a9fSeptageMgmtAdvMay20.05.pdf
PMC, P. M. C.,2016. Wikipedia. Available at:
https://en.wikipedia.org/wiki/Patna_Municipal_Corporation
Wikipedia, 2017. Wikipedia. Available at:
https://en.wikipedia.org/wiki/Patna_Municipal_Corporation
Wikipedia, 2016. https://en.wikipedia.org/wiki/List_of_oldest_continuously_inhabited_cities,
s.l.: s.n.
Wikipedia, 2016. Wikipedia. Available at: https://en.wikipedia.org/wiki/Patna

Last Update: 06/02/2018 20
Patna
India SFD Report
Produced by: PSI
10 Appendix
10.1 Appendix 1: Stakeholder identification
Name of person Name of Organization Position
Mr. Kapil Ashok Shirsat BRJP (Bihar Rajya Jal Parishad and Patna Municipal Corporation)
MD, BRJP
Acting Municipal Commissioner-PMC
Mr. Arvind Kumar BRJP (Bihar Rajya Jal Parishad and Patna Municipal Corporation)
Chief Engineer- BRJP
Mr. Vinay Kumar Mandal Patna Municipal Corporation Additional Municipal Commissioner-Sanitation
Mr. Hareram BRJP, STP- Beur Chemist/Lab Technician
Mr. Sonu Kumar Yadav Private Tanker Operator Private Tanker Operator

Last Update: 06/02/2018 21
Patna
India SFD Report
Produced by: PSI
10.2 Appendix 2: Tracking of engagement
Name Date of Engagement Summary of outcome
Mr. Kapil Ashok Shirsat 19 Dec 2016 The SFD approach was presented, followed by a discussion about the general sanitation situation in the city. An overview on STP and drainage system was provided. Various sites were suggested to visit to gather more information and understanding.
Mr. Hareram 20 Dec 2016 Beur STP was visited, overview of Beur STP functionality, MLDs of WW reaching through drainage network, functionality of other STPs of Patna was discussed.
Mr. Arvind Kumar 21 Dec 2016 Overview of sanitation scenario of Patna was discussed. Discussion on water supply and drainage system was also discussed.
Mr. Hareram 22 Dec 2016 Functionality of Beur STP was understood well. STP capacity, technology, % of WW treated at STP, level of purity of treated water and disposal of treated water was discussed and captured.
Mr. Vinay kumar Mandal 27 Dec 2016 Overview of sanitation system in PMC area was discussed. Census data was validated. Facilities and charges for pit emptying was asked. What happens to collected FS was also discussed. Additionally, water and sanitation charges from HH was asked.
Mr. Sonu Kumar yadav 27 Dec 2016 General understanding about FSand disposal was understood. Where they dispose, how much they charge, basic challenges in disposal of collected FS was understood.