SFD Promotion Initiative Nashik India Promotion Initiative Nashik India Final Report This SFD Report...
29
SFD Promotion Initiative Nashik India Final Report This SFD Report was created through field-based research by Deutsche Gesellschaft für Internationale Zusammenarbeit (GIZ) as part of the SFD Promotion Initiative. Date of production: 10/11/2015 Last update: 08/03/2016
Transcript of SFD Promotion Initiative Nashik India Promotion Initiative Nashik India Final Report This SFD Report...
SFD Promotion Initiative
Nashik
India
Final Report
This SFD Report was created through field-based research by Deutsche Gesellschaft für Internationale Zusammenarbeit (GIZ) as part of the SFD Promotion
Initiative.
Date of production: 10/11/2015
Last update: 08/03/2016
SFD Report Nashik, India, 2015
Produced by:
Roeder, L.
©Copyright All SFD Promotion Initiative materials are freely available following the open-source concept for capacity development
and non-profit use, so long as proper acknowledgement of the source is made when used. Users should always give
credit in citations to the original author, source and copyright holder.
This Executive Summary and SFD Report are available from:
www.sfd.susana.org
Last Update: 08/03/2016 I
Nashik
India Produced by: GIZ Executive Summary
1. The Diagram
2. Diagram information
Desk or field based:
This SFD followed the field-based approach.
Produced by:
This SFD is prepared by Lasse Roeder with the support from Rahul Sharma, Dipti Shinde and Jitendra Yadav (all GIZ) in cooperation with Nashik Municipal Corporation.
Status:
This is a final SFD.
Date of production:
10/11/2015
3. General city information
The city of Nashik is located in the northwest of the state of Maharashtra in the Western Ghats at the source of the Godavari River with a mean elevation of about 565 meters above mean sea level.
The city is divided in 6 administrative zones and 122 wards and is administered by the Nashik Municipal Corporation (NMC). The boundary of the NMC administered area has been chosen for this SFD.
The NMC has a total population of just under 1.5 Million distributed over 259 km
2 (population
density of about 5,800 pers./ km2, as per
Census 2011) with an annual growth rate of 3.3 %.
Nashik is a pilgrimage center with a diurnal floating population of about 100,000. The city additionally hosts the Simhashth Kumbh Mela Festival every 12 years which attracts about 5 Million pilgrims within one week.
Last Update: 08/03/2016 II
Nashik
India Produced by: GIZ Executive Summary
4. Service delivery context
The National Urban Sanitation Policy (NUSP) was launched 2008 by the Ministry of Urban Development (MoUD). The extensive framework supports the cities’ development towards generating public awareness about sanitation, achieving open defecation free (ODF) status and an integrated, city-wide sanitation system. It concedes financial support to the states and the cities for the preparation of State Sanitation Strategies (SSSs) and City Sanitation Plans (CSPs) respectively, also including decentralized onsite sanitation solutions, to first look on septage management as of importance for public health.
In 1982 the Nashik Municipal Corporation (NMC) was formed. Several departments within the NMC are involved in the management of the city sanitation and are responsible for separate services. Both centralized piped water supply and sewer network services cover nearly the complete city. About 4 % of the Nashik population relies on open defecation and an additional 17 % does not have access to latrine facilities in the household but rely on public latrines. The NMC makes the construction of septic tanks mandatory for new housing, regardless a sewer connection. The Public Works Dept. of NMC is responsible for the construction of septic tanks for public toilets. Operation and maintenance is either a responsibility of the Health Dept. of NMC or a private contractor, mandated by NMC. Collected septage is transported and emptied to sewer manholes or septage pumping stations. NMC operates seven wastewater treatment plants with a total capacity of 270 TCM daily and 15 wastewater pumping stations both with an adequate capacity. Treated wastewater is disposed of in the Godavari River running through the city.
The sanitation service delivery for private onsite sanitation systems is not operationalized. Septic tanks that are not directly connected to sewer lines are emptied on demand by NMC. NMC operates six faecal sludge trucks (four of them in working conditions).
Timeframes are in place for when service level benchmarks that are not yet met shall be met and investment plans are developed accordingly.
The majority of the slum population relies on public toilets operated by NMC or a private agency. The regulation that denies construction permits for households without a
septic tank within the premises raises the obstacle for the urban poor.
The current rate of network and treatment capacity extension is adequate to meet to close the existing gap and to cover future needs. The main focus lies on full coverage with the centralized sewer network.
5. Service outcomes
The Census of India from 2011 was the first census to include a section on household sanitation facilities. The questionnaire focused on the containment technologies present in the households. However, also connections to the central sewer system were noted.
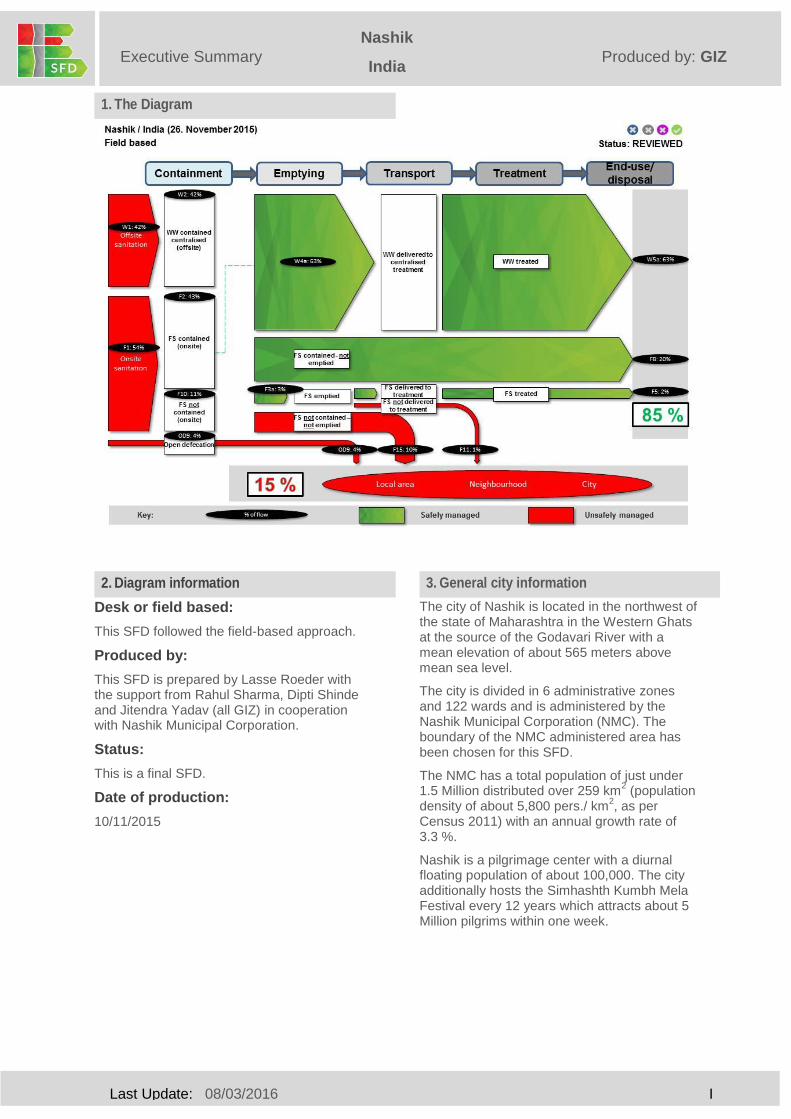
o Containment: According to the census 80 % of all households have toilet facilities within their premises, with 42 % with direct connection the sewer system, 35 % septic tanks and 3 % with pit latrines and other systems among them. Public toilets service 17% of the households and 4 % of the households rely on open defecation.
o Emptying: Most of the private septic tanks have connections to the centralized sewer network. Those without are serviced on demand by NMC for a fee of Rs. 300. Same applies to public latrines, which partly do not have sewer connections either. No private companies seem currently to be involved in the business.
o Transport: Collected septage is transported to sewer manholes or sewerage pumping stations and introduced in the sewer network. Together with the sewerage it is pumped to the five wastewater treatment plants. No hints on major leakages were found.
o Treatment: NMC operates seven wastewater treatment plants. Two treatment technologies are found in Nashik: Upflow Anaerobic Sludge Blanket (UASB) processes (with attached bio-gas power plants) and Activated Sludge Process (ASP) plants (total capacity of 270,000 m
3 daily).
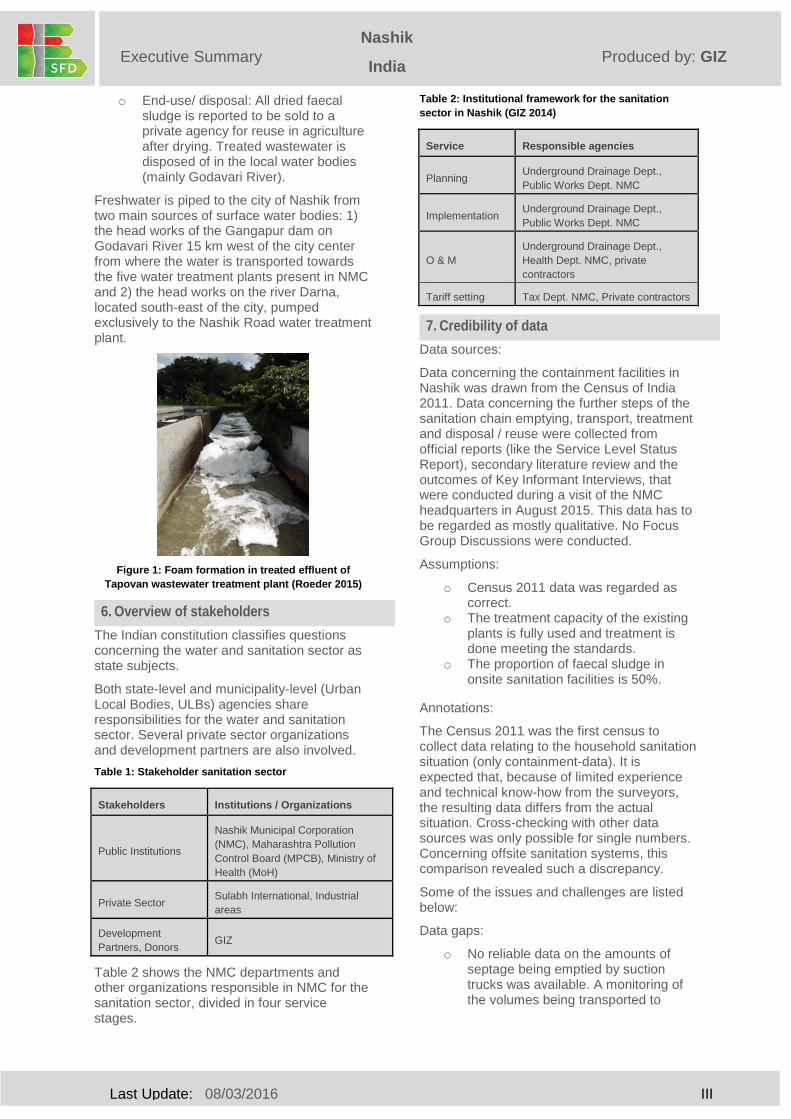
The current treatment capacity will be augmented in the near future and is then expected to be adequate for the wastewater generation until 2021. The treatment quality complies with national standards. The formation of foam in the effluent of several treatment plants is subject of current discussions (see Figure 1).
Last Update: 08/03/2016 III
Nashik
India Produced by: GIZ Executive Summary
o End-use/ disposal: All dried faecal
sludge is reported to be sold to a private agency for reuse in agriculture after drying. Treated wastewater is disposed of in the local water bodies (mainly Godavari River).
Freshwater is piped to the city of Nashik from two main sources of surface water bodies: 1) the head works of the Gangapur dam on Godavari River 15 km west of the city center from where the water is transported towards the five water treatment plants present in NMC and 2) the head works on the river Darna, located south-east of the city, pumped exclusively to the Nashik Road water treatment plant.
Figure 1: Foam formation in treated effluent of
Tapovan wastewater treatment plant (Roeder 2015)
6. Overview of stakeholders
The Indian constitution classifies questions concerning the water and sanitation sector as state subjects.
Both state-level and municipality-level (Urban Local Bodies, ULBs) agencies share responsibilities for the water and sanitation sector. Several private sector organizations and development partners are also involved.
Table 1: Stakeholder sanitation sector
Stakeholders Institutions / Organizations
Public Institutions
Nashik Municipal Corporation
(NMC), Maharashtra Pollution
Control Board (MPCB), Ministry of
Health (MoH)
Private Sector Sulabh International, Industrial
areas
Development
Partners, Donors GIZ
Table 2 shows the NMC departments and other organizations responsible in NMC for the sanitation sector, divided in four service stages.
Table 2: Institutional framework for the sanitation
sector in Nashik (GIZ 2014)
Service Responsible agencies
Planning Underground Drainage Dept.,
Public Works Dept. NMC
Implementation Underground Drainage Dept.,
Public Works Dept. NMC
O & M
Underground Drainage Dept.,
Health Dept. NMC, private
contractors
Tariff setting Tax Dept. NMC, Private contractors
7. Credibility of data
Data sources:
Data concerning the containment facilities in Nashik was drawn from the Census of India 2011. Data concerning the further steps of the sanitation chain emptying, transport, treatment and disposal / reuse were collected from official reports (like the Service Level Status Report), secondary literature review and the outcomes of Key Informant Interviews, that were conducted during a visit of the NMC headquarters in August 2015. This data has to be regarded as mostly qualitative. No Focus Group Discussions were conducted.
Assumptions:
o Census 2011 data was regarded as correct.
o The treatment capacity of the existing plants is fully used and treatment is done meeting the standards.
o The proportion of faecal sludge in onsite sanitation facilities is 50%.
Annotations:
The Census 2011 was the first census to collect data relating to the household sanitation situation (only containment-data). It is expected that, because of limited experience and technical know-how from the surveyors, the resulting data differs from the actual situation. Cross-checking with other data sources was only possible for single numbers. Concerning offsite sanitation systems, this comparison revealed such a discrepancy.
Some of the issues and challenges are listed below:
Data gaps:
o No reliable data on the amounts of septage being emptied by suction trucks was available. A monitoring of the volumes being transported to
Last Update: 08/03/2016 IV
Nashik
India Produced by: GIZ Executive Summary
manholes or sewage pumping stations would be favorable.
Hydrogeological data is required for the assessment of the risk of groundwater pollution. Conditions in Nashik do not seem to favor contamination though.
8. Process of SFD development
This SFD is based on data derived from outcomes of the Census of India from 2011. Where ever possible, Census data was cross-checked with data from secondary sources such as the City Sanitation Plan, its review and the City Development Plan.
In addition, several Key Informant Interviews were conducted in the NMC headquarters for this SFD. Also field visits to Tapovan treatment plant and sanitation facilities for the Kumbh Mela Festival 2015 were made.
The SFD calculation tool was then used to calculate the single mass transfers based on the data resulting from the literature review.
Limitations of SFD:
It should also be mentioned, that CSP data is more up-to-date (2014 for the review) than Census-data. Therefore, a comparison is difficult.
9. List of data sources
Below is the list of data sources used for the production of this SFD:
o Published reports: o Census in India 2011. HH-8 :
Households by Availability of type of Latrine Facility
o Nashik Municipal Corporation 2011b. City Sanitation Plan for Nashik
o Nashik Municipal Corporation 2013. Revised City Development Plan for Nashik City
o Ministry of Urban Development 2012. Service Levels in Urban Water and Sanitation Sector Status Report (2010-2011)
o Unpublished reports:
o GIZ 2014. City Sanitation Plan Update – Status Report Nashik Municipal
Nashik, India, 2015
Produced by:
Deutsche Gesellschaft für Internationale Zusammenarbeit (GIZ) GmbH, Roeder, L.
© Copyright All SFD Promotion Initiative materials are freely available following the open-source concept for capacity development and non-profit use, so long as proper acknowledgement of the source is made when used. Users should always give credit in citations to the original author, source and copyright holder.
This Executive Summary and the SFD Report are available from:
www.sfd.susana.org
Last Update: 08/03/2016 V
Nashik
India Produced by: GIZ SFD Report
Table of Content
1 City context .................................................................................................................... 1
2 Service delivery context analysis .................................................................................... 2
2.1 Policy, legislation and regulation ............................................................................. 2
2.1.1 Policy ............................................................................................................... 2
2.1.2 Institutional roles .............................................................................................. 2
2.1.3 Service provision .............................................................................................. 3
2.1.4 Service standards ............................................................................................ 5
2.2 Planning .................................................................................................................. 6
2.2.1 Service targets ................................................................................................. 6
2.2.2 Investments ...................................................................................................... 7
2.3 Reducing inequity .................................................................................................... 8
2.3.1 Current choice of services for the urban poor ................................................... 8
2.3.2 Plans and measures to reduce inequity ............................................................ 9
2.4 Outputs ................................................................................................................... 9
2.4.1 Capacity to meet service needs, demands and targets .................................... 9
2.4.2 Monitoring and reporting access to services ..................................................... 9
2.5 Expansion ..............................................................................................................10
2.5.1 Stimulating demand for services .....................................................................10
2.5.2 Strengthening service provider roles ...............................................................10
3 Service Outcomes .........................................................................................................10
3.1 Overview ................................................................................................................10
3.2 SFD Matrix .............................................................................................................12
3.2.1 Containment ....................................................................................................13
3.2.2 Emptying .........................................................................................................13
3.2.3 Transport .........................................................................................................13
3.2.4 Treatment ........................................................................................................13
3.2.5 End-use/ disposal ............................................................................................14
3.2.6 Risk of groundwater containment ....................................................................14
4 Stakeholder Engagement ..............................................................................................14
4.1 Key Informant Interviews ........................................................................................14
4.2 Focus Group Discussions ......................................................................................14
Last Update: 08/03/2016 VI
Nashik
India Produced by: GIZ SFD Report
4.3 Observation of service providers ............................................................................14
5 Acknowledgements .......................................................................................................15
6 References ....................................................................................................................15
7 Appendix .......................................................................................................................16
7.1 Appendix 1: Stakeholder identification ....................................................................16
7.2 Appendix 2: Tracking of Engagement .....................................................................16
7.3 Appendix 3: SFD matrix .........................................................................................17
Last Update: 08/03/2016 VII
Nashik
India Produced by: GIZ SFD Report
List of tables
Tab. 1: Institutional framework for the sanitation sector ......................................................... 3
Tab. 2: Water and Sanitation services in NMC ...................................................................... 3
Tab. 3: Compliance with SLBs according to Service Level Status Report 2010-2011 and
CSP-review ........................................................................................................................... 5
Tab. 4: Timeframe to achieve service delivery targets as stated in SLBs .............................. 6
Tab. 5: Identified investment needs for sewerage projects until 2041 in Million Rs. as per City
Investment Plan..................................................................................................................... 8
Tab. 6: Distribution of domestic toilet facilities ......................................................................11
Tab. 7: Property-wise connections to sewer network ............................................................11
Last Update: 08/03/2016 VIII
Nashik
India Produced by: GIZ SFD Report
List of figures
Fig. 1: Administrative map of Nashik city and its ward boundaries ......................................... 1
Fig. 2: Upflow Anaerobic Sludge Blanket (UASB) facility at Tapovan WWTP ........................ 4
Fig. 3: Toilet facilities in Nashik for the pilgrims in preparation of the Kumbh Mela festival .... 7
Last Update: 08/03/2016 IX
Nashik
India Produced by: GIZ SFD Report
Abbreviations
ASP Activates Sludge Process
BOD Biochemical Oxygen Demand
CPHEEO Central Public Health & Environmental Engineering Organisation
CSP City Sanitation Plan
CSTF City Sanitation Task Force
EPA Environment (Protection) Act, 1986
KPIs Key Performance Indicators
IS Indian Standard
JnNURM Jawaharlal Nehru National Urban Renewal Mission
lpcd Litres per capita per day
masl Metres above mean sea level
mbgl Meters below ground level
MoUD Ministry of Urban Development
NMC Nashik Municipal Corporation
Rs. Indian Rupees (Exchange rate August 2015: 1 USD ≙ 65 Rs.))
SLBs Service Level Benchmarks
SPS Sewage Pumping Stations
STP Sewage Treatment Plant
SS Suspended Solids
TCM Thousand cubic meters
UASB Upflow Anaerobic Sludge Blanket
ULBs Urban Local Bodies
WSSB Water Supply and Sanitation Board
WTP Water Treatment Plant
WWTP Wastewater Treatment Plant
Last Update: 08/03/2016 1
Nashik
India Produced by: GIZ SFD Report
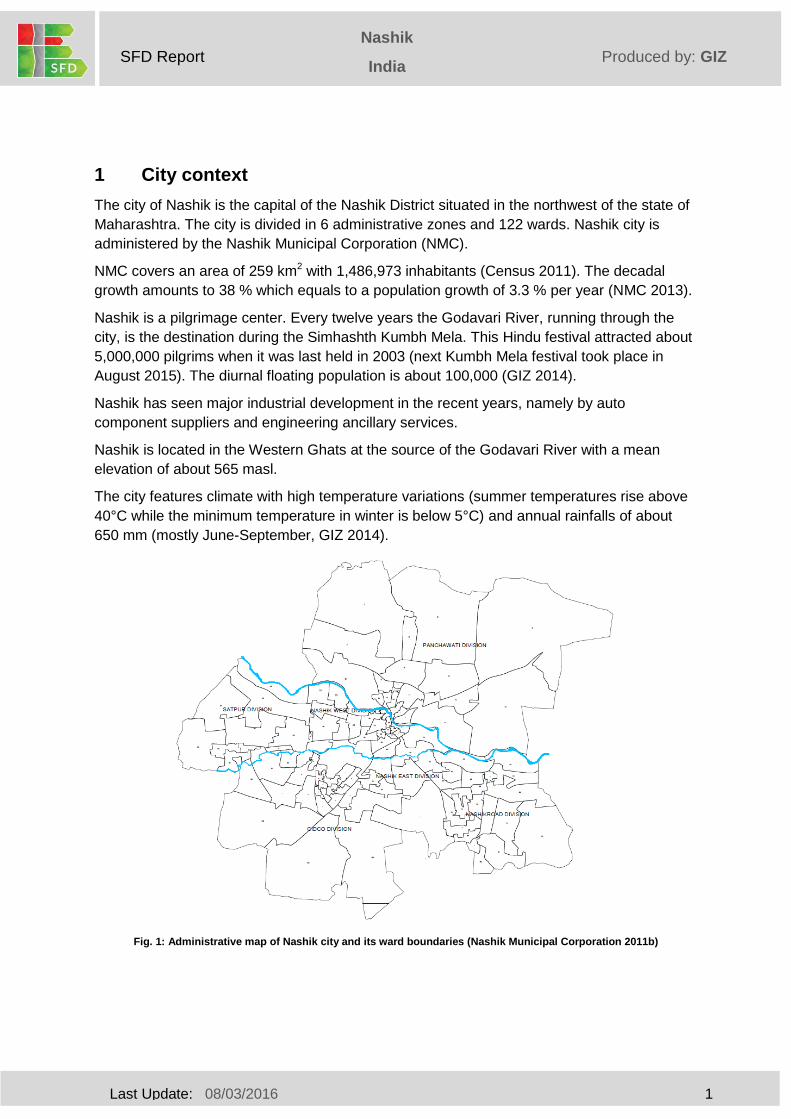
1 City context
The city of Nashik is the capital of the Nashik District situated in the northwest of the state of
Maharashtra. The city is divided in 6 administrative zones and 122 wards. Nashik city is
administered by the Nashik Municipal Corporation (NMC).
NMC covers an area of 259 km2 with 1,486,973 inhabitants (Census 2011). The decadal
growth amounts to 38 % which equals to a population growth of 3.3 % per year (NMC 2013).
Nashik is a pilgrimage center. Every twelve years the Godavari River, running through the
city, is the destination during the Simhashth Kumbh Mela. This Hindu festival attracted about
5,000,000 pilgrims when it was last held in 2003 (next Kumbh Mela festival took place in
August 2015). The diurnal floating population is about 100,000 (GIZ 2014).
Nashik has seen major industrial development in the recent years, namely by auto
component suppliers and engineering ancillary services.
Nashik is located in the Western Ghats at the source of the Godavari River with a mean
elevation of about 565 masl.
The city features climate with high temperature variations (summer temperatures rise above
40°C while the minimum temperature in winter is below 5°C) and annual rainfalls of about
650 mm (mostly June-September, GIZ 2014).
Fig. 1: Administrative map of Nashik city and its ward boundaries (Nashik Municipal Corporation 2011b)
Last Update: 08/03/2016 2
Nashik
India Produced by: GIZ SFD Report
2 Service delivery context analysis
2.1 Policy, legislation and regulation
2.1.1 Policy
The recognition of the right to sanitation as part of the fundamental right to life under Article 21 of the Indian Constitution gives a strong mandate for sanitation in India. India has committed itself to meeting the Millennium Development Goal for sanitation.
The Water (Prevention and Control of Pollution) Act 1974 and the Environment (Protection) Act (EPA) 1986 together empower the government to take all such measures as it deems necessary or expedient for the purpose of protecting and improving the quality of the environment and preventing, controlling and abating environmental pollution (GIZ 2015). Most of the other states of India (including Maharashtra) have, however, not used the provisions of the EPA to introduce specific rules for managing septage (GIZ 2015).
Under the Water Act and the EPA the Central Government supports programmes and schemes for wastewater management in order to limit environmental pollution.
The Jawaharlal Nehru National Urban Renewal Mission (JnNURM) in 2005 focused (in terms of the sanitation sector) on investments in large scale centralised sewer systems. Septage management and onsite sanitation in general were not covered.
Septage management in India is traditionally mainly regarded as a ‘private provision’ and not as concern for public health and for city-sanitation with relevance for the ULBs (GIZ 2015). The consequence is a lack of holistic planning along the sanitation chain.
It was the National Urban Sanitation Policy (NUSP) 2008 that encourages the states and the cities to prepare State Sanitation Strategies (SSSs) and City Sanitation Plans (CSPs) respectively, also including decentralized onsite sanitation solutions, to first look on septage management as of importance for public health.
The Swachh Bharat Mission (SBM), launched in 2014, supports the goals expressed in the
NUSP financially with a focus on the needs of the urban poor. The Atal Mission for
Rejuvenation and Urban Transformation (AMRUT), launched in 2015, considers Septage
management as one of its mission components & concedes financial support for the same.
Also other missions such as Basic Services to Urban Poor (BSUP) as part of JnNURM and
Rajiv Awas Yojana (RAY) address the needs of the urban poor.
2.1.2 Institutional roles
The Seventh Schedule (Article 246) of the Indian constitution classifies ‘Public health and sanitation […]’ and ‘Water, that is to say, water supplies, irrigation and canals, drainage and embankments […]’ as state subjects (List II, Entry 6 and List II, entry 17, respectively).
The Bombay Provincial Municipal Corporations Act (BPMC Act) 1949 provided the legal
framework for the establishment of municipal corporations in the state of Maharashtra. In
1982 the Nashik Municipal Corporation (NMC) was formed. Tab. 1 shows the responsibilities
for sanitation service delivery within NMC.
Last Update: 08/03/2016 3
Nashik
India Produced by: GIZ SFD Report
Tab. 1: Institutional framework for the sanitation sector (GIZ 2014)
Urban Service
Planning Execution O % M Tariff fixation and collection
Water Supply Water Supply Department, NMC
Water Supply Department, NMC
Water Supply Department, NMC
Tax Department, NMC
Sewerage Underground Drainage Department, NMC
Underground Drainage Department, NMC
Underground Drainage Department, NMC
Tax Department, NMC
Public and Community Toilets
Public Works Department, NMC
Public Works Department, NMC
Health Department, NMC / Private contractors
NMC / Private contractors
As stated in Tab. 1 the Public Works Dept. of NMC is responsible for the construction of septic tanks for public toilets. Operation and maintenance is either a responsibility of the Health Dept. of NMC or a private contractor, mandated by NMC.
The sanitation service delivery for private onsite sanitation systems is not operationalized.
Septic tanks that are not directly connected to sewer lines are emptied on demand by NMC.
NMC operates six faecal sludge trucks (four of them in working conditions, Mali 2015).
2.1.3 Service provision
NMC is the sole provider of offsite sanitation services from emptying to treatment. Tab. 2
gives an overview over the sanitation and water supply services offered by NMC. Since 2011
no sewerage tax applies for the connected households (GIZ 2014).
Tab. 2: Water and Sanitation services in NMC (GIZ 2014)
Description unit value
Se
we
rag
e
Length of sewer network km 1,826
Properties connected to sewer line (not equal to number of connections)
- 309,905
Treatment capacity TCM daily
270
Wa
ter
Su
pp
ly Length of water supply network km 1,898
No. of total water connections - 175,811
No. of domestic water connections - 163,957
Last Update: 08/03/2016 4
Nashik
India Produced by: GIZ SFD Report
Water is piped to the city of Nashik from two main sources of surface water bodies: 1) About
315 Thousand Cubic Meters (TCM) daily is pumped from the head works of the Gangapur
dam on river Godavari 15 km west of the city center towards the five Water Treatment Plants
(WTP) present in NMC and 2) about 25 TCM daily derive from the head works on the river
Darna, located south-east of the city, pumped exclusively to the Nashik Road WTP (GIZ
2014).
NMC makes the construction of septic tanks mandatory and does not grant building
permissions without such systems. NMC operates 6 faecal sludge trucks (4 of which are
operational with volumes of 3,000, 7,000 and twice 8,000 liters) for the emptying of septic
tanks. No up-to-date data is available regarding the number of septic tanks and of septic
tanks connected to sewerage system. There is also no monitoring of possible involvement of
private agencies engaged in the septage management business.
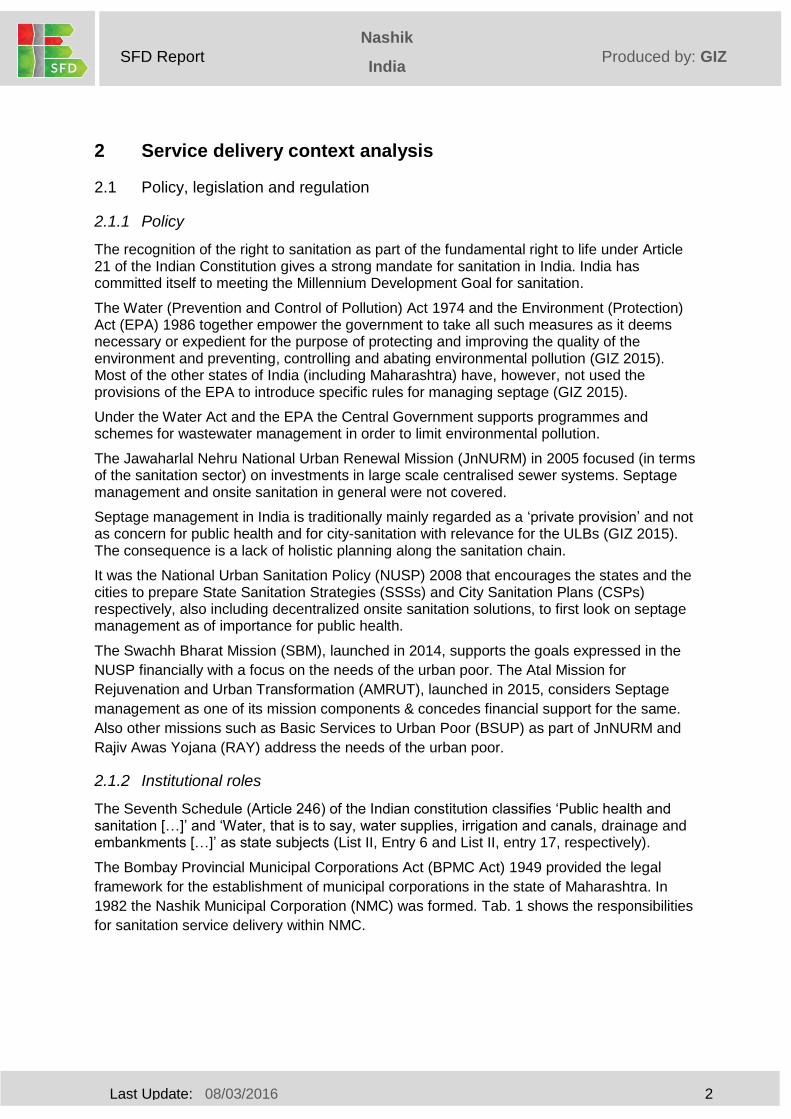
NMC operates seven wastewater treatment plants with a total capacity of 270 TCM daily and
15 wastewater pumping stations with an adequate capacity.
Fig. 2: Upflow Anaerobic Sludge Blanket (UASB) facility at Tapovan WWTP (August 2015, L.Roeder)
Last Update: 08/03/2016 5
Nashik
India Produced by: GIZ SFD Report
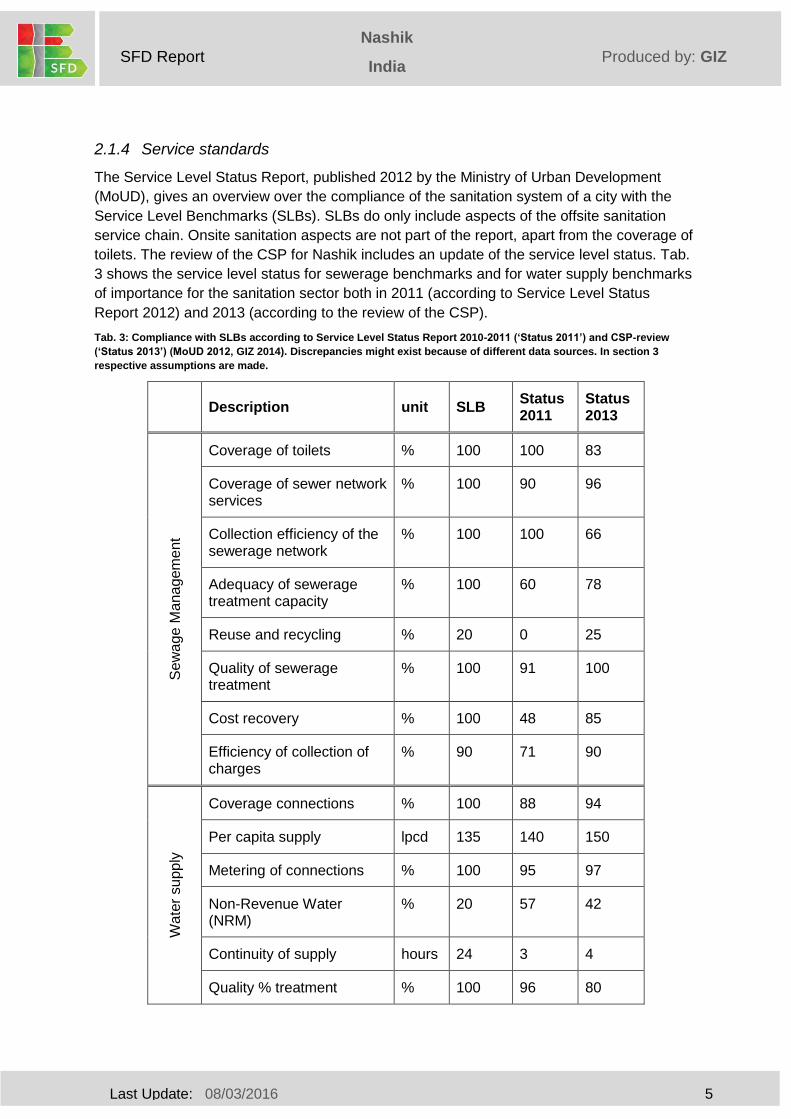
2.1.4 Service standards
The Service Level Status Report, published 2012 by the Ministry of Urban Development
(MoUD), gives an overview over the compliance of the sanitation system of a city with the
Service Level Benchmarks (SLBs). SLBs do only include aspects of the offsite sanitation
service chain. Onsite sanitation aspects are not part of the report, apart from the coverage of
toilets. The review of the CSP for Nashik includes an update of the service level status. Tab.
3 shows the service level status for sewerage benchmarks and for water supply benchmarks
of importance for the sanitation sector both in 2011 (according to Service Level Status
Report 2012) and 2013 (according to the review of the CSP).
Tab. 3: Compliance with SLBs according to Service Level Status Report 2010-2011 (‘Status 2011’) and CSP-review
(‘Status 2013’) (MoUD 2012, GIZ 2014). Discrepancies might exist because of different data sources. In section 3
respective assumptions are made.
Description unit SLB
Status 2011
Status 2013
Se
wa
ge
Ma
na
gem
ent
Coverage of toilets % 100 100 83
Coverage of sewer network services
% 100 90 96
Collection efficiency of the sewerage network
% 100 100 66
Adequacy of sewerage treatment capacity
% 100 60 78
Reuse and recycling % 20 0 25
Quality of sewerage treatment
% 100 91 100
Cost recovery % 100 48 85
Efficiency of collection of charges
% 90 71 90
Wa
ter
su
pp
ly
Coverage connections % 100 88 94
Per capita supply lpcd 135 140 150
Metering of connections % 100 95 97
Non-Revenue Water (NRM)
% 20 57 42
Continuity of supply hours 24 3 4
Quality % treatment % 100 96 80
Last Update: 08/03/2016 6
Nashik
India Produced by: GIZ SFD Report
Additionally, the Census 2011 included for the first time a questionnaire on the household
sanitation situation. Only the type of latrine facility (containment) present in the households
was recorded.
There is no adequate regulation and accountability of onsite sanitation system present on
NMC. Monitoring mechanisms are in place but irregularly applied (Nashik Municipal
Corporation 2011b).
2.2 Planning
2.2.1 Service targets
The vision concerning city-wide sanitation in the CSP for Nashik CSP is stated as to:
“Capture and Treat all black and grey water to prescribed standards and incorporate
recycling and re-use to conserve fresh water resources” (Nashik Municipal Corporation
2011b).
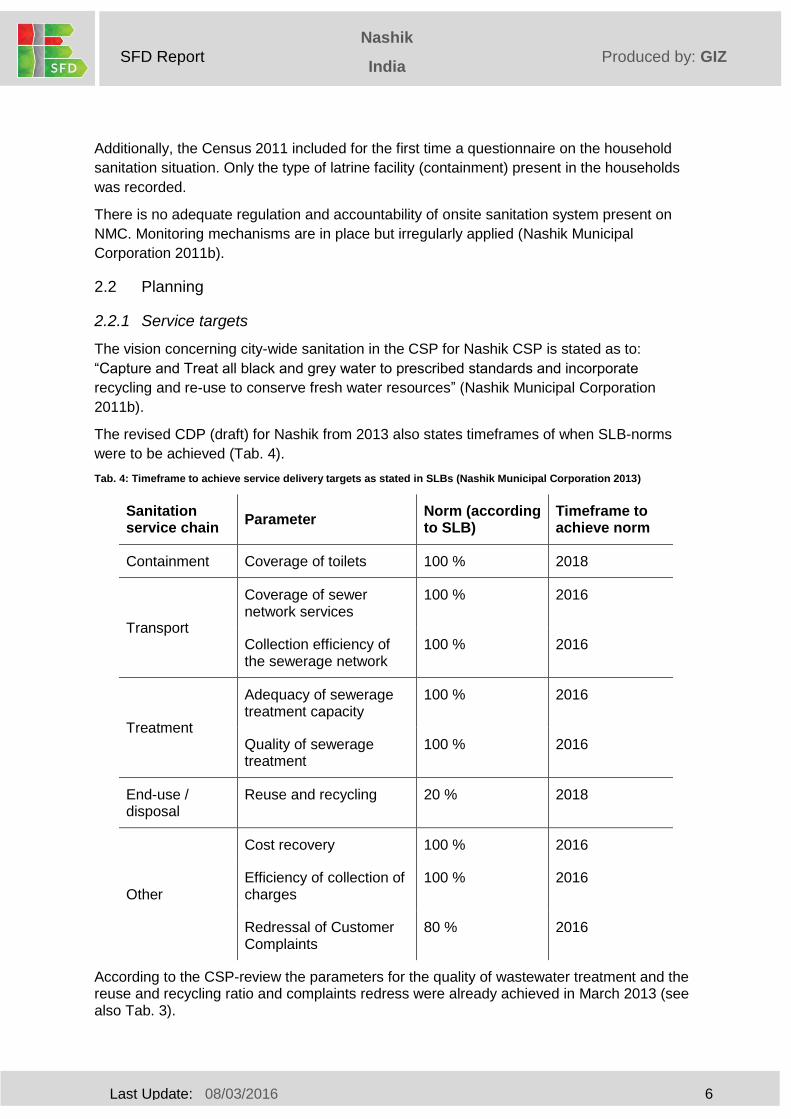
The revised CDP (draft) for Nashik from 2013 also states timeframes of when SLB-norms
were to be achieved (Tab. 4).
Tab. 4: Timeframe to achieve service delivery targets as stated in SLBs (Nashik Municipal Corporation 2013)
Sanitation service chain
Parameter Norm (according to SLB)
Timeframe to achieve norm
Containment Coverage of toilets 100 % 2018
Transport
Coverage of sewer network services
100 % 2016
Collection efficiency of the sewerage network
100 % 2016
Treatment
Adequacy of sewerage treatment capacity
100 % 2016
Quality of sewerage treatment
100 % 2016
End-use / disposal
Reuse and recycling 20 % 2018
Other
Cost recovery 100 % 2016
Efficiency of collection of charges
100 % 2016
Redressal of Customer Complaints
80 % 2016
According to the CSP-review the parameters for the quality of wastewater treatment and the reuse and recycling ratio and complaints redress were already achieved in March 2013 (see also Tab. 3).
Last Update: 08/03/2016 7
Nashik
India Produced by: GIZ SFD Report
The SLBs issued by MoUD focus on offsite sanitation by promoting the extension of the
sewer network. The management of onsite systems is not operationalized and there are no
service targets concerning the emptying process of onsite sanitation systems.
2.2.2 Investments
The works under JnNURM (see section 2.1.1) were divided into two investment packages.
During JnNURM-I a sum of Rs. 3.2 Billion was already invested in the ‘Under Ground
Sewerage’-sector. With the project additional 1,000 km of sewer network have been built
raising the total sewer coverage by 30 % (Nashik Municipal Corporation 2013). Also the
sewage pumping and treatment capacities have been increased to meet the current
demands. Additionally, projects under ‘Basic Services for Urban Poor’ (BSUP) have been
implemented with a volume of Rs. 3.3 Billion which also partly cover sanitation issues.
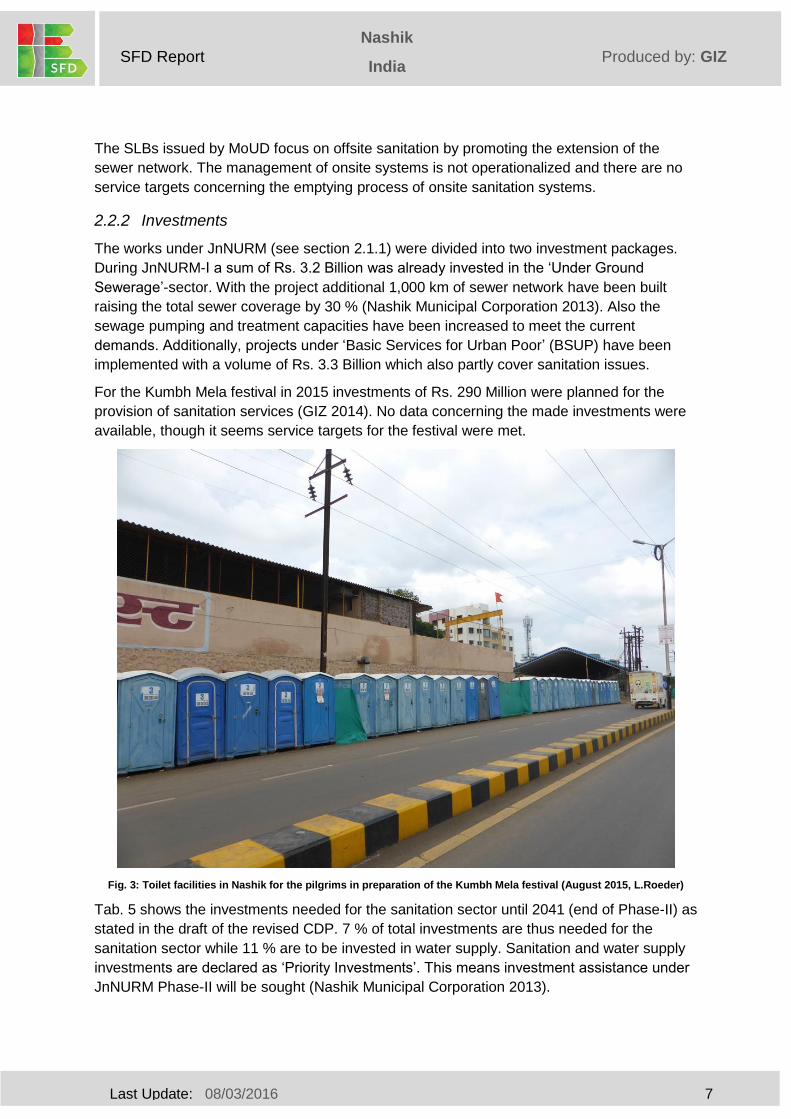
For the Kumbh Mela festival in 2015 investments of Rs. 290 Million were planned for the
provision of sanitation services (GIZ 2014). No data concerning the made investments were
available, though it seems service targets for the festival were met.
Fig. 3: Toilet facilities in Nashik for the pilgrims in preparation of the Kumbh Mela festival (August 2015, L.Roeder)
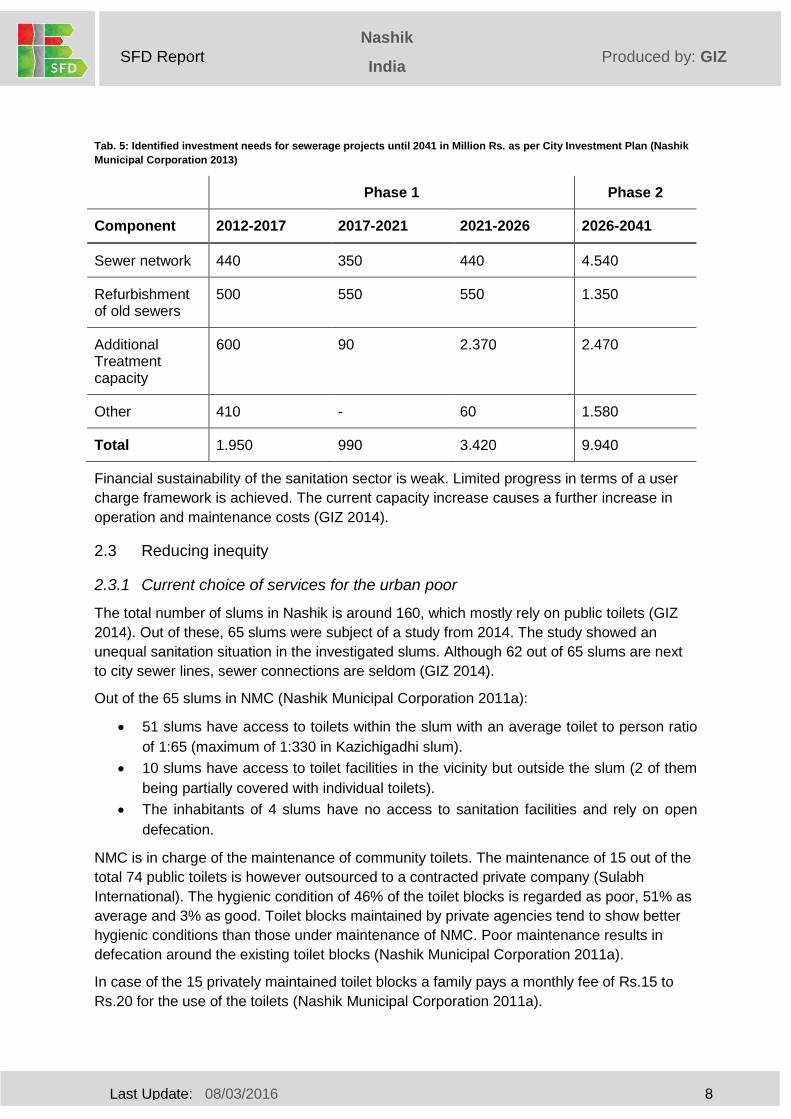
Tab. 5 shows the investments needed for the sanitation sector until 2041 (end of Phase-II) as
stated in the draft of the revised CDP. 7 % of total investments are thus needed for the
sanitation sector while 11 % are to be invested in water supply. Sanitation and water supply
investments are declared as ‘Priority Investments’. This means investment assistance under
JnNURM Phase-II will be sought (Nashik Municipal Corporation 2013).
Last Update: 08/03/2016 8
Nashik
India Produced by: GIZ SFD Report
Tab. 5: Identified investment needs for sewerage projects until 2041 in Million Rs. as per City Investment Plan (Nashik
Municipal Corporation 2013)
Phase 1 Phase 2
Component 2012-2017 2017-2021 2021-2026 2026-2041
Sewer network 440 350 440 4.540
Refurbishment of old sewers
500 550 550 1.350
Additional Treatment capacity
600 90 2.370 2.470
Other 410 - 60 1.580
Total 1.950 990 3.420 9.940
Financial sustainability of the sanitation sector is weak. Limited progress in terms of a user
charge framework is achieved. The current capacity increase causes a further increase in
operation and maintenance costs (GIZ 2014).
2.3 Reducing inequity
2.3.1 Current choice of services for the urban poor
The total number of slums in Nashik is around 160, which mostly rely on public toilets (GIZ
2014). Out of these, 65 slums were subject of a study from 2014. The study showed an
unequal sanitation situation in the investigated slums. Although 62 out of 65 slums are next
to city sewer lines, sewer connections are seldom (GIZ 2014).
Out of the 65 slums in NMC (Nashik Municipal Corporation 2011a):
51 slums have access to toilets within the slum with an average toilet to person ratio
of 1:65 (maximum of 1:330 in Kazichigadhi slum).
10 slums have access to toilet facilities in the vicinity but outside the slum (2 of them
being partially covered with individual toilets).
The inhabitants of 4 slums have no access to sanitation facilities and rely on open
defecation.
NMC is in charge of the maintenance of community toilets. The maintenance of 15 out of the
total 74 public toilets is however outsourced to a contracted private company (Sulabh
International). The hygienic condition of 46% of the toilet blocks is regarded as poor, 51% as
average and 3% as good. Toilet blocks maintained by private agencies tend to show better
hygienic conditions than those under maintenance of NMC. Poor maintenance results in
defecation around the existing toilet blocks (Nashik Municipal Corporation 2011a).
In case of the 15 privately maintained toilet blocks a family pays a monthly fee of Rs.15 to
Rs.20 for the use of the toilets (Nashik Municipal Corporation 2011a).
Last Update: 08/03/2016 9
Nashik
India Produced by: GIZ SFD Report
2.3.2 Plans and measures to reduce inequity
The majority of the slum population of Nashik relies on community toilet facilities either
operated by NMC or Sulabh International (private agency). Use of the toilets operated by
NMC is free of charge, while it costs a small amount for those facilities operated by Sulabh
International. There is, however, an informal agreement that the access is not denied to
habitants not able to pay. Therefore, payment is mostly done on a voluntary basis.
There are currently no measures by NMC in place that support the access of the urban poor
to individual household toilets such as subsidizing the construction of individual household
facilities or the sewerage connection charges that apply. The regulation that denies
construction permits for households without a septic tank within the premises further raises
the obstacle for the urban poor. For practical reasons this regulation can only be applied to
planned areas and areas with a limited housing density.
A DPR was prepared which aims at redeveloping the slums and providing individual housing
with individual toilet facilities (GIZ 2014).
2.4 Outputs
2.4.1 Capacity to meet service needs, demands and targets
A comparison of the SLB compliance during the service level status report 2010-2011, during
the CSP 2011 and during the review of the CSP 2014 (see Tab. 3) does not give reliable
overview over the growth of the sanitation aspects reported in the SLBs.
The number of connected properties was raised from 268,000 to about 310,000 in between
2009 and 2013 (corresponds to a growth of 4 % per year, Nashik Municipal Corporation
2013). The growth in numbers of sewer connections seems adequate to follow the growth
rate, not regarded the current gap in connections.
A gap assessment from 2013 shows the need for about 20 km of new sewer network per
year in until 2021 in order to obtain and maintain full coverage. The current rate of network
extension seems to be adequate to close the existing gap and to cover future needs (Nashik
Municipal Corporation 2013).
The current treatment capacity of 270 TCM daily is adequate for the current wastewater
generation and for the wastewater generation expected by the year 2021. Only minor
improvements will be needed until 2026 (Nashik Municipal Corporation 2013).
NMC area is divided into six sanitation divisions. One suction truck is planned to service
each of the sections. However, since 2011 only four of the six trucks are operating.
According to NMC officials the capacity of the four trucks in operation is still adequate.
O&M capacities do not grow at the same pace as the physical capacities. A user charge
framework is needed in order to provide adequate O&M for the existing and to-be-built
infrastructure (GIZ 2014).
2.4.2 Monitoring and reporting access to services
The conditions of the user interfaces (toilets) are regarded as private responsibility. No
central monitoring is conveyed. The construction of new septic tanks is surveyed by the town
Last Update: 08/03/2016 10
Nashik
India Produced by: GIZ SFD Report
planning department at NMC. There is no monitoring of the existing septic tanks in place.
However, the status of septic tanks that are not connected to the sewer system is checked
during the emptying process by NMC-trucks. No monitoring of the amount of septage being
transported by the NMC trucks is in place.
NMC is obliged to send a monthly report regarding the SLB performance to the MoUD. The
reports seem not to be sent every month but still rather regularly. The reliability of the SLB
assessment is a challenge. The revision of the City Development Plan (draft) regards the
reliability of such SLB data as partly insufficient. It means a timeframe for improving reliability
which targets at achievement for all SLB parameters by 2018 (GIZ 2014).
2.5 Expansion
2.5.1 Stimulating demand for services
One of the main goals of the National Urban Sanitation Policy (NUSP) is awareness
generation and behavior change for the sanitation sector.
The CSP states actions for five goals to be taken in order to improve the overall access to
toilets. One of the main goals is to ‘Drive behavior change through awareness campaigns
and branding initiatives’. Four actions are carved out in order to achieve this goal (Nashik
Municipal Corporation 2011b):
1. Initiate a Slum level sanitation campaign to eliminate open defecation
2. Initiate a Trader-support campaign in commercial areas to eliminate open urination
3. Initiate a school campaign to impart positive behaviors on civic duties, sanitation and
toilet use
4. Standardize branding (logos, painting, signage) for Public Toilets and Community
Toilets
The CSP review from 2014 however identifies limited progress with the proposed actions.
2.5.2 Strengthening service provider roles
NMC is the main stakeholder on public level. The only private public toilet service provider
active in Nashik is Sulabh International which is operating and maintaining several public
toilets on a BOT-model.
Until 2014 a trial process was undertaken in order to evaluate the possibility for private
agencies to become active in the emptying business for septic tanks. The trial process
expired in 2014 and no decision on the basis of the findings has so far been made (Hire
2015).
Official programs and the CDP predominantly aim at expanding the centralized sewer
network (Vanjari 2015).
3 Service Outcomes
3.1 Overview
Last Update: 08/03/2016 11
Nashik
India Produced by: GIZ SFD Report
This report is conducted as a field-based-assessment of the sanitation situation in Nashik,
Maharashtra, India. This SFD resorts to the City Sanitation Plan for Nashik 2011, its Review
from 2014, the service level status report 2010-2011, and the Indian Census 2011 data. The
Census 2011 data is regarded as correct, unless marked otherwise. Where possible, the
Census data is replaced with reliable and more up-to-date data from other sources.
The objective of the present SFD was to strictly follow the methodology of the BMGF-
financed SFD promotion project and thereby provide the possibility to compare outcomes
and conclude on improvements. An overview over the sanitary situation is provided in the
following.
In the National Sanitation rating, 2010-11 Nashik was ranked 42nd out of 423 Indian and
cities (equalling to rank 4 on state level) with a score of 45.91, which indicates a ‘Need for
considerable Improvement’.
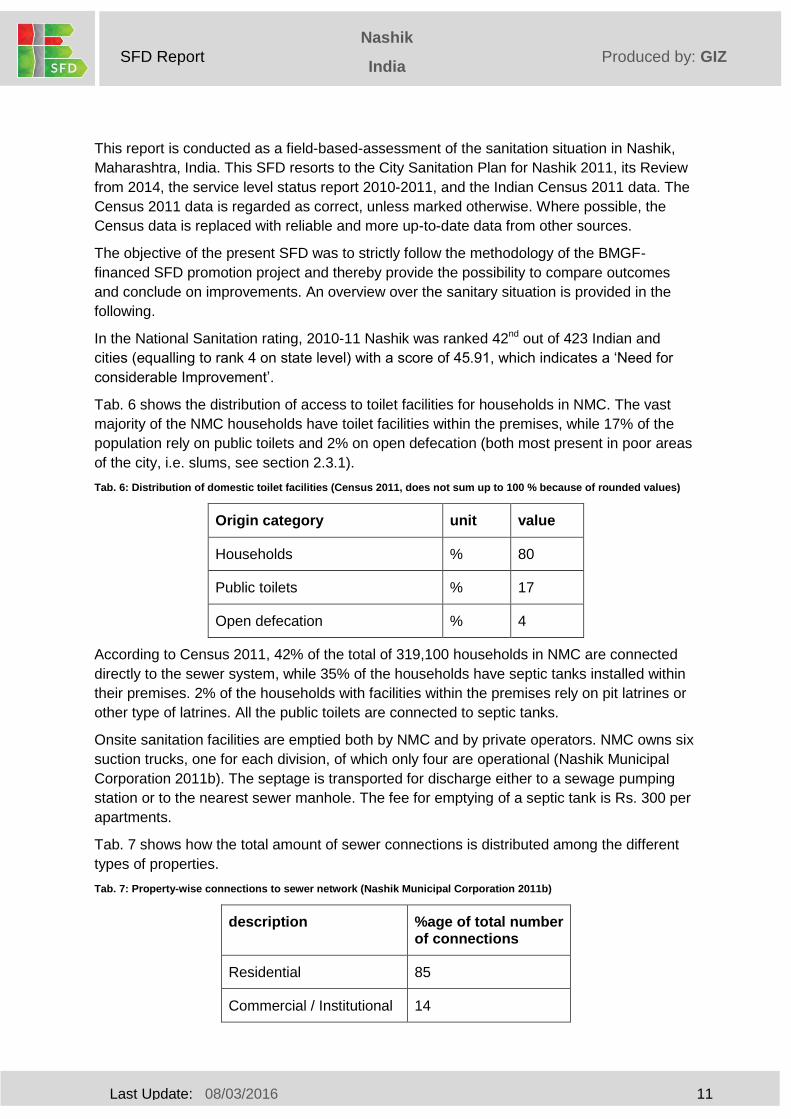
Tab. 6 shows the distribution of access to toilet facilities for households in NMC. The vast
majority of the NMC households have toilet facilities within the premises, while 17% of the
population rely on public toilets and 2% on open defecation (both most present in poor areas
of the city, i.e. slums, see section 2.3.1).
Tab. 6: Distribution of domestic toilet facilities (Census 2011, does not sum up to 100 % because of rounded values)
Origin category unit value
Households % 80
Public toilets % 17
Open defecation % 4
According to Census 2011, 42% of the total of 319,100 households in NMC are connected
directly to the sewer system, while 35% of the households have septic tanks installed within
their premises. 2% of the households with facilities within the premises rely on pit latrines or
other type of latrines. All the public toilets are connected to septic tanks.
Onsite sanitation facilities are emptied both by NMC and by private operators. NMC owns six
suction trucks, one for each division, of which only four are operational (Nashik Municipal
Corporation 2011b). The septage is transported for discharge either to a sewage pumping
station or to the nearest sewer manhole. The fee for emptying of a septic tank is Rs. 300 per
apartments.
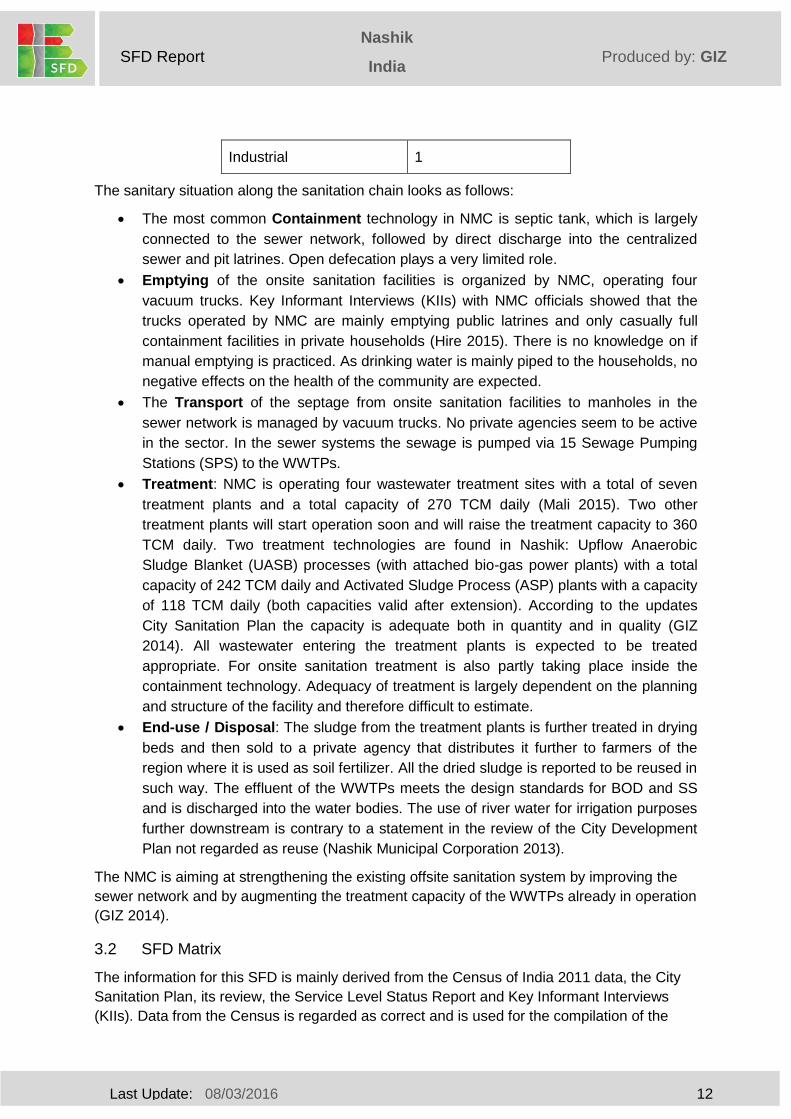
Tab. 7 shows how the total amount of sewer connections is distributed among the different
types of properties.
Tab. 7: Property-wise connections to sewer network (Nashik Municipal Corporation 2011b)
description %age of total number of connections
Residential 85
Commercial / Institutional 14
Last Update: 08/03/2016 12
Nashik
India Produced by: GIZ SFD Report
Industrial 1
The sanitary situation along the sanitation chain looks as follows:
The most common Containment technology in NMC is septic tank, which is largely
connected to the sewer network, followed by direct discharge into the centralized
sewer and pit latrines. Open defecation plays a very limited role.
Emptying of the onsite sanitation facilities is organized by NMC, operating four
vacuum trucks. Key Informant Interviews (KIIs) with NMC officials showed that the
trucks operated by NMC are mainly emptying public latrines and only casually full
containment facilities in private households (Hire 2015). There is no knowledge on if
manual emptying is practiced. As drinking water is mainly piped to the households, no
negative effects on the health of the community are expected.
The Transport of the septage from onsite sanitation facilities to manholes in the
sewer network is managed by vacuum trucks. No private agencies seem to be active
in the sector. In the sewer systems the sewage is pumped via 15 Sewage Pumping
Stations (SPS) to the WWTPs.
Treatment: NMC is operating four wastewater treatment sites with a total of seven
treatment plants and a total capacity of 270 TCM daily (Mali 2015). Two other
treatment plants will start operation soon and will raise the treatment capacity to 360
TCM daily. Two treatment technologies are found in Nashik: Upflow Anaerobic
Sludge Blanket (UASB) processes (with attached bio-gas power plants) with a total
capacity of 242 TCM daily and Activated Sludge Process (ASP) plants with a capacity
of 118 TCM daily (both capacities valid after extension). According to the updates
City Sanitation Plan the capacity is adequate both in quantity and in quality (GIZ
2014). All wastewater entering the treatment plants is expected to be treated
appropriate. For onsite sanitation treatment is also partly taking place inside the
containment technology. Adequacy of treatment is largely dependent on the planning
and structure of the facility and therefore difficult to estimate.
End-use / Disposal: The sludge from the treatment plants is further treated in drying
beds and then sold to a private agency that distributes it further to farmers of the
region where it is used as soil fertilizer. All the dried sludge is reported to be reused in
such way. The effluent of the WWTPs meets the design standards for BOD and SS
and is discharged into the water bodies. The use of river water for irrigation purposes
further downstream is contrary to a statement in the review of the City Development
Plan not regarded as reuse (Nashik Municipal Corporation 2013).
The NMC is aiming at strengthening the existing offsite sanitation system by improving the
sewer network and by augmenting the treatment capacity of the WWTPs already in operation
(GIZ 2014).
3.2 SFD Matrix
The information for this SFD is mainly derived from the Census of India 2011 data, the City
Sanitation Plan, its review, the Service Level Status Report and Key Informant Interviews
(KIIs). Data from the Census is regarded as correct and is used for the compilation of the
Last Update: 08/03/2016 13
Nashik
India Produced by: GIZ SFD Report
SFD. In the following, assumptions made in order to produce the SFD are explained along
the sanitation chain.
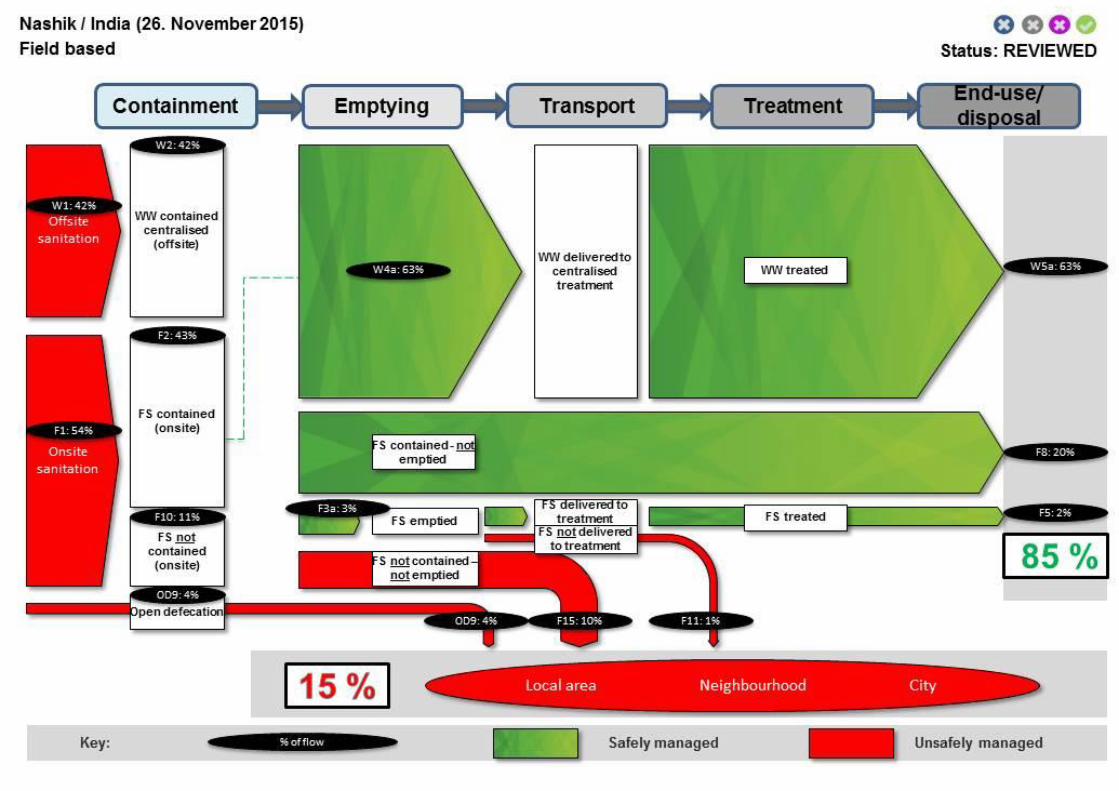
3.2.1 Containment
According to the Census of India 2011 42 % of all households in NMC have toilet facilities
directly connected to the sewer network. It is assumed that all interfaces (toilets) and all
sewer connections are fully functional.
In order to obtain a new building permission it is mandatory to include a septic tank in the
premise. Further 35 % of the households have septic tanks within their premises and 17 % of
the households rely on public latrines, which are all said to be septic tanks (total of 52 %).
Pit latrines (VIP latrines in the census) represent the toilet facilities for 1 % of the households
(Census 2011).
Open pits account to less than 1% of the population (Census 2011).
So-called night soil latrines and service latrines are translated to fully lined tanks and
represent the toilet system for 1% of the population (Census 2011).
The Census states an open defecation rate of 4 %.
3.2.2 Emptying
The assumption that 80% of the total of 52% of the households relying on septic tanks are
connected to the sewer (GIZ 2014) results in a total of 42 % of households connected to the
sewer network via a septic tank. This correlates with the number of total connections
mentioned in the CSP Review. As no information regarding the effluent - faecal sludge
composition of onsite facilities is available, it is assumed that 50 % of the volume is faecal
sludge and 50 % is effluent. Together with the households with direct connections to the
sewer this sums up to 63 % of wastewater delivered to centralized treatment plants.
Septic tanks from public latrines are emptied by NMC trucks. It is assumed that private septic
tanks that are not connected to the sewer system are not emptied by the NMC trucks (see
section 3.1) and are connected to the open ground.
Private pit latrines are not emptied by NMC trucks. Latrines without pit but with direct
disposal in open drain or with a bucket that is emptied manually (called ‘Night soil’ and
‘service latrines’ in the Census) are regarded as not containing the faecal sludge.
3.2.3 Transport
All collected wastewater in the sewer is assumed to be conveyed to the treatment plants.
The same applies to faecal sludge that is disposed into manholes by NMC trucks (see
assumptions in section 3.1).
3.2.4 Treatment
The installed treatment capacity in the city of Nashik is adequate to service all households.
Reports show qualitative appropriate treatment. Therefore, all wastewater and faecal sludge
entering the WWTPs is expected to be treated adequately. Foam formation in the effluent of
Tapovan WWTP is a current problem (Matale 2015).
Last Update: 08/03/2016 14
Nashik
India Produced by: GIZ SFD Report
3.2.5 End-use/ disposal
All dried faecal sludge is sold to a private agency for reuse in agriculture after drying (Matale
2015). Treated wastewater is disposed of in the local water bodies (Nashik Municipal
Corporation 2013).
3.2.6 Risk of groundwater containment
About 94 % of the population is covered with adequate quantity of piped freshwater. Being
situated in a hilly region, Nashik is not likely to have very high groundwater tables. The
highest water tables are reported at 8 mbgl (Nashik Municipal Corporation 2011b). With very
limited information available a low risk of pollution of groundwater is assumed.
4 Stakeholder Engagement
4.1 Key Informant Interviews
Key Informant Interviews (KIIs) were conducted in accordance with the methodology to verify
the information retrieved from various reports. Aim of the interviews was the validation and
the actualization of data derived from the reports.
Interviews with NMC officials were conducted at the NMC headquarters at Rajiv Gandhi
Bhavan, Sharanpur Road, in Nashik between 19th and 21st August 2015.
Single interviews were conducted with the following persons:
Mr. R. K. Pawar, Nashik Municipal Corporation (NMC)
Mr. U. B. Pawar, Nashik Municipal Corporation (NMC)
Mr. Bajirao G. Mali, Nashik Municipal Corporation (NMC)
Mr. Shivkumar R. Vanjari, Nashik Municipal Corporation (NMC)
Mr. Sanjay R. Matale, Mahajan Brothers
Dr. Sachin Hire, Nashik Municipal Corporation (NMC)
The SFD is based on data from the years 2011-2014. Validation and update of the
information were done through the interviews. Information was to be corrected.
The CSP from 2011 partly relied on interviews conducted with NMC-officials. The list of the
officials interviewed is stated in Annexure II of the CSP.
4.2 Focus Group Discussions
The visit of Nashik was done in late August 2015. Because of the Kumbh Mela festival in the
last days of August 2015 (see section 1) there was no possibility to arrange a Focus Group
Discussion with ward councilors. Informal interviews with inhabitants of Nashik who gave
their clear opinion about the sanitary situation in their ward were conducted.
Three public representatives are members of the City Sanitation Task Force (CSTF) of
Nashik, which was formed in the context of the CSP process. These representatives can be
a good contact for future SFD-related work.
4.3 Observation of service providers
Last Update: 08/03/2016 15
Nashik
India Produced by: GIZ SFD Report
A field visit to the Tapovan waste water treatment plant was made. This gave a clearer sight
on the treatment situation in Nashik. Through observations of the treatment processes, and
of the operation & maintenance status and interview with employees of the service provider
and the treatment quality stated in various reports was roughly checked.
Information regarding the existing treatment process and the progress of construction were
updated, which led to a considerable benefit for the insight of the sanitation system.
5 Acknowledgements
This SFD is dedicated to the citizens of Nashik. It wouldn’t be possible without the support of
the following people (alphabetical order):
Dr. Sachin Hire, Nashik Municipal Corporation (NMC)
Mr. Bajirao G. Mali, Nashik Municipal Corporation (NMC)
Mr. Sanjay R. Matale, Mahajan Brothers
Mr. R. K. Pawar, Nashik Municipal Corporation (NMC)
Mr. U. B. Pawar, Nashik Municipal Corporation (NMC)
Mr. Rahul Sharma, Gesellschaft für Internationale Zusammenarbeit (GIZ)
Ms. Dipti Shinde, Gesellschaft für Internationale Zusammenarbeit (GIZ)
Mr. Jitendra Yadav, Gesellschaft für Internationale Zusammenarbeit (GIZ)
Mr. Shivkumar R. Vanjari, Nashik Municipal Corporation (NMC)
6 References
1. Census of India 2011. HH-8 : Households by Availability of type of Latrine Facility
2. Central Public Health & Environmental Engineering Organisation 2013. Manual on Sewerage and Sewage Treatment Systems. Third Edition – Revised and Updated
3. Hire 2015. Personal communication with Dr. Sachin Hire, Health Officer, Nashik Municipal Corporation, in person. August 2015
4. Mali 2015. Personal communication with Mr. Balajirao G. Mali, Executive Engineer of NMC (wastewater treatment), in person. August 2015
5. Matale 2015. Personal communication with Mr. Sanjay R. Matale, Senior Chemist, Mahajan Brothers, in person. August 2015
6. Nashik Municipal Corporation 2011a. Draft City Sanitation Plan Volume IV: Slum Mapping– Summary Report. September 2011
7. GIZ 2014. City Sanitation Plan Updation – Status Report Nashik Municipal Corporation. March 2014
8. GIZ 2015. Sanitation Management – Implementation Framework
9. Ministry of Urban Development 2008. National Urban Sanitation Policy – Towards City Wide Sanitation
10. Ministry of Urban Development 2012. Service Levels in Urban Water and Sanitation Sector – Status Report (2010-2011). First Edition, January 2012
Last Update: 08/03/2016 16
Nashik
India Produced by: GIZ SFD Report
11. Ministry of Urban Development 2015. SLB performance data. Available from: <http://moud.gov.in/servicelevel>. [10 August 2015].
12. Nashik Municipal Corporation 2011b. City Sanitation Plan for Nashik – Updated Status Report
13. Nashik Municipal Corporation 2013. Draft Report on Revised City Development Plan for Nashik City June 2013
14. Vanjari 2015. Personal communication with Mr. Shivkumar Ramchandra Vanjari, Executive Engineer NMC (Sewer Network), in person. August 2015
7 Appendix
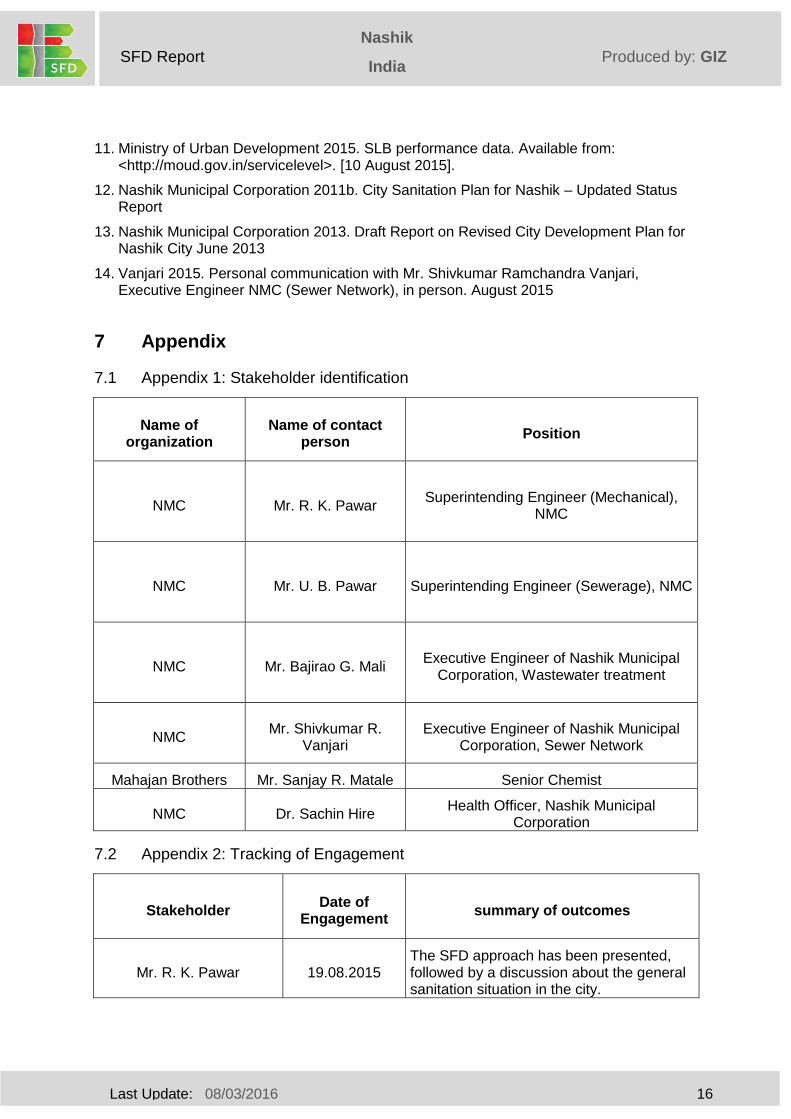
7.1 Appendix 1: Stakeholder identification
Name of organization
Name of contact person
Position
NMC Mr. R. K. Pawar Superintending Engineer (Mechanical),
NMC
NMC Mr. U. B. Pawar Superintending Engineer (Sewerage), NMC
NMC Mr. Bajirao G. Mali Executive Engineer of Nashik Municipal
Corporation, Wastewater treatment
NMC Mr. Shivkumar R.
Vanjari Executive Engineer of Nashik Municipal
Corporation, Sewer Network
Mahajan Brothers Mr. Sanjay R. Matale Senior Chemist
NMC Dr. Sachin Hire Health Officer, Nashik Municipal
Corporation
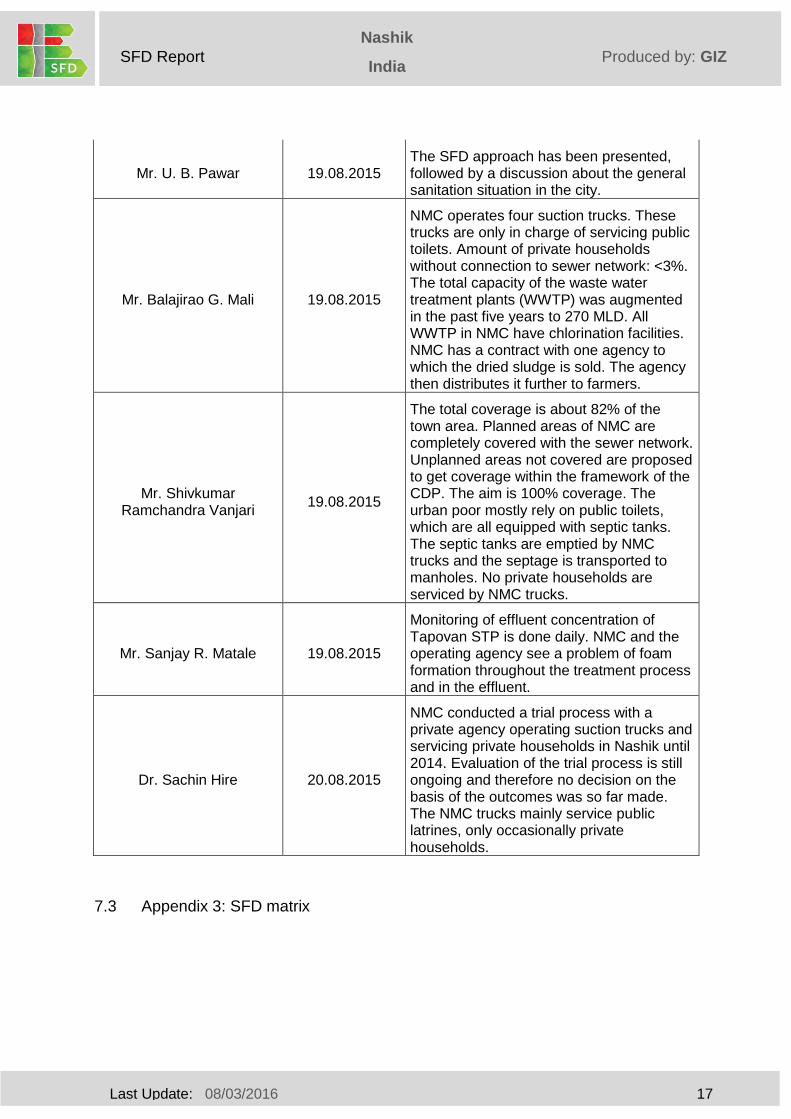
7.2 Appendix 2: Tracking of Engagement
Stakeholder Date of
Engagement summary of outcomes
Mr. R. K. Pawar 19.08.2015 The SFD approach has been presented, followed by a discussion about the general sanitation situation in the city.
Last Update: 08/03/2016 17
Nashik
India Produced by: GIZ SFD Report
Mr. U. B. Pawar 19.08.2015 The SFD approach has been presented, followed by a discussion about the general sanitation situation in the city.
Mr. Balajirao G. Mali 19.08.2015
NMC operates four suction trucks. These trucks are only in charge of servicing public toilets. Amount of private households without connection to sewer network: <3%. The total capacity of the waste water treatment plants (WWTP) was augmented in the past five years to 270 MLD. All WWTP in NMC have chlorination facilities. NMC has a contract with one agency to which the dried sludge is sold. The agency then distributes it further to farmers.
Mr. Shivkumar Ramchandra Vanjari
19.08.2015
The total coverage is about 82% of the town area. Planned areas of NMC are completely covered with the sewer network. Unplanned areas not covered are proposed to get coverage within the framework of the CDP. The aim is 100% coverage. The urban poor mostly rely on public toilets, which are all equipped with septic tanks. The septic tanks are emptied by NMC trucks and the septage is transported to manholes. No private households are serviced by NMC trucks.
Mr. Sanjay R. Matale 19.08.2015
Monitoring of effluent concentration of Tapovan STP is done daily. NMC and the operating agency see a problem of foam formation throughout the treatment process and in the effluent.
Dr. Sachin Hire 20.08.2015
NMC conducted a trial process with a private agency operating suction trucks and servicing private households in Nashik until 2014. Evaluation of the trial process is still ongoing and therefore no decision on the basis of the outcomes was so far made. The NMC trucks mainly service public latrines, only occasionally private households.
7.3 Appendix 3: SFD matrix
Last Update: 08/03/2016 1
Nashik
India Produced by: GIZ SFD Report
T