Seven Leadership Leverage Points for Organization-Level Improvement in Health Care
30
Seven Leadership Leverage Points for Organization-Level Improvement in Health Care Presented by: Robert L. Colones, MBA President and Chief Executive Officer Florence, South Carolina
-
Upload
phyllis-filia -
Category
Documents
-
view
27 -
download
2
description
Seven Leadership Leverage Points for Organization-Level Improvement in Health Care. Presented by: Robert L. Colones, MBA President and Chief Executive Officer Florence, South Carolina. A Quality Leadership Challenge. - PowerPoint PPT Presentation
Transcript of Seven Leadership Leverage Points for Organization-Level Improvement in Health Care
Seven Leadership Leverage Points for Organization-Level Improvement in Health
Care
Presented by:Robert L. Colones, MBA
President and Chief Executive OfficerFlorence, South Carolina

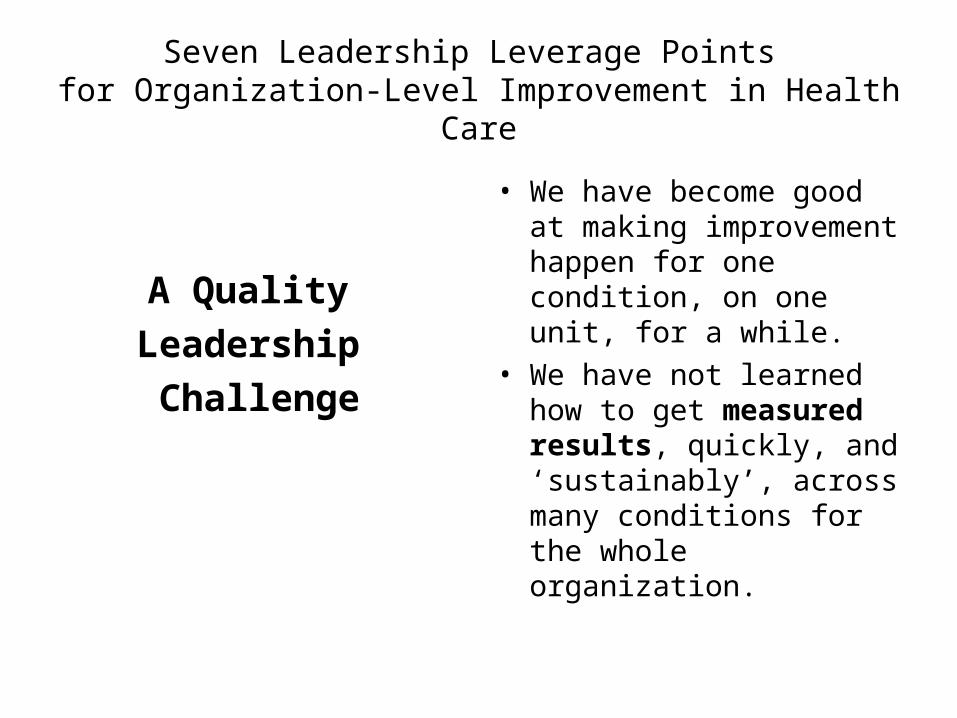
Seven Leadership Leverage Points for Organization-Level Improvement in Health Care
A Quality Leadership Challenge
• We have become good at making improvement happen for one condition, on one unit, for a while.
• We have not learned how to get measured results, quickly, and ‘sustainably’, across many conditions for the whole organization.

Seven Leadership Leverage Points for Organization-Level Improvement in Health Care
‘Give me a lever long enough, and I shall move the world.’ARCHIMEDES
The leverage points are offered as a sort of hypothesis …
If leaders are to bring about system-level performance improvement, they must channel attention to and take action on these points.

Seven Leadership Leverage Points for Organization-Level Improvement in Health Care
1
Establish and
Oversee System-Level Aims for Improvement at the Highest Board and Leadership Level

1 - System-Level Aims for Improvement
Mortality Rate - MRMC
0.00%
0.50%
1.00%
1.50%
2.00%
2.50%
3.00%
3.50%
4.00%
Oct-04
Nov-04
Dec-04
J an-05
Feb-05
Mar-05
Apr-05
May-05
J un-05
J ul-05
Aug-05
Sep-05
Oct-05
Nov-05
Dec-05
J an-06
Feb-06
Mar-06
Apr-06
May-06
J un-06
J ul-06
Aug-06
Sep-06
Oct-06
Nov-06
Dec-06
J an-07
Feb-07
Mar-07
Apr-07
May-07
J un-07
J ul-07
Aug-07
MRMC Average Avg+1Std Avg-1StdAvg+2Std Avg-2Std Linear (MRMC)
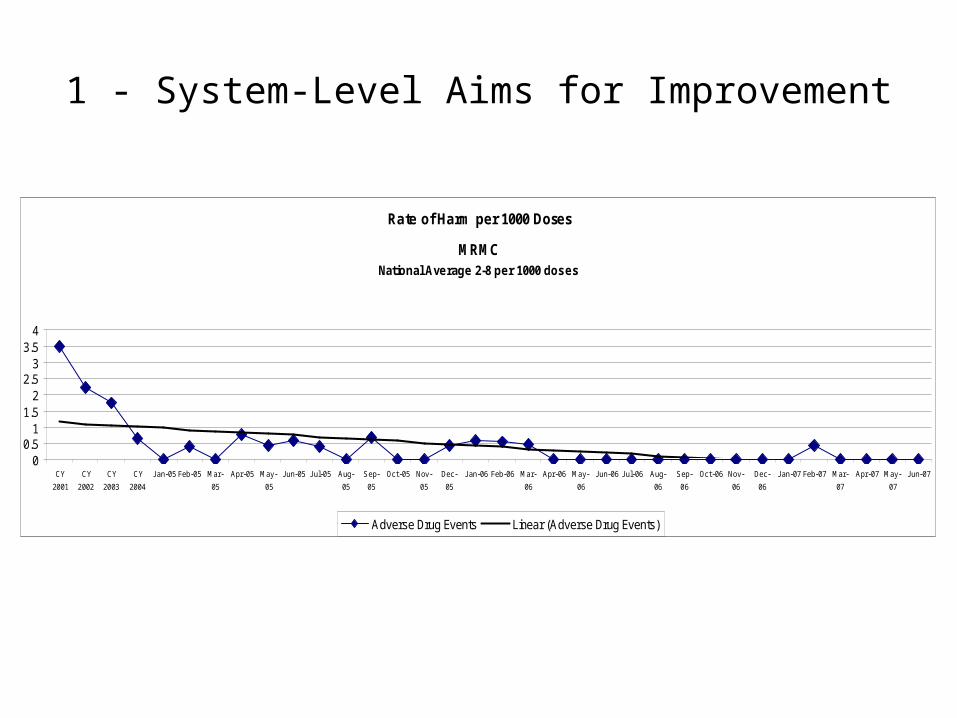
1 - System-Level Aims for Improvement
Rate of Harm per 1000 Doses
MRMCNational Average 2-8 per 1000 doses
00.5
11.5
22.5
33.5
4
CY
2001
CY
2002
CY
2003
CY
2004
J an-05 Feb-05 Mar-
05
Apr-05 May-
05
J un-05 J ul-05 Aug-
05
Sep-
05
Oct-05 Nov-
05
Dec-
05
J an-06 Feb-06 Mar-
06
Apr-06 May-
06
J un-06 J ul-06 Aug-
06
Sep-
06
Oct-06 Nov-
06
Dec-
06
J an-07 Feb-07 Mar-
07
Apr-07 May-
07
J un-07
Adverse Drug Events Linear (Adverse Drug Events)

Seven Leadership Leverage Points for Organization-Level Improvement in Health Care
2
Develop an Executable Strategy to Achieve System Level Aims at Highest Level of Leadership
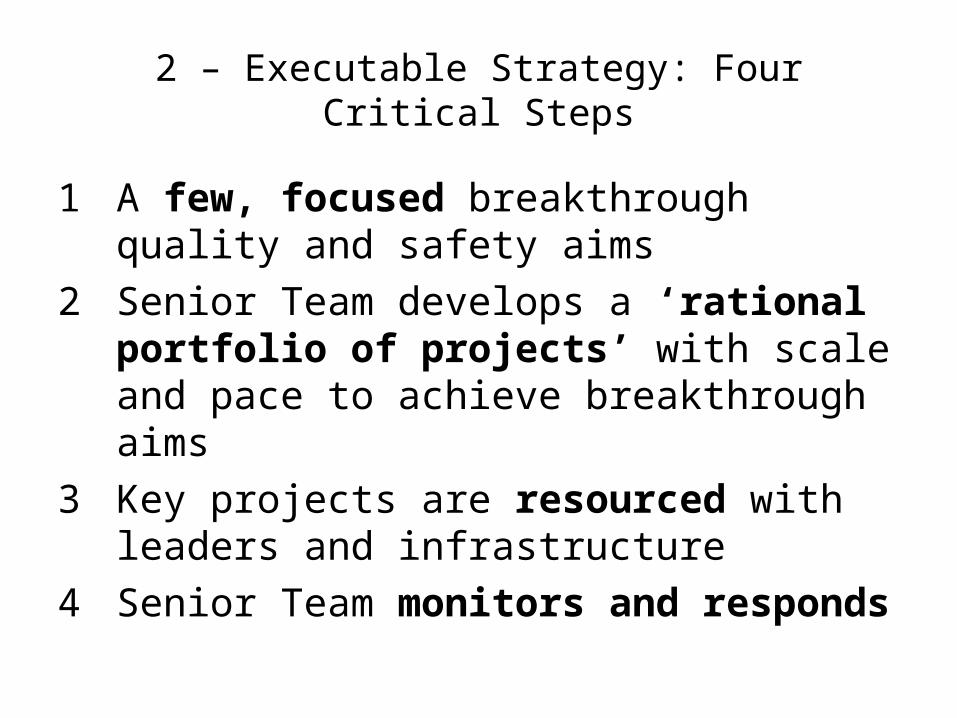
2 – Executable Strategy: Four Critical Steps
1 A few, focused breakthrough quality and safety aims
2 Senior Team develops a ‘rational portfolio of projects’ with scale and pace to achieve breakthrough aims
3 Key projects are resourced with leaders and infrastructure
4 Senior Team monitors and responds

2 – Executable Strategy
Reliability
Theory
Quality as a Core Value
Prioritization Physician & Executive Engagement
Change Theory
Improvement Methodology
CoreSuccess Factors

2 – Executable Strategy: Quality is a Core Value
Service
Science
Safety
“Just Culture” Executive TeamEngagement
Physician Leadership
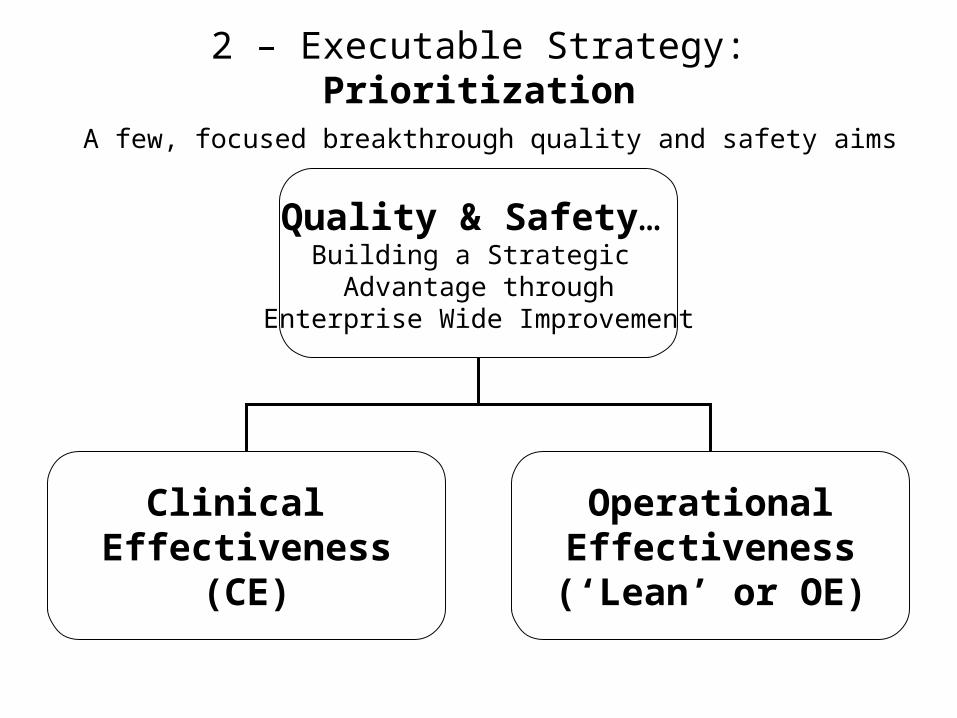
2 – Executable Strategy: Prioritization A few, focused breakthrough quality and safety aims
Quality & Safety… Building a Strategic Advantage through
Enterprise Wide Improvement
Clinical Effectiveness
(CE)
OperationalEffectiveness(‘Lean’ or OE)

2 – Executable Strategy: CE Prioritization A few, focused breakthrough quality and safety aims
OpportunityDriven by Clinical
Data
Complications Readmissions Mortality
Cost Length of Stay
2 – Executable Strategy: CE Prioritization A few, focused breakthrough quality and safety aims
896450
340294
252244222214200194182174170162158142132126118118
Potentially Avoidable Days
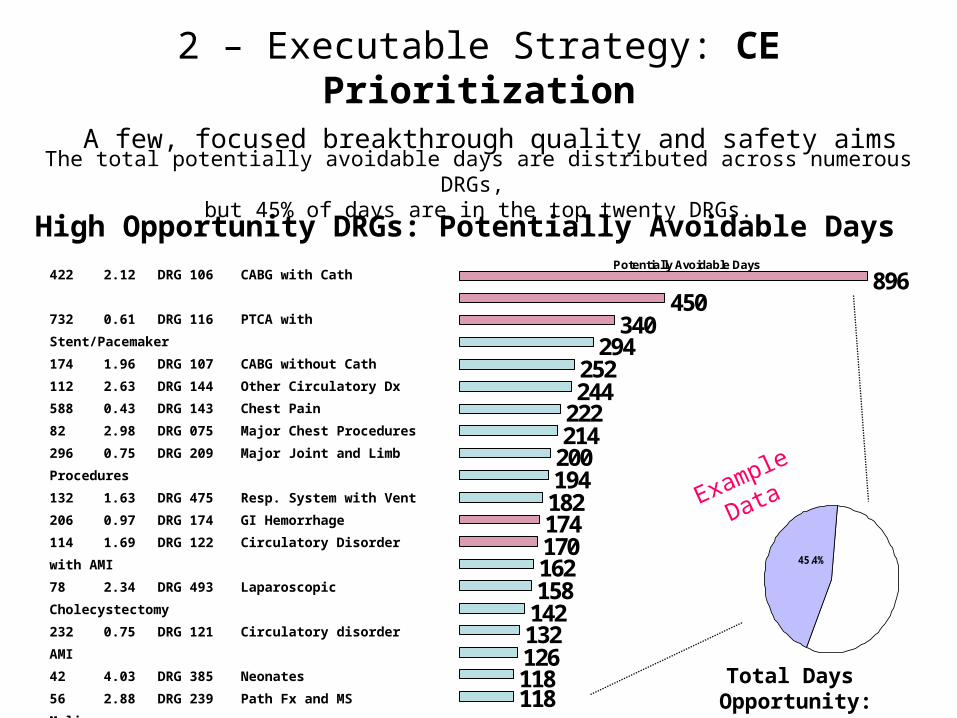
The total potentially avoidable days are distributed across numerous DRGs, but 45% of days are in the top twenty DRGs.
High Opportunity DRGs: Potentially Avoidable Days
45.4%
422 2.12 DRG 106 CABG with Cath
732 0.61 DRG 116 PTCA with Stent/Pacemaker
174 1.96 DRG 107 CABG without Cath
112 2.63 DRG 144 Other Circulatory Dx
588 0.43 DRG 143 Chest Pain
82 2.98 DRG 075 Major Chest Procedures
296 0.75 DRG 209 Major Joint and Limb Procedures
132 1.63 DRG 475 Resp. System with Vent
206 0.97 DRG 174 GI Hemorrhage
114 1.69 DRG 122 Circulatory Disorder with AMI
78 2.34 DRG 493 Laparoscopic Cholecystectomy
232 0.75 DRG 121 Circulatory disorder AMI
42 4.03 DRG 385 Neonates
56 2.88 DRG 239 Path Fx and MS Malignancy
130 1.21 DRG 005 Extracanial Vascular Procedures
170 0.84 DRG 298 Nutritional and Metabolic-Peds
320 0.41 DRG 088 COPD
156 0.81 DRG 316 Renal Failures
96 1.23 DRG 026 Seizures and Headache-Peds
84 1.4 DRG 110 Major Cardiovascular Procedure
Total Days Opportunity: 10,543 days
Example
Data
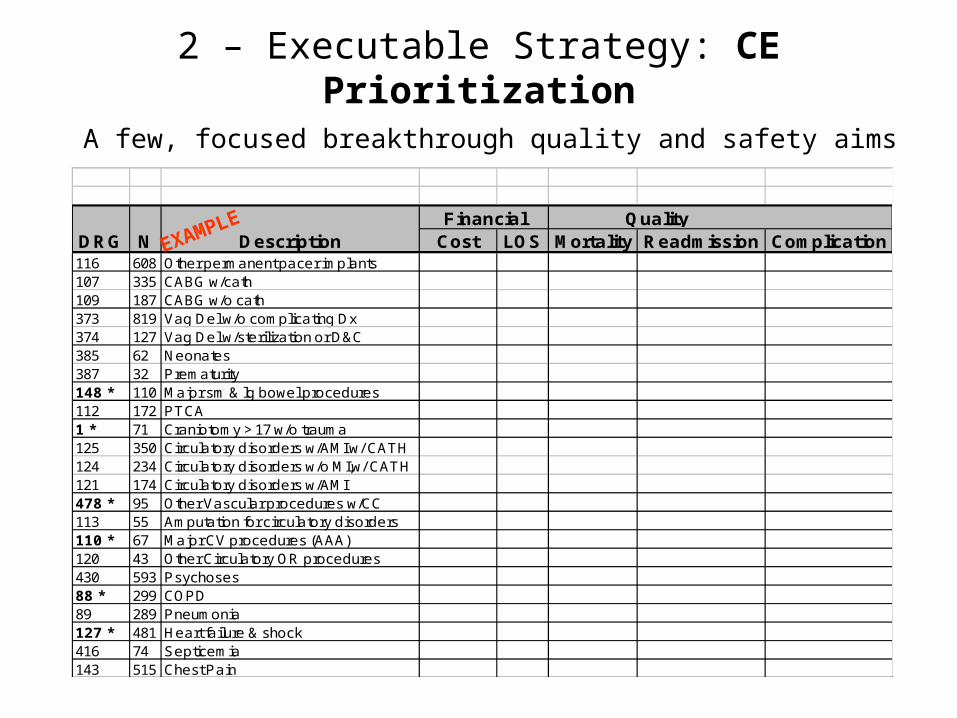
2 – Executable Strategy: CE Prioritization A few, focused breakthrough quality and safety aims
DRG N Description Cost LOS Mortality Readmission Complication116 608 Other permanent pacer implants 107 335 CABG w/cath109 187 CABG w/o cath373 819 Vag Del w/o complicating Dx374 127 Vag Del w/sterilization or D&C385 62 Neonates387 32 Prematurity148 * 110 Major sm & lg bowel procedures112 172 PTCA1 * 71 Craniotomy > 17 w/o trauma125 350 Circulatory disorders w/AMI w/ CATH 124 234 Circulatory disorders w/o MI,w/ CATH 121 174 Circulatory disorders w/AMI 478 * 95 Other Vascular procedures w/CC113 55 Amputation for circulatory disorders110 * 67 Major CV procedures (AAA)120 43 Other Circulatory OR procedures430 593 Psychoses88 * 299 COPD89 289 Pneumonia127 * 481 Heart failure & shock416 74 Septicemia143 515 Chest Pain
Financial Quality
EXAMPLE

2 – Executable Strategy: OE Prioritization A few, focused breakthrough quality and safety aims
Creating Efficiency of Work: Operational Effectiveness
1. Deployment of “Lean” methodology2. Eliminate waste or non-value added work3. Make processes flow smoothly4. Involve staff in redesign of work

2 – Executable Strategy: OE Prioritization A few, focused breakthrough quality and safety aims
‘A3’Opportunity
Driven by Operational Data
Access to CareMake the WorkMore Enjoyable
Better Use ofResources


2 – Executable Strategy: OE
RIE Results from Cardiac Value Stream – Nursing Documentation Time Saved
from toPre-population of fields 60.0 minutes 12.0Electronic documentation 40.0 12.0Peds Questions 10.0 0.5ED TBA paperwork 40.0 0.0Room orientation 20.0 0.0Speech screens 10.0 3.0Diabetic bundle/flow sheet 4.4 1.4Plans of care 24.0
8.0Plus other …
Total Time Savings: Admission History, 60 minutes per
patientadmitted to 27 minutes; Plan of care, 24 minutes to 8
minutes

2 – Executable Strategy: Four Critical Steps
1 A few, focused breakthrough quality and safety aims
2 Senior Team develops a ‘rational portfolio of projects’ with scale and pace to achieve breakthrough aims
3 Key projects are resourced with leaders and infrastructure
4 Senior Team monitors and responds

2 – Executable Strategy: Key Projects Resourced with Leaders, Infrastructure
Clinical Effectiveness-Teams are Physician-Led-Work for 3 months at 2
week intervals-4 to 5 Physicians-Care Manager RN, MSN-Educator-Implementer-Multi-disciplinary Team-VP Champion
Operational Effectiveness
- Team Leader- Work for 6 to 12 months
in VSA, @ 1 RIE/month- OE Facilitator with
certification in ‘lean’- 9 members with 3 in the
area of focus, 3 up/downstream, and 3 ‘fresh eyes’
- VP Champion
2 – Executable Strategy: Key Projects Resourced with Leaders, Infrastructure
1. Establishing a Sense of Urgency2. Forming a Powerful Guiding Coalition3. Creating a Vision4. Communicating the Vision5. Empowering Others to Act on the Vision6. Planning and Creating Short-Term Wins7. Consolidating Improvements and
Producing Still More Change8. Institutionalizing New Approaches
– John Kotter, Leading Change

2 – Executable Strategy: Monitor and Respond
‘The currency of leadership is attention.’
J. Reinertsen, MD
Formal & Informal resources focus on the aims
Inside: calendars, meeting agendas, project reviews, performance feedback and compensation systems
External: Transparency

2 – Executable Strategy: Monitor and Respond

STOP START
Focus on benchmarks
Relying on technology
Thinking “tools” &
“best practices”
Delegating leadership
Focus on “Ideal” & rate of improvement
Rely on people/Process
Technology serves P&PRunning the
organization on “principles”
Leading from the front, constant reinforcement

STOP START
Dozens of metrics
Internal focus (specialty, unit,
role…)
Managing by Control
Improving what we know …greater
complexity
Few, visual, focused metrics that matter
Patient centered, Value Steam focus
Lead through Principles, Standard work.
Lead transformation …start with simple

STOP START
Experts collect data, Design/manage
projects
Incremental improvement
Top down execution Rigid command &
Control
The “fix” mentality
Access knowledge & Creativity of workforce
Double digit gains in vital areas
Bottom up execution Agile and adaptive
The “fitness” mentality