Seven Points from the 2014 Delta Drought...
39
Seven Points from the 2014 Delta Drought Modeling Bay-Delta Science Conference Tara Smith, Siqing Liu, Bryant Giorgi, Eli Ateljevich
Transcript of Seven Points from the 2014 Delta Drought...

Seven Points from the 2014 Delta
Drought Modeling Bay-Delta Science Conference
Tara Smith, Siqing Liu, Bryant Giorgi, Eli Ateljevich

Acknowledgements
2
• Siqing Liu
• Eli Ateljevich
• Bryant Giorgi
• Francis Chung
• Delta Modeling Section
• Operations and Maintenance OCO
• RMA

Background – Precipitation 2014
3 Courtesy of Tracy Hinojosa

Background – Major Reservoir Storage
January 2014
4 http://cdec.water.ca.gov/cdecapp/resapp/getResGraphsMain.action

Background – Processes
and Tools Used to Model
Drought Conditions
5
DSM2/SELFE Historical Simulation
• Historical Flows, Exports, etc..
• Is the baseline and starting point for
Forecasts
Delta Coordination Operations Model, DCO
(DWR Operations)
• Hydrology Data (DWR Flood Management)
• Contractor Delivery Requests (DWR State Water
Project Analysis Office)
• Provides Forecasted Delta Inflows and Exports to
Delta Model
DSM2/SELFE Forecast Simulation
• Receives initial conditions from historical Delta
model simulation
• Receives boundary flow conditions from DCO
• Provides forecasted salinity, velocities and
water levels in the Delta.

Background
– Select
Delta Water
Quality
Locations
6 http://cdec.water.ca.gov/cdecapp/resapp/getResGraphsMain.action

Utilize the Old Studies!
7 2009 Emergency Barriers Draft Report
Impacts Evaluated at CCFB

8
Sutter Slough
Steamboat Slough
West False River
Proposed
Emergency
Barrier Locations

9
Sutter Slough
Steamboat Slough
West False River
General Pattern of
Salinity Impacts
Saltier with
Barriers
Less Salty with
Barriers

Forecasts – Let Me Count the Ways
10
90%
Hydrology
Meet
D-1641
Delta
Consumptive
Use
Emergency
Barriers
Minimum Releases
DCC
Operation
April
Forecast
February
Forecast
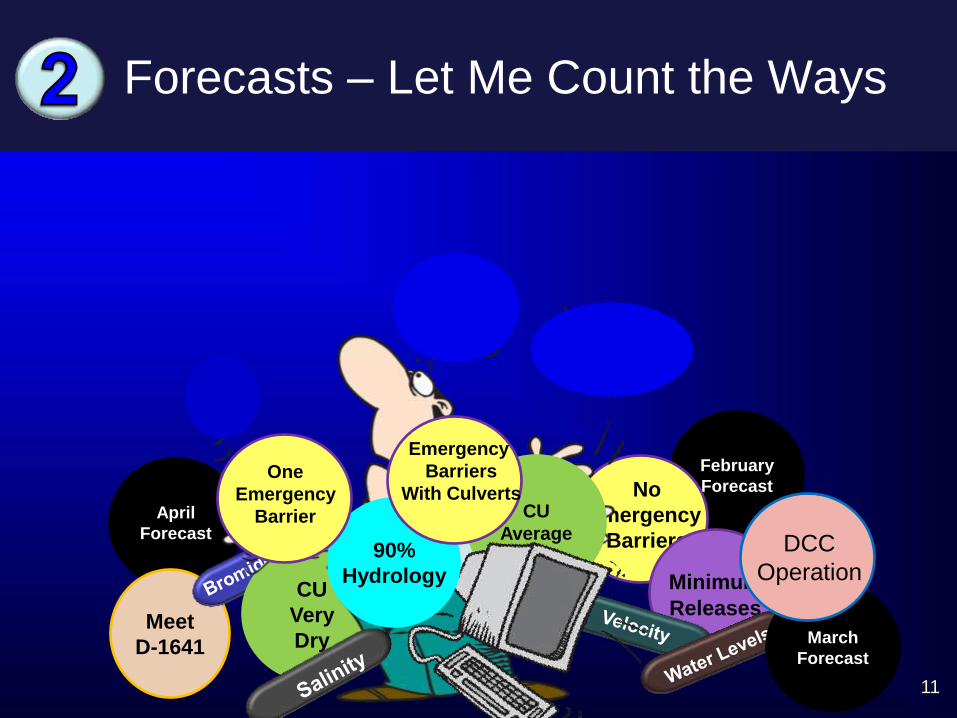
Forecasts – Let Me Count the Ways
11
No
Emergency
Barriers
Meet
D-1641
Minimum Releases
CU
Very
Dry
CU
Average 90%
Hydrology
Emergency
Barriers
With Culverts One
Emergency
Barrier
March
Forecast
DCC
Operation

Forecasts – Let Me Count the Ways
12
EC
2014 Forecast
Early Forecast
Location in Central/South Delta
Minimum Releases
Quality Objective
No Barriers
With Barriers
Minimum Releases – Release Storage over Time
Minimum Releases

Forecasts – Let Me Count the Ways
13
EC
2014 Forecast
Early Forecast
Location in Central/South Delta
Meet D1641
Quality Objective No Barriers
With Barriers
Meet WQ Objectives Until Run Out of Reservoir Storage
Meet
D-1641

Will the Real Consumptive Use Please
Stand Up
14
Delta
Consumptive
Use
• CU Has Large
Impact in
Drought
• Also
Uncertainty

Will the Real Consumptive Use Please
Stand Up
15
Inflows - Exports - In Delta Use = Net Delta Outflow Index
8500 - 1500 - 4500 = 2500
Simple Flow Balance Example
A Difference of 1000 cfs can
have a huge impact on salinity
intrusion
CU Matters!

Extreme Drought is a Stretch For Delta
Models
16
Models Not Calibrated for Extreme
Drought – Outside of Historical
Record

Extreme Drought is a Stretch For Delta
Models
17
Small increase in outflow
results in a large increase
in salinity in low Delta
outflow conditions

How Bad Can it Be?
18
Will the Delta Reach Some Equilibrium
Salinity?

19
Tides
Courtesy of Jamie
Anderson

20
Tides

21
Tides
Possibly a high
equilibrium salinity?

How Bad Can it Be?
22

It’s Not Just Salinity
23
• Fish Spawning and Migration
• Water Levels Near Barrier Sites
• Bromide and Organic Carbon
• Velocities
Lots of Model Output to Analyze

It’s Not Just Salinity
24

Quality Versus Quantity
25
Changing Goals as Precipitation Occurred
• “Good to the Last Drop”
Using the Barriers, Can we Meet Most of the D1641
Water Quality Objectives Through the Summer?
• “We Just Want to Pump You Up??”
Using the Barriers, How Much Water Can We Save for
Later Uses?

Quality Versus Quantity
26
How much water do the Barriers
Save?
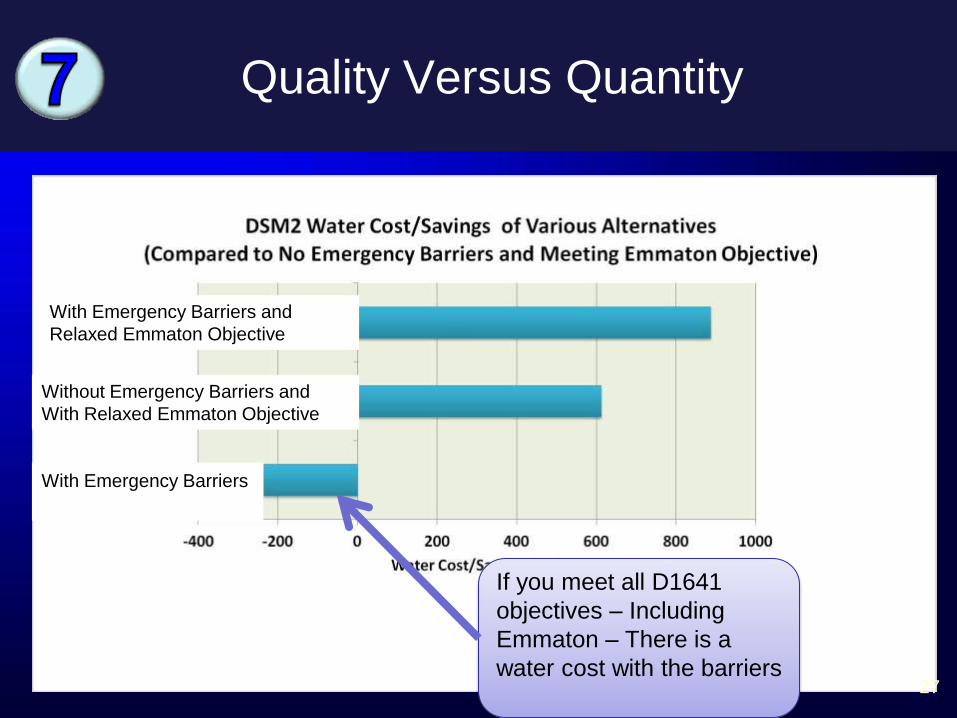
Quality Versus Quantity
27
If you meet all D1641
objectives – Including
Emmaton – There is a
water cost with the barriers
With Emergency Barriers and
Relaxed Emmaton Objective
Without Emergency Barriers and
With Relaxed Emmaton Objective
With Emergency Barriers

28
Sutter Slough
Steamboat Slough
West False River
General Pattern of
Salinity Impacts
Saltier with
Barriers
Less Salty with
Barriers

Quality Versus Quantity
29
Relaxing Emmaton
Objective Results in a
Positive Water Savings
With Emergency Barriers and
Relaxed Emmaton Objective
Without Emergency Barriers and
With Relaxed Emmaton Objective
With Emergency Barriers

Quality Versus Quantity
30
Emergency Barriers add
approximately 270 cfs with
a Relaxed Emmaton
Objective.
With Emergency Barriers and
Relaxed Emmaton Objective
Without Emergency Barriers and
With Relaxed Emmaton Objective
With Emergency Barriers

Quality Versus Quantity
31 Water Cost Savings and Salinity Relationship – courtesy of Eli Ateljevich

Current Modeling Related to Drought
32
• Forecasts
• Modeling for Negative Declaration
• Working with RMA on Model Differences
• Evaluating Historical Dry Years – 1920s onward
• Attempting to Determine Net Delta Outflow from Observed
Data using Tidal Analysis/Statistical Tools
Current Modeling Related to Drought
(cont)
33
• Improving DSM2 Model Boundary Extension
• Recalibrating G-Model (Martinez Boundary Condition for
DSM2)
• Evaluating Historical Consumptive Use Data including Well
Usage
• Reviewing How Well DSM2 Modeled 2014

Will Next Year Be Another Dry Year?
34 http://cdec.water.ca.gov/cdecapp/resapp/getResGraphsMain.action
October 2013 October 2014

Further Acknowledgements
36
Work/Task Name(s) DWR Office/Division
Delta Coordinated Operations (DCO) Modeling Amritpal Sandhu, Tracy Pettit Operations and Maintenance
Modeling for 2009 Emergency Barriers Report Subir Saha Bay-Delta Office
DSM2 Forecasts – DCO Minimum Releases, Early
February Forecast
Bryant Giorgi, James Edwards, Dan Yamanaka, Tracy
Hinojosa
Operations and Maintenance
DSM2 Forecasts – DCO Minimum Releases, Early
February Forecast With and Without Barriers
Siqing Liu Bay-Delta Office
Delta Island Consumptive Use Lan Liang, Bob Suits Bay-Delta Office
Flow balance on South Delta Area Aaron Miller, Ming-Yen Tu Operations and Maintenance, Bay Delta Office
Net Delta Outflow Analysis using USGS Flow Stations Rueen-Fang Wang, Eli Ateljevich Bay-Delta Office
DSM2 Forecasts – DCO Minimum Releases, February
20 Forecast With and Without Barriers
Siqing Liu Bay-Delta Office
DSM2 Forecasts – DCO Meet Delta Water Quality
Objectives Until Storage Water is Unavailable,
February 20 Forecast
Bryant Giorgi Operations and Maintenance
DSM2 Quality Assurance/Quality Control and Analysis
of RMA, DSM2 and SELFE Result Differences
Nicky Sandhu, Bob Suits, Eli Ateljevich Bay-Delta Office
Historical Data Analysis Bob Suits, Joey Zhou Bay-Delta Office
DSM2 Forecast, March 21 Forecast With and Without
Barriers
Siqing Liu Bay-Delta Office

Further Acknowledgements (cont)
37
Work/Task Name(s) DWR Office/Division
SELFE Simulation using March 21st Forecast Eli Ateljevich, Kijin Nam, Rueen-Fang Wang, Inez
Ferreira, Jon Shu
Bay-Delta Office
SELFE Animations Jon Shu Bay-Delta Office
Full Delta Graphics Tool Modification Subir Saha Bay-Delta Office
Specific Location Graphics Tools Ming-Yen Tu Bay-Delta Office
Presentation Graphics Jamie Anderson Bay-Delta Office
Water Cost Savings Analysis Eli Ateljevich Bay-Delta Office
RMA Bay-Delta Forecasts John DeGeorge, Richard Rachiele, Stacie Grinbergs Resource Management Associates, Inc
Extra Slides
38

Quality Versus Quantity
39
Objective Without Emergency Barriers Emergency Barriers
NDO Difference(positive indicates water savings with barriers)
Emmaton 3657 cfs 3893 cfs -236 cfs
Relaxed 3045 cfs 2769 cfs 276 cfs
NDO Difference (positive indicates water savings with relaxed objectives)
612 cfs 1124 cfs
Net Delta Outflow Needed to Meet D-1641 Objectives for Various Alternatives
If you meet all D1641
Objectives – Including
Emmaton – There is a
water cost with the
barriers