September 15, 2017 Shankara Building Products...
24
September 15, 2017 Initiating Coverage ICICI Securities Ltd | Retail Equity Research Retail play on building material opportunity!!! Incorporated in 1995, Shankara Building Products (SBPL) is one of the leading organised retailers of home improvement and building products operating under the “Shankara BuildPro” brand. We like SBPL given its aggressive expansion plan in asset light retail store business in home improvement & building products. It plans to almost double its retail store to 200 (from 116 currently) in next five years and upgrade 96 existing old stores with new product categories in next two to three years. Focus on retail business should lead to strong earnings growth (33.3% CAGR) with a sharp improvement in return ratios in FY17-20E. We initiate coverage on SBPL with a BUY recommendation & SOTP based TP of | 1725. Shankara BuildPro – Building materials under one roof… Under “Shankara BuildPro”, SBPL offers a wide range of home improvement & building products under one umbrella. During FY13-17, SBPL’s retail business grew at 26.4% CAGR at | 980.7 crore on the back of store expansion (17.8% CAGR at 106 stores) and expansion in third- party brands (from 16 to 100+) and SKU (from 6806 to 20000+). Going ahead, we expect its retail business to grow at 27.1% CAGR to | 2013.3 crore in FY17-20E on the back of aggressive expansion plans (looking to almost double stores to 200 with 15-20 store addition every year) and upgradation (plans to upgrade 96 stores with 25-30 stores every year). Focus on asset light retail business model… We like SBPL given its asset light focus on retail stores for home improvement & building products. SBPL requires minimal capex of | 0.5-1 crore for opening new store due to its lease model, which is very low at | 16.6/sq ft per month due to higher presence in Tier II & III cities. With low initial capex, higher asset turnover & consequent RoCE (~45-50% without back-end infrastructure), payback period for new retail store is three years. It lends us comfort that SBPL’s retail store is scalable without incremental capex, which should improve its return ratio profile ahead. Hence, we expect SBPL’s RoCE to improve 680 bps to 29.7% in FY17-20E. Asset light play on growing building material segment; initiate with BUY! With SBPL’s focus on expanding business in the asset light retail store business, we believe it is in a sweet spot to capture growing organised home improvement market. We anticipate SBPL’s earnings will grow at 33.3% CAGR to | 142.9 crore with 680 bps improvement in RoCE at 29.7% in FY17-20E. We initiate coverage on SBPL with a BUY rating & TP of | 1725/share. We value its retail business at | 1553/share (16x FY20E EV/EBIT, at 33% discount to Home Depot when it was in growth phase. Channel & Enterprise business is valued at | 208/share (at 6x EV/EBIT). Exhibit 1: Financial Summary (| Crore) FY16 FY17 FY18E FY19E FY20E Net Sales 2035.9 2310.1 2460.1 2851.4 3331.2 EBITDA 119.6 154.4 170.8 212.3 263.8 Net Profit 40.7 60.3 76.2 106.3 142.9 EPS (|)- Diluted 18.6 26.4 33.3 46.5 62.5 P/E (x) 77.0 54.3 43.0 30.8 22.9 Price/book (x) 10.8 8.3 7.1 6.0 4.9 EV/EBITDA (x) 29.2 22.2 20.0 16.0 12.8 RoCE (%) 21.4 22.9 23.0 26.6 29.7 RoE (%) 14.0 15.3 16.6 19.4 21.3 Source: Company, ICICIdirect.com Research Shankara Building Products (SHABUI) | 1434 Rating matrix Rating : Buy Target : | 1725 Target Period : 12-18 months Potential Upside : 20% YoY Growth (%) (%) FY17 FY18E FY19E FY20E Net Sales 13.5 6.5 15.9 16.8 EBITDA 29.1 10.7 24.2 24.3 Net Profit 48.0 26.3 39.5 34.4 EPS (|) 48.0 26.3 39.5 34.4 Valuation summary (x) FY17 FY18E FY19E FY20E P/E 54.3 43.0 30.8 22.9 Target P/E 65.4 51.8 37.1 27.6 EV / EBITDA 22.2 20.0 16.0 12.8 P/BV 8.3 7.1 6.0 4.9 RoNW (%) 15.3 16.6 19.4 21.3 RoCE (%) 22.9 23.0 26.6 29.7 Stock data Particulars Amount (| crore) Market Capitalization 3,276.7 Total Debt 216.0 Cash 66.2 EV 3,426.5 52 week H/L (|) 1520 / 545 Equity capital 22.9 Face value (|) 10.0 Return Matrix (%) Return % 1M 3M 6M 12M SBPL 40.7 82.1 NA NA Price Movement 7,000 8,000 9,000 10,000 11,000 0 500 1,000 1,500 2,000 Sep-17 Aug-17 Jun-17 May-17 Price (R.H.S) Nifty (L.H.S) Research Analyst Deepak Purswani, CFA deepak,[email protected] Vaibhav Shah [email protected]
Transcript of September 15, 2017 Shankara Building Products...

September 15, 2017Initiating Coverage
ICICI Securities Ltd | Retail Equity Research
Retail play on building material opportunity!!! Incorporated in 1995, Shankara Building Products (SBPL) is one of the leading organised retailers of home improvement and building products operating under the “Shankara BuildPro” brand. We like SBPL given its aggressive expansion plan in asset light retail store business in home improvement & building products. It plans to almost double its retail store to 200 (from 116 currently) in next five years and upgrade 96 existing old stores with new product categories in next two to three years. Focus on retail business should lead to strong earnings growth (33.3% CAGR) with a sharp improvement in return ratios in FY17-20E. We initiate coverage on SBPL with a BUY recommendation & SOTP based TP of | 1725. Shankara BuildPro – Building materials under one roof… Under “Shankara BuildPro”, SBPL offers a wide range of home improvement & building products under one umbrella. During FY13-17, SBPL’s retail business grew at 26.4% CAGR at | 980.7 crore on the back of store expansion (17.8% CAGR at 106 stores) and expansion in third-party brands (from 16 to 100+) and SKU (from 6806 to 20000+). Going ahead, we expect its retail business to grow at 27.1% CAGR to | 2013.3 crore in FY17-20E on the back of aggressive expansion plans (looking to almost double stores to 200 with 15-20 store addition every year) and upgradation (plans to upgrade 96 stores with 25-30 stores every year). Focus on asset light retail business model… We like SBPL given its asset light focus on retail stores for home improvement & building products. SBPL requires minimal capex of | 0.5-1 crore for opening new store due to its lease model, which is very low at | 16.6/sq ft per month due to higher presence in Tier II & III cities. With low initial capex, higher asset turnover & consequent RoCE (~45-50% without back-end infrastructure), payback period for new retail store is three years. It lends us comfort that SBPL’s retail store is scalable without incremental capex, which should improve its return ratio profile ahead. Hence, we expect SBPL’s RoCE to improve 680 bps to 29.7% in FY17-20E. Asset light play on growing building material segment; initiate with BUY ! With SBPL’s focus on expanding business in the asset light retail store business, we believe it is in a sweet spot to capture growing organised home improvement market. We anticipate SBPL’s earnings will grow at 33.3% CAGR to | 142.9 crore with 680 bps improvement in RoCE at 29.7% in FY17-20E. We initiate coverage on SBPL with a BUY rating & TP of | 1725/share. We value its retail business at | 1553/share (16x FY20E EV/EBIT, at 33% discount to Home Depot when it was in growth phase. Channel & Enterprise business is valued at | 208/share (at 6x EV/EBIT).
Exhibit 1: Financial Summary (| Crore) FY16 FY17 FY18E FY19E FY20ENet Sales 2035.9 2310.1 2460.1 2851.4 3331.2EBITDA 119.6 154.4 170.8 212.3 263.8Net Profit 40.7 60.3 76.2 106.3 142.9EPS (|)- Diluted 18.6 26.4 33.3 46.5 62.5P/E (x) 77.0 54.3 43.0 30.8 22.9Price/book (x) 10.8 8.3 7.1 6.0 4.9EV/EBITDA (x) 29.2 22.2 20.0 16.0 12.8RoCE (%) 21.4 22.9 23.0 26.6 29.7RoE (%) 14.0 15.3 16.6 19.4 21.3
Source: Company, ICICIdirect.com Research
Shankara Building Products (SHABUI)| 1434
Rating matrix Rating : BuyTarget : | 1725Target Period : 12-18 monthsPotential Upside : 20%
YoY Growth (%)
(%) FY17 FY18E FY19E FY20ENet Sales 13.5 6.5 15.9 16.8EBITDA 29.1 10.7 24.2 24.3Net Profit 48.0 26.3 39.5 34.4EPS (|) 48.0 26.3 39.5 34.4
Valuation summary
(x) FY17 FY18E FY19E FY20EP/E 54.3 43.0 30.8 22.9 Target P/E 65.4 51.8 37.1 27.6 EV / EBITDA 22.2 20.0 16.0 12.8 P/BV 8.3 7.1 6.0 4.9 RoNW (%) 15.3 16.6 19.4 21.3 RoCE (%) 22.9 23.0 26.6 29.7
Stock data Particulars Amount (| crore)Market Capitalization 3,276.7Total Debt 216.0Cash 66.2EV 3,426.552 week H/L (|) 1520 / 545Equity capital 22.9Face value (|) 10.0
Return Matrix (%)
Return % 1M 3M 6M 12M
SBPL 40.7 82.1 NA NA Price Movement
7,000
8,000
9,000
10,000
11,000
0
500
1,000
1,500
2,000
Sep-
17
Aug
-17
Jun-
17
May
-17
Price (R.H.S) Nifty (L.H.S) Research Analyst
Deepak Purswani, CFA deepak,[email protected] Vaibhav Shah [email protected]

Page 2ICICI Securities Ltd | Retail Equity Research
Company background Incorporated in 1995, Shankara Building Products (SBPL) is one of the leading organised retailers of home improvement & building products operating under trade name “Shankara BuildPro”. It was founded by Sukumar Srinivas, an alumnus of IIM Ahmedabad and a first generation entrepreneur who has 33 years of experience in the building products industry. Currently, SBPL operates 116 stores across nine states and one union territory. It came out with IPO in March, 2017 and was listed on bourses in April, 2017. It included a fresh issue of | 45 crore and offer for sale (OFS) of | 300 crore (~| 37 crore by promoters and ~| 263 crore by Fairwinds Trustees Services). SBPL operates in three segments viz.
a) Retail sales: Under the retail segment, SBPL serves home owners, professional customers (like architects, contractors) and small enterprises through its retail stores. It offers a comprehensive range of products at its stores, including structural steel, cement, TMT bars, hollow blocks, pipes & tubes, roofing solutions, welding accessories, primers, solar heaters, plumbing, tiles, sanitaryware, water tanks, plywood, kitchen sinks, lighting and other allied products. Retail segment contributed 42.5%, 45.7% of overall revenues in FY17, Q1FY18, respectively
b) Enterprise sales: This was started in 1995 with SBPL catering to large end-users, contractors and OEMs. It provides customised solutions to customers through in-house & third party products. Enterprise segment accounted for 32.8%, 32.2% of overall revenues in FY17, Q1FY18, respectively
c) Channel sales: Started in 1999, it caters to dealers & other retailers where it offers steel based in-house and third party products. Channel segment contributed 24.7%, 22.1% of overall revenues in FY17, Q1FY18, respectively
Also, SBPL has 12 processing facilities in select building products like steel pipes, colour coated roofing sheets, bright rods, galvanised strips and cold rolled strips with total capacity of 327400 MT. The company sells these products under its own brands like CenturyRoof, Ganga, Taurus and Price Galva. To support its vast retail network, SBPL has a robust logistic network consisting of 56 warehouses and a fleet of 44 owned trucks.
Exhibit 2: Shankara Building Products Timeline…
Commences retail operations in Gujarat and Goa
Opens integratedwarehousing facility of 55,000 sq ft in Bengaluru
Adds new products categories –cement, tiles, scaffolding and solar products;
Commences retailoperations in Odisha
Launches own private label brands: Taurus, Prince Galva Plus, Loha; Also, adds new product category of water tanks
FY95
Raises private equity investment of | 80 crore
Sukumar Srinivas incorporates Shankara Building Products Ltd
FY03
FY06
Opens first retailstore in Bengaluru
FY07
FY08
FY11
FY15
FY16 FY18
FY17
SBPL came out with IPO of | 345 crore (Fresh issue: | 45 crore & OFS: | 45 crore) and got listed on BSE and NSE
115 retail stores as ofSeptember, 2017
Source: Company, ICICIdirect.com Research
Shareholding pattern (Q1FY18)
Shareholder Holding (%)Promoter 56.2 FII 7.3 DII 16.4 Others 20.1 Total 100.0
Source: BSE Filing, ICICIdirect.com Research
Shareholding pattern (Q1FY18)
4.7 7.3 8.1
16.4
-
5.0
10.0
15.0
20.0
Q4FY17 Q1FY18
(%)
FII DII
Source: BSE Filing, ICICIdirect.com Research

Page 3ICICI Securities Ltd | Retail Equity Research
Exhibit 3: SBPL - Segmental view…
Retail Enterprise
O d B k | 3359 7 | 67 9
Products Sells home improvement products of 100+ brands covering 20000+ SKU's
Sells third party as well as own brand steel products
Management Target
To increase revenue share to ~70% over the
next 4-5 years
To maintain moderate growth ahead
EBIT Margins (FY17) 9.9% 6.4%*
Others Average size per transaction of
| 23,244 in FY17
Strong association with Corporates with ability to
customize products
Inception Started in 2006 Started in 1995
Business profile Caters to home owners, professional customers & small enterprises via its 115 Shankara Buildpro
Caters to large end users, contractors and OEM's to meet
customised requirements of customers
Revenue share (FY17)
~33%| 760 crore
Channel
| 67 9
Sells branded and generic steel and third party products
Conscious decision to reduce revenue share, going aead
6.4%*
Strong distribution network of 2000+ dealers
Started in 1999
Caters to dealers and other retailers
~25%| 570 crore
Key USP Wide range of products, trust and convenience to
clientele
Customised solutions provided to clientele
Timely delivery and wide product mix
~43%| 981 crore
Source: Company, ICICIdirect.com Research *: SBPL reported combined EBIT margins for Enterprise and Channel business at 6.4%

Page 4ICICI Securities Ltd | Retail Equity Research
Building material industry growth prospects… The building material products industry in India is estimated at ~| 5 lakh crore. Of this, eight key segments (as described below) are pegged at | 4.4-4.8 lakh crore as of 2015-16. Over the past three years, the industry has grown at ~5-5.5% CAGR. It is expected to grow at 8-8.5% CAGR over the next few years to ~| 6.8-7 lakh crore. With organised players looking to expand their retail share, ~34-38% of building materials are expected to be sold through retail network. Even GST implementation will help organised players expand their market share, which would further boost prospects of retail network for building materials. Increasing population, a young demographic profile, rising affordability with higher income levels and increasing frequency of renovations are fuelling the fundamental aspirations of households towards housing and housing upgrades.
Exhibit 4: Building material industry set to grow…
SegmentMarket Size (in |'000 crore as of 2015-16)
Next 5 years growth forecast
Organised player share
Level of customer involvement in product purchase Sales via retail channel
Cement 130-140 8-8.5% ◕ ◔ ◔Structural Steel 130-140 7-8% ◔ ◔ ◔Bricks 60-65 8-10% ◔ ◔ ◔Paints 39-40 12-14% ◕ ◕ ◑Plumbing - PVC Pipes 26-27 10-12% ◑ ◔ ◔Ceramic tiles & Sanitaryware 25-26 10.5-11% ◑ ◕ ◕Plywood & Laminates 24-25 11-11.5% ◔ ◕ ◕Lighting 18-19 11-13% ◕ ◕ ◑Total 450-480 8 - 8.5%
Source: RHP, ICICIdirect.com Research
A large part of India and the Indian housing industry continue to thrive in smaller dwelling units in Tier II, III cities. Small contractors and individual home builders cater to them. Typically, sourcing genuine building products from trusted parties is an increasing challenge for home owners wherein organised retailers of home improvement and building products come to their rescue.
Exhibit 5: Retail home improvement drivers…
Source: Company, ICICIdirect.com Research

Page 5ICICI Securities Ltd | Retail Equity Research
Even various government initiatives like ‘Swachh Bharat Abhiyaan’, ‘Housing for All by 2022’ & ‘Smart City Mission’ are expected to drive the demand for various building materials, thereby enhancing the growth for the home improvement and home building industry.
Exhibit 6: Government policies favouring industry growth…
Source: Company, ICICIdirect.com Research
The demand for building materials is not only increasing from residential & commercial segment but also from segments like retail (malls), hospitality (hotels), healthcare (hospitals), etc. Furthermore, construction of a housing unit involves usage of several building materials like cement, sand, steel, electrical products, etc. The below-mentioned break-up indicates that eight key building materials account for more than 75% share in the overall building material cost break-up.
Exhibit 7: Building material wise cost break-up…
Source: RHP, ICICIdirect.com Research

Page 6ICICI Securities Ltd | Retail Equity Research
Investment Rationale Shankara BuildPro – One Stop shop for building materials Through retail stores under the name “Shankara Build Pro”, the company offers a comprehensive range of home improvement and building material products including structural steel, cement, TMT bars, hollow blocks, pipes & tubes, roofing solutions, welding accessories, primers, solar heaters, plumbing, tiles, sanitary ware, water tanks, plywood, kitchen sinks, lighting and other allied products. Under retail stores, it caters to home owners, professional customers (such as architects & contractors) and small enterprises.
Exhibit 8: Comprehensive product range…
Source: Company, ICICIdirect.com Research
Over the last four years, the company has expanded its third party brand portfolio at a robust pace from 16 in FY13 to 100+ brands currently. SBPL also expanded its stock keeping unit (SKUs) from 6806 in FY13 to 20000+ currently. The company has different offerings of building materials for consumers under one umbrella.
Exhibit 9: 100+ brands under one roof…
Source: Company, ICICIdirect.com Research

Page 7ICICI Securities Ltd | Retail Equity Research
Aggressive retail expansion & upgradation plan to sustain healthy growth
SBPL aggressively expanded its store network from 55 in FY13 to 106 stores in FY17, which led to strong retail revenue growth of 26.4% CAGR to | 980.7 crore in FY13-17. Going ahead, it is looking to almost double its store count to 200 over the next four to five years. To achieve this, the company is planning to open 15-20 stores every year over the next four or five years. Even revenue per store has grown steadily at 7.3% CAGR to | 9.3 crore per store. We expect the company to maintain this steady growth ahead with SBPL also looking to upgrade its existing 96 old stores (25-30 stores per year). Consequently, with steady revenue per store growth and SBPL’s aggressive store expansion plan, we expect retail revenues to grow at 27.1% CAGR to | 2013.3 crore in FY17-20E.
Exhibit 10: Charting the retail story…
Retail Revenues*
619.3 807.8 980.7383.6 464.7 1187.7 1569.4 2013.3300
600
900
1200
1500
1800
2100
FY13 FY14 FY15 FY16 FY17 FY18E FY19E FY20E
(| c
rore
)
26.4% CAGR
27.1% CAGR
Number of stores
55 71 88 95 106 121 141 16130
60
90
120
150
180
FY13 FY14 FY15 FY16 FY17 FY18E FY19E FY20E
17.8% CAGR
14.9% CAGR
Revenue per store
7.0 7.0 8.5 9.36.5 9.8 11.1 12.56.0
8.0
10.0
12.0
FY13 FY14 FY15 FY16 FY17 FY18E FY19E FY20E
(| c
rore
)
7.3% CAGR
10.6% CAGR CAGR
Source: Company, ICICIdirect.com Research *Retail Revenues = Revenue per store * Number of stores
Aggressive upgradation plan of existing stores and addition of new stores would lead to 10.6% CAGR in revenue per store to | 12.5 crore per store

Page 8ICICI Securities Ltd | Retail Equity Research
Retail margin – still scope for expansion through favourable product mix…
SBPL’s gross profit margins in the retail store business were ~12% in FY17. Despite this, it clocked EBITDA margin at 9.9% in FY17 mainly due to a very low lease rate (~0.6% of revenues in FY17 - currently the lease rate is only | 16.6 psf per month) and low operating expenses due to efficient size of store (3500-4000 sq ft).
Exhibit 11: Favourable retail store economics Retail Business Model FY12 FY13 FY14 FY15 FY16 FY17 Q1 FY18 FY18E FY19E FY20ERetail Revenues (| crore) 294.7 383.6 464.7 619.3 807.8 980.7 270.0 1,187.7 1,569.4 2,013.3 YoY growth (%) 30.2 21.1 33.3 30.4 21.4 21.0 21.1 32.1 28.3
EBITDA* (| crore) 6.9 12.9 21.8 46.1 77.5 97.2 30.2 120.0 161.5 211.1 EBITDA Margin(%) 2.3 3.4 4.7 7.4 9.6 9.9 11.2 10.1 10.3 10.5
No of Stores 43 55 71 88 95 106 112 121 141 161
Per store matrixAverage Revenues per store 6.9 7.0 6.5 7.0 8.5 9.3 9.6 9.8 11.1 12.5 YoY growth (%) 1.8 (6.2) 7.5 20.8 8.8 21.0 6.1 13.4 12.4 SSG growth 31.0 16.7 13.3 24.2 28.3 19.4 15.0 NA NA NA
EBITDA* per store 0.2 0.2 0.3 0.5 0.8 0.9 0.3 1.0 1.1 1.3
Average Store Size (sq ft) 2,923 3,278 3,153 3,308 3,401 3,595 3,582 3,703 3,888 4,082
Per sq ft matrixRevenues per sq ft (|/ sq ft) 23,450 21,276 20,758 21,272 25,004 25,735 26,920 26,507 28,628 30,632 EBITDA per sq ft (|/ sq ft) 549 715 974 1,583 2,399 2,551 754 2,678 2,946 3,211 Lease rate (|/ sq ft per month) NA NA NA NA NA 16.1 16.6 16.9 17.8 18.7
Source: Company, ICICIdirect.com Research *before un-allocable expenses
Going ahead, we believe it has the scope to further improve EBITDA margins with a favourable product mix. Currently, new range products (sanitaryware, plumbing, flooring and electrical) account for only 10% of retail revenues (~| 100 crore). The management aims to reach 25% of revenues from these products over the next three years. Apart from providing a favourable product mix, the quantum of new business should also provide better negotiating terms with vendors. Furthermore, operating leverage may kick in further with the ramping up of same store growth. With these layers, EBITDA margins may improve to 12% over the next few years. Nonetheless, we remain conservative in our estimates. We consider a moderate expansion of 60 bps at 10.5% in FY17-20E. We would like to closely monitor ramp up in a new range of products.
Exhibit 12: High margin decorative products to drive EBITDA margins…
Construction material, 45%
Interior / Exterior, 15%
Plumbing, Sanitaryware & Flooring, 15%
Electricals, 10%
Roofing, 10%Irrigation, 5%
FY20E
Construction material, 65%Interior / Exterior, 10%
Plumbing, Sanitaryware &
Flooring, 5%
Electricals, 5%
Roofing, 10%Irrigation, 5%
FY17
Source: Company, ICICIdirect.com Research

Page 9ICICI Securities Ltd | Retail Equity Research
Store economics imply strong growth achievable with minimal capex
We have tried to look at the store level economics for SBPL. On the investment front, SBPL requires initial investment of only | 0.5-1 crore to open a new store with average store size of 3500-4000 sq ft since it follows the lease model for retail store. The capex requirement is mainly for working capital, deposit for lease arrangement and renovation cost for the store.
In terms of sales, it achieves sales of | 30-40 lakh per month, which is expected to scale up to | 60-70 lakh per month over the next six to 12 months. Then, over the next two to three years, the new stores, at the company level, are expected to achieve store sales of ~| 10 crore per annum. In terms of operating expenses, SBPL manages it very well within 2% of revenues mainly due to lower lease expenses (just 0.6% of revenues in FY17 vs. 8-10% for other retail players). It enjoys a low lease rate of | 16.6 per sq ft per month on account of higher presence in Tier II & III cities (contributes ~65% of revenues). Furthermore, at some stores, it enters into a long term lease arrangement (usually 10 years with 5% rent escalation per annum) for land. Then it constructs the store with basic construction material. With better control on operating expenses, it enjoys better EBITDA margin of ~10% at the store level despite gross profit margin of 11-12%.
With the ramp up in sales over the next two to three years, better EBITDA margin and low initial capex requirement, the company enjoys RoCE of 45-50% at the store level (without considering back-end infrastructure investment such as warehouse & processing facilities). Hence, SBPL enjoys a payback period of three years at the store level. It lends us comfort that it would not need significant capex for ramping up the retail store from 106 in FY17 to ~200 stores over the next four to five years.
Exhibit 13: New store metrics P & L Year 1 Year 2 Year 3 Year 4 Year 5 Cash flow Statement Year 1 Year 2 Year 3 Year 4 Year 5
Revenues 6.3 9.0 10.3 11.8 13.3 PAT + Depreciation 0.3 0.5 0.6 0.8 1.0
YoY growth (%) 42.4 15.0 14.0 13.0 Change in WC (0.5) (0.2) (0.1) (0.1) (0.1)
Gross Profit 0.7 1.0 1.2 1.5 1.7 Operating Cash flow (0.2) 0.3 0.5 0.7 0.9 YoY growth (%) 46.6 19.6 19.6 19.4 Change in FA (0.5) - - - -
EBITDA 0.5 0.8 1.0 1.2 1.5 Free Cash flow (0.7) 0.3 0.5 0.7 0.9
YoY growth (%) 62.0 23.1 22.5 21.9 Change in debt 0.5 (0.1) (0.1) (0.1) (0.1)
PAT 0.3 0.5 0.6 0.8 1.0 Change in equity 0.3 - - - -
YoY growth (%) 77.1 26.8 24.9 23.6 Closing Cash balance 0.1 0.3 0.7 1.3 2.0
Balance sheet Year 1 Year 2 Year 3 Year 4 Year 5 Ratios (%) Year 1 Year 2 Year 3 Year 4 Year 5Equity 0.6 1.1 1.7 2.5 3.5 Turnover ratios
Debt 0.5 0.4 0.3 0.2 0.1 Asset turnover 5.7 6.0 5.1 4.3 3.7
Total Capital employed 1.1 1.5 2.0 2.7 3.6 Profitability ratios
Gross profit margin 11.0 11.3 11.8 12.4 13.1
Net Block 0.5 0.5 0.5 0.5 0.5 EBITDA Margin 8.0 9.1 9.8 10.5 11.3
WC (ex cash) 0.5 0.7 0.8 1.0 1.1 PAT Margin 4.5 5.6 6.2 6.8 7.4
Cash 0.1 0.3 0.7 1.3 2.0 Return Ratios
Total capital deployed 1.1 1.5 2.0 2.7 3.6 RoCE* 44.7 53.7 48.7 44.6 41.2
Source: Company, ICICIdirect.com Research *without considering back-end infra cost such as warehousing & processing facilities. After considering it, RoCE is still healthy in the range of ~30-40%
FY17 Revenues break-up
Tier III40%
Tier II, 25%
Tier I35%
State-wise FY17 revenue break-up
Andhara Pradesh10%
Goa4%
Gujarat2%
Karnataka55%
Kerala9%
Maharashtra2%
Odisha1%
Tamil Nadu7%
Telangana10%
Given the minimal capex requirement, better margin profile and higher asset turnover, the company enjoys higher RoCE profile of ~45-50% at the store level. Hence, the payback period at the store level is two to three years as visible in free cash flow. This lends us comfort that strong growth is achievable through minimal capex

Page 10ICICI Securities Ltd | Retail Equity Research
Increasing share of retail revenues to drive RoCE & EBITDA margins…
SBPL has significantly ramped up its retail presence over the past few years. It has aggressively expanded its store network from 43 stores in FY12 to 116 currently. Consequently, the share of the retail business in overall revenues doubled from ~21% in FY12 to 42.5% in FY17. It further improved to 45.7% in Q1FY18. Going forward, the company plans to further expand its retail revenue share to ~70% over the next four to five years. Keeping in mind the company’s aggressive expansion in retail stores, we expect the retail share in total revenues to improve further from 42.5% in FY17 to 60.4% in FY20E. Hence, we anticipate SBPL’s return ratio profile will improve significantly by 680 bps to 29.7% in FY17-20E. Also, overall EBITDA margins are expected to expand 120 bps to 7.9% in FY17-20E.
Exhibit 14: Increasing retail share to drive RoCE…
0%
20%
40%
60%
80%
100%
FY13 FY14 FY15 FY16 FY17 FY18E FY19E FY20E
Channel
Enterprise
Retail
17.316.1 14.9
21.422.9 23.0
26.6
29.7
4.9 4.6 4.5
5.96.7 6.9
7.47.9
10.0
15.0
20.0
25.0
30.0
35.0
FY13 FY14 FY15 FY16 FY17 FY18E FY19E FY20E
2.0
4.0
6.0
8.0
10.0
RoCE (%) Overall EBITDA Margin (%)
Source: Company, ICICIdirect.com Research

Page 11ICICI Securities Ltd | Retail Equity Research
Other supportive business segments… Channel business–Provides better insights for future retail stores…
The company started the channel business in 1999. It caters to dealers & other retailers where it offers steel based in-house & third party products. SBPL carries out channel sales through a dealer network of 2000+ dealers, which are on a non-exclusive basis. The company distributes products like water tanks, sanitary and CP fittings, steel pipes and tubes, steel sheets, etc. SBPL’s own brand such as Loha, PriceGalva, Taurus, Ganga, CenturyRoof, Shankara Solar and Price are also distributed through a dealer network. The key third party brands carried through the network include Johnson, Sintex, Uttam Galva, Astral Pipes and APL Apollo.
Exhibit 15: Channel sales trend…
512.
9
461.
6
415.
5
672.
8
570.
1
569.
90
250
500
750
FY15 FY16 FY17 FY18E FY19E FY20E
(| c
rore
)
-20%
-15%
-10%
-5%
0%
5%
Channel YoY growth (%)
Source: Company, ICICIdirect.com Research
The company has been consolidating this business over the years, which should continue, going ahead. Hence, we expect the revenue share from the channel division to reduce from 24.7% in FY17 to 12.5% in FY20E. However, SBPL would not completely ramp down its channel business as it provides a great insight to understand the market dynamics, consumer behaviour, products and brand acceptance in a particular area. This, in turn, provides leads to the company to set up new retail stores for home improvement and building materials. We expect channel revenues to reduce from | 569.9 crore in FY17 to | 415.5 crore in FY20E.
Exhibit 16: Share of channel revenues to decline sharply…
0%
15%
30%
45%
FY13 FY14 FY15 FY16 FY17 FY18E FY19E FY20E
Source: Company, ICICIdirect.com Research

Page 12ICICI Securities Ltd | Retail Equity Research
Enterprise business – To grow moderately ahead…
The company started its operations through the enterprise division in 1995. Under this segment, SBPL primarily caters to large end-users, contractors and OEMs. These customers are more particular about the quality, customised specifications and timely delivery. Hence, the company provides customised solutions to customers through in-house and third party products. SBPL’s own integrated facilities play a crucial role for the company in providing customised solutions for specific client requirements. Enterprise sales are widely diversified with top 10 customers contributing less than ~10% of total enterprise sales. The customer base is spread across various industries like auto ancillaries, boiler manufacturers, electrical panel boards, textile machinery, etc. In this segment, the company provides solutions with kit based, cut-to-size and ready-to-use assembled products to customers. SBPL aims to increase the share of customised solutions in overall enterprise revenues, which would help generate higher margins.
With the management’s conscious decision to increase the revenue share of its high margin retail division, we expect the share of its enterprise revenues to reduce gradually from 32.9% in FY17 to 27.1% in FY20E. We expect enterprise revenues to grow moderately at 5.9% CAGR to | 902.4 crore over FY17-20E.
Exhibit 17: Enterprise sales trend…
759.
6
820.
3
902.
4
692.
6
651.
5
759.
6
0
250
500
750
1000
FY15 FY16 FY17 FY18E FY19E FY20E
-10%
0%
10%
20%
Enterprise YoY growth (%)
Source: Company, ICICIdirect.com Research
Exhibit 18: Share of enterprise revenues to reduce moderately…
0%
10%
20%
30%
40%
FY13 FY14 FY15 FY16 FY17 FY18E FY19E FY20E
Source: Company, ICICIdirect.com Research
Following is the customised product categories that the company offers to its varied clientele. Currently ~20% of enterprise revenues comes from these customised solutions, which the company plans to improve, going forward. This would help improve its EBITDA margins as these solutions command better gross margins.
Exhibit 19: Customised product offerings to Enterprise customers… Category Customer
Bus Body Marco Polo, KSRTC
Scaffolding L&T, Amrutha Institute
Automobile Ancillaries of Tata Motors, Ashok Leyland, TVS, Hyundai
PEB Paramount, Pennar
Solar Mithra Solar, Smartek Energy, Warren
Source: Company, ICICIdirect.com Research
Page 13ICICI Securities Ltd | Retail Equity Research
Back-end infrastructure in place to support front-end business SBPL has a strong back-end infrastructure in place, which ensures efficient supply chain management and supports its retail, enterprise and channel businesses.
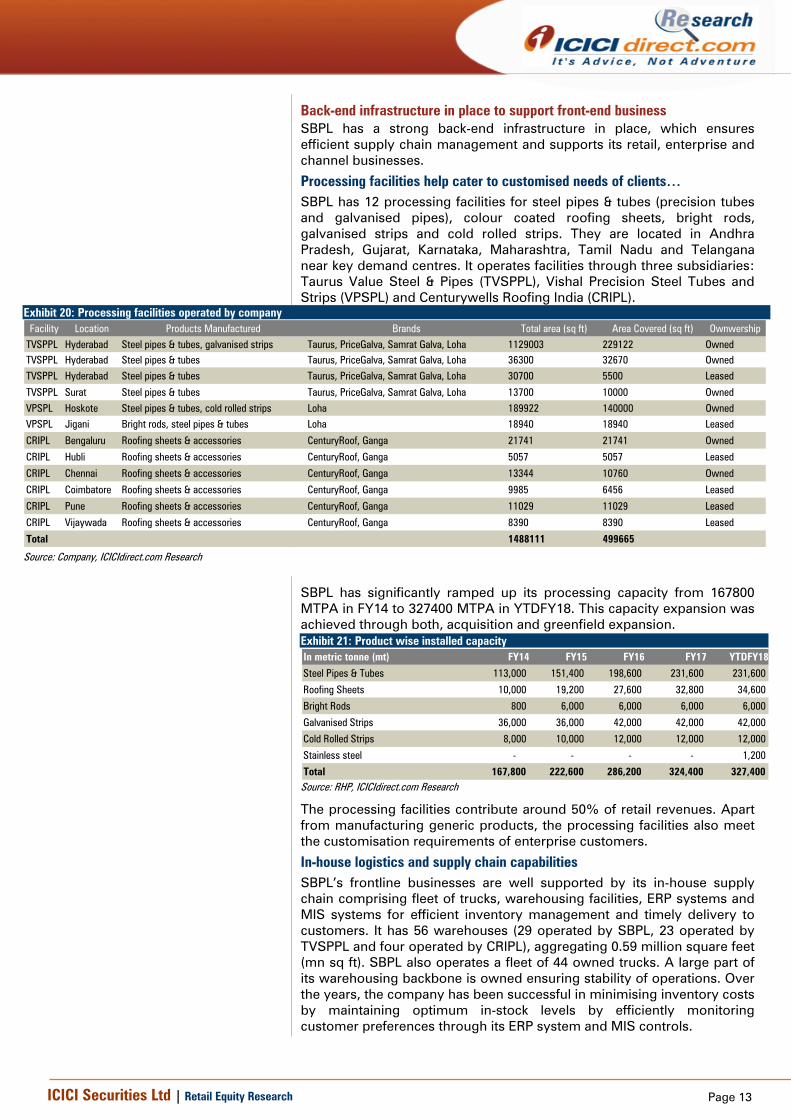
Processing facilities help cater to customised needs of clients… SBPL has 12 processing facilities for steel pipes & tubes (precision tubes and galvanised pipes), colour coated roofing sheets, bright rods, galvanised strips and cold rolled strips. They are located in Andhra Pradesh, Gujarat, Karnataka, Maharashtra, Tamil Nadu and Telangana near key demand centres. It operates facilities through three subsidiaries: Taurus Value Steel & Pipes (TVSPPL), Vishal Precision Steel Tubes and Strips (VPSPL) and Centurywells Roofing India (CRIPL).
Exhibit 20: Processing facilities operated by company Facility Location Products Manufactured Brands Total area (sq ft) Area Covered (sq ft) Ownwership
TVSPPL Hyderabad Steel pipes & tubes, galvanised strips Taurus, PriceGalva, Samrat Galva, Loha 1129003 229122 OwnedTVSPPL Hyderabad Steel pipes & tubes Taurus, PriceGalva, Samrat Galva, Loha 36300 32670 OwnedTVSPPL Hyderabad Steel pipes & tubes Taurus, PriceGalva, Samrat Galva, Loha 30700 5500 Leased
TVSPPL Surat Steel pipes & tubes Taurus, PriceGalva, Samrat Galva, Loha 13700 10000 OwnedVPSPL Hoskote Steel pipes & tubes, cold rolled strips Loha 189922 140000 OwnedVPSPL Jigani Bright rods, steel pipes & tubes Loha 18940 18940 Leased
CRIPL Bengaluru Roofing sheets & accessories CenturyRoof, Ganga 21741 21741 Owned
CRIPL Hubli Roofing sheets & accessories CenturyRoof, Ganga 5057 5057 Leased
CRIPL Chennai Roofing sheets & accessories CenturyRoof, Ganga 13344 10760 Owned
CRIPL Coimbatore Roofing sheets & accessories CenturyRoof, Ganga 9985 6456 Leased
CRIPL Pune Roofing sheets & accessories CenturyRoof, Ganga 11029 11029 Leased
CRIPL Vijaywada Roofing sheets & accessories CenturyRoof, Ganga 8390 8390 Leased
Total 1488111 499665
Source: Company, ICICIdirect.com Research
SBPL has significantly ramped up its processing capacity from 167800 MTPA in FY14 to 327400 MTPA in YTDFY18. This capacity expansion was achieved through both, acquisition and greenfield expansion. Exhibit 21: Product wise installed capacity In metric tonne (mt) FY14 FY15 FY16 FY17 YTDFY18
Steel Pipes & Tubes 113,000 151,400 198,600 231,600 231,600
Roofing Sheets 10,000 19,200 27,600 32,800 34,600
Bright Rods 800 6,000 6,000 6,000 6,000
Galvanised Strips 36,000 36,000 42,000 42,000 42,000
Cold Rolled Strips 8,000 10,000 12,000 12,000 12,000
Stainless steel - - - - 1,200
Total 167,800 222,600 286,200 324,400 327,400 Source: RHP, ICICIdirect.com Research
The processing facilities contribute around 50% of retail revenues. Apart from manufacturing generic products, the processing facilities also meet the customisation requirements of enterprise customers.
In-house logistics and supply chain capabilities SBPL’s frontline businesses are well supported by its in-house supply chain comprising fleet of trucks, warehousing facilities, ERP systems and MIS systems for efficient inventory management and timely delivery to customers. It has 56 warehouses (29 operated by SBPL, 23 operated by TVSPPL and four operated by CRIPL), aggregating 0.59 million square feet (mn sq ft). SBPL also operates a fleet of 44 owned trucks. A large part of its warehousing backbone is owned ensuring stability of operations. Over the years, the company has been successful in minimising inventory costs by maintaining optimum in-stock levels by efficiently monitoring customer preferences through its ERP system and MIS controls.

Page 14ICICI Securities Ltd | Retail Equity Research
Financials Revenues to grow at 13.0% CAGR in FY17-20E… Historically, SBPL’s revenues have grown at a moderate pace of 6.9% CAGR to | 2310.1 crore in FY13-17. The growth was led by strong growth in the retail division at 26.4% CAGR to | 980.7 crore over the same period. Going ahead, given the huge growth prospects of the retail home improvement and building material industry in India, there is a strong potential for the company to further scale up its retail business. The management sensed this opportunity and is planning to increase its retail revenue share sharply from 42.5% in FY17 to ~70% over the next four to five years. Consequently, we expect retail revenues to grow at a sharp pace of 27.1% CAGR to | 2013.3 crore in FY17-20E. However, with a sharp de-growth in channel division revenues (10% CAGR de-growth) and moderate growth in enterprise sales (5.9% CAGR), we expect SBPL’s revenues to grow at 13.0% CAGR to | 3331.2 crore in FY17-20E.
Exhibit 22: Segmental revenue trend…
388.6
462.5
613.4
814.4
980.7
1187.7
1569.4
2013.3
618.3
713.0
692.6
651.5
759.6
759.6
820.3
902.4
759.6
751.6
672.8
570.1
569.9
512.9
461.6
415.5
0.0 700.0 1400.0 2100.0 2800.0 3500.0
FY13
FY14
FY15
FY16
FY17
FY18
FY19
FY20
(| crore)
Retail
Enterprise
Channel
Source: Company, ICICIdirect.com Research
Exhibit 23: Overall revenues trend…
1766.61927.1 1978.8 2035.9
2310.12460.1
2851.4
3331.225.0%
9.1%
2.7% 2.9%
13.5%
6.5%
15.9% 16.8%
0%
10%
20%
30%
1000
2000
3000
4000
FY13 FY14 FY15 FY16 FY17 FY18E FY19E FY20E
(| c
rore
)
Net Sales y-o-y growth rate
6.9% CAGR
13.0% CAGR
Source: Company, ICICIdirect.com Research
We expect SBPL’s revenues to grow at a CAGR of 13.0%
to | 3331.2 crore in FY17-20E

Page 15ICICI Securities Ltd | Retail Equity Research
EBITDA margin to expand 120 bps by FY20E… Traditionally, EBITDA margins have remained in the range of ~4-5% on account of higher share of revenues from the low margin channel and enterprise divisions. Over the past few years, retail division margins have expanded 270 bps from 4.7% to 7.4% led by aggressive store expansion, increased product basket with increased share of decorative products and increasing footfall at its stores. Consequently, with a rise in retail revenue share, SBPL’s blended margins have expanded from 4.5% in FY15 to 6.7% in FY17.
Exhibit 24: Segmental EBITDA margin trend…
3.4%
4.7%
7.4%
9.6%
9.9%
10.1
%
10.3
%
10.5
%
5.4%
4.6%
3.1%
3.4%
4.3%
4.0%
4.0%
4.0%
0.0%
3.0%
6.0%
9.0%
12.0%
FY13 FY14 FY15 FY16 FY17 FY18E FY19E FY20E
Retail division Enterprise & Channel division
Source: Company, ICICIdirect.com Research
With the company planning to further increase its high margin retail revenue share, we expect overall EBITDA margins to expand 120 bps to 7.9% by FY20E.
Exhibit 25: Overall EBITDA margin trend…
86.9
88.6
89.5
119.
6
154.
4
170.
8
212.
3
263.
8
4.94.6 4.5
5.9
6.7 6.97.4
7.9
3.0
5.0
7.0
9.0
0.0
100.0
200.0
300.0
FY13 FY14 FY15 FY16 FY17 FY18E FY19E FY20E
(%)
(| c
rore
)
EBITDA EBITDA Margin
Source: Company, ICICIdirect.com Research
We expect a 120 bps expansion in margin to 7.9% over
FY17-20E led by increasing share of high margin retail
business

Page 16ICICI Securities Ltd | Retail Equity Research
PAT to grow robustly at 33.3% CAGR in FY17-20E…
Historically, the bottomline has grown at 17.3% CAGR from | 31.9 crore in FY13 to | 60.3 crore in FY17 primarily led by expansion in EBITDA margins on the back of higher contribution from the high margin retail division. The retail division revenue share almost doubled from 22.0% in FY13 to 42.5% in FY17. With strong growth prospects of its retail business, the company expects to increase retail revenue share to ~70% over the next four to five years. We anticipate retail revenue share will increase to 60.4% in FY20E. Consequently, with increased retail presence and EBITDA margin expansion, we expect SBPL to post a robust bottomline growth of 33.3% CAGR to | 142.9 crore over FY17-20E.
Exhibit 26: PAT trend…
31.9 28.7 22.6 40.7 60.3 76.2 106.3 142.9
1.8% 1.5%1.1% 2.0%
2.6%
3.1%
3.7%4.3%
0.5%
1.5%
2.5%
3.5%
4.5%
5.5%
0.0
30.0
60.0
90.0
120.0
150.0
FY13 FY14 FY15 FY16 FY17 FY18E FY19E FY20E
(| c
rore
)
PAT PAT Margin(%)
17.3% CAGR
33.3% CAGR
Source: Company, ICICIdirect.com Research
Return ratios to expand… Return ratios were subdued during FY13-15 with RoCE of 14.8% in FY15. However, a significant rise in retail revenue share resulted in superior return ratios in FY15-17 with RoCE of 22.9% in FY17. The management indicated the retail business generates RoCEs in the range of ~30-40% given the low capex intensive nature of the business and higher EBITDA margins. Going ahead, we expect its RoE & RoCE to expand to 21.3% & 29.7%, respectively, by FY20E driven by higher retail share.
Exhibit 27: Return ratios trend…
15.912.3
8.9
14.0 15.3 16.619.4
21.317.3 16.1 14.9
21.4 22.9 23.026.6
29.7
17.3 16.0 14.8
21.325.5 25.4
28.832.2
5.0
15.0
25.0
35.0
FY13 FY14 FY15 FY16 FY17 FY18E FY19E FY20E
(%)
RoE RoCE RoIC
Source: Company, ICICIdirect.com Research
We expect the bottomline to grow robustly at 33.3% CAGR
in FY17-20E on the back of moderate topline growth and
stable margins

Page 17ICICI Securities Ltd | Retail Equity Research
Risks & Concerns Risk associated with trained sales staff at retail stores… Currently, share of new products such as decorative and finishing products like plywood, tiles, laminates, sanitaryware, etc, is at ~10% and are available only in few new stores. SBPL plans to increase the share of these products to 25% and upgrade the existing 96 old stores over the next few years. As a result, it could face challenges in training staff at the retail store level to guide customers purchasing decisions through creating awareness of various products and their applications.
Possibility of inventory loss at retail stores… SBPL has a comprehensive range of 75+ products of 100+ brands and a product portfolio comprising 20000+ stock keeping units (SKUs). However, with a huge SKU size, in case some products become obsolete or its sales are impacted significantly, then the company may have to book inventory losses on its books, which could impact its financials.
Identifying right location with lower lease rate for new stores is critical… The company plans to expand its retail footprint by aggressively expanding its store network by almost doubling its store network from 116 to 200 stores over the next four to five years. We have also factored it in our estimates and expect its store network to increase to 161 stores by FY20E from 106 stores in FY17. We have considered average revenue per store of | 10 crore. To achieve sales of this magnitude, identifying stores at the right location with lower rental rate would be critical for future expansion.
Any disruption through e-commerce model in future… SBPL’s retail model is a brick-and-mortar model, which the company wishes to expand aggressively over the next few years. However, a shift in consumer preference from visiting retail stores to purchasing building materials online could pose a huge threat to SBPL’s business strategy and company’s financials in future.
Any disruption in logistics or supply chain network… SBPL’s supply chain and logistics network is focused around 56 warehouses, which act as storage facilities for timely delivery of merchandise to all stores. Any material disruption at these warehouses for any reason may damage the products stored and adversely impact the supply chain network and logistics operations, thereby impacting operations. Any disruption in logistics may adversely impact the ability to deliver inventory in a timely manner. In turn, this may impair the ability to meet customer demand for products and result in lost sales, increased supply chain costs or damage to the reputation.

Page 18ICICI Securities Ltd | Retail Equity Research
Valuation With SBPL’s focus on expanding its business in asset light retail store business, we believe the company is in a sweet spot to capture the growing organised home improvement market. We expect earnings to grow at a CAGR of 33.3%. Furthermore, we anticipate SBPL’s RoCE ratio will improve 680 bps at 29.7% in FY17-20E. Hence, we initiate coverage on SBPL with a BUY recommendation and an SOTP based target price of | 1725/share. Retail business SBPL’s revenues are expected to grow at 27.1% CAGR at | 2013.3 crore in FY17-20E. Its share in total revenues is expected to improve from 42.5% to 60.4%. Importantly, growth in the retail business is expected to be achieved on an asset light model as SBPL enters into a long term lease agreement (average lease rate: | 16.6 per sq ft month). Hence, we value SBPL’s retail business at 16x FY20 EV/ EBIT (at 33% discount to global leader such as Home Depot when it was in growth phase).
Exhibit 28: Valuation Business Method Multiple Basis Valuation |/share
Retail EV/EBIT 16.0 FY20 3548.0 1553
Channel & Enterprise EV/EBIT 6.0 FY20 475.2 208
Less: Net Debt -86.7 -38
Target Valuation 3936.5 1723
Rounded off target price 1725
Source: Company, ICICIdirect.com Research
Though SBPL is a very small player compared to its global peer such as Home Depot, we have tried to link our target multiple when Home Depot was in the growth phase. The exhibit below depicts the details about their growth phase. When Home Depot was in a growth phase for two decades during FY88-07, it commanded EV/EBIT multiple of ~23x-25x. With huge macro opportunities, asset light business model in the retail business and healthy growth profile, we believe SBPL should command 16x EV/EBIT (we assign ~33% discount due to humungous size of Home Depot).
Exhibit 29: Home Depot metrics… Phase Mature Phase Mature
FY88-FY97 FY98-FY07 FY08-FY17 FY88-FY97 FY98-FY07 FY08-FY17
Financial Matrix Valuation matrix (x)*
Revenues ($ in million) EV/Revenues (x) 1.9 2.1 1.2
Beginning period 1453.0 24156.0 77349.0 EV/EBIT (x) 25.6 22.5 12.2
Ending period 19535.5 79022.0 94595.0 PE (x) 34.2 32.6 18.2
CAGR (%) 33.5 14.1 2.3 Operating matrix(x)
Number of Stores
Avg EBITDA margin (%) 8.4 11.3 12.2 Beginning period 75.0 624.0 2234.0
Ending period 512.0 2147.0 2278.0
PAT ($ in million) CAGR (%) 23.8 14.7 0.2
Beginning of period 54.1 1160.0 5639.0 Average Same Store growth period 10.5 4.6 0.4
Ending period 937.7 5761.0 8675.0 Average Retail sales per sq ft ($) 362.4 463.6 324.7
CAGR (%) 37.3 19.5 4.9 CAGR(%) 3.9 -0.3 0.4
Average Sales per customer 37.8 50.2 55.7
Avg RoCE(%) 16.1 18.4 16.1 CAGR(%) 3.8 2.8 0.0
Growth Growth
Source: Bloomberg, ICICIdirect.com Research *: on TTM basis
We initiate coverage on SBPL with a BUY
recommendation and a target price of | 1725/share

Page 19ICICI Securities Ltd | Retail Equity Research
Exhibit 30: Global peers in home improvement industry… FY17 P/E P/BV EV/EBITDA
Market Cap (US$ bn)
Revenue (US$ bn) Revenue PAT FY17 FY18E FY19E FY18E FY19E FY18E FY19E
Home Depot 185 94.6 5.4 9.2 30.9 20.5 18.1 70.1 152.2 11.9 11.0
Lowes 65 65 4.6 9.2 16.4 16.3 14.3 11.4 11.8 9.3 8.7
Floor & Décor Holdings 3.6 1.3 20.6 23.3 10.5 48.4 40.7 7.2 5.0 19.2 15.9
Average 84.5 53.6 10.2 13.9 19.3 28.4 24.4 29.6 56.3 13.5 11.9
FY17-19E CAGR
Global Home Improvement Industry
Source: Bloomberg, ICICIdirect.com Research
Channel & Enterprise business: SBPL’s enterprise division revenues are expected to grow at a CAGR of 5.9% at | 902.4 crore in FY17-20E as the company plans to expand its retail share. Further, the management has taken a conscious decision to ramp down its low margin channel division. Consequently, its revenues are expected to decline sharply from | 569.9 crore in FY17 to | 415.5 crore in FY20E. Hence, we value SBPL’s Channel and Enterprise business at 6x FY20E EV/EBIT at ~| 208/share.
Comparison with other building material segments
There is no like-to-like peer comparison for SBPL. However, we have tried to compare SBPL with some tiles, paints and wooden industry organised players.
Exhibit 31: Valuation matrix with other building material segments
RoCE P/E P/BV EV/EBITDAMarket Cap
(| crore)Revenue
(FY17) Revenue PAT FY18E FY19E FY18E FY19E FY18E FY19E FY18E FY19E
SBPL 3,277 2310.1 11.1 32.8 23.0 26.6 43.0 30.8 7.1 6.0 20.0 16.0
Greenply 3203 1654.9 13.0 12.2 14.6 13.7 21.4 18.8 3.5 3.0 14.3 12.2
Centuryply 6039 1782.5 22.2 21.2 19 23.4 29.8 21.2 6.9 5.6 19.5 14.5
Greenlam 2269 1075.9 13.5 36.1 20.9 25.7 31.9 23.8 6.2 5.0 13.9 11.5
Average 3837 1504.4 16.2 23.2 18.2 20.9 27.7 21.3 5.5 4.5 15.9 12.7
Kajaria 11211 2549.6 21.9 16.9 24.1 27.3 37.4 28.4 7.1 6.0 19.9 15.9
Somany 3392 1811.0 9.8 22.3 20.0 22.6 31.7 24.1 5.6 4.8 16.5 13.3
HSIL 2749 2078.2 14.7 27.0 6.4 7.9 22.7 17.3 1.9 1.8 10.1 8.4
Average 5784 2146.3 15.5 22.1 16.8 19.3 30.6 23.3 4.9 4.2 15.5 12.5
Asian Paints 110500 17223.1 15.0 12.0 34.4 36.1 51.3 42.9 12.8 11.1 35 28.7
Kansai Nerolac 24144 3999.1 15.0 14.0 28.1 28.1 41.5 36.5 8.1 7.1 28.8 24.9
Average 67322 10611.1 15.0 13.0 31.3 32.1 46.4 39.7 10.5 9.1 31.9 26.8
Overall Average 20055 4143.0 14.4 22.8 22.3 24.7 36.9 28.8 7.0 5.9 20.8 17.0
Home improvement industry
Wood Industry
Tiles Industry
Paints Industry
FY17-19E CAGR
Source: Bloomberg, ICICIdirect.com Research

Page 20ICICI Securities Ltd | Retail Equity Research
SBPL has traded at an average PE multiple of 25.8x since its listing in April, 2017. Currently, it is trading at 22.8x FY20E EPS. Our target price implies 27.6x FY20E EPS and PEG ratio of ~0.8x (SBPL’s earning are expected to grow at 33.3% CAGR in FY17-20E).
Exhibit 32: One year forward PE
300
600
900
1,200
1,500
Apr
-17
May
-17
Jun-
17
Jul-1
7
Aug
-17
Sep-
17
|
Price 40x 35x 30x 25x 20x
Source: Company, ICICIdirect.com Research
In terms of EV/EBTDA multiple, SBPL has traded at average EV/EBITDA of 12.2x since its listing in April, 2017. Currently, it is trading at 11.3x FY20E EV/EBITDA. Our target price implies target EV/EBITDA of 15.3x FY20E.
Exhibit 33: One year forward EV/EBITDA band
1,000
1,500
2,000
2,500
3,000
3,500
Apr
-17
May
-17
Jun-
17
Jul-1
7
Aug
-17
Sep-
17
EV (|
cro
re)
EV 18x 15x 12x 9x
Source: Company, ICICIdirect.com Research
Exhibit 34: Average one year forward EV/EBITDA multiple
6
9
12
15
18
Apr
-17
May
-17
Jun-
17
Jul-1
7
Aug
-17
Sep-
17
(x)
EV/EBITDA Average 1+ STD 1- STD
Source: Company, ICICIdirect.com Research

Page 21ICICI Securities Ltd | Retail Equity Research
Tables
Exhibit 35: Profit & loss account (| Crore) FY15 FY16 FY17 FY18E FY19E FY20ENet Sales 1,978.8 2,035.9 2,310.1 2,460.1 2,851.4 3,331.2
Net Raw Material Cost 1,758.0 1,767.2 1,979.4 2,101.8 2,428.9 2,829.2 Employee benefit expenses 35.0 41.3 49.4 59.3 71.1 81.8 Power & Fuel 9.6 11.1 13.3 14.2 16.5 19.2 Consumption of stores and spares 35.6 38.3 42.2 45.0 52.1 60.9 EBITDA 89.5 119.6 154.4 170.8 212.3 263.8 Interest 47.0 46.0 50.8 45.0 40.4 36.0 Depreciation 8.8 9.5 11.4 12.5 13.6 14.9 Other income 0.8 0.7 0.3 0.3 0.4 0.4 PBT 34.6 64.8 92.5 113.7 158.6 213.3 Taxes 12.0 24.0 32.2 37.5 52.3 70.4 Effective tax rate (%) 34.6% 37.1% 34.8% 33.0% 33.0% 33.0%PAT 22.6 40.7 60.3 76.2 106.3 142.9 PAT Growth rate 80.3% 48.0% 26.3% 39.5% 34.4%Adjusted EPS (Diluted) 10.3 18.6 26.4 33.3 46.5 62.5
Source: Company, ICICIdirect.com Research
Exhibit 36: Balance sheet (| Crore) FY15 FY16 FY17 FY18E FY19E FY20ELiabilitiesEquity Capital 21.9 21.9 22.9 22.9 22.9 22.9 Reserve and Surplus 231.4 269.1 370.8 435.6 525.9 647.4 Total Shareholders funds 253.3 290.9 393.7 458.4 548.8 670.2 Total Debt 285.4 213.5 216.0 215.0 184.0 153.0 Total Liabilities 549.1 518.2 626.7 689.8 749.1 839.6 AssetsGross Block 226.6 264.7 300.5 330.0 358.5 391.8 Less Acc. Dep 36.0 45.4 55.5 68.0 81.6 96.5 Net Block 190.6 219.3 245.0 262.0 276.9 295.3 Goodwill on consolidation 14.0 14.0 14.0 14.0 14.0 14.0 Total Fixed Assets 219.5 248.3 277.1 298.9 320.0 345.7 Investments 2.5 2.3 4.2 4.5 5.2 6.0 Inventory 232.1 255.9 279.5 297.6 344.9 403.0 Sundry Debtors 259.8 281.0 312.3 355.1 411.6 480.9 Loans & Advances 12.3 12.7 13.9 18.5 23.9 30.3 Cash & Bank Balances 2.4 2.4 66.2 66.9 58.7 66.3 Other Current Assets 0.0 0.1 0.1 0.1 0.1 0.1 Total Current Assets 505.8 550.8 671.0 734.4 832.3 970.2 Trade Payable 138.1 233.8 261.0 278.0 322.2 376.4 Other Current Liabilities 28.6 31.9 41.8 44.5 51.5 60.2 Provisions 9.6 15.3 18.6 21.2 29.5 39.7 Net Current Assets 329.6 269.9 349.6 390.8 429.1 493.9 Total Assets 549.1 518.2 626.7 689.8 749.1 839.6
Source: Company, ICICIdirect.com Research

Page 22ICICI Securities Ltd | Retail Equity Research
Exhibit 37: Cash flow statement (| Crore) FY15 FY16 FY17 FY18E FY19E FY20EProfit after Tax 22.6 40.7 60.3 76.2 106.3 142.9 Depreciation 8.8 9.5 11.4 12.5 13.6 14.9 Interest 46.6 44.9 49.7 45.0 40.4 36.0 Taxes 12.0 24.0 32.2 37.5 52.3 70.4 Cash Flow before wc changes 90.4 119.8 154.0 170.8 212.3 263.8 Cash generated from operations (3.9) 51.7 (23.9) (46.1) (52.7) (64.4) Income Tax paid (6.9) (12.0) (23.6) (37.5) (52.3) (70.4) Net CF from operating activities 79.6 159.5 106.5 87.3 107.2 129.0 (Purchase)/Sale of Fixed Assets (Net) (41.5) (38.2) (37.4) (29.5) (28.5) (33.3) Others 2.0 0.3 0.4 0.3 0.4 0.4 Net CF from Investing activities (39.5) (37.9) (37.0) (29.2) (28.2) (32.9) Dividend (2.5) (5.9) (0.7) (11.4) (15.9) (21.4) Interest paid (47.1) (45.0) (48.3) (45.0) (40.4) (36.0) Inc / (Dec) in Loans 9.3 (70.7) 0.9 (1.0) (31.0) (31.0) Net CF from Financing activities (40.3) (121.6) (68.8) (57.4) (87.3) (88.4) Net Cash flow (0.3) 0.0 0.8 0.7 (8.2) 7.6 Opening Cash 25.9 23.3 23.7 66.2 66.9 58.7 Closing Cash/ Cash Equivalent 23.3 23.7 24.5 66.9 58.7 66.3
Source: Company, ICICIdirect.com Research
Exhibit 38: Ratio Analysis
FY15 FY16 FY17 FY18E FY19E FY20EPer Share Data (|)EPS - Diluted 10.3 18.6 26.4 33.3 46.5 62.5 Cash EPS 14.4 23.0 31.4 38.8 52.5 69.0 Book Value 115.8 133.0 172.3 200.6 240.2 293.3 Dividend per share 4.0 4.0 4.3 4.7 5.4 7.7 Operating Ratios (%)EBITDA / Net Sales 4.5 5.9 6.7 6.9 7.4 7.9 PAT / Net Sales 1.1 2.0 2.6 3.1 3.7 4.3 Inventory Days 42.8 45.9 44.2 44.2 44.2 44.2 Debtor Days 47.9 50.4 49.3 52.7 52.7 52.7 Creditor Days 25.5 41.9 41.2 41.2 41.2 41.2 Return Ratios (%)RoE 8.9 14.0 15.3 16.6 19.4 21.3 RoCE 14.9 21.4 22.9 23.0 26.6 29.7 RoIC 14.8 21.3 25.5 25.4 28.8 32.2 Valuation Ratios (x)EV / EBITDA 39.8 29.2 22.2 20.0 16.0 12.8 P/E (Diluted) 138.8 77.0 54.3 43.0 30.8 22.9 EV / Net Sales 1.8 1.7 1.5 1.4 1.2 1.0 Market Cap / Sales 1.7 1.6 1.4 1.3 1.1 1.0 Price to Book Value 12.4 10.8 8.3 7.1 6.0 4.9 Dividend Yield 0.3 0.3 0.3 0.3 0.4 0.5 Solvency Ratios (x)Net Debt / Equity 1.1 0.7 0.4 0.3 0.2 0.1 Debt / EBITDA 3.2 1.8 1.4 1.3 0.9 0.6 Current Ratio 2.9 2.0 1.9 1.9 1.9 1.9 Quick Ratio 1.5 1.0 1.0 1.1 1.1 1.1
Source: Company, ICICIdirect.com Research

Page 23ICICI Securities Ltd | Retail Equity Research
RATING RATIONALE ICICIdirect.com endeavours to provide objective opinions and recommendations. ICICIdirect.com assigns ratings to its stocks according to their notional target price vs. current market price and then categorises them as Strong Buy, Buy, Hold and Sell. The performance horizon is two years unless specified and the notional target price is defined as the analysts' valuation for a stock. Strong Buy: >15%/20% for large caps/midcaps, respectively, with high conviction; Buy: >10%/15% for large caps/midcaps, respectively; Hold: Up to +/-10%; Sell: -10% or more;
Pankaj Pandey Head – Research [email protected]
ICICIdirect.com Research Desk, ICICI Securities Limited, 1st Floor, Akruti Trade Centre, Road No 7, MIDC, Andheri (East) Mumbai – 400 093

Page 24ICICI Securities Ltd | Retail Equity Research
ANALYST CERTIFICATION We /I, Deepak Purswani, CFA MBA (Finance) and Vaibhav Shah, MBA (Finance) Research Analysts, authors and the names subscribed to this report, hereby certify that all of the views expressed in this research report accurately reflect our views about the subject issuer(s) or securities. We also certify that no part of our compensation was, is, or will be directly or indirectly related to the specific recommendation(s) or view(s) in this report. Terms & conditions and other disclosures: ICICI Securities Limited (ICICI Securities) is a full-service, integrated investment banking and is, inter alia, engaged in the business of stock brokering and distribution of financial products. ICICI Securities Limited is a Sebi registered Research Analyst with Sebi Registration Number – INH000000990. ICICI Securities is a wholly-owned subsidiary of ICICI Bank which is India’s largest private sector bank and has its various subsidiaries engaged in businesses of housing finance, asset management, life insurance, general insurance, venture capital fund management, etc. (“associates”), the details in respect of which are available on www.icicibank.com. ICICI Securities is one of the leading merchant bankers/ underwriters of securities and participate in virtually all securities trading markets in India. We and our associates might have investment banking and other business relationship with a significant percentage of companies covered by our Investment Research Department. ICICI Securities generally prohibits its analysts, persons reporting to analysts and their relatives from maintaining a financial interest in the securities or derivatives of any companies that the analysts cover. The information and opinions in this report have been prepared by ICICI Securities and are subject to change without any notice. The report and information contained herein is strictly confidential and meant solely for the selected recipient and may not be altered in any way, transmitted to, copied or distributed, in part or in whole, to any other person or to the media or reproduced in any form, without prior written consent of ICICI Securities. While we would endeavour to update the information herein on a reasonable basis, ICICI Securities is under no obligation to update or keep the information current. Also, there may be regulatory, compliance or other reasons that may prevent ICICI Securities from doing so. Non-rated securities indicate that rating on a particular security has been suspended temporarily and such suspension is in compliance with applicable regulations and/or ICICI Securities policies, in circumstances where ICICI Securities might be acting in an advisory capacity to this company, or in certain other circumstances. This report is based on information obtained from public sources and sources believed to be reliable, but no independent verification has been made nor is its accuracy or completeness guaranteed. This report and information herein is solely for informational purpose and shall not be used or considered as an offer document or solicitation of offer to buy or sell or subscribe for securities or other financial instruments. Though disseminated to all the customers simultaneously, not all customers may receive this report at the same time. ICICI Securities will not treat recipients as customers by virtue of their receiving Deepak Purswani, CFA MBA (Finance) and Vaibhav Shah, MBA (Finance) this report. Nothing in this report constitutes investment, legal, accounting and tax advice or a representation that any investment or strategy is suitable or appropriate to your specific circumstances. The securities discussed and opinions expressed in this report may not be suitable for all investors, who must make their own investment decisions, based on their own investment objectives, financial positions and needs of specific recipient. This may not be taken in substitution for the exercise of independent judgment by any recipient. The recipient should independently evaluate the investment risks. The value and return on investment may vary because of changes in interest rates, foreign exchange rates or any other reason. ICICI Securities accepts no liabilities whatsoever for any loss or damage of any kind arising out of the use of this report. Past performance is not necessarily a guide to future performance. Investors are advised to see Risk Disclosure Document to understand the risks associated before investing in the securities markets. Actual results may differ materially from those set forth in projections. Forward-looking statements are not predictions and may be subject to change without notice. ICICI Securities or its associates might have managed or co-managed public offering of securities for the subject company or might have been mandated by the subject company for any other assignment in the past twelve months. ICICI Securities or its associates might have received any compensation from the companies mentioned in the report during the period preceding twelve months from the date of this report for services in respect of managing or co-managing public offerings, corporate finance, investment banking or merchant banking, brokerage services or other advisory service in a merger or specific transaction. ICICI Securities or its associates might have received any compensation for products or services other than investment banking or merchant banking or brokerage services from the companies mentioned in the report in the past twelve months. ICICI Securities encourages independence in research report preparation and strives to minimize conflict in preparation of research report. ICICI Securities or its associates or its analysts did not receive any compensation or other benefits from the companies mentioned in the report or third party in connection with preparation of the research report. Accordingly, neither ICICI Securities nor Research Analysts and their relatives have any material conflict of interest at the time of publication of this report. It is confirmed that Deepak Purswani, CFA MBA (Finance) and Vaibhav Shah, MBA (Finance) Research Analysts of this report have not received any compensation from the companies mentioned in the report in the preceding twelve months. Compensation of our Research Analysts is not based on any specific merchant banking, investment banking or brokerage service transactions. ICICI Securities or its subsidiaries collectively or Research Analysts or their relatives do not own 1% or more of the equity securities of the Company mentioned in the report as of the last day of the month preceding the publication of the research report. Since associates of ICICI Securities are engaged in various financial service businesses, they might have financial interests or beneficial ownership in various companies including the subject company/companies mentioned in this report. It is confirmed that Deepak Purswani, CFA MBA (Finance) and Vaibhav Shah, MBA (Finance), Research Analysts do not serve as an officer, director or employee of the companies mentioned in the report. ICICI Securities may have issued other reports that are inconsistent with and reach different conclusion from the information presented in this report. Neither the Research Analysts nor ICICI Securities have been engaged in market making activity for the companies mentioned in the report. We submit that no material disciplinary action has been taken on ICICI Securities by any Regulatory Authority impacting Equity Research Analysis activities. This report is not directed or intended for distribution to, or use by, any person or entity who is a citizen or resident of or located in any locality, state, country or other jurisdiction, where such distribution, publication, availability or use would be contrary to law, regulation or which would subject ICICI Securities and affiliates to any registration or licensing requirement within such jurisdiction. The securities described herein may or may not be eligible for sale in all jurisdictions or to certain category of investors. Persons in whose possession this document may come are required to inform themselves of and to observe such restriction. This report is not directed or intended for distribution to, or use by, any person or entity who is a citizen or resident of or located in any locality, state, country or other jurisdiction, where such distribution, publication, availability or use would be contrary to law, regulation or which would subject ICICI Securities and affiliates to any registration or licensing requirement within such jurisdiction. The securities described herein may or may not be eligible for sale in all jurisdictions or to certain category of investors. Persons in whose possession this document may come are required to inform themselves of and to observe such restriction.