March 14, 2014 Rating Matrix Hindalco...
24
March 14, 2014 Initiating Coverage ICICI Securities Ltd | Retail Equity Research Production at inflection point... Hindalco (Aditya Birla Group) is a metal major with business interests in copper smelting & aluminium manufacturing domestically. It is also a leading aluminium converter globally through subsidiary Novelis. On the domestic aluminium business front, the company is undergoing an ambitious capacity expansion wherein its aluminium (primary metal) production capacity will increase from 560 KT currently to 1278 KT by FY15E. The planned capacity expansion is backed by corresponding alumina refinery with captive bauxite linkage. With trial runs & commissioning at an advanced stage, we expect domestic aluminium metal production to grow at 11.2% CAGR in FY13-16E. On a consolidated basis, the topline and EBITDA are poised to grow at a CAGR of 6.5% and 8.8%, respectively, in FY13-16E. However, high debt on its books (gross debt FY13: | 56,906 crore) continues to weigh on the valuation front (core business quoting at 7.1x FY16E EV/EBITDA). We initiate coverage on Hindalco with a HOLD rating & a target price of | 108. Novelis: Stable performance; improving product mix to aid EBITDA margins!! Novelis is one of the world’s leading aluminium rolling and recycling companies supplying premium products in the markets of North America, Europe, Asia and South America. The company is the largest single producer of aluminium rolled products with an estimated share of 14% of the world’s supply. Novelis’ sales volumes are expected to grow at a CAGR of 5.7% in FY13-16E. On the back of increasing share of the automobile segment in the overall sales mix, we expect the EBITDA/tonne to improve from US$336/tonne in FY13 to US$360/tonne by FY16E. Mahan Smelter: ramp up progressing well; Aditya: first metal tapped The company has commissioned the Mahan aluminium smelter (capacity 359 KT, 900 MW) with first metal tapped in Q1FY14 and is ramping up the same for commercial production. The company has also tapped first metal at its Aditya smelter (capacity 359 KT, 900 MW). However, commercial production from this smelter is expected only in H2FY15. To feed the abovementioned smelters, Hindalco has also commissioned its Utkal alumina refinery (capacity 1.5 MTPA) and is ramping up the same. Mahan coal block - still distant; high debt weighs!! The company has received stage-2 forest clearance for its Mahan coal block subject to certain conditions. The next important step would be signing of liming lease with the state government and subsequent mine development, which is likely to take ~18-24 months. High debt on the books continues to weigh on valuations (core business quoting at 7.1x FY16E EV/EBITDA) though the same is expected to decline from FY16E onwards. We have valued the company on an SOTP basis, thereby arriving at a target price of | 108. We initiate coverage with HOLD rating. Exhibit 1: Key financials (Year-end March) FY12 FY13 FY14E FY15E FY16E Net Sales (| crore) 80,368.9 79,674.9 85,924.6 88,964.6 96,330.6 EBITDA (| crore) 8,184.0 7,836.8 7,638.3 8,877.8 10,096.3 Net Profit (| crore) 3,397.0 3,026.9 2,121.1 1,758.6 2,020.3 EPS (|) 17.7 15.8 10.3 8.5 9.8 P/E 6.4 7.2 11.1 13.4 11.7 P/B 0.7 0.6 0.6 0.6 0.5 EV/EBITDA 6.9 8.9 9.4 8.1 7.1 RoCE (%) 7.1 5.3 4.2 4.4 5.2 RoE (%) 10.6 8.6 5.3 4.3 4.7 Source: Company, ICICIdirect.com Research Hindalco Industries(HINDAL) | 115 Rating Matrix Rating : Hold Target : | 108 Target Period : 12-18 months Potential Upside : -6% YoY Growth (YoY Growth) FY13 FY14E FY15E FY16E Net Sales (0.9) 7.8 3.5 8.3 EBITDA (4.2) (2.5) 16.2 13.7 Net Profit (10.9) (29.9) (17.1) 14.9 EPS (|) (10.9) (35.0) (17.1) 14.9 Current & target multiple FY13 FY14E FY15E FY16E P/E (Diluted) 7.8 11.1 13.4 11.7 EV / Net Sales 0.9 0.8 0.8 0.7 EV / EBITDA 8.9 9.4 8.1 7.1 P/BV 0.6 0.6 0.6 0.5 RoNW 8.6 5.3 4.3 4.7 RoCE 5.3 4.2 4.4 5.2 Stock Data Bloomberg/Reuters Code HNDL IN / HALC.IN Sensex 21,720.0 Average volumes 8,690,362 Market Cap (| crore) 23,745.2 52 week H/L 137 / 83 Equity Capital (| crore) 206.5 Face value | 1 Promoter's Stake (%) 37.0 FII Holding (%) 26.9 DII Holding (%) 13.3 Price movement 0 20 40 60 80 100 120 140 Mar-14 Dec-13 Sep-13 Jun-13 Mar-13 2,000 3,000 4,000 5,000 6,000 7,000 Price (R.H.S) Nifty (L.H.S) Comparative return matrix (%) Return % 1M 3M 6M 12M Hindalco 15.4 (2.6) 3.0 20.7 Nalco 8.1 (6.5) 6.2 (24.0) Sesa-Sterlite (8.4) (9.9) (6.0) 5.7 Analyst’s name Dewang Sanghavi [email protected] Shashank Kanodia [email protected]
Transcript of March 14, 2014 Rating Matrix Hindalco...
March 14, 2014
Initiating Coverage
ICICI Securities Ltd | Retail Equity Research
Production at inflection point... Hindalco (Aditya Birla Group) is a metal major with business interests in copper smelting & aluminium manufacturing domestically. It is also a leading aluminium converter globally through subsidiary Novelis. On the domestic aluminium business front, the company is undergoing an ambitious capacity expansion wherein its aluminium (primary metal) production capacity will increase from 560 KT currently to 1278 KT by FY15E. The planned capacity expansion is backed by corresponding alumina refinery with captive bauxite linkage. With trial runs & commissioning at an advanced stage, we expect domestic aluminium metal production to grow at 11.2% CAGR in FY13-16E. On a consolidated basis, the topline and EBITDA are poised to grow at a CAGR of 6.5% and 8.8%, respectively, in FY13-16E. However, high debt on its books (gross debt FY13: | 56,906 crore) continues to weigh on the valuation front (core business quoting at 7.1x FY16E EV/EBITDA). We initiate coverage on Hindalco with a HOLD rating & a target price of | 108. Novelis: Stable performance; improving product mix to aid EBITDA margins!! Novelis is one of the world’s leading aluminium rolling and recycling companies supplying premium products in the markets of North America, Europe, Asia and South America. The company is the largest single producer of aluminium rolled products with an estimated share of 14% of the world’s supply. Novelis’ sales volumes are expected to grow at a CAGR of 5.7% in FY13-16E. On the back of increasing share of the automobile segment in the overall sales mix, we expect the EBITDA/tonne to improve from US$336/tonne in FY13 to US$360/tonne by FY16E. Mahan Smelter: ramp up progressing well; Aditya: first metal tapped The company has commissioned the Mahan aluminium smelter (capacity 359 KT, 900 MW) with first metal tapped in Q1FY14 and is ramping up the same for commercial production. The company has also tapped first metal at its Aditya smelter (capacity 359 KT, 900 MW). However, commercial production from this smelter is expected only in H2FY15. To feed the abovementioned smelters, Hindalco has also commissioned its Utkal alumina refinery (capacity 1.5 MTPA) and is ramping up the same. Mahan coal block - still distant; high debt weighs!! The company has received stage-2 forest clearance for its Mahan coal block subject to certain conditions. The next important step would be signing of liming lease with the state government and subsequent mine development, which is likely to take ~18-24 months. High debt on the books continues to weigh on valuations (core business quoting at 7.1x FY16E EV/EBITDA) though the same is expected to decline from FY16E onwards. We have valued the company on an SOTP basis, thereby arriving at a target price of | 108. We initiate coverage with HOLD rating. Exhibit 1: Key financials
(Year-end March) FY12 FY13 FY14E FY15E FY16ENet Sales (| crore) 80,368.9 79,674.9 85,924.6 88,964.6 96,330.6 EBITDA (| crore) 8,184.0 7,836.8 7,638.3 8,877.8 10,096.3 Net Profit (| crore) 3,397.0 3,026.9 2,121.1 1,758.6 2,020.3 EPS (|) 17.7 15.8 10.3 8.5 9.8 P/E 6.4 7.2 11.1 13.4 11.7 P/B 0.7 0.6 0.6 0.6 0.5 EV/EBITDA 6.9 8.9 9.4 8.1 7.1 RoCE (%) 7.1 5.3 4.2 4.4 5.2 RoE (%) 10.6 8.6 5.3 4.3 4.7
Source: Company, ICICIdirect.com Research
Hindalco Industries(HINDAL)| 115
Rating Matrix Rating : Hold
Target : | 108
Target Period : 12-18 months
Potential Upside : -6%
YoY Growth (YoY Growth) FY13 FY14E FY15E FY16ENet Sales (0.9) 7.8 3.5 8.3 EBITDA (4.2) (2.5) 16.2 13.7 Net Profit (10.9) (29.9) (17.1) 14.9 EPS (|) (10.9) (35.0) (17.1) 14.9
Current & target multiple FY13 FY14E FY15E FY16E
P/E (Diluted) 7.8 11.1 13.4 11.7 EV / Net Sales 0.9 0.8 0.8 0.7 EV / EBITDA 8.9 9.4 8.1 7.1 P/BV 0.6 0.6 0.6 0.5 RoNW 8.6 5.3 4.3 4.7 RoCE 5.3 4.2 4.4 5.2
Stock Data Bloomberg/Reuters Code HNDL IN / HALC.INSensex 21,720.0 Average volumes 8,690,362 Market Cap (| crore) 23,745.2 52 week H/L 137 / 83Equity Capital (| crore) 206.5 Face value | 1Promoter's Stake (%) 37.0 FII Holding (%) 26.9 DII Holding (%) 13.3
Price movement
0
20
40
60
80
100
120
140
Mar-14Dec-13Sep-13Jun-13Mar-13
2,000
3,000
4,000
5,000
6,000
7,000
Price (R.H.S) Nifty (L.H.S)
Comparative return matrix (%) Return % 1M 3M 6M 12MHindalco 15.4 (2.6) 3.0 20.7 Nalco 8.1 (6.5) 6.2 (24.0) Sesa-Sterlite (8.4) (9.9) (6.0) 5.7
Analyst’s name Dewang Sanghavi [email protected]
Shashank Kanodia [email protected]
Page 2ICICI Securities Ltd | Retail Equity Research
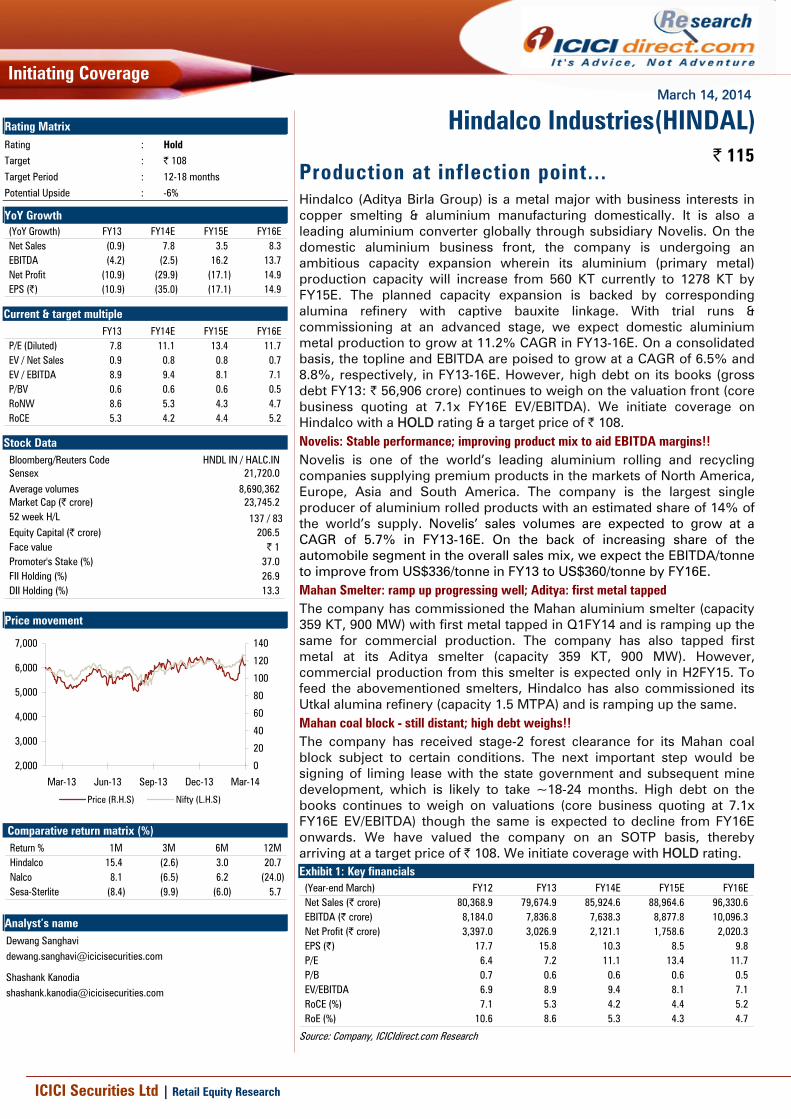
Company background Established in 1958, Hindalco is one of the leading manufacturers of aluminium and copper in India. Aluminium units encompass the entire gamut of operations, from bauxite mining, alumina refining and aluminium smelting to downstream rolling, extrusions, foils, along with captive power plants. The copper unit produces copper cathodes, continuous cast copper rods and other by-products, such as gold, silver and DAP fertilisers. In 2007, Hindalco acquired Novelis (rolled product capacity 3.0 MTPA) for ~US$6.0 billion, including debt in an all-cash transaction. The deal catapulted Hindalco to the position of world’s leading aluminium rolled product manufacturer. Novelis is one of the world’s leading aluminium rolling and recycling companies supplying premium products focusing on beverage cans, automotive and high-end specialities in markets of North America, Europe, Asia and South America. HIL also owns 51% of Aditya Birla Minerals (ABML, Australia), which supplies ~15-20% of the concentrate requirement for its Indian unit.
Exhibit 2: Company Snapshot & Key Events
0
50
100
150
200
250
300
350
2000
2001
2002
2003
2004
2005
2006
2007
2008
2009
2010
2011
2012
2013
2014
Date/Year Event2000 Acquisition of controlling stake in Indian Aluminium Company (Indal, capacity 43000 TPA of primary aluminium metal along with copper smelter)2002 Acquisition of Indo Gulf Corporation Ltd's copper business (Birla Copper, capacity 150,000 TPA)2003 Acquisition of Mt Gordon & Nifty copper mines through ABML, brownfield expansion of aluminium smelter at Renukoot raising capacity to 345000 TPA2004 Copper smelter expansion, capacity raised to 250000 TPA2005 MoUs signed with state governments of Odisha and Jharkhand to set up greenfield alumina refining, smelting and power plants; commissioned copper III expansion,
taking total capacity of copper smelter to 500000 TPA2006 Came out with a right issue amounting to | 2226.6 crore; enters into JV with Essar Power (MP) to develop and operate coal mines in Mahan, Madhya Pradesh;
company splits shares in ratio of 1:102007 In May 2007, Novelis became a Hindalco subsidiary with completion of acquisition process. The transaction makes Hindalco the world's largest aluminium rolling
company and one of the largest producers of primary aluminium in Asia; acquisition of Alcan's 45% stake in Utkal Alumina project makes Hindalco the 100% project owner
2008 Came out with rights issue: raised | 4426 crore for re-financing bridge loan taken for Novelis acquisition; Hindalco Alex Aerospace (HAAL) facility became operational and produced largest aluminium billet of 42" diameter
2009 Raised US$600 million through QIP route for projects
2011 Refinanced Novelis debt amounting to US$ 4 billion; achieved financial closure of two projects through debt financing -Utkal Alumina for | 4906 crore and Mahan Aluminium for | 7875 crore
2013 Promoter infused capital into the company by way of conversion of warrants (@| 143/share), of total | 2150 crore
Source: Company, ICICIdirect.com Research
Shareholding pattern (%) – Q3FY14
Shareholder's Category Holding (%)
Promoters 37.0
Institutional Investors 40.2
General Public 22.9
FII & DII holding trend (%)
28.2 26.7 27.2 24.528.9
24.9 26.9
13.316.6 14.8 14.7 15.5 17.0 14.4
0.0
10.0
20.0
30.0
40.0
Q1FY
13
Q2FY
13
Q3FY
13
Q4FY
13
Q1FY
14
Q2FY
14
Q3FY
14
% S
hare
FII DII

Page 3ICICI Securities Ltd | Retail Equity Research
Exhibit 3: Hindalco Industries overview s
Source: Company, ICICIdirect.com Research The tabs in orange indicate the capacity expected to come on stream
Hindalco Industries Ltd
Indian operations
Overseas operations
Aluminium business
Copper business
Dahej unit
Renukoot complex
Alumina refinery (capacity 0.7 MTPA)
Hirakud complex
Power Plant, Renusagar (capacity 742 MW)
Aluminium smelter (capacity 0.345 MTPA)
Aluminium Smelter (capacity 0.213 MTPA)
Mahan Project
Aditya aluminium project
Aluminium smelter (capacity 0.359 MTPA) power plant (900 MW)
Aluminium smelter (capacity 0.359 MTPA) power plant (900 MW)
Utkal Alumina Refinery (capacity 1.5 MTPA)
Copper smelter (capacity 0.5 MTPA)
Silver refining (capacity 150 T)
Gold refining (capacity 15 T)
Continuous cast copper rods (capacity 142 KT)
Aluminium business
Copper business
Aditya Birla Minerals (ABML)
Nifty Sulphide mine
Mt Gordon
Novelis Inc
North America (capacity ~1100 KT)
Asia (capacity 600 KT)
Europe (capacity ~900 KT)
South America (capacity ~400 KT)
Power Plant (capacity 467 MW)
South Korea (capacity 350 KT)
Brazil (capacity 220 KT)
Page 4ICICI Securities Ltd | Retail Equity Research
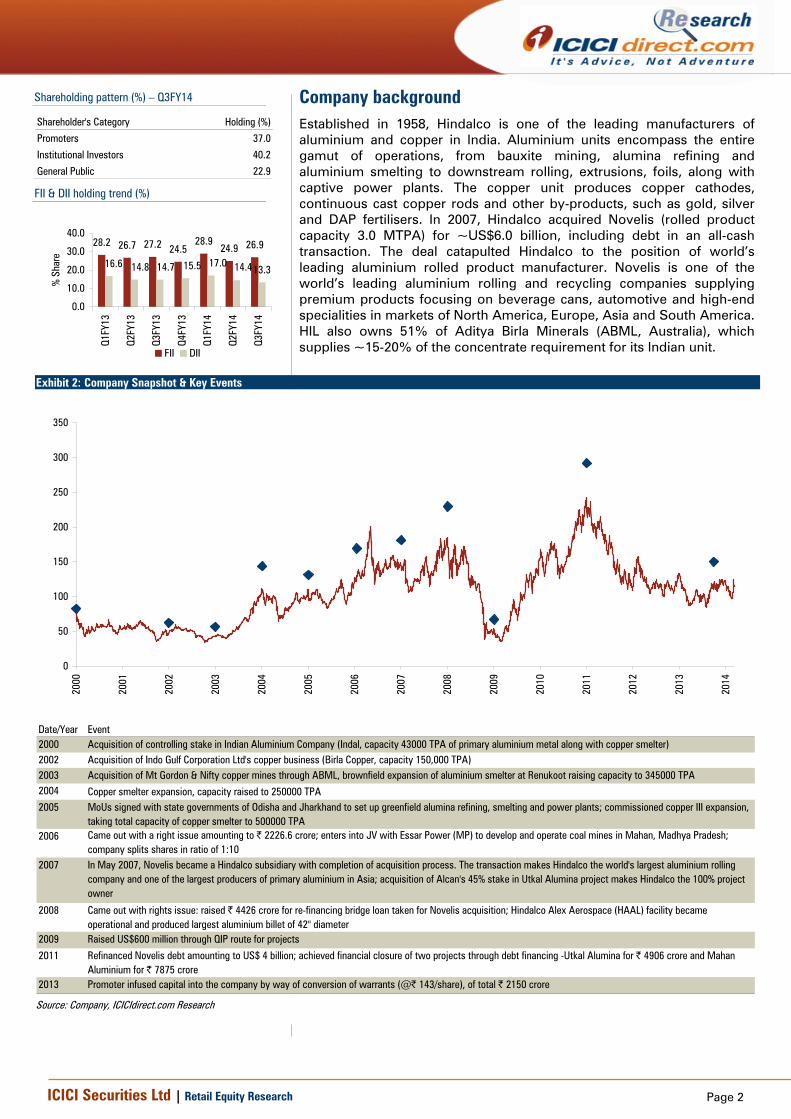
Indian aluminium industry India with its abundant supply of quality bauxite and low cost labour has established itself as a low cost producer of primary aluminium in the world. Domestic aluminium demand has witnessed healthy growth over the last few years. During CY08-13, domestic aluminium demand grew at a CAGR of 4.2% to 1.6 MT in CY13. India is rich in bauxite, with total reserves & resources (R&R) of ~3500 MT (with reserves constituting ~17% of the total R&R at 593 MT).
Going forward, domestic aluminium demand is expected to grow at ~8-9% over the next four or five years primarily on the back of demand pull from the power sector. Furthermore, India’s demand for housing, retail and office space is expected to rise swiftly as the urbanisation ratio is expected to increase from 31% in 2011 to 40% by 2030 with an estimated 610 million people living in the cities by 2030, which augurs well for aluminium demand. Domestic aluminium demand is expected to reach 2.3 MT by FY17E.
Exhibit 4: Indian aluminium demand trend (calendar year)
1.31.5 1.5
1.61.7
1.6
0.0
0.2
0.4
0.6
0.8
1.0
1.2
1.4
1.6
1.8
2008 2009 2010 2011 2012 2013
Mill
ion
tonn
e
Source: Bloomberg,, ICICIdirect.com Research
Exhibit 5: Indian aluminium industry structure (Porter Five Forces)
Source: ICICIdirect.com Research
Bargaining power of customers (end users)
Threat of New entrant
(Alcan, Rusal, Dubal, JFEippon)
Threat of substitute
(copper, steel)
Bargaining power of supplier (raw
material, bauxite)
Rivalry among competitor
(Hindalco, VAL, Balco, Nalco)
Very high given limited supply domestically & externally. Indonesia export ban imposed
Low; fewer options. Selling price at import parity
Low; as aluminium itself acting as substitute
Low as India has just enough capacity to meet domestic demand.
Low, as land acquisition remains a drag. Moreover setting up of a metal plant is capital intensive & has high gestation period
End user bifurcation (sector wise)
others2%
Packaging8%
Durable Consumer
Goods7%
Machinery & Equipment
7%
Electric Power48%
Transportation15%
Construction13%
Source: Bloomberg, ICICIdirect.com Research Uses of aluminium in India
Sector Properties/Remarks Products
PowerUsed in transmission & distribution of electricity
Conductors, underground power lines & cables
Automobiles
High strength to weight ratio, which leads to better fuel efficiency
Engines, body parts, auto, aerospace, rail and marine
Construction
Corrosion resistance, malleability, ductility and strength
Sheets (roofing), latches, handles, windows, doors, weather proofing
PackagingUsed in sectors like foods, beverages, and medicines Foils, cans and bottle caps
Consumer Durables
Lightweight, high resistant to corrosion, non-magnetic, non-combustible & non- toxic
Air conditioners, water coolers, refrigerators, utensils and pressure cookers
Source: ICICIdirect.com Research Existing players in India
Company Smelter LocationOperational
Capacity
Hindalco Renukoot(UP), Hirakud (Odisha) 560 KT
Sesa-Sterlite Jharsuguda (Odisha) 500 KT
Balco Korba (Chhattisgarh) 240 KT
Nalco Angul (Odisha) 430 KT
Total Capacity 1730 KT Source: ICICIdirect.com Research Upcoming capacities in India
Company Capacity StatusExpected Date of Commissioning
Hindalco 718 KTAdvanced stage of commissioning FY14/FY15
Sesa-Sterlite 1250 KT
Ready; company evaluating raw material supply FY15/FY16
Balco 325 KTReady; expected to start soon FY14
Total 2293 KT Source: ICICIdirect.com Research
Page 5ICICI Securities Ltd | Retail Equity Research
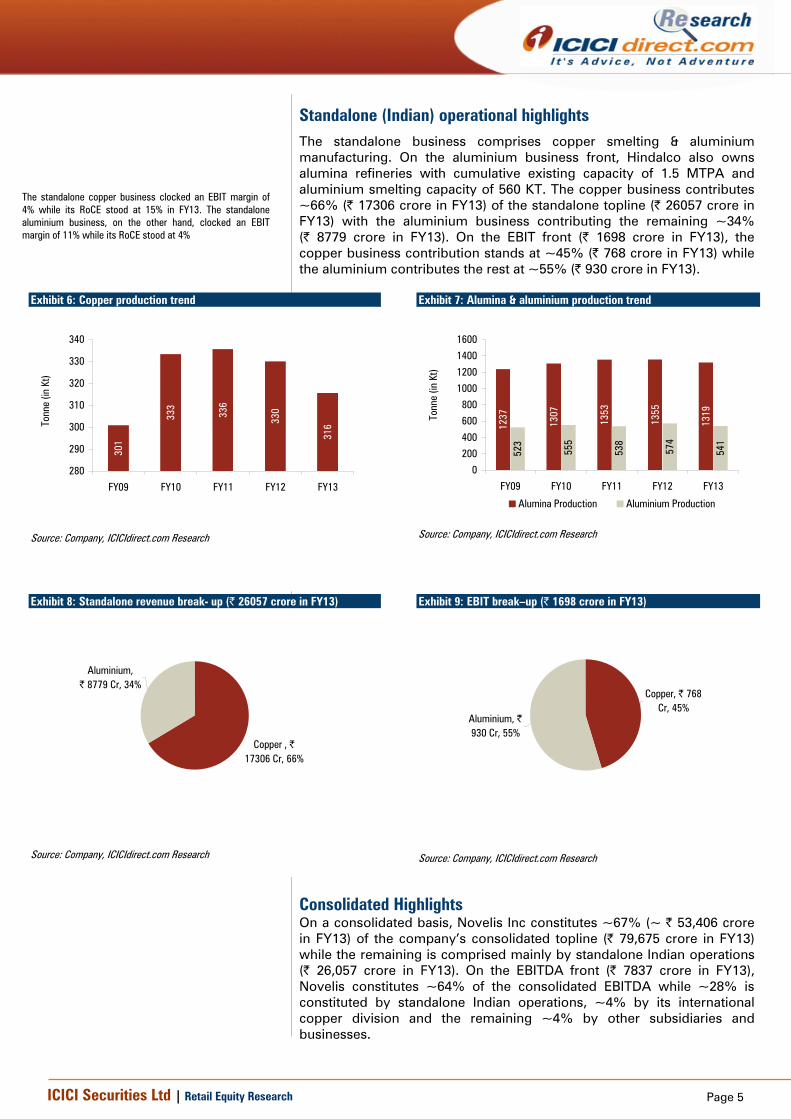
Standalone (Indian) operational highlights The standalone business comprises copper smelting & aluminium manufacturing. On the aluminium business front, Hindalco also owns alumina refineries with cumulative existing capacity of 1.5 MTPA and aluminium smelting capacity of 560 KT. The copper business contributes ~66% (| 17306 crore in FY13) of the standalone topline (| 26057 crore in FY13) with the aluminium business contributing the remaining ~34% (| 8779 crore in FY13). On the EBIT front (| 1698 crore in FY13), the copper business contribution stands at ~45% (| 768 crore in FY13) while the aluminium contributes the rest at ~55% (| 930 crore in FY13).
Exhibit 6: Copper production trend
301
333
336
330
316
280
290
300
310
320
330
340
FY09 FY10 FY11 FY12 FY13
Tonn
e (in
Kt)
Source: Company, ICICIdirect.com Research
Exhibit 7: Alumina & aluminium production trend
1237
1307
1353
1355
1319
523
555
538
574
541
0
200
400
600
800
1000
1200
1400
1600
FY09 FY10 FY11 FY12 FY13
Tonn
e (in
Kt)
Alumina Production Aluminium Production
Source: Company, ICICIdirect.com Research
Exhibit 8: Standalone revenue break- up (| 26057 crore in FY13)
Copper , | 17306 Cr, 66%
Aluminium, | 8779 Cr, 34%
Source: Company, ICICIdirect.com Research
Exhibit 9: EBIT break–up (| 1698 crore in FY13)
Copper, | 768 Cr, 45%
Aluminium, | 930 Cr, 55%
Source: Company, ICICIdirect.com Research
Consolidated Highlights On a consolidated basis, Novelis Inc constitutes ~67% (~ | 53,406 crore in FY13) of the company’s consolidated topline (| 79,675 crore in FY13) while the remaining is comprised mainly by standalone Indian operations (| 26,057 crore in FY13). On the EBITDA front (| 7837 crore in FY13), Novelis constitutes ~64% of the consolidated EBITDA while ~28% is constituted by standalone Indian operations, ~4% by its international copper division and the remaining ~4% by other subsidiaries and businesses.
The standalone copper business clocked an EBIT margin of 4% while its RoCE stood at 15% in FY13. The standalone aluminium business, on the other hand, clocked an EBIT margin of 11% while its RoCE stood at 4%
Page 6ICICI Securities Ltd | Retail Equity Research
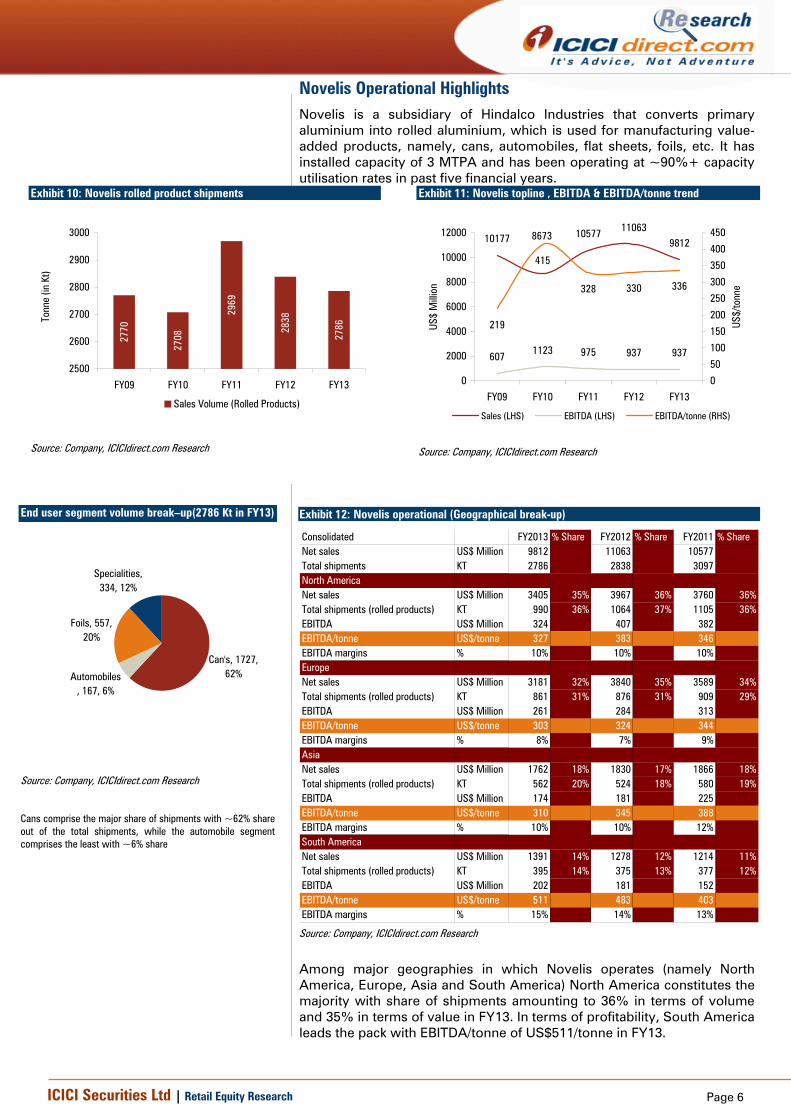
Novelis Operational Highlights Novelis is a subsidiary of Hindalco Industries that converts primary aluminium into rolled aluminium, which is used for manufacturing value- added products, namely, cans, automobiles, flat sheets, foils, etc. It has installed capacity of 3 MTPA and has been operating at ~90%+ capacity utilisation rates in past five financial years.
Exhibit 10: Novelis rolled product shipments
2770
2708
2969
2838
2786
2500
2600
2700
2800
2900
3000
FY09 FY10 FY11 FY12 FY13
Tonn
e (in
Kt)
Sales Volume (Rolled Products)
Source: Company, ICICIdirect.com Research
Exhibit 11: Novelis topline , EBITDA & EBITDA/tonne trend
10177 10577 110639812
607 1123 975 937 937
8673
219
415
328 330 336
0
2000
4000
6000
8000
10000
12000
FY09 FY10 FY11 FY12 FY13
US$
Milli
on
0
50
100
150
200
250
300
350
400
450
US$/
tonn
e
Sales (LHS) EBITDA (LHS) EBITDA/tonne (RHS)
Source: Company, ICICIdirect.com Research
Among major geographies in which Novelis operates (namely North America, Europe, Asia and South America) North America constitutes the majority with share of shipments amounting to 36% in terms of volume and 35% in terms of value in FY13. In terms of profitability, South America leads the pack with EBITDA/tonne of US$511/tonne in FY13.
Exhibit 12: Novelis operational (Geographical break-up)
Consolidated FY2013 % Share FY2012 % Share FY2011 % ShareNet sales US$ Million 9812 11063 10577Total shipments KT 2786 2838 3097North AmericaNet sales US$ Million 3405 35% 3967 36% 3760 36%Total shipments (rolled products) KT 990 36% 1064 37% 1105 36%EBITDA US$ Million 324 407 382EBITDA/tonne US$/tonne 327 383 346EBITDA margins % 10% 10% 10%EuropeNet sales US$ Million 3181 32% 3840 35% 3589 34%Total shipments (rolled products) KT 861 31% 876 31% 909 29%EBITDA US$ Million 261 284 313EBITDA/tonne US$/tonne 303 324 344EBITDA margins % 8% 7% 9%AsiaNet sales US$ Million 1762 18% 1830 17% 1866 18%Total shipments (rolled products) KT 562 20% 524 18% 580 19%EBITDA US$ Million 174 181 225EBITDA/tonne US$/tonne 310 345 388EBITDA margins % 10% 10% 12%South AmericaNet sales US$ Million 1391 14% 1278 12% 1214 11%Total shipments (rolled products) KT 395 14% 375 13% 377 12%EBITDA US$ Million 202 181 152EBITDA/tonne US$/tonne 511 483 403EBITDA margins % 15% 14% 13% Source: Company, ICICIdirect.com Research
End user segment volume break–up(2786 Kt in FY13)
Specialities, 334, 12%
Foils, 557, 20%
Automobiles, 167, 6%
Can's, 1727, 62%
Source: Company, ICICIdirect.com Research
Cans comprise the major share of shipments with ~62% share out of the total shipments, while the automobile segment comprises the least with ~6% share
Page 7ICICI Securities Ltd | Retail Equity Research
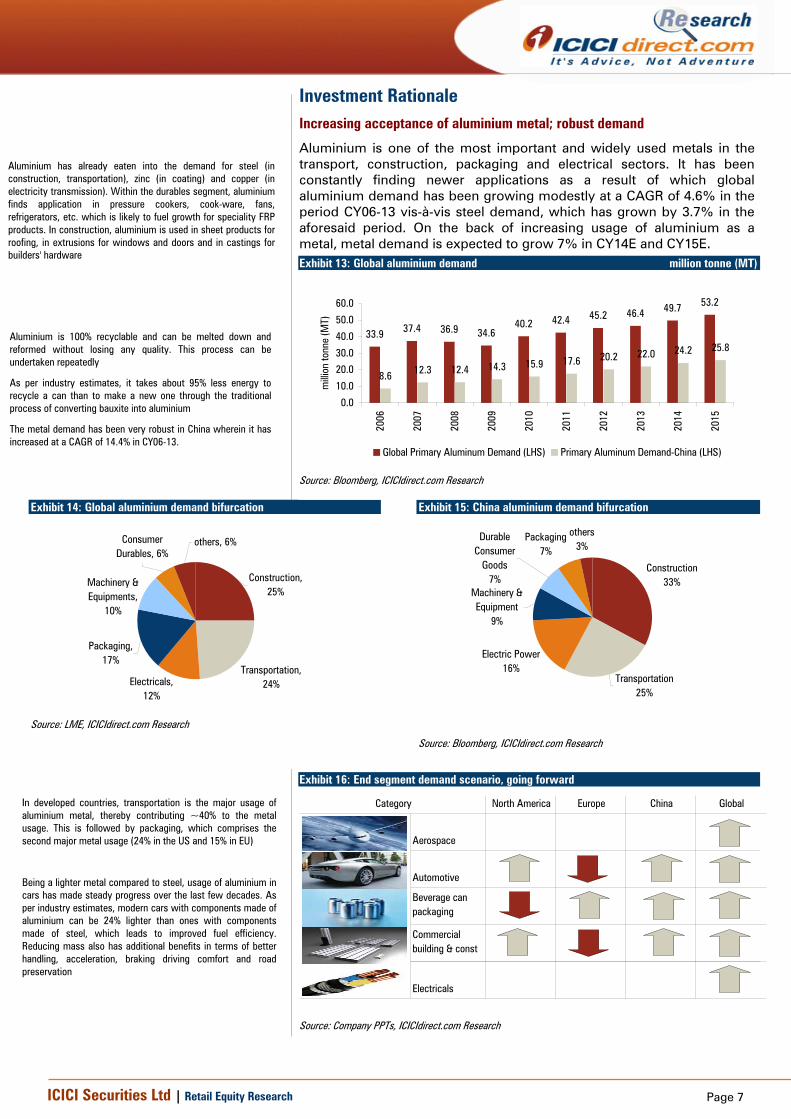
Investment Rationale Increasing acceptance of aluminium metal; robust demand
Aluminium is one of the most important and widely used metals in the transport, construction, packaging and electrical sectors. It has been constantly finding newer applications as a result of which global aluminium demand has been growing modestly at a CAGR of 4.6% in the period CY06-13 vis-à-vis steel demand, which has grown by 3.7% in the aforesaid period. On the back of increasing usage of aluminium as a metal, metal demand is expected to grow 7% in CY14E and CY15E.
Exhibit 14: Global aluminium demand bifurcation
others, 6%Consumer Durables, 6%
Machinery & Equipments,
10%
Packaging, 17%
Electricals, 12%
Transportation, 24%
Construction, 25%
Source: LME, ICICIdirect.com Research
Exhibit 15: China aluminium demand bifurcation
others3%
Packaging7%
Durable Consumer
Goods7%
Machinery & Equipment
9%
Electric Power16%
Transportation25%
Construction33%
Source: Bloomberg, ICICIdirect.com Research
Exhibit 13: Global aluminium demand million tonne (MT)
33.9 37.4 36.9 34.640.2 42.4 45.2 46.4 49.7 53.2
8.6 12.3 12.4 14.3 15.9 17.6 20.2 22.0 24.2 25.8
0.0
10.0
20.0
30.0
40.0
50.0
60.0
2006
2007
2008
2009
2010
2011
2012
2013
2014
2015
milli
on to
nne
(MT)
Global Primary Aluminum Demand (LHS) Primary Aluminum Demand-China (LHS)
Source: Bloomberg, ICICIdirect.com Research
Exhibit 16: End segment demand scenario, going forward
North America Europe China Global
Aerospace
Automotive
Beverage can packaging
Commercial building & const
Electricals
Category
ospaceospaceAerospace
Source: Company PPTs, ICICIdirect.com Research
Aluminium is 100% recyclable and can be melted down and reformed without losing any quality. This process can be undertaken repeatedly
As per industry estimates, it takes about 95% less energy to recycle a can than to make a new one through the traditional process of converting bauxite into aluminium
The metal demand has been very robust in China wherein it has increased at a CAGR of 14.4% in CY06-13.
In developed countries, transportation is the major usage of aluminium metal, thereby contributing ~40% to the metal usage. This is followed by packaging, which comprises the second major metal usage (24% in the US and 15% in EU)
Being a lighter metal compared to steel, usage of aluminium in cars has made steady progress over the last few decades. As per industry estimates, modern cars with components made of aluminium can be 24% lighter than ones with components made of steel, which leads to improved fuel efficiency. Reducing mass also has additional benefits in terms of better handling, acceleration, braking driving comfort and road preservation
Aluminium has already eaten into the demand for steel (in construction, transportation), zinc (in coating) and copper (in electricity transmission). Within the durables segment, aluminium finds application in pressure cookers, cook-ware, fans, refrigerators, etc. which is likely to fuel growth for speciality FRP products. In construction, aluminium is used in sheet products for roofing, in extrusions for windows and doors and in castings for builders' hardware
Page 8ICICI Securities Ltd | Retail Equity Research
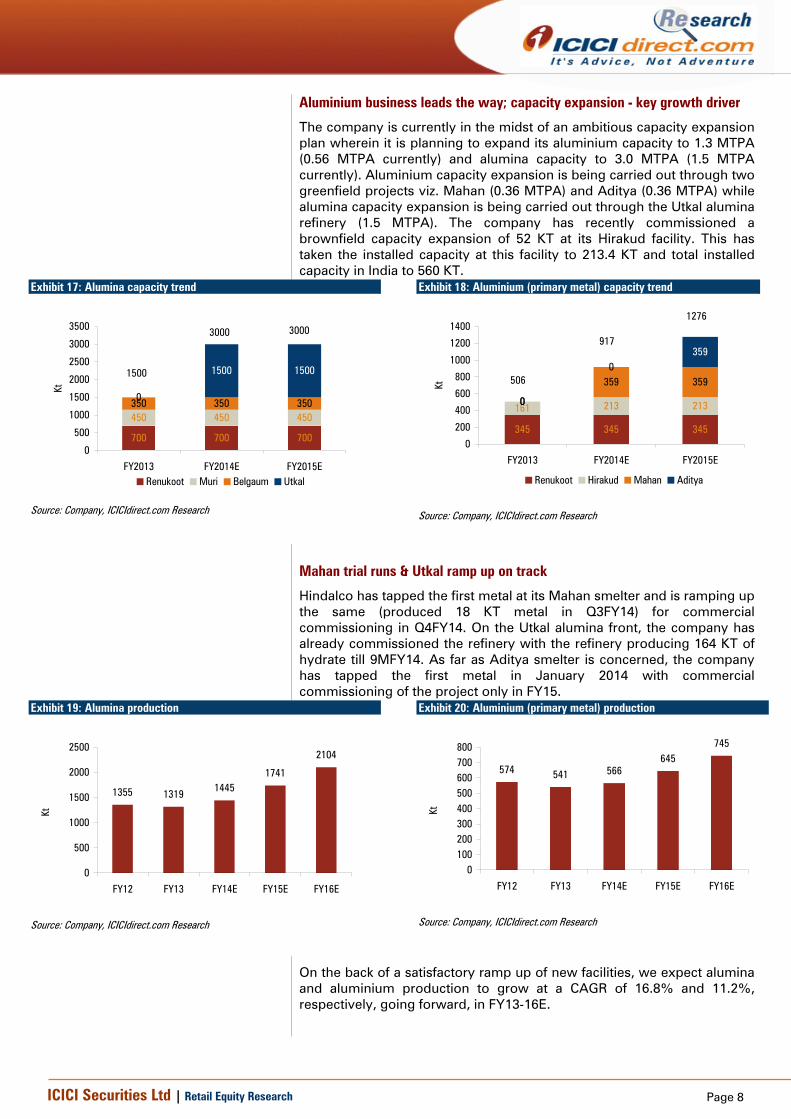
Aluminium business leads the way; capacity expansion - key growth driver
The company is currently in the midst of an ambitious capacity expansion plan wherein it is planning to expand its aluminium capacity to 1.3 MTPA (0.56 MTPA currently) and alumina capacity to 3.0 MTPA (1.5 MTPA currently). Aluminium capacity expansion is being carried out through two greenfield projects viz. Mahan (0.36 MTPA) and Aditya (0.36 MTPA) while alumina capacity expansion is being carried out through the Utkal alumina refinery (1.5 MTPA). The company has recently commissioned a brownfield capacity expansion of 52 KT at its Hirakud facility. This has taken the installed capacity at this facility to 213.4 KT and total installed capacity in India to 560 KT.
Exhibit 17: Alumina capacity trend
700 700 700
450 450 450350 350 3500
15001500
0
500
1000
1500
2000
2500
3000
3500
FY2013 FY2014E FY2015E
Kt
Renukoot Muri Belgaum Utkal
Source: Company, ICICIdirect.com Research
Exhibit 18: Aluminium (primary metal) capacity trend
345 345 345
161 213 2130
359 359
0
0359
0
200
400
600
800
1000
1200
1400
FY2013 FY2014E FY2015E
Kt
Renukoot Hirakud Mahan Aditya
Source: Company, ICICIdirect.com Research
Mahan trial runs & Utkal ramp up on track
Hindalco has tapped the first metal at its Mahan smelter and is ramping up the same (produced 18 KT metal in Q3FY14) for commercial commissioning in Q4FY14. On the Utkal alumina front, the company has already commissioned the refinery with the refinery producing 164 KT of hydrate till 9MFY14. As far as Aditya smelter is concerned, the company has tapped the first metal in January 2014 with commercial commissioning of the project only in FY15.
Exhibit 19: Alumina production
1355 1319 14451741
2104
0
500
1000
1500
2000
2500
FY12 FY13 FY14E FY15E FY16E
Kt
Source: Company, ICICIdirect.com Research
Exhibit 20: Aluminium (primary metal) production
574 541 566645
745
0100200300400500600700800
FY12 FY13 FY14E FY15E FY16E
Kt
Source: Company, ICICIdirect.com Research
On the back of a satisfactory ramp up of new facilities, we expect alumina and aluminium production to grow at a CAGR of 16.8% and 11.2%, respectively, going forward, in FY13-16E.
1500
3000 3000
506
917
1276
Page 9ICICI Securities Ltd | Retail Equity Research
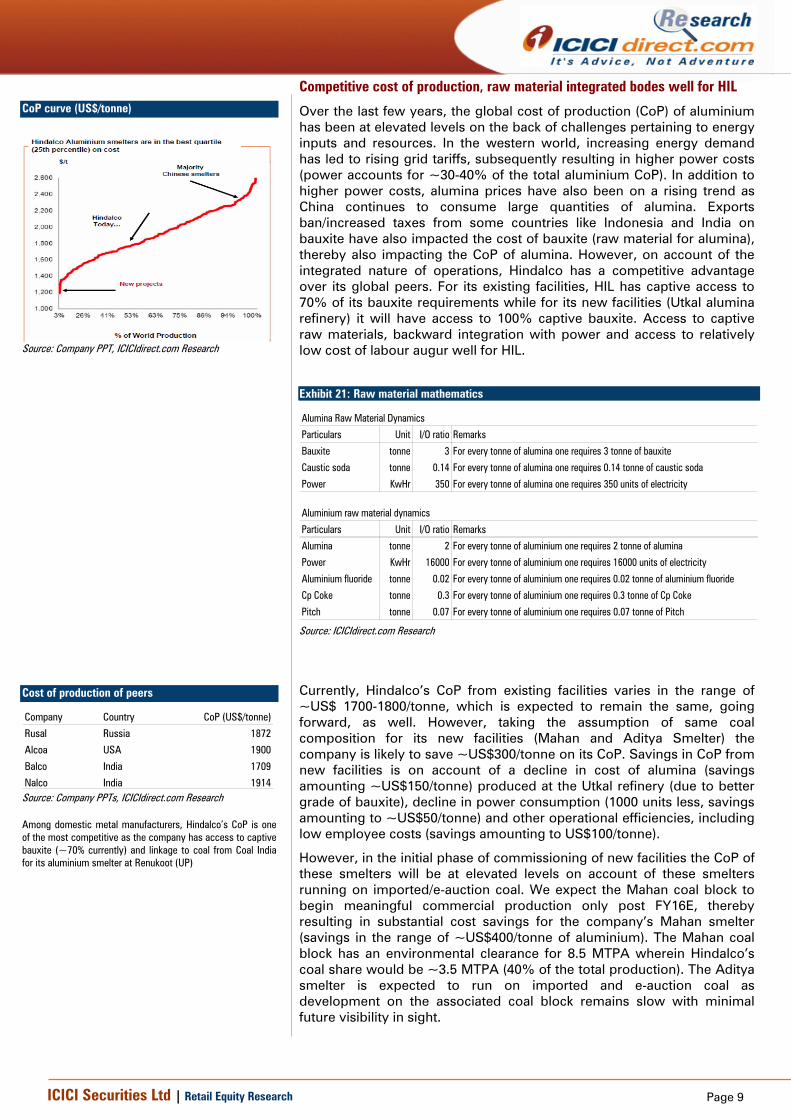
Competitive cost of production, raw material integrated bodes well for HIL
Over the last few years, the global cost of production (CoP) of aluminium has been at elevated levels on the back of challenges pertaining to energy inputs and resources. In the western world, increasing energy demand has led to rising grid tariffs, subsequently resulting in higher power costs (power accounts for ~30-40% of the total aluminium CoP). In addition to higher power costs, alumina prices have also been on a rising trend as China continues to consume large quantities of alumina. Exports ban/increased taxes from some countries like Indonesia and India on bauxite have also impacted the cost of bauxite (raw material for alumina), thereby also impacting the CoP of alumina. However, on account of the integrated nature of operations, Hindalco has a competitive advantage over its global peers. For its existing facilities, HIL has captive access to 70% of its bauxite requirements while for its new facilities (Utkal alumina refinery) it will have access to 100% captive bauxite. Access to captive raw materials, backward integration with power and access to relatively low cost of labour augur well for HIL.
Currently, Hindalco’s CoP from existing facilities varies in the range of ~US$ 1700-1800/tonne, which is expected to remain the same, going forward, as well. However, taking the assumption of same coal composition for its new facilities (Mahan and Aditya Smelter) the company is likely to save ~US$300/tonne on its CoP. Savings in CoP from new facilities is on account of a decline in cost of alumina (savings amounting ~US$150/tonne) produced at the Utkal refinery (due to better grade of bauxite), decline in power consumption (1000 units less, savings amounting to ~US$50/tonne) and other operational efficiencies, including low employee costs (savings amounting to US$100/tonne).
However, in the initial phase of commissioning of new facilities the CoP of these smelters will be at elevated levels on account of these smelters running on imported/e-auction coal. We expect the Mahan coal block to begin meaningful commercial production only post FY16E, thereby resulting in substantial cost savings for the company’s Mahan smelter (savings in the range of ~US$400/tonne of aluminium). The Mahan coal block has an environmental clearance for 8.5 MTPA wherein Hindalco’s coal share would be ~3.5 MTPA (40% of the total production). The Aditya smelter is expected to run on imported and e-auction coal as development on the associated coal block remains slow with minimal future visibility in sight.
Exhibit 21: Raw material mathematics
Alumina Raw Material Dynamics
Particulars Unit I/O ratio Remarks
Bauxite tonne 3 For every tonne of alumina one requires 3 tonne of bauxite
Caustic soda tonne 0.14 For every tonne of alumina one requires 0.14 tonne of caustic soda
Power KwHr 350 For every tonne of alumina one requires 350 units of electricity
Aluminium raw material dynamics
Particulars Unit I/O ratio Remarks
Alumina tonne 2 For every tonne of aluminium one requires 2 tonne of alumina
Power KwHr 16000 For every tonne of aluminium one requires 16000 units of electricity
Aluminium fluoride tonne 0.02 For every tonne of aluminium one requires 0.02 tonne of aluminium fluoride
Cp Coke tonne 0.3 For every tonne of aluminium one requires 0.3 tonne of Cp Coke
Pitch tonne 0.07 For every tonne of aluminium one requires 0.07 tonne of Pitch Source: ICICIdirect.com Research
Cost of production of peers
Company Country CoP (US$/tonne)
Rusal Russia 1872
Alcoa USA 1900
Balco India 1709
Nalco India 1914 Source: Company PPTs, ICICIdirect.com Research Among domestic metal manufacturers, Hindalco’s CoP is one of the most competitive as the company has access to captive bauxite (~70% currently) and linkage to coal from Coal India for its aluminium smelter at Renukoot (UP)
CoP curve (US$/tonne)
Source: Company PPT, ICICIdirect.com Research
Page 10ICICI Securities Ltd | Retail Equity Research
Stable copper business; Tc/Rc likely to remain firm
In CY13, global copper demand growth rate is likely to be subdued on account of an uncertain demand outlook on the three major copper consuming regions viz. China, US and Europe (global copper demand recorded a growth rate of ~3.5% in CY12). However, on the other hand, mine supplies are likely to report an increase in CY13 that is likely to result in surplus copper in global market. We believe an expectation of surplus concentrates is likely to keep Tc/Rc margins firm with an upward bias.
Hindalco’s copper business is predominantly a convertor business and is largely insulated from copper prices. As Hindalco operates custom smelting operations, profits from this part of the business do not really depend on copper prices but on variables such as treatment and refining charges earned and realisations on the sale of by-products such as sulphuric acid, phosphoric acid, and di-ammonium phosphate.
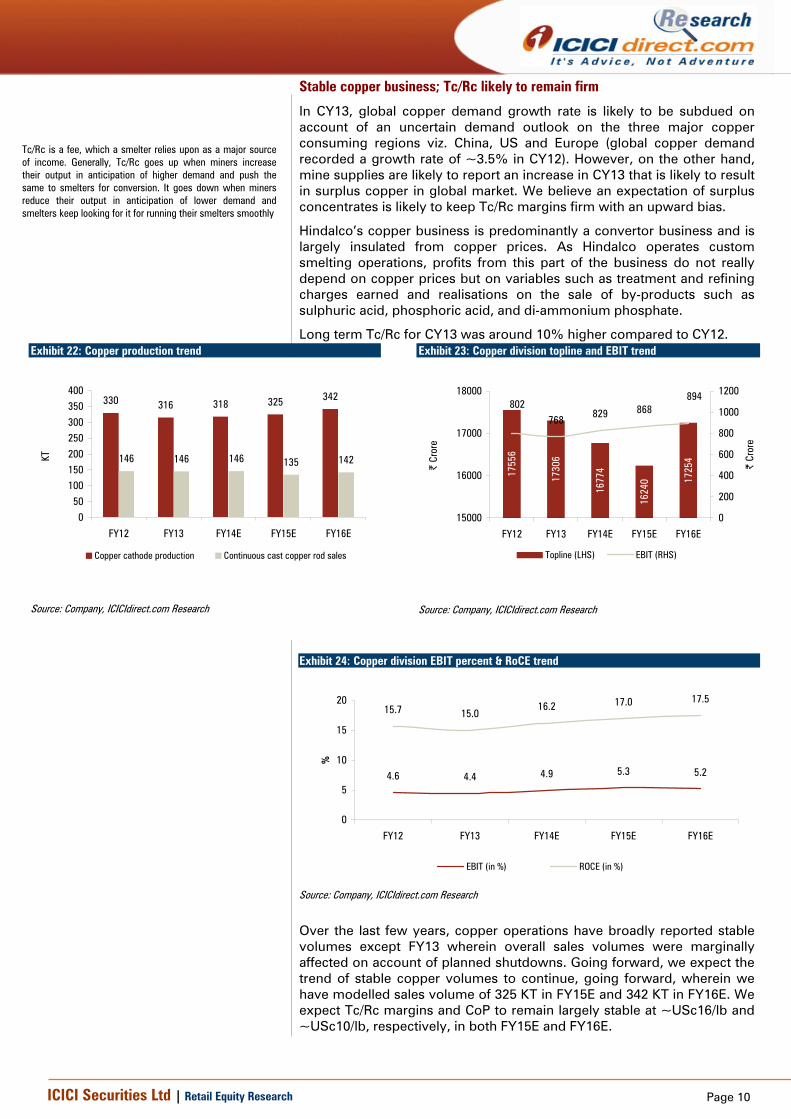
Long term Tc/Rc for CY13 was around 10% higher compared to CY12. Exhibit 22: Copper production trend
330 316 318 325 342
146 146 146 135 142
050
100150200250300350400
FY12 FY13 FY14E FY15E FY16E
KT
Copper cathode production Continuous cast copper rod sales
Source: Company, ICICIdirect.com Research
Exhibit 23: Copper division topline and EBIT trend
1755
6
1730
6
1677
4
1624
0 1725
4
768 829 868802894
15000
16000
17000
18000
FY12 FY13 FY14E FY15E FY16E
| Cr
ore
0
200
400
600
800
1000
1200
| Cr
ore
Topline (LHS) EBIT (RHS)
Source: Company, ICICIdirect.com Research
Over the last few years, copper operations have broadly reported stable volumes except FY13 wherein overall sales volumes were marginally affected on account of planned shutdowns. Going forward, we expect the trend of stable copper volumes to continue, going forward, wherein we have modelled sales volume of 325 KT in FY15E and 342 KT in FY16E. We expect Tc/Rc margins and CoP to remain largely stable at ~USc16/lb and ~USc10/lb, respectively, in both FY15E and FY16E.
Exhibit 24: Copper division EBIT percent & RoCE trend
4.6 4.4 4.9 5.3 5.2
15.7 15.016.2 17.0 17.5
0
5
10
15
20
FY12 FY13 FY14E FY15E FY16E
%
EBIT (in %) ROCE (in %)
Source: Company, ICICIdirect.com Research
Tc/Rc is a fee, which a smelter relies upon as a major source of income. Generally, Tc/Rc goes up when miners increase their output in anticipation of higher demand and push the same to smelters for conversion. It goes down when miners reduce their output in anticipation of lower demand and smelters keep looking for it for running their smelters smoothly
Page 11ICICI Securities Ltd | Retail Equity Research
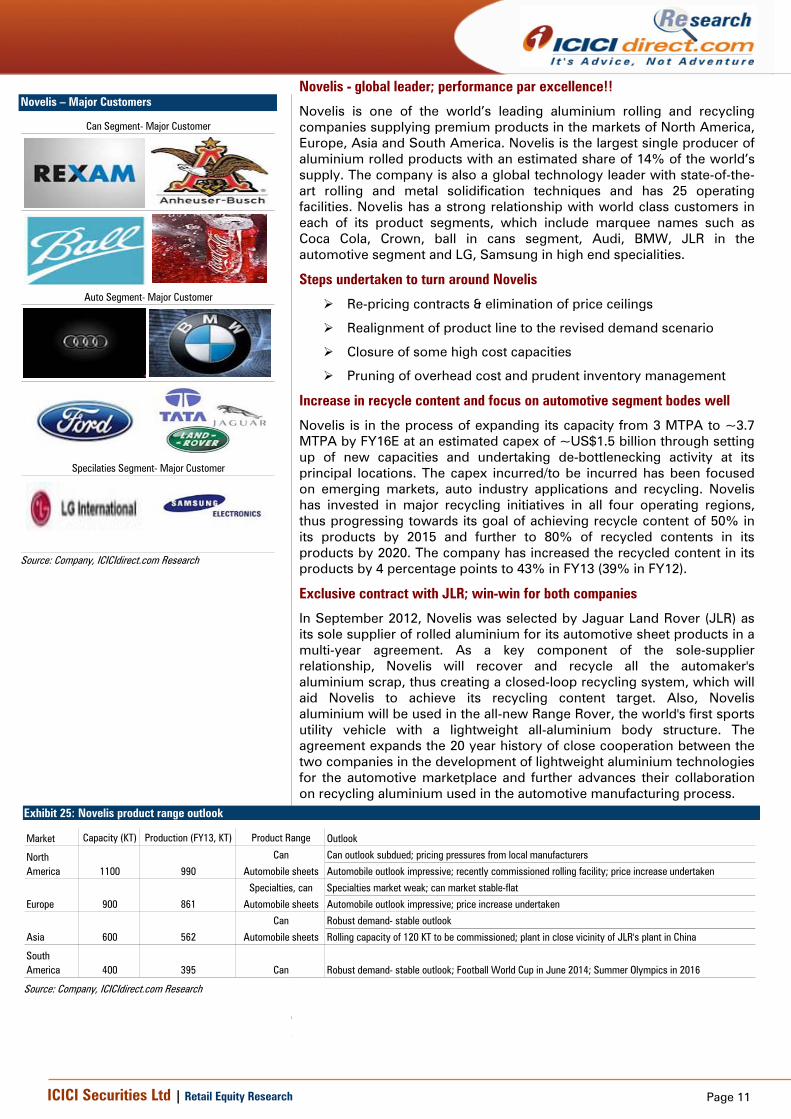
Novelis - global leader; performance par excellence!!
Novelis is one of the world’s leading aluminium rolling and recycling companies supplying premium products in the markets of North America, Europe, Asia and South America. Novelis is the largest single producer of aluminium rolled products with an estimated share of 14% of the world’s supply. The company is also a global technology leader with state-of-the-art rolling and metal solidification techniques and has 25 operating facilities. Novelis has a strong relationship with world class customers in each of its product segments, which include marquee names such as Coca Cola, Crown, ball in cans segment, Audi, BMW, JLR in the automotive segment and LG, Samsung in high end specialities.
Steps undertaken to turn around Novelis
Re-pricing contracts & elimination of price ceilings
Realignment of product line to the revised demand scenario
Closure of some high cost capacities
Pruning of overhead cost and prudent inventory management
Increase in recycle content and focus on automotive segment bodes well
Novelis is in the process of expanding its capacity from 3 MTPA to ~3.7 MTPA by FY16E at an estimated capex of ~US$1.5 billion through setting up of new capacities and undertaking de-bottlenecking activity at its principal locations. The capex incurred/to be incurred has been focused on emerging markets, auto industry applications and recycling. Novelis has invested in major recycling initiatives in all four operating regions, thus progressing towards its goal of achieving recycle content of 50% in its products by 2015 and further to 80% of recycled contents in its products by 2020. The company has increased the recycled content in its products by 4 percentage points to 43% in FY13 (39% in FY12).
Exclusive contract with JLR; win-win for both companies
In September 2012, Novelis was selected by Jaguar Land Rover (JLR) as its sole supplier of rolled aluminium for its automotive sheet products in a multi-year agreement. As a key component of the sole-supplier relationship, Novelis will recover and recycle all the automaker's aluminium scrap, thus creating a closed-loop recycling system, which will aid Novelis to achieve its recycling content target. Also, Novelis aluminium will be used in the all-new Range Rover, the world's first sports utility vehicle with a lightweight all-aluminium body structure. The agreement expands the 20 year history of close cooperation between the two companies in the development of lightweight aluminium technologies for the automotive marketplace and further advances their collaboration on recycling aluminium used in the automotive manufacturing process.
Exhibit 25: Novelis product range outlook
Market Capacity (KT) Production (FY13, KT) Product Range Outlook
Can Can outlook subdued; pricing pressures from local manufacturers
Automobile sheets Automobile outlook impressive; recently commissioned rolling facility; price increase undertaken
Specialties, can Specialties market weak; can market stable-flat
Automobile sheets Automobile outlook impressive; price increase undertaken
Can Robust demand- stable outlook
Automobile sheets Rolling capacity of 120 KT to be commissioned; plant in close vicinity of JLR's plant in China
South America
600
Robust demand- stable outlook; Football World Cup in June 2014; Summer Olympics in 2016
562
400 395 Can
North America 1100 990
Europe 900 861
Asia
Source: Company, ICICIdirect.com Research
Novelis – Major Customers
Can Segment- Major Customer
Auto Segment- Major Customer
Specilaties Segment- Major Customer
Source: Company, ICICIdirect.com Research
Page 12ICICI Securities Ltd | Retail Equity Research
Hirakud FRP expansion to lend stability to domestic operations
During Q1FY14, Hindalco relocated its can body stock making facility (flat rolled products, with a capacity of 135000 TPA) from the Novelis plant at Rogerstone, UK to the Hirakud facility in India. The facility has been shifted from Rogerstone UK to Hirakud at a capex of ~| 950 crore. This is India’s first and only facility with a capability to produce can body stock. The thin aluminium sheets, which are used in packaging of beverage products are generally priced ~40-50% higher than base grade aluminium products, thus resulting in superior margins. In India, cola majors generally import cans from South Korea. Hence, they provide an opportunity to Hindalco to cater to domestic markets and, henceforth, reduce its exposure to volatile prices and cyclicality. Capex intensity to slow; cautious stance augurs well for company
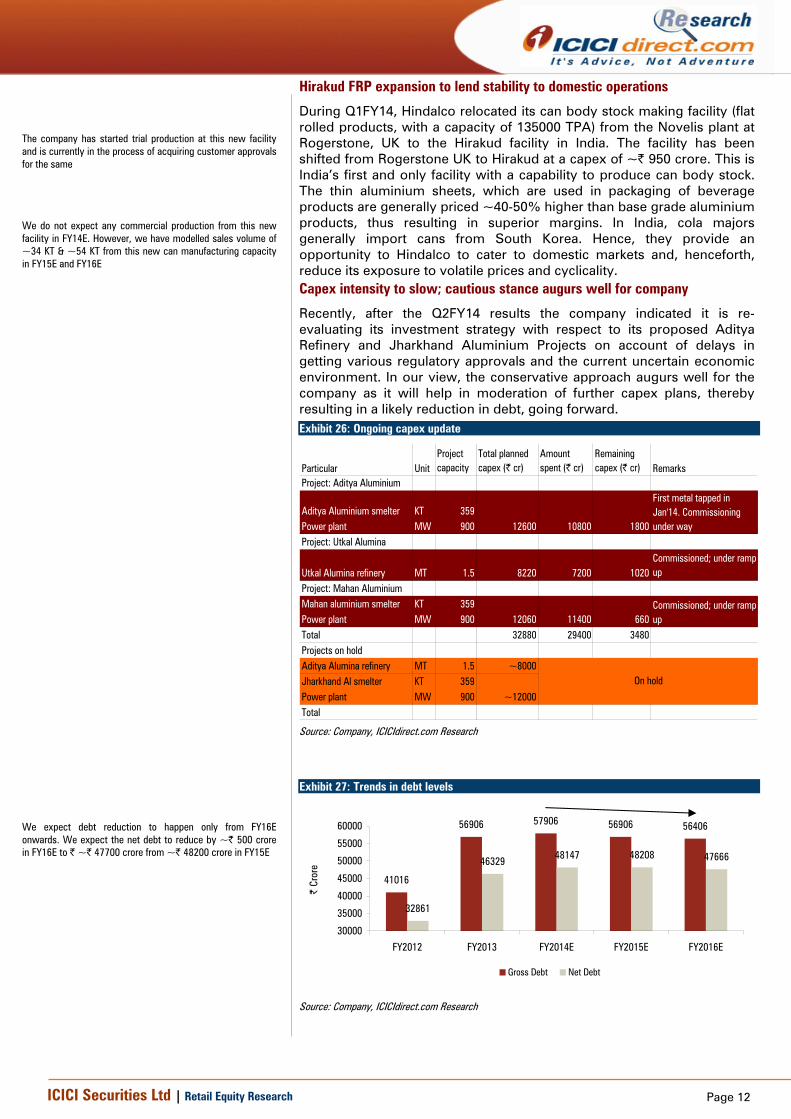
Recently, after the Q2FY14 results the company indicated it is re-evaluating its investment strategy with respect to its proposed Aditya Refinery and Jharkhand Aluminium Projects on account of delays in getting various regulatory approvals and the current uncertain economic environment. In our view, the conservative approach augurs well for the company as it will help in moderation of further capex plans, thereby resulting in a likely reduction in debt, going forward.
Exhibit 26: Ongoing capex update
Particular UnitProject capacity
Total planned capex (| cr)
Amount spent (| cr)
Remaining capex (| cr) Remarks
Project: Aditya Aluminium
Aditya Aluminium smelter KT 359Power plant MW 900Project: Utkal Alumina
Utkal Alumina refinery MT 1.5 8220 7200 1020Commissioned; under ramp up
Project: Mahan AluminiumMahan aluminium smelter KT 359Power plant MW 900Total 32880 29400 3480Projects on holdAditya Alumina refinery MT 1.5 ~8000Jharkhand Al smelter KT 359Power plant MW 900Total
Commissioned; under ramp up
12600
~12000
On hold
12060 11400 660
10800 1800
First metal tapped in Jan'14. Commissioning under way
Source: Company, ICICIdirect.com Research
Exhibit 27: Trends in debt levels
41016
56906 57906 56906 56406
32861
46329 48147 48208 47666
30000
35000
40000
45000
50000
55000
60000
FY2012 FY2013 FY2014E FY2015E FY2016E
| Cr
ore
Gross Debt Net Debt
Source: Company, ICICIdirect.com Research
The company has started trial production at this new facility and is currently in the process of acquiring customer approvals for the same
We expect debt reduction to happen only from FY16E onwards. We expect the net debt to reduce by ~| 500 crore in FY16E to | ~| 47700 crore from ~| 48200 crore in FY15E
We do not expect any commercial production from this new facility in FY14E. However, we have modelled sales volume of ~34 KT & ~54 KT from this new can manufacturing capacity in FY15E and FY16E
Page 13ICICI Securities Ltd | Retail Equity Research
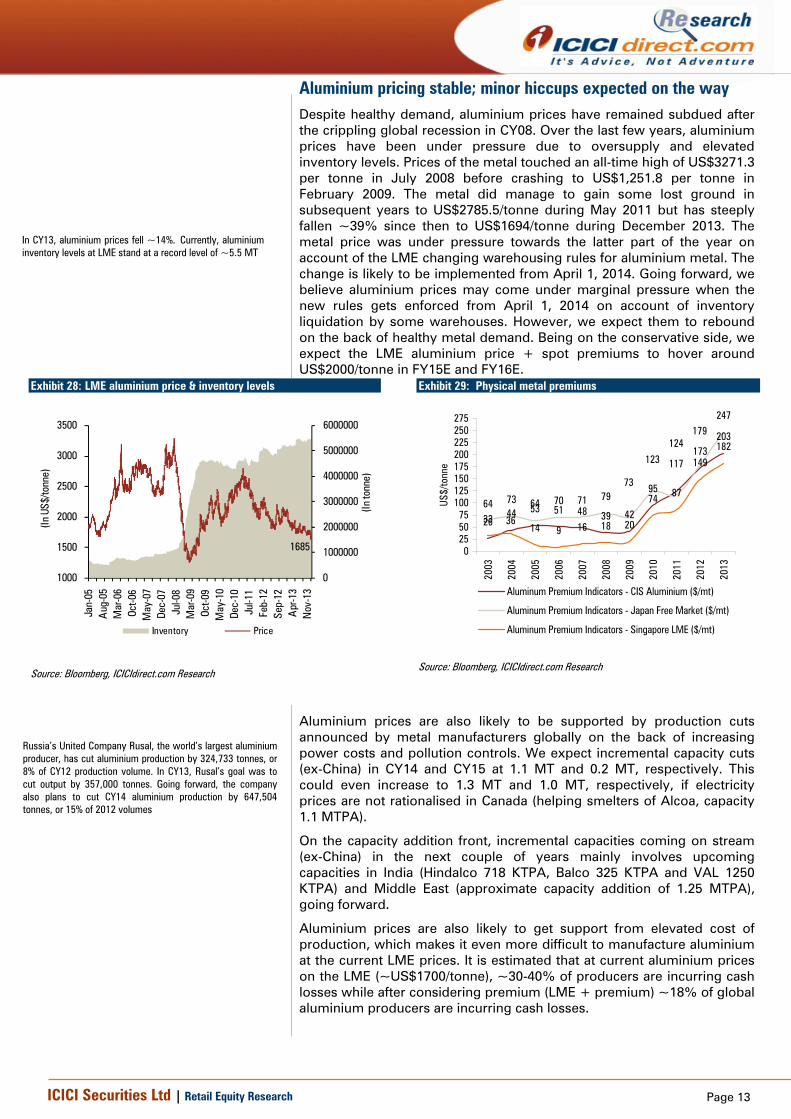
Aluminium pricing stable; minor hiccups expected on the way Despite healthy demand, aluminium prices have remained subdued after the crippling global recession in CY08. Over the last few years, aluminium prices have been under pressure due to oversupply and elevated inventory levels. Prices of the metal touched an all-time high of US$3271.3 per tonne in July 2008 before crashing to US$1,251.8 per tonne in February 2009. The metal did manage to gain some lost ground in subsequent years to US$2785.5/tonne during May 2011 but has steeply fallen ~39% since then to US$1694/tonne during December 2013. The metal price was under pressure towards the latter part of the year on account of the LME changing warehousing rules for aluminium metal. The change is likely to be implemented from April 1, 2014. Going forward, we believe aluminium prices may come under marginal pressure when the new rules gets enforced from April 1, 2014 on account of inventory liquidation by some warehouses. However, we expect them to rebound on the back of healthy metal demand. Being on the conservative side, we expect the LME aluminium price + spot premiums to hover around US$2000/tonne in FY15E and FY16E.
Exhibit 28: LME aluminium price & inventory levels
1685
0
1000000
2000000
3000000
4000000
5000000
6000000
1000
1500
2000
2500
3000
3500
Jan-
05A
ug-0
5M
ar-0
6Oc
t-06
May
-07
Dec-
07Ju
l-08
Mar
-09
Oct-0
9M
ay-1
0De
c-10
Jul-1
1Fe
b-12
Sep-
12A
pr-1
3N
ov-1
3
(In to
nne)
(In U
S$/to
nne)
Inventory Price
Source: Bloomberg, ICICIdirect.com Research
Exhibit 29: Physical metal premiums
2644 53 51 48 39 42
95
173203
64 73 64 70 71 79
247
14 9 16 18 20
74 87
149
182124
73
123 117
179
33 36
0255075
100125150175200225250275
2003
2004
2005
2006
2007
2008
2009
2010
2011
2012
2013
US$/
tonn
e
Aluminum Premium Indicators - CIS Aluminium ($/mt)
Aluminum Premium Indicators - Japan Free Market ($/mt)
Aluminum Premium Indicators - Singapore LME ($/mt)
Source: Bloomberg, ICICIdirect.com Research
Aluminium prices are also likely to be supported by production cuts announced by metal manufacturers globally on the back of increasing power costs and pollution controls. We expect incremental capacity cuts (ex-China) in CY14 and CY15 at 1.1 MT and 0.2 MT, respectively. This could even increase to 1.3 MT and 1.0 MT, respectively, if electricity prices are not rationalised in Canada (helping smelters of Alcoa, capacity 1.1 MTPA).
On the capacity addition front, incremental capacities coming on stream (ex-China) in the next couple of years mainly involves upcoming capacities in India (Hindalco 718 KTPA, Balco 325 KTPA and VAL 1250 KTPA) and Middle East (approximate capacity addition of 1.25 MTPA), going forward.
Aluminium prices are also likely to get support from elevated cost of production, which makes it even more difficult to manufacture aluminium at the current LME prices. It is estimated that at current aluminium prices on the LME (~US$1700/tonne), ~30-40% of producers are incurring cash losses while after considering premium (LME + premium) ~18% of global aluminium producers are incurring cash losses.
In CY13, aluminium prices fell ~14%. Currently, aluminium inventory levels at LME stand at a record level of ~5.5 MT
Russia’s United Company Rusal, the world’s largest aluminium producer, has cut aluminium production by 324,733 tonnes, or 8% of CY12 production volume. In CY13, Rusal’s goal was to cut output by 357,000 tonnes. Going forward, the company also plans to cut CY14 aluminium production by 647,504 tonnes, or 15% of 2012 volumes
Page 14ICICI Securities Ltd | Retail Equity Research
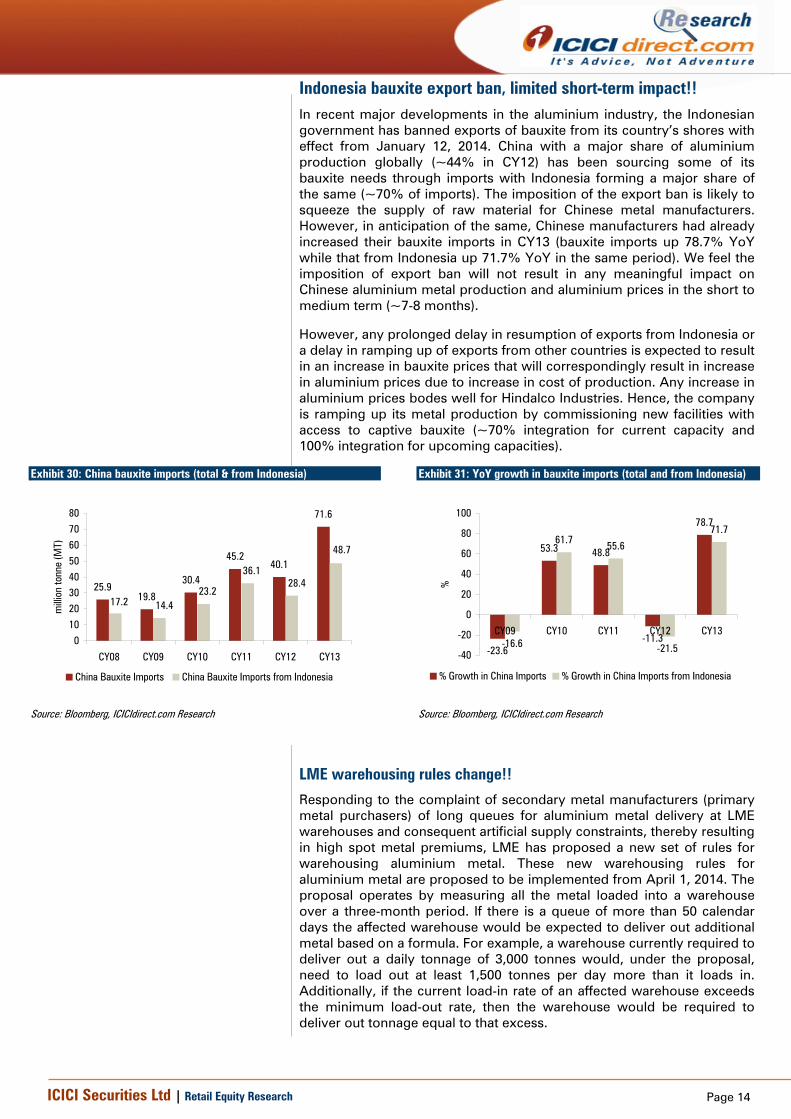
Indonesia bauxite export ban, limited short-term impact!! In recent major developments in the aluminium industry, the Indonesian government has banned exports of bauxite from its country’s shores with effect from January 12, 2014. China with a major share of aluminium production globally (~44% in CY12) has been sourcing some of its bauxite needs through imports with Indonesia forming a major share of the same (~70% of imports). The imposition of the export ban is likely to squeeze the supply of raw material for Chinese metal manufacturers. However, in anticipation of the same, Chinese manufacturers had already increased their bauxite imports in CY13 (bauxite imports up 78.7% YoY while that from Indonesia up 71.7% YoY in the same period). We feel the imposition of export ban will not result in any meaningful impact on Chinese aluminium metal production and aluminium prices in the short to medium term (~7-8 months). However, any prolonged delay in resumption of exports from Indonesia or a delay in ramping up of exports from other countries is expected to result in an increase in bauxite prices that will correspondingly result in increase in aluminium prices due to increase in cost of production. Any increase in aluminium prices bodes well for Hindalco Industries. Hence, the company is ramping up its metal production by commissioning new facilities with access to captive bauxite (~70% integration for current capacity and 100% integration for upcoming capacities).
Exhibit 30: China bauxite imports (total & from Indonesia)
25.919.8
30.4
45.240.1
71.6
14.423.2
17.2
48.7
28.436.1
01020304050607080
CY08 CY09 CY10 CY11 CY12 CY13
milli
on to
nne
(MT)
China Bauxite Imports China Bauxite Imports from Indonesia
Source: Bloomberg, ICICIdirect.com Research
Exhibit 31: YoY growth in bauxite imports (total and from Indonesia)
-23.6
53.3 48.8
-11.3
78.7
-16.6
61.7 55.6
-21.5
71.7
-40
-20
0
20
40
60
80
100
CY09 CY10 CY11 CY12 CY13
%
% Growth in China Imports % Growth in China Imports from Indonesia
Source: Bloomberg, ICICIdirect.com Research
LME warehousing rules change!!
Responding to the complaint of secondary metal manufacturers (primary metal purchasers) of long queues for aluminium metal delivery at LME warehouses and consequent artificial supply constraints, thereby resulting in high spot metal premiums, LME has proposed a new set of rules for warehousing aluminium metal. These new warehousing rules for aluminium metal are proposed to be implemented from April 1, 2014. The proposal operates by measuring all the metal loaded into a warehouse over a three-month period. If there is a queue of more than 50 calendar days the affected warehouse would be expected to deliver out additional metal based on a formula. For example, a warehouse currently required to deliver out a daily tonnage of 3,000 tonnes would, under the proposal, need to load out at least 1,500 tonnes per day more than it loads in. Additionally, if the current load-in rate of an affected warehouse exceeds the minimum load-out rate, then the warehouse would be required to deliver out tonnage equal to that excess.
Page 15ICICI Securities Ltd | Retail Equity Research
Financials Modest revenue growth in FY13-16E aided by higher sales volume
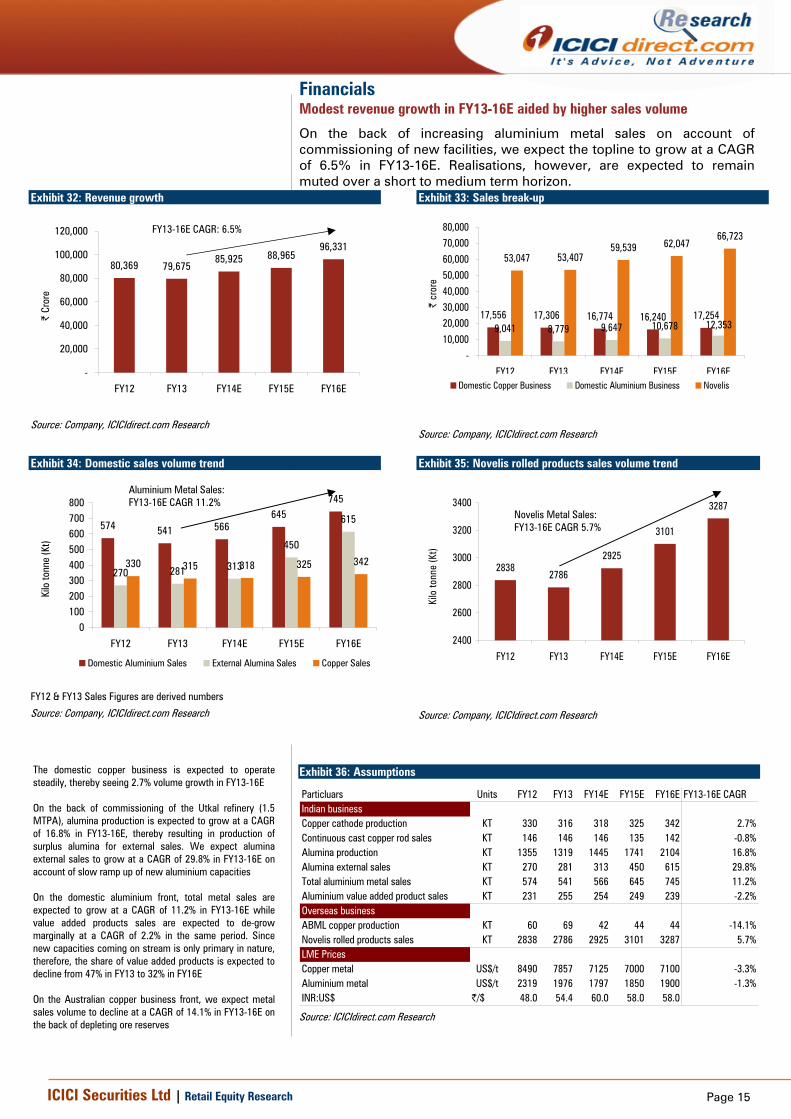
On the back of increasing aluminium metal sales on account of commissioning of new facilities, we expect the topline to grow at a CAGR of 6.5% in FY13-16E. Realisations, however, are expected to remain muted over a short to medium term horizon.
Exhibit 32: Revenue growth
80,369 79,67585,925 88,965
96,331
-
20,000
40,000
60,000
80,000
100,000
120,000
FY12 FY13 FY14E FY15E FY16E
| Cr
ore
Source: Company, ICICIdirect.com Research
Exhibit 33: Sales break-up
17,556 17,306 16,774 16,240 17,2549,041 8,779 9,647 10,678
53,047 53,40759,539 62,047
66,723
12,353
-10,000
20,00030,00040,000
50,00060,000
70,00080,000
FY12 FY13 FY14E FY15E FY16E
| cr
ore
Domestic Copper Business Domestic Aluminium Business Novelis
Source: Company, ICICIdirect.com Research
Exhibit 34: Domestic sales volume trend
574 541 566645
745
270 281 313
450
615
330 315 318 325 342
0100200300400500600700800
FY12 FY13 FY14E FY15E FY16E
Kilo
tonn
e (K
t)
Domestic Aluminium Sales External Alumina Sales Copper Sales
FY12 & FY13 Sales Figures are derived numbers Source: Company, ICICIdirect.com Research
Exhibit 35: Novelis rolled products sales volume trend
28382786
2925
3101
3287
2400
2600
2800
3000
3200
3400
FY12 FY13 FY14E FY15E FY16E
Kilo
tonn
e (K
t)
Source: Company, ICICIdirect.com Research
Exhibit 36: Assumptions
Particluars Units FY12 FY13 FY14E FY15E FY16E FY13-16E CAGRIndian businessCopper cathode production KT 330 316 318 325 342 2.7%Continuous cast copper rod sales KT 146 146 146 135 142 -0.8%Alumina production KT 1355 1319 1445 1741 2104 16.8%Alumina external sales KT 270 281 313 450 615 29.8%Total aluminium metal sales KT 574 541 566 645 745 11.2%Aluminium value added product sales KT 231 255 254 249 239 -2.2%Overseas businessABML copper production KT 60 69 42 44 44 -14.1%Novelis rolled products sales KT 2838 2786 2925 3101 3287 5.7%LME PricesCopper metal US$/t 8490 7857 7125 7000 7100 -3.3%Aluminium metal US$/t 2319 1976 1797 1850 1900 -1.3%INR:US$ |/$ 48.0 54.4 60.0 58.0 58.0
Source: ICICIdirect.com Research
FY13-16E CAGR: 6.5%
The domestic copper business is expected to operate steadily, thereby seeing 2.7% volume growth in FY13-16E On the back of commissioning of the Utkal refinery (1.5 MTPA), alumina production is expected to grow at a CAGR of 16.8% in FY13-16E, thereby resulting in production of surplus alumina for external sales. We expect alumina external sales to grow at a CAGR of 29.8% in FY13-16E on account of slow ramp up of new aluminium capacities On the domestic aluminium front, total metal sales are expected to grow at a CAGR of 11.2% in FY13-16E while value added products sales are expected to de-grow marginally at a CAGR of 2.2% in the same period. Since new capacities coming on stream is only primary in nature, therefore, the share of value added products is expected to decline from 47% in FY13 to 32% in FY16E On the Australian copper business front, we expect metal sales volume to decline at a CAGR of 14.1% in FY13-16E on the back of depleting ore reserves
Aluminium Metal Sales: FY13-16E CAGR 11.2%
Novelis Metal Sales: FY13-16E CAGR 5.7%
Page 16ICICI Securities Ltd | Retail Equity Research
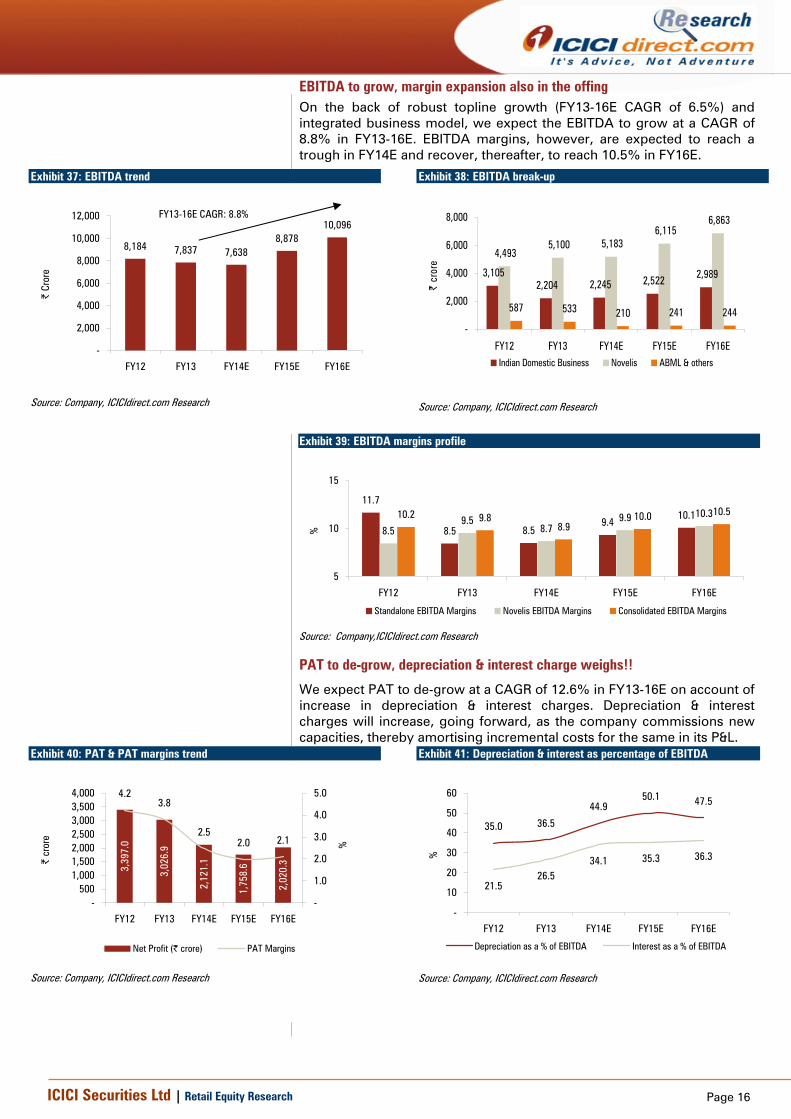
EBITDA to grow, margin expansion also in the offing On the back of robust topline growth (FY13-16E CAGR of 6.5%) and integrated business model, we expect the EBITDA to grow at a CAGR of 8.8% in FY13-16E. EBITDA margins, however, are expected to reach a trough in FY14E and recover, thereafter, to reach 10.5% in FY16E.
Exhibit 37: EBITDA trend
8,184 7,837 7,6388,878
10,096
-
2,000
4,000
6,000
8,000
10,000
12,000
FY12 FY13 FY14E FY15E FY16E
| Cr
ore
Source: Company, ICICIdirect.com Research
Exhibit 38: EBITDA break-up
3,1052,204 2,245 2,522 2,989
4,4935,100 5,183
6,1156,863
587 533 210 241 244-
2,000
4,000
6,000
8,000
FY12 FY13 FY14E FY15E FY16E
| cr
ore
Indian Domestic Business Novelis ABML & others
Source: Company, ICICIdirect.com Research
PAT to de-grow, depreciation & interest charge weighs!!
We expect PAT to de-grow at a CAGR of 12.6% in FY13-16E on account of increase in depreciation & interest charges. Depreciation & interest charges will increase, going forward, as the company commissions new capacities, thereby amortising incremental costs for the same in its P&L.
Exhibit 40: PAT & PAT margins trend
3,39
7.0
3,02
6.9
2,12
1.1
1,75
8.6
2,02
0.3
4.23.8
2.52.0 2.1
-500
1,0001,5002,0002,5003,0003,5004,000
FY12 FY13 FY14E FY15E FY16E
| cr
ore
-
1.0
2.0
3.0
4.0
5.0
%
Net Profit (| crore) PAT Margins
Source: Company, ICICIdirect.com Research
Exhibit 41: Depreciation & interest as percentage of EBITDA
35.0 36.5
44.950.1 47.5
21.526.5
34.1 35.3 36.3
-
10
20
30
40
50
60
FY12 FY13 FY14E FY15E FY16E
%
Depreciation as a % of EBITDA Interest as a % of EBITDA
Source: Company, ICICIdirect.com Research
Exhibit 39: EBITDA margins profile
11.7
8.5 8.59.4
10.18.5
9.58.7
9.9 10.310.2 9.88.9
10.0 10.5
5
10
15
FY12 FY13 FY14E FY15E FY16E
%
Standalone EBITDA Margins Novelis EBITDA Margins Consolidated EBITDA Margins
Source: Company,ICICIdirect.com Research
FY13-16E CAGR: 8.8%
Page 17ICICI Securities Ltd | Retail Equity Research
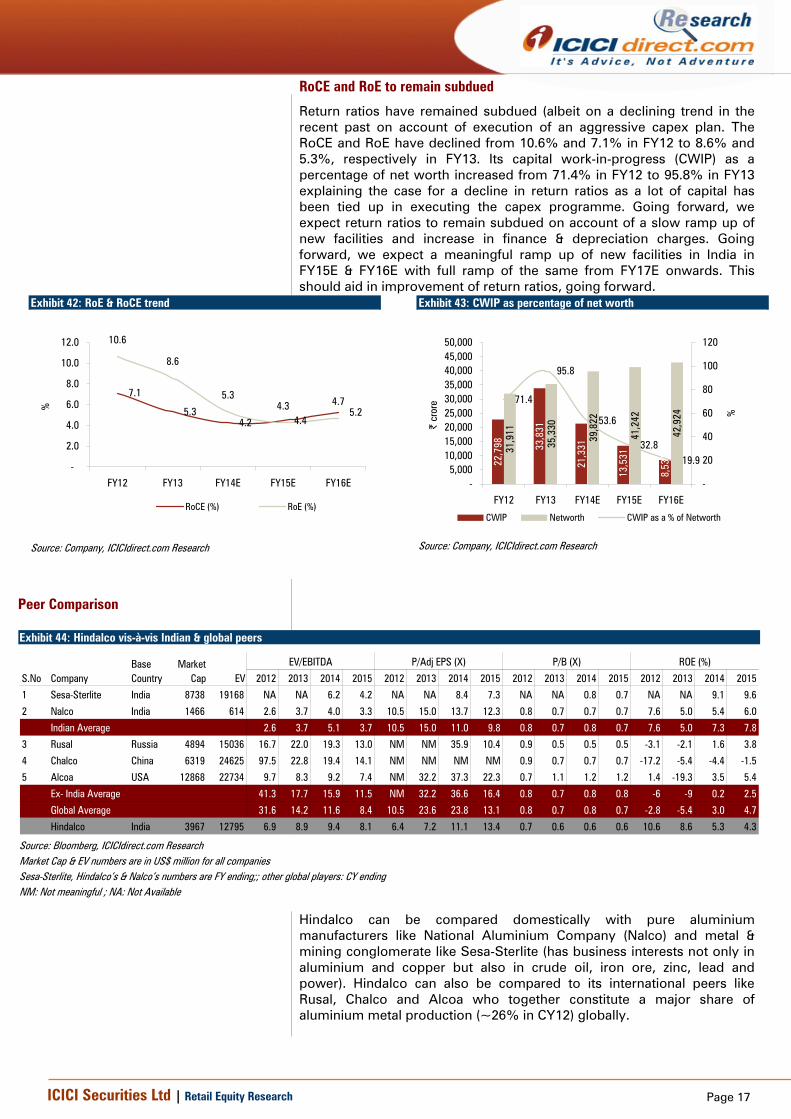
RoCE and RoE to remain subdued
Return ratios have remained subdued (albeit on a declining trend in the recent past on account of execution of an aggressive capex plan. The RoCE and RoE have declined from 10.6% and 7.1% in FY12 to 8.6% and 5.3%, respectively in FY13. Its capital work-in-progress (CWIP) as a percentage of net worth increased from 71.4% in FY12 to 95.8% in FY13 explaining the case for a decline in return ratios as a lot of capital has been tied up in executing the capex programme. Going forward, we expect return ratios to remain subdued on account of a slow ramp up of new facilities and increase in finance & depreciation charges. Going forward, we expect a meaningful ramp up of new facilities in India in FY15E & FY16E with full ramp of the same from FY17E onwards. This should aid in improvement of return ratios, going forward.
Exhibit 42: RoE & RoCE trend
7.1
5.34.2 4.4
5.2
10.6
8.6
5.34.3 4.7
-
2.0
4.0
6.0
8.0
10.0
12.0
FY12 FY13 FY14E FY15E FY16E
%
RoCE (%) RoE (%)
Source: Company, ICICIdirect.com Research
Exhibit 43: CWIP as percentage of net worth
22,7
98 33,8
31
21,3
31
13,5
31
8,53
131,9
11
35,3
30
39,8
22
41,2
42
42,9
24
71.4
95.8
53.6
32.819.9
-5,000
10,00015,00020,00025,00030,00035,00040,00045,00050,000
FY12 FY13 FY14E FY15E FY16E
| cr
ore
-
20
40
60
80
100
120
%
CWIP Networth CWIP as a % of Networth
Source: Company, ICICIdirect.com Research
Peer Comparison
Exhibit 44: Hindalco vis-à-vis Indian & global peers
2012 2013 2014 2015 2012 2013 2014 2015 2012 2013 2014 2015 2012 2013 2014 2015
1 Sesa-Sterlite India 8738 19168 NA NA 6.2 4.2 NA NA 8.4 7.3 NA NA 0.8 0.7 NA NA 9.1 9.6
2 Nalco India 1466 614 2.6 3.7 4.0 3.3 10.5 15.0 13.7 12.3 0.8 0.7 0.7 0.7 7.6 5.0 5.4 6.0
Indian Average 2.6 3.7 5.1 3.7 10.5 15.0 11.0 9.8 0.8 0.7 0.8 0.7 7.6 5.0 7.3 7.8
3 Rusal Russia 4894 15036 16.7 22.0 19.3 13.0 NM NM 35.9 10.4 0.9 0.5 0.5 0.5 -3.1 -2.1 1.6 3.8
4 Chalco China 6319 24625 97.5 22.8 19.4 14.1 NM NM NM NM 0.9 0.7 0.7 0.7 -17.2 -5.4 -4.4 -1.5
5 Alcoa USA 12868 22734 9.7 8.3 9.2 7.4 NM 32.2 37.3 22.3 0.7 1.1 1.2 1.2 1.4 -19.3 3.5 5.4
Ex- India Average 41.3 17.7 15.9 11.5 NM 32.2 36.6 16.4 0.8 0.7 0.8 0.8 -6 -9 0.2 2.5
Global Average 31.6 14.2 11.6 8.4 10.5 23.6 23.8 13.1 0.8 0.7 0.8 0.7 -2.8 -5.4 3.0 4.7
Hindalco India 3967 12795 6.9 8.9 9.4 8.1 6.4 7.2 11.1 13.4 0.7 0.6 0.6 0.6 10.6 8.6 5.3 4.3
S.No CompanyBase Country
Market Cap EV
EV/EBITDA P/Adj EPS (X) P/B (X) ROE (%)
Source: Bloomberg, ICICIdirect.com Research Market Cap & EV numbers are in US$ million for all companies Sesa-Sterlite, Hindalco’s & Nalco’s numbers are FY ending;; other global players: CY ending NM: Not meaningful ; NA: Not Available
Hindalco can be compared domestically with pure aluminium manufacturers like National Aluminium Company (Nalco) and metal & mining conglomerate like Sesa-Sterlite (has business interests not only in aluminium and copper but also in crude oil, iron ore, zinc, lead and power). Hindalco can also be compared to its international peers like Rusal, Chalco and Alcoa who together constitute a major share of aluminium metal production (~26% in CY12) globally.
Rectangle
Page 18ICICI Securities Ltd | Retail Equity Research
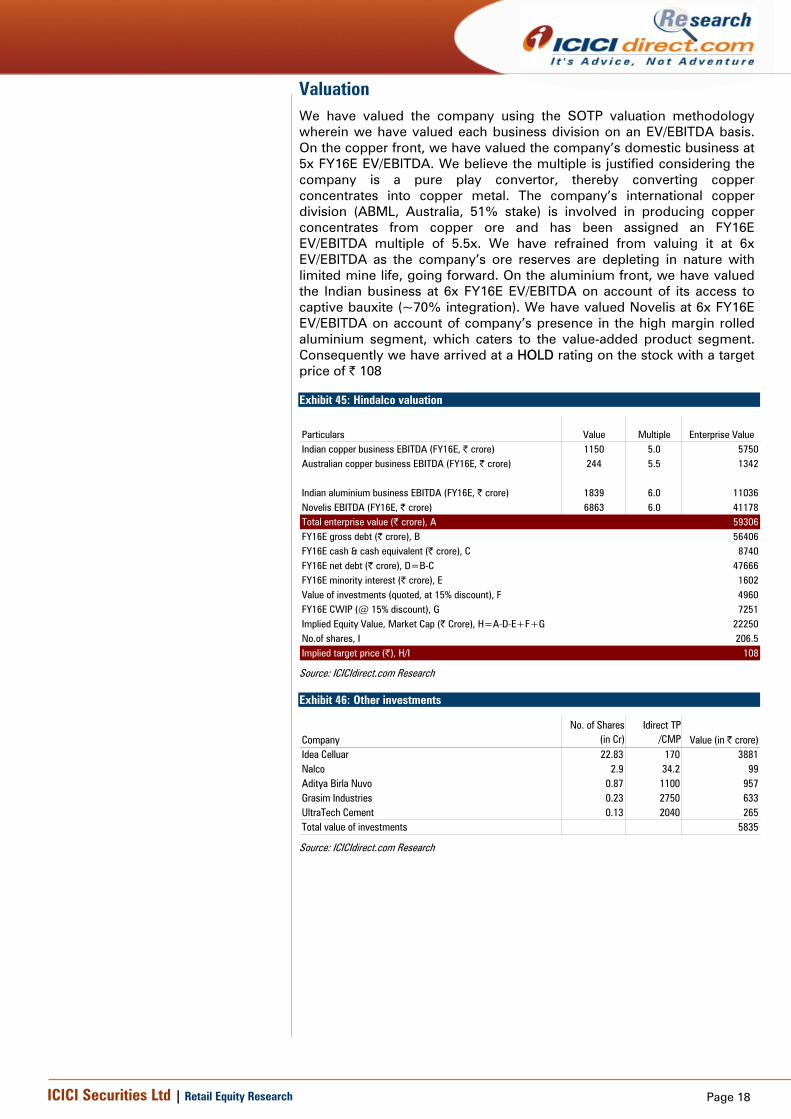
Valuation We have valued the company using the SOTP valuation methodology wherein we have valued each business division on an EV/EBITDA basis. On the copper front, we have valued the company’s domestic business at 5x FY16E EV/EBITDA. We believe the multiple is justified considering the company is a pure play convertor, thereby converting copper concentrates into copper metal. The company’s international copper division (ABML, Australia, 51% stake) is involved in producing copper concentrates from copper ore and has been assigned an FY16E EV/EBITDA multiple of 5.5x. We have refrained from valuing it at 6x EV/EBITDA as the company’s ore reserves are depleting in nature with limited mine life, going forward. On the aluminium front, we have valued the Indian business at 6x FY16E EV/EBITDA on account of its access to captive bauxite (~70% integration). We have valued Novelis at 6x FY16E EV/EBITDA on account of company’s presence in the high margin rolled aluminium segment, which caters to the value-added product segment. Consequently we have arrived at a HOLD rating on the stock with a target price of | 108
Exhibit 45: Hindalco valuation
Particulars Value Multiple Enterprise ValueIndian copper business EBITDA (FY16E, | crore) 1150 5.0 5750Australian copper business EBITDA (FY16E, | crore) 244 5.5 1342
Indian aluminium business EBITDA (FY16E, | crore) 1839 6.0 11036Novelis EBITDA (FY16E, | crore) 6863 6.0 41178Total enterprise value (| crore), A 59306FY16E gross debt (| crore), B 56406FY16E cash & cash equivalent (| crore), C 8740FY16E net debt (| crore), D=B-C 47666FY16E minority interest (| crore), E 1602Value of investments (quoted, at 15% discount), F 4960FY16E CWIP (@ 15% discount), G 7251Implied Equity Value, Market Cap (| Crore), H=A-D-E+F+G 22250No.of shares, I 206.5Implied target price (|), H/I 108
Source: ICICIdirect.com Research
Exhibit 46: Other investments
CompanyNo. of Shares
(in Cr)Idirect TP
/CMP Value (in | crore)Idea Celluar 22.83 170 3881Nalco 2.9 34.2 99Aditya Birla Nuvo 0.87 1100 957Grasim Industries 0.23 2750 633UltraTech Cement 0.13 2040 265Total value of investments 5835
Source: ICICIdirect.com Research
Page 19ICICI Securities Ltd | Retail Equity Research
Average trading multiples
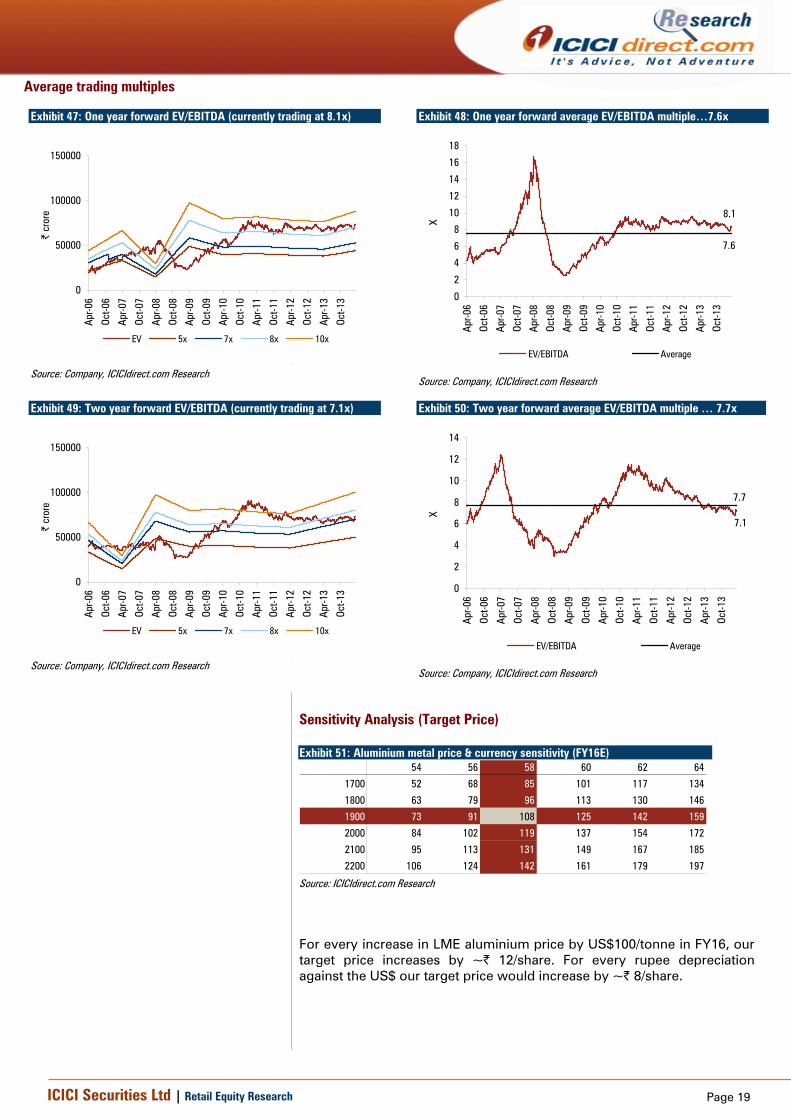
Exhibit 47: One year forward EV/EBITDA (currently trading at 8.1x)
0
50000
100000
150000
Apr-0
6
Oct-0
6
Apr-0
7
Oct-0
7
Apr-0
8
Oct-0
8
Apr-0
9
Oct-0
9
Apr-1
0
Oct-1
0
Apr-1
1
Oct-1
1
Apr-1
2
Oct-1
2
Apr-1
3
Oct-1
3
| cr
ore
EV 5x 7x 8x 10x
Source: Company, ICICIdirect.com Research
Exhibit 48: One year forward average EV/EBITDA multiple…7.6x
8.1
7.6
0
2
4
6
8
10
12
14
16
18
Apr-0
6
Oct-0
6
Apr-0
7
Oct-0
7
Apr-0
8
Oct-0
8
Apr-0
9
Oct-0
9
Apr-1
0
Oct-1
0
Apr-1
1
Oct-1
1
Apr-1
2
Oct-1
2
Apr-1
3
Oct-1
3
X
EV/EBITDA Average
Source: Company, ICICIdirect.com Research
Exhibit 49: Two year forward EV/EBITDA (currently trading at 7.1x)
0
50000
100000
150000
Apr-0
6
Oct-0
6
Apr-0
7
Oct-0
7
Apr-0
8
Oct-0
8
Apr-0
9
Oct-0
9
Apr-1
0
Oct-1
0
Apr-1
1
Oct-1
1
Apr-1
2
Oct-1
2
Apr-1
3
Oct-1
3
| cr
ore
EV 5x 7x 8x 10x
Source: Company, ICICIdirect.com Research
Exhibit 50: Two year forward average EV/EBITDA multiple … 7.7x
7.1
7.7
0
2
4
6
8
10
12
14
Apr-0
6
Oct-0
6
Apr-0
7
Oct-0
7
Apr-0
8
Oct-0
8
Apr-0
9
Oct-0
9
Apr-1
0
Oct-1
0
Apr-1
1
Oct-1
1
Apr-1
2
Oct-1
2
Apr-1
3
Oct-1
3
X
EV/EBITDA Average
Source: Company, ICICIdirect.com Research
Sensitivity Analysis (Target Price) Exhibit 51: Aluminium metal price & currency sensitivity (FY16E)
54 56 58 60 62 64
1700 52 68 85 101 117 134
1800 63 79 96 113 130 146
1900 73 91 108 125 142 159
2000 84 102 119 137 154 172
2100 95 113 131 149 167 185
2200 106 124 142 161 179 197
Source: ICICIdirect.com Research
For every increase in LME aluminium price by US$100/tonne in FY16, our target price increases by ~| 12/share. For every rupee depreciation against the US$ our target price would increase by ~| 8/share.
Page 20ICICI Securities Ltd | Retail Equity Research
Risks & concerns Volatility in aluminium prices
After the sub-prime crisis there has been significant volatility in base metal prices on the LME. Aluminium prices have also witnessed significant volatility wherein prices touched an all-time high of US$3271.3 per tonne in July 2008. However, on account of the global financial crisis of 2008, within eight months aluminium prices on the LME declined sharply by ~60% to US$1,251.8 per tonne in February 2009. The metal did manage to gain some of the lost ground in subsequent years to US$2785.5/tonne during May 2011 but has steeply fallen since. In CY13 itself, aluminium prices have fallen ~14%. Aluminium prices on the LME are currently trading weak at ~1700/tonne on account of elevated production level in China and subdued demand scenario globally. We have modelled LME prices at US$1797/tonne, US$1850/tonne and US$1900/tonne for FY14E, FY15E and FY16E, respectively. Any sharp decline of the same on the LME is likely to adversely impact our estimates negatively. For every drop in LME aluminium price by US$100/tonne in FY16 our target price reduces by ~| 12/share. Delay in ramp up/commissioning of projects
Hindalco has already faced a delay of two to three years in commissioning its projects. After delays, the Mahan Aluminium Smelter and Utkal Alumina Refinery were commissioned during H1FY14 though their commercial operational dates are yet to be released. In case of the remaining projects (which are yet to be commissioned) any further delays in commissioning due to issues related to captive supplies, regulatory hurdles or local protests could reduce our volume estimates for the company and affect earnings negatively. At the consolidated level, we have assumed total metal sales of 3.5 MT in FY14E, 3.7 MT in FY15E and 4.0 MT in FY16E, respectively. For every 100 KT decline in aluminium metal sales volume in FY16 our target price reduces by ~| 6/share. Adverse movement in currency
Hindalco’s earnings have high sensitivity to exchange rate fluctuations and any steep appreciation of the rupee against the US dollar would reduce the realisation in INR terms and adversely impact estimates. We have assumed the exchange rate of US$: INR - 60, US$: INR - 58 and US$: INR - 58 in FY14E, FY15E and FY16E, respectively. For every rupee appreciation against the US$ our target price reduces by ~| 8/share. Increase in CoP of Hindalco and Novelis
Over the last few years there has been a notable increase in cost of production for manufacturing aluminium. Any further significant increase in key inputs such as pitch, caustic soda and aluminium fluoride can increase the CoP of aluminium, thereby impacting the profitability of domestic operations. For Novelis, margins could be negatively impacted due to higher scrap costs and lower product premiums. Impact of MMDR Bill
In July 2011, the Group of ministers (GoM) approved the draft Mines and Mineral (Development & Regulation) Bill. The aforesaid bill seeks to replace the more than half-a-century-old law under the same name and was tabled in Parliament in December 2011. The new rule envisages the mineral extraction companies spending an amount equal to the current royalty payout for community development of the area in which they are mining minerals. Though the rates of royalty on bauxite are relative low (0.5% of LME aluminium metal price chargeable on the contained aluminium metal in ore produced) any increase in the same would have an adverse impact on the company’s profitability.
Page 21ICICI Securities Ltd | Retail Equity Research
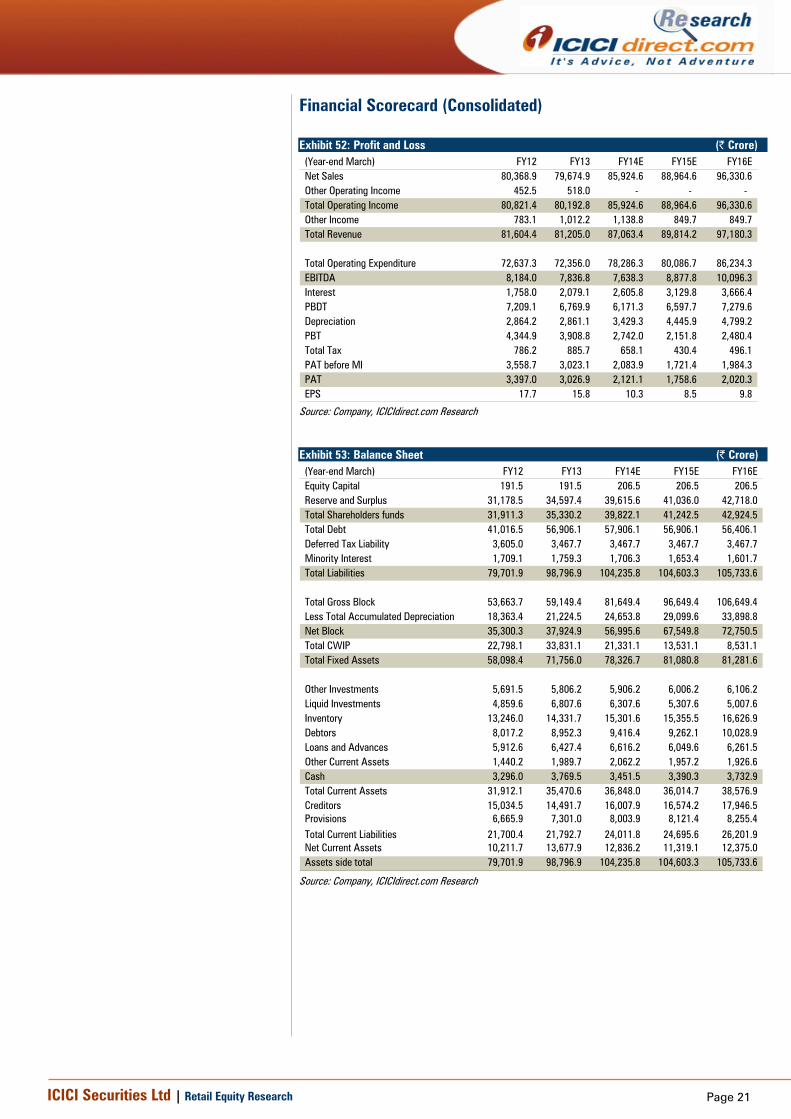
Financial Scorecard (Consolidated) Exhibit 52: Profit and Loss (| Crore)
(Year-end March) FY12 FY13 FY14E FY15E FY16ENet Sales 80,368.9 79,674.9 85,924.6 88,964.6 96,330.6 Other Operating Income 452.5 518.0 - - - Total Operating Income 80,821.4 80,192.8 85,924.6 88,964.6 96,330.6 Other Income 783.1 1,012.2 1,138.8 849.7 849.7 Total Revenue 81,604.4 81,205.0 87,063.4 89,814.2 97,180.3
Total Operating Expenditure 72,637.3 72,356.0 78,286.3 80,086.7 86,234.3 EBITDA 8,184.0 7,836.8 7,638.3 8,877.8 10,096.3 Interest 1,758.0 2,079.1 2,605.8 3,129.8 3,666.4 PBDT 7,209.1 6,769.9 6,171.3 6,597.7 7,279.6 Depreciation 2,864.2 2,861.1 3,429.3 4,445.9 4,799.2 PBT 4,344.9 3,908.8 2,742.0 2,151.8 2,480.4 Total Tax 786.2 885.7 658.1 430.4 496.1 PAT before MI 3,558.7 3,023.1 2,083.9 1,721.4 1,984.3 PAT 3,397.0 3,026.9 2,121.1 1,758.6 2,020.3 EPS 17.7 15.8 10.3 8.5 9.8
Source: Company, ICICIdirect.com Research
Exhibit 53: Balance Sheet (| Crore) (Year-end March) FY12 FY13 FY14E FY15E FY16EEquity Capital 191.5 191.5 206.5 206.5 206.5 Reserve and Surplus 31,178.5 34,597.4 39,615.6 41,036.0 42,718.0 Total Shareholders funds 31,911.3 35,330.2 39,822.1 41,242.5 42,924.5 Total Debt 41,016.5 56,906.1 57,906.1 56,906.1 56,406.1 Deferred Tax Liability 3,605.0 3,467.7 3,467.7 3,467.7 3,467.7 Minority Interest 1,709.1 1,759.3 1,706.3 1,653.4 1,601.7 Total Liabilities 79,701.9 98,796.9 104,235.8 104,603.3 105,733.6
Total Gross Block 53,663.7 59,149.4 81,649.4 96,649.4 106,649.4 Less Total Accumulated Depreciation 18,363.4 21,224.5 24,653.8 29,099.6 33,898.8 Net Block 35,300.3 37,924.9 56,995.6 67,549.8 72,750.5 Total CWIP 22,798.1 33,831.1 21,331.1 13,531.1 8,531.1 Total Fixed Assets 58,098.4 71,756.0 78,326.7 81,080.8 81,281.6
Other Investments 5,691.5 5,806.2 5,906.2 6,006.2 6,106.2 Liquid Investments 4,859.6 6,807.6 6,307.6 5,307.6 5,007.6 Inventory 13,246.0 14,331.7 15,301.6 15,355.5 16,626.9 Debtors 8,017.2 8,952.3 9,416.4 9,262.1 10,028.9 Loans and Advances 5,912.6 6,427.4 6,616.2 6,049.6 6,261.5 Other Current Assets 1,440.2 1,989.7 2,062.2 1,957.2 1,926.6 Cash 3,296.0 3,769.5 3,451.5 3,390.3 3,732.9 Total Current Assets 31,912.1 35,470.6 36,848.0 36,014.7 38,576.9 Creditors 15,034.5 14,491.7 16,007.9 16,574.2 17,946.5 Provisions 6,665.9 7,301.0 8,003.9 8,121.4 8,255.4 Total Current Liabilities 21,700.4 21,792.7 24,011.8 24,695.6 26,201.9 Net Current Assets 10,211.7 13,677.9 12,836.2 11,319.1 12,375.0 Assets side total 79,701.9 98,796.9 104,235.8 104,603.3 105,733.6
Source: Company, ICICIdirect.com Research
Page 22ICICI Securities Ltd | Retail Equity Research
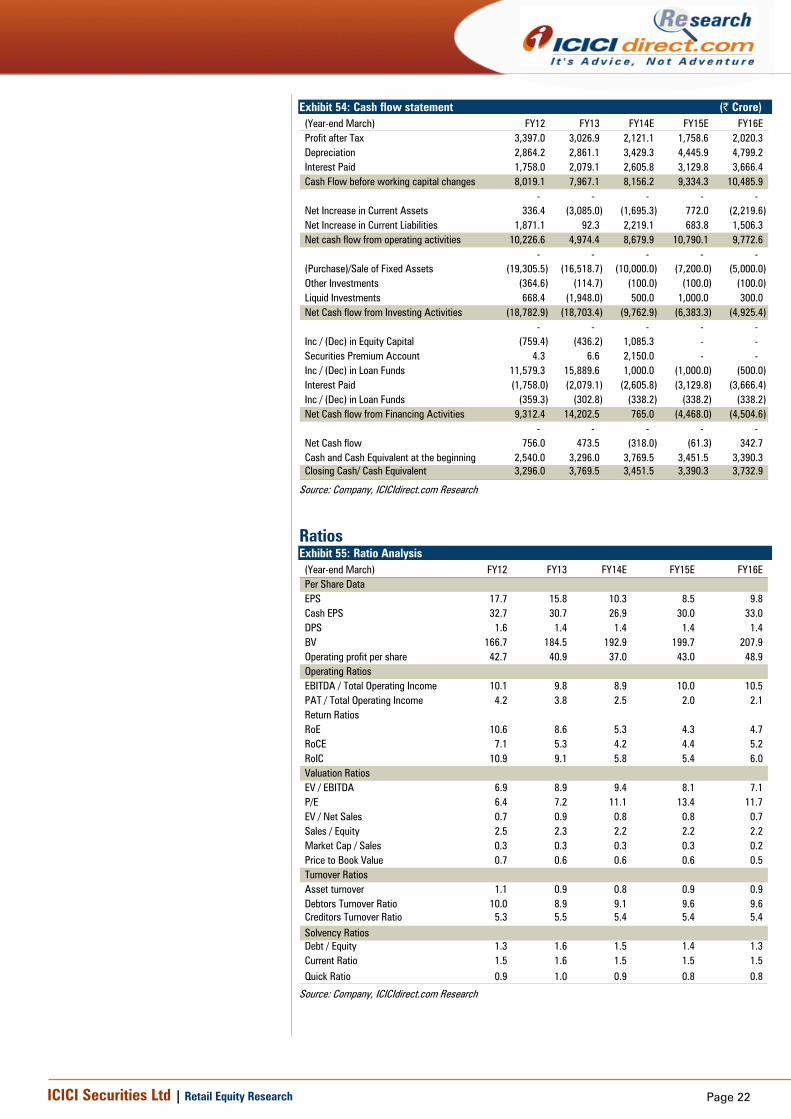
Exhibit 54: Cash flow statement (| Crore)
(Year-end March) FY12 FY13 FY14E FY15E FY16EProfit after Tax 3,397.0 3,026.9 2,121.1 1,758.6 2,020.3 Depreciation 2,864.2 2,861.1 3,429.3 4,445.9 4,799.2 Interest Paid 1,758.0 2,079.1 2,605.8 3,129.8 3,666.4 Cash Flow before working capital changes 8,019.1 7,967.1 8,156.2 9,334.3 10,485.9
- - - - - Net Increase in Current Assets 336.4 (3,085.0) (1,695.3) 772.0 (2,219.6) Net Increase in Current Liabilities 1,871.1 92.3 2,219.1 683.8 1,506.3 Net cash flow from operating activities 10,226.6 4,974.4 8,679.9 10,790.1 9,772.6
- - - - - (Purchase)/Sale of Fixed Assets (19,305.5) (16,518.7) (10,000.0) (7,200.0) (5,000.0) Other Investments (364.6) (114.7) (100.0) (100.0) (100.0) Liquid Investments 668.4 (1,948.0) 500.0 1,000.0 300.0 Net Cash flow from Investing Activities (18,782.9) (18,703.4) (9,762.9) (6,383.3) (4,925.4)
- - - - - Inc / (Dec) in Equity Capital (759.4) (436.2) 1,085.3 - - Securities Premium Account 4.3 6.6 2,150.0 - - Inc / (Dec) in Loan Funds 11,579.3 15,889.6 1,000.0 (1,000.0) (500.0) Interest Paid (1,758.0) (2,079.1) (2,605.8) (3,129.8) (3,666.4) Inc / (Dec) in Loan Funds (359.3) (302.8) (338.2) (338.2) (338.2) Net Cash flow from Financing Activities 9,312.4 14,202.5 765.0 (4,468.0) (4,504.6)
- - - - - Net Cash flow 756.0 473.5 (318.0) (61.3) 342.7 Cash and Cash Equivalent at the beginning 2,540.0 3,296.0 3,769.5 3,451.5 3,390.3 Closing Cash/ Cash Equivalent 3,296.0 3,769.5 3,451.5 3,390.3 3,732.9
Source: Company, ICICIdirect.com Research
Ratios Exhibit 55: Ratio Analysis
(Year-end March) FY12 FY13 FY14E FY15E FY16EPer Share DataEPS 17.7 15.8 10.3 8.5 9.8 Cash EPS 32.7 30.7 26.9 30.0 33.0 DPS 1.6 1.4 1.4 1.4 1.4 BV 166.7 184.5 192.9 199.7 207.9 Operating profit per share 42.7 40.9 37.0 43.0 48.9 Operating RatiosEBITDA / Total Operating Income 10.1 9.8 8.9 10.0 10.5 PAT / Total Operating Income 4.2 3.8 2.5 2.0 2.1 Return RatiosRoE 10.6 8.6 5.3 4.3 4.7 RoCE 7.1 5.3 4.2 4.4 5.2 RoIC 10.9 9.1 5.8 5.4 6.0 Valuation RatiosEV / EBITDA 6.9 8.9 9.4 8.1 7.1 P/E 6.4 7.2 11.1 13.4 11.7 EV / Net Sales 0.7 0.9 0.8 0.8 0.7 Sales / Equity 2.5 2.3 2.2 2.2 2.2 Market Cap / Sales 0.3 0.3 0.3 0.3 0.2 Price to Book Value 0.7 0.6 0.6 0.6 0.5 Turnover RatiosAsset turnover 1.1 0.9 0.8 0.9 0.9 Debtors Turnover Ratio 10.0 8.9 9.1 9.6 9.6 Creditors Turnover Ratio 5.3 5.5 5.4 5.4 5.4 Solvency RatiosDebt / Equity 1.3 1.6 1.5 1.4 1.3 Current Ratio 1.5 1.6 1.5 1.5 1.5 Quick Ratio 0.9 1.0 0.9 0.8 0.8
Source: Company, ICICIdirect.com Research
Page 23ICICI Securities Ltd | Retail Equity Research
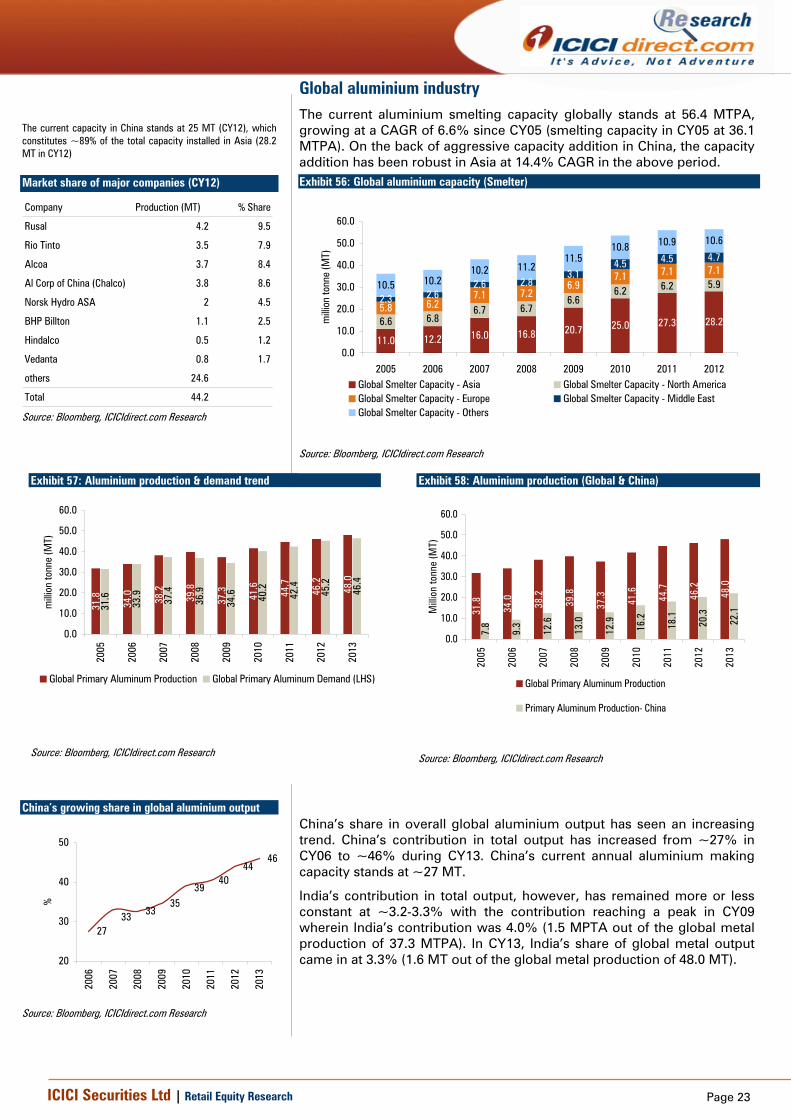
Global aluminium industry The current aluminium smelting capacity globally stands at 56.4 MTPA, growing at a CAGR of 6.6% since CY05 (smelting capacity in CY05 at 36.1 MTPA). On the back of aggressive capacity addition in China, the capacity addition has been robust in Asia at 14.4% CAGR in the above period.
Exhibit 57: Aluminium production & demand trend
31.8
34.0 38.2
39.8
37.3 41.6
44.7
46.2
48.0
31.6
33.9
37.4
36.9
34.6 40
.2
42.4
45.2
46.4
0.0
10.0
20.0
30.0
40.0
50.0
60.0
2005
2006
2007
2008
2009
2010
2011
2012
2013
milli
on to
nne
(MT)
Global Primary Aluminum Production Global Primary Aluminum Demand (LHS)
Source: Bloomberg, ICICIdirect.com Research
Exhibit 58: Aluminium production (Global & China) 31
.8
34.0 38.2
39.8
37.3 41.6
44.7
46.2
48.0
7.8
9.3
12.6
13.0
12.9
16.2
18.1
20.3
22.1
0.0
10.0
20.0
30.0
40.0
50.0
60.0
2005
2006
2007
2008
2009
2010
2011
2012
2013
Mill
ion
tonn
e (M
T)
Global Primary Aluminum Production
Primary Aluminum Production- China
Source: Bloomberg, ICICIdirect.com Research
China’s share in overall global aluminium output has seen an increasing trend. China’s contribution in total output has increased from ~27% in CY06 to ~46% during CY13. China’s current annual aluminium making capacity stands at ~27 MT.
India’s contribution in total output, however, has remained more or less constant at ~3.2-3.3% with the contribution reaching a peak in CY09 wherein India’s contribution was 4.0% (1.5 MPTA out of the global metal production of 37.3 MTPA). In CY13, India’s share of global metal output came in at 3.3% (1.6 MT out of the global metal production of 48.0 MT).
Exhibit 56: Global aluminium capacity (Smelter)
11.0 12.2 16.0 16.8 20.7 25.0 27.3 28.26.6 6.86.7 6.7
6.66.2 6.2 5.9
5.8 6.27.1 7.2
6.97.1 7.1 7.1
2.3 2.62.6 2.8
3.14.5 4.5 4.7
10.5 10.210.2 11.2
11.510.8 10.9 10.6
0.0
10.0
20.0
30.0
40.0
50.0
60.0
2005 2006 2007 2008 2009 2010 2011 2012
milli
on to
nne
(MT)
Global Smelter Capacity - Asia Global Smelter Capacity - North AmericaGlobal Smelter Capacity - Europe Global Smelter Capacity - Middle EastGlobal Smelter Capacity - Others
Source: Bloomberg, ICICIdirect.com Research
The current capacity in China stands at 25 MT (CY12), which constitutes ~89% of the total capacity installed in Asia (28.2 MT in CY12)
Market share of major companies (CY12)
Company Production (MT) % Share
Rusal 4.2 9.5
Rio Tinto 3.5 7.9
Alcoa 3.7 8.4
Al Corp of China (Chalco) 3.8 8.6
Norsk Hydro ASA 2 4.5
BHP Billton 1.1 2.5
Hindalco 0.5 1.2
Vedanta 0.8 1.7
others 24.6
Total 44.2 Source: Bloomberg, ICICIdirect.com Research
China’s growing share in global aluminium output
27
3335
4044
46
39
33
20
30
40
50
2006
2007
2008
2009
2010
2011
2012
2013
%
Source: Bloomberg, ICICIdirect.com Research

Page 24ICICI Securities Ltd | Retail Equity Research
RATING RATIONALE ICICIdirect.com endeavours to provide objective opinions and recommendations. ICICIdirect.com assigns ratings to its stocks according to their notional target price vs. current market price and then categorises them as Strong Buy, Buy, Hold and Sell. The performance horizon is two years unless specified and the notional target price is defined as the analysts' valuation for a stock. Strong Buy: >15%/20% for large caps/midcaps, respectively; with high conviction Buy: Between 10% and 15%/20% for large caps/midcaps, respectively; Hold: Up to +/-10%; Sell: -10% or more;
Pankaj Pandey Head – Research [email protected]
ICICIdirect.com Research Desk, ICICI Securities Limited, 1st Floor, Akruti Trade Centre, Road No. 7, MIDC, Andheri (East) Mumbai – 400 093
ANALYST CERTIFICATION We /I, Dewang Sanghavi MBA (FIN) Shashank Kanodia MBA (CM) research analysts, authors and the names subscribed to this report, hereby certify that all of the views expressed in this research report accurately reflect our personal views about any and all of the subject issuer(s) or securities. We also certify that no part of our compensation was, is, or will be directly or indirectly related to the specific recommendation(s) or view(s) in this report. Analysts aren't registered as research analysts by FINRA and might not be an associated person of the ICICI Securities Inc.
Disclosures: ICICI Securities Limited (ICICI Securities) and its affiliates are a full-service, integrated investment banking, investment management and brokerage and financing group. We along with affiliates are leading underwriter of securities and participate in virtually all securities trading markets in India. We and our affiliates have investment banking and other business relationship with a significant percentage of companies covered by our Investment Research Department. Our research professionals provide important input into our investment banking and other business selection processes. ICICI Securities generally prohibits its analysts, persons reporting to analysts and their dependent family members from maintaining a financial interest in the securities or derivatives of any companies that the analysts cover.
The information and opinions in this report have been prepared by ICICI Securities and are subject to change without any notice. The report and information contained herein is strictly confidential and meant solely for the selected recipient and may not be altered in any way, transmitted to, copied or distributed, in part or in whole, to any other person or to the media or reproduced in any form, without prior written consent of ICICI Securities. While we would endeavour to update the information herein on reasonable basis, ICICI Securities, its subsidiaries and associated companies, their directors and employees (“ICICI Securities and affiliates”) are under no obligation to update or keep the information current. Also, there may be regulatory, compliance or other reasons that may prevent ICICI Securities from doing so. Non-rated securities indicate that rating on a particular security has been suspended temporarily and such suspension is in compliance with applicable regulations and/or ICICI Securities policies, in circumstances where ICICI Securities is acting in an advisory capacity to this company, or in certain other circumstances.
This report is based on information obtained from public sources and sources believed to be reliable, but no independent verification has been made nor is its accuracy or completeness guaranteed. This report and information herein is solely for informational purpose and may not be used or considered as an offer document or solicitation of offer to buy or sell or subscribe for securities or other financial instruments. Though disseminated to all the customers simultaneously, not all customers may receive this report at the same time. ICICI Securities will not treat recipients as customers by virtue of their receiving this report. Nothing in this report constitutes investment, legal, accounting and tax advice or a representation that any investment or strategy is suitable or appropriate to your specific circumstances. The securities discussed and opinions expressed in this report may not be suitable for all investors, who must make their own investment decisions, based on their own investment objectives, financial positions and needs of specific recipient. This may not be taken in substitution for the exercise of independent judgment by any recipient. The recipient should independently evaluate the investment risks. The value and return of investment may vary because of changes in interest rates, foreign exchange rates or any other reason. ICICI Securities and affiliates accept no liabilities for any loss or damage of any kind arising out of the use of this report. Past performance is not necessarily a guide to future performance. Investors are advised to see Risk Disclosure Document to understand the risks associated before investing in the securities markets. Actual results may differ materially from those set forth in projections. Forward-looking statements are not predictions and may be subject to change without notice.
ICICI Securities and its affiliates might have managed or co-managed a public offering for the subject company in the preceding twelve months. ICICI Securities and affiliates might have received compensation from the companies mentioned in the report during the period preceding twelve months from the date of this report for services in respect of public offerings, corporate finance, investment banking or other advisory services in a merger or specific transaction. It is confirmed that Dewang Sanghavi MBA (FIN) Shashank Kanodia MBA (CM) research analysts and the authors of this report have not received any compensation from the companies mentioned in the report in the preceding twelve months. Our research professionals are paid in part based on the profitability of ICICI Securities, which include earnings from Investment Banking and other business.
ICICI Securities or its subsidiaries collectively do not own 1% or more of the equity securities of the Company mentioned in the report as of the last day of the month preceding the publication of the research report.
It is confirmed that Dewang Sanghavi MBA (FIN) Shashank Kanodia MBA (CM) research analysts and the authors of this report or any of their family members does not serve as an officer, director or advisory board member of the companies mentioned in the report.
ICICI Securities may have issued other reports that are inconsistent with and reach different conclusion from the information presented in this report. ICICI Securities and affiliates may act upon or make use of information contained in the report prior to the publication thereof.
This report is not directed or intended for distribution to, or use by, any person or entity who is a citizen or resident of or located in any locality, state, country or other jurisdiction, where such distribution, publication, availability or use would be contrary to law, regulation or which would subject ICICI Securities and affiliates to any registration or licensing requirement within such jurisdiction. The securities described herein may or may not be eligible for sale in all jurisdictions or to certain category of investors. Persons in whose possession this document may come are required to inform themselves of and to observe such restriction.