January 27, 2016 Rating Matrix Bharat Electronics...
46
January 27, 2016 Initiating Coverage ICICI Securities Ltd | Retail Equity Research Proxy play on emerging defence sector… Bharat Electronics (BEL), a Navratna public sector enterprise, is one of the oldest companies in the Indian defence sector. Renowned for its professional management and strong execution capabilities, BEL stands out among select well-run government companies and, especially, defence public sector units (DPSUs). Over the years, the company has emerged as a market leader in the Indian defence electronics segment with ~44% market share. BEL’s consistent growth in order book, topline & bottomline over the last 10 years (CAGR of 13.4%, 7.3% & 8% respectively) in FY06-15, despite a weak procurement cycle and snail- paced decision making showcases the company’s robust fundamentals. Core competency in niche areas of electronics, diverse presence across geographies, debt-free status, best-in-class working capital cycle, reliability in execution and natural beneficiary of critical technologies developed by Defence Research and Development Organization (DRDO) places the company in a sweet spot. Strong moat, best placed to capitalise on fledgling defence sector Defence electronics is one of the most critical areas for capability building of armed forces. Historically, a large part of defence capital spends (45- 60%) has been in this segment. High-end technologies in the electronics segment, long gestation periods, heavy capital requirements, specific requirements of armed forces and secrecy related to defence projects act as key entry barriers in this segment. This gives companies like BEL a strong competitive advantage over any upcoming local and foreign completion. With the central government’s strong commitment on arming defence forces with state-of-the-art equipment and reducing the import bill to at most 30% (currently 70% of total expenditure), order inflows in this segment are set to embark on a new growth trajectory. With planned capex of over | 1500 crore in FY16E-18E, BEL is well placed to capitalise on the fledgling defence sector. Healthy balance sheet, robust prospects, quality play! BEL has a strong balance sheet with near nil debt and cash balance of | 6038 crore (FY15). Accelerated order inflow and BEL’s consistent performance over the past 10 years, gives us reasonable confidence on the robust prospects of the company. With moderate capital expenditure of | 1500 crore over the next three years (FY16E-19E), a consistent dividend payout ratio of 20%, average RoEs, RoCEs of 19.3%, 37.8%, respectively, over the past 10 years and no equity dilution in its history, we believe BEL is a quality play and is on a strong footing. Accordingly, we expect BEL to deliver sales and PAT CAGR of 13.5% and 8.6% respectively, in FY15-18E. We value BEL at | 1552 i.e. 25x P/E on FY18E EPS of | 62.1 and initiate coverage with a BUY recommendation. Exhibit 1: Valuation Metrics (| crore) FY14 FY15 FY16E FY17E FY18E Revenues 6,276 6,843 7,490 8,863 10,003 EBITDA 891 1,143 1,077 1,275 1,390 Net Profit 932 1,167 1,215 1,401 1,489.8 EPS (|) 39 49 51 58 62.1 P/E (x) 31.2 24.9 23.9 20.7 19.5 Price / Book (x) 4.1 3.7 3.3 3.0 2.7 EV/EBITDA (x) 27.5 20.3 20.2 16.6 14.6 RoCE (%) 17.7 19.6 17.9 18.4 17.5 RoE (%) 13.3 14.8 13.8 14.3 13.6 Source: Company, ICICIdirect.com Research Bharat Electronics (BHAELE) | 1210 Rating Matrix Rating Matrix Rating : Buy Target : | 1552 Target Period : 12 - 15 months Potential Upside : 28% YoY growth (%) (YoY Growth) FY15 FY16E FY17E FY18E Net Sales 9.0 9.5 18.3 12.9 EBITDA 28.3 (5.8) 18.3 9.0 Net Profit 25.3 4.1 15.4 6.3 EPS 25.3 4.1 15.4 6.3 Current & target multiple z (x) FY15 FY16E FY17E FY18E P/E 24.9 23.9 20.7 19.5 Target P/E 31.9 30.7 26.6 25.0 EV / EBITDA 20.3 20.2 16.6 14.6 P/BV 3.7 3.3 3.0 2.7 RoNW (%) 15 13.8 14.3 13.6 RoCE (%) 19.6 17.9 18.4 17.5 Stock Data Stock Data Bloomberg / Reuters Code BHE.IN / BAJ.NS Sensex BEL Average Volumes (shares) 34,000 Market Capitalization | 29040 Crore Total Debt (FY16E) | 225 Crore Cash and Investments (FY16E) | 7551 crore EV (FY16E) | 21714 Crore 52 week H/L (|) 1416 / 974 Equity capital | 240 Crore Face value | 10 MF Holding (%) 8.7 FII Holding (%) 3.4 Promoter Holding (%) 75.0 Comparative return matrix (%) Return (%) 1M 3M 6M 12M Bharat Electronics (8.3) (0.7) (1.4) 12.6 Astra Microwave (13.5) (4.2) 5.5 (5.0) Centum Electronics 1.1 (10.1) (15.9) (10.2) Price movement 0 200 400 600 800 1,000 1,200 1,400 1,600 Jan-16 Oct-15 Jul-15 Apr-15 Jan-15 6,500 7,000 7,500 8,000 8,500 9,000 9,500 BEL (R.H.S) Nifty (L.H.S) Research Analyst Chirag J Shah [email protected] Sagar K Gandhi [email protected]
Transcript of January 27, 2016 Rating Matrix Bharat Electronics...

January 27, 2016
Initiating Coverage
ICICI Securities Ltd | Retail Equity Research
Proxy play on emerging defence sector… Bharat Electronics (BEL), a Navratna public sector enterprise, is one of the oldest companies in the Indian defence sector. Renowned for its professional management and strong execution capabilities, BEL stands out among select well-run government companies and, especially, defence public sector units (DPSUs). Over the years, the company has emerged as a market leader in the Indian defence electronics segment with ~44% market share. BEL’s consistent growth in order book, topline & bottomline over the last 10 years (CAGR of 13.4%, 7.3% & 8% respectively) in FY06-15, despite a weak procurement cycle and snail-paced decision making showcases the company’s robust fundamentals. Core competency in niche areas of electronics, diverse presence across geographies, debt-free status, best-in-class working capital cycle, reliability in execution and natural beneficiary of critical technologies developed by Defence Research and Development Organization (DRDO) places the company in a sweet spot. Strong moat, best placed to capitalise on fledgling defence sector Defence electronics is one of the most critical areas for capability building of armed forces. Historically, a large part of defence capital spends (45-60%) has been in this segment. High-end technologies in the electronics segment, long gestation periods, heavy capital requirements, specific requirements of armed forces and secrecy related to defence projects act as key entry barriers in this segment. This gives companies like BEL a strong competitive advantage over any upcoming local and foreign completion. With the central government’s strong commitment on arming defence forces with state-of-the-art equipment and reducing the import bill to at most 30% (currently 70% of total expenditure), order inflows in this segment are set to embark on a new growth trajectory. With planned capex of over | 1500 crore in FY16E-18E, BEL is well placed to capitalise on the fledgling defence sector. Healthy balance sheet, robust prospects, quality play! BEL has a strong balance sheet with near nil debt and cash balance of | 6038 crore (FY15). Accelerated order inflow and BEL’s consistent performance over the past 10 years, gives us reasonable confidence on the robust prospects of the company. With moderate capital expenditure of | 1500 crore over the next three years (FY16E-19E), a consistent dividend payout ratio of 20%, average RoEs, RoCEs of 19.3%, 37.8%, respectively, over the past 10 years and no equity dilution in its history, we believe BEL is a quality play and is on a strong footing. Accordingly, we expect BEL to deliver sales and PAT CAGR of 13.5% and 8.6% respectively, in FY15-18E. We value BEL at | 1552 i.e. 25x P/E on FY18E EPS of | 62.1 and initiate coverage with a BUY recommendation.
Exhibit 1: Valuation Metrics (| crore) FY14 FY15 FY16E FY17E FY18ERevenues 6,276 6,843 7,490 8,863 10,003 EBITDA 891 1,143 1,077 1,275 1,390 Net Profit 932 1,167 1,215 1,401 1,489.8 EPS (|) 39 49 51 58 62.1 P/E (x) 31.2 24.9 23.9 20.7 19.5 Price / Book (x) 4.1 3.7 3.3 3.0 2.7 EV/EBITDA (x) 27.5 20.3 20.2 16.6 14.6 RoCE (%) 17.7 19.6 17.9 18.4 17.5 RoE (%) 13.3 14.8 13.8 14.3 13.6
Source: Company, ICICIdirect.com Research
Bharat Electronics (BHAELE)| 1210
Rating Matrix Rating MatrixRating : BuyTarget : | 1552Target Period : 12 - 15 monthsPotential Upside : 28%
YoY growth (%) (YoY Growth) FY15 FY16E FY17E FY18ENet Sales 9.0 9.5 18.3 12.9 EBITDA 28.3 (5.8) 18.3 9.0 Net Profit 25.3 4.1 15.4 6.3 EPS 25.3 4.1 15.4 6.3
Current & target multiple
z
(x) FY15 FY16E FY17E FY18EP/E 24.9 23.9 20.7 19.5 Target P/E 31.9 30.7 26.6 25.0 EV / EBITDA 20.3 20.2 16.6 14.6 P/BV 3.7 3.3 3.0 2.7 RoNW (%) 15 13.8 14.3 13.6 RoCE (%) 19.6 17.9 18.4 17.5
Stock Data Stock DataBloomberg / Reuters Code BHE.IN / BAJ.NSSensex BELAverage Volumes (shares) 34,000Market Capitalization | 29040 CroreTotal Debt (FY16E) | 225 CroreCash and Investments (FY16E) | 7551 croreEV (FY16E) | 21714 Crore52 week H/L (|) 1416 / 974Equity capital | 240 CroreFace value | 10
MF Holding (%) 8.7FII Holding (%) 3.4Promoter Holding (%) 75.0
Comparative return matrix (%) Return (%) 1M 3M 6M 12MBharat Electronics (8.3) (0.7) (1.4) 12.6 Astra Microwave (13.5) (4.2) 5.5 (5.0) Centum Electronics 1.1 (10.1) (15.9) (10.2)
Price movement
02004006008001,0001,2001,4001,600
Jan-16Oct-15Jul-15Apr-15Jan-15
6,500
7,000
7,500
8,000
8,500
9,000
9,500
BEL (R.H.S) Nifty (L.H.S)
Research Analyst
Chirag J Shah [email protected] Sagar K Gandhi [email protected]

Page 2ICICI Securities Ltd | Retail Equity Research
Company background Bharat Electronics (BEL) was established in Bangalore, India, by the Government of India under the Ministry of Defence (MoD) in 1954 to meet the specialised electronic needs of the Indian defence services. Over the years, it has grown into a multi-product, multi-technology, multi-unit company servicing the needs of customers in diverse fields in India and abroad. Considered the bellwether of the defence electronics sector, it is renowned for its strong execution capabilities and professional management. In 2002, BEL became the first defence PSU to get operational Mini Ratna Category I status. In June 2007, BEL was conferred the prestigious Navratna status based on its consistent performance. BEL is a major supplier of products and turnkey systems to the Indian defence forces. Over the years, the company has also diversified into manufacturing many civilian products. Large turnkey telecommunication solutions are also being offered to the civilian market. The growth and diversification of BEL over the years mirrors the advances in the electronics technology, with which BEL has kept pace. Starting with the manufacture of a few communication equipment in 1956, BEL has today emerged as a globally competitive company in defence electronics.
Exhibit 2: Bharat Electronics – Key milestones of company
Source: Company, ICICIdirect.com Research
• BEL was established by GoI to meet the specialised electronic needs of the Indian defence services
1954
• BEL set up a radar manufacturing facility for the Army and in-house R&D
1966•BEL started
manufacturing black & white TV picture tube, X-ray tubes, integrated circuits, hybrid micro circuits, etc
1970 - 71
• Set - up manufacturing facility for magnesium manganese dioxide batteries, tank electronics and military communication equipment
1981 - 85
• Set up units for switching equipment, electronic warfare equipments. A separate naval equipment was also set up
1986 - 87
• BEL set up joint venture company with M/s GE, USA. In year 2000, BEL reorganised itself into nine strategic business units
1997 - 2000
•BEL became the first defence PSU to get operational Mini Ratna Category I status
2002
• BEL was conferred the prestigious Navratna status based on its consistent performance
2007
Shareholding pattern (Q3FY16)
Shareholder Holding (%)
Promoters 75.0
Institutional investors 18.7
General public 6.3
FII & DII holding trend (%)
3.4 3.9 4.0 4.1
15.4 15.5 14.7 14.7
02468
1012141618
Q4FY15 Q1FY16 Q2FY16 Q3FY16
(%)
FII DII

Page 3ICICI Securities Ltd | Retail Equity Research
Key business segments BEL offers products and services in a wide spectrum of technologies like radars, military communications, naval systems, electronic warfare systems, telecommunications, sound and vision broadcasting, opto electronics, tank electronics, solar photovoltaic systems, embedded software and electronic components. With its expertise developed over the years, the company also provides turnkey systems solutions.
Defence continues to be BEL’s prime focus but the company has also diversified into civilian areas. Some of the successful civilian products include the electronic voting machines, solar powered LED-based traffic signal lights, simputers and set top boxes. In FY08-15, the contribution from defence segment to the total topline was ~81%. In FY15, 87% of revenues came from this segment (Exhibit 8 & 9).
BEL offers contract manufacturing services to both domestic and international customers. It has automated assembly, inspection and testing facilities as also precision machining capabilities. It adheres to strict process and manufacturing standards, producing world-class products. It also undertakes large turnkey contracts that are secretive in nature like command, control, communications and intelligence (C4I) and integrated air command & control system (IACCS). Such orders are received by BEL on a nomination basis from the Government of India.
Exhibit 3: BEL’s business segments
Bharat Electronics
Products Services
Defence Systems / Turnkey SolutionsNon-defence
Radars
Network & Communication
systems
Tank Electronics
OptronicsWeather radar
Solar signals
Tablet PC
Integrated Air Command & Control System (IACCS)
EVMs
Vessel Traffic Management Systems (VTMS)
Command, Control, Communications and
Intelligence (C4I)solution
Contract Mfg.
Design & Mfg.
Semiconductors Pkg.
Source: Company, ICICIdirect.com Research
BEL – A Navratna PSU
•Established in 1954 under MoD
•R&D / technology driven company operating in competitive defence electronics area
•Manpower: 9703 Employees
Navratna PSU
Source: Company, ICICIdirect.com Research

Page 4ICICI Securities Ltd | Retail Equity Research
BEL’s manufacturing units, domestic & overseas offices
BEL’s registered office is in Bangalore while it has manufacturing units in nine locations across the country. A network of marketing and customer support centres across India and two overseas offices in New York and Singapore supplement the operations of the manufacturing units. Of the nine domestic units, Bengaluru contributes highest, over 50% (| 4000 crore) to the topline in FY15. BEL is also setting up a new defence systems integration complex at Palasamudram in Anantapur district of Andhra Pradesh with an estimated investment of | 500 crore. Exhibit 4: BEL’s manufacturing units
Source: Company, ICICIdirect.com Research
Exhibit 5: Product manufacturing; unit-wise
Unit Focus Area
BangaloreMilitary communication & electronic warfare systems, radars, naval systems and sonars, CI systems, simulators, sound & vision broadcast equipment, electronic voting machines, simulators and components
Ghaziabad Radars & microwave communication equipment, antennas
Pune Batteries, X-ray tubes, electro optics, laser range finders & target designators
Machilipatnam Night vision devices, thermal imagers and surgical microscopes
Panchkula Military communication equipment
Kotdwara Defense communication equipment and telecom products for civil & defence
Chennai Tank electronics, stabilizer drives, advanced land
Navi Mumbai Hydraulics for stabilisers, shelters, mast, flycatcher antenna system
ChennaiTank electronics, stabiliser drives, advanced land navigation systems, integrated fire control systems, gun upgrades
Hyderabad Electronic warfare equipment Source: Company, ICICIdirect.com Research
Domestic & overseas offices
Regional Offices
Marketing Offices
Mumbai
Kolkatta
New Delhi
Visakhapatnam
New Delhi
Bengaluru
Overseas Offices
Singapore
New York
Source: Company, ICICIdirect.com Research
Page 5ICICI Securities Ltd | Retail Equity Research
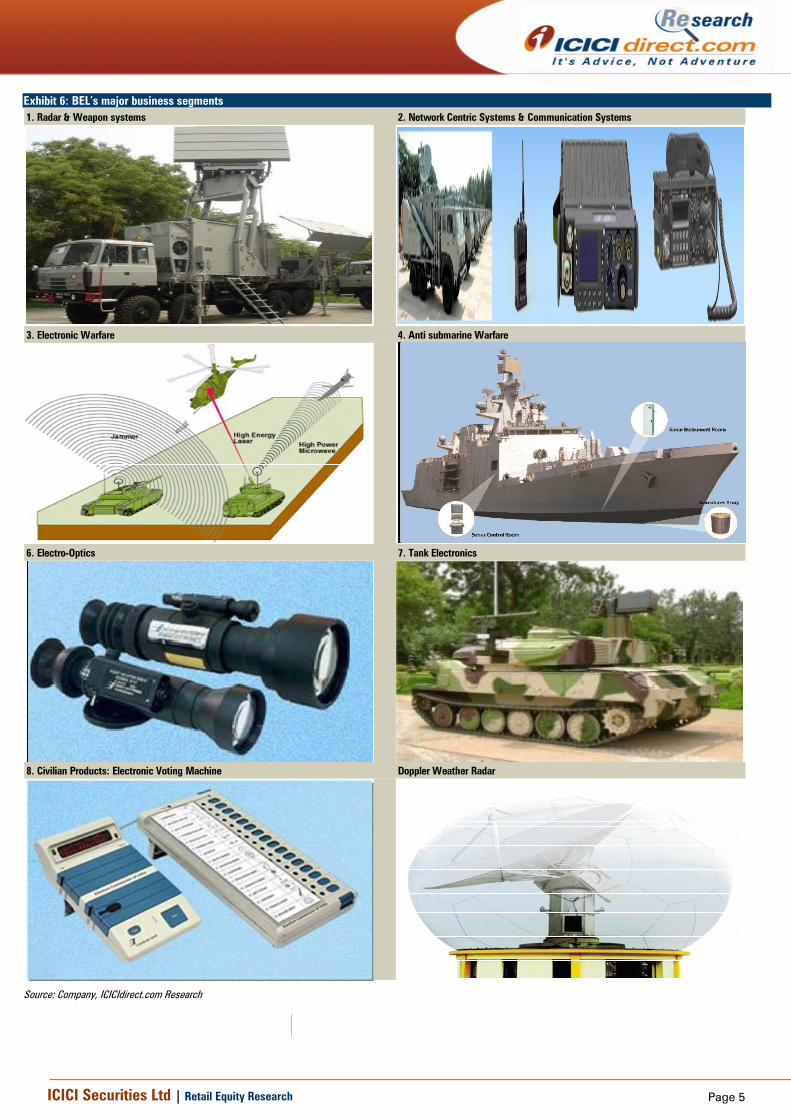
Exhibit 6: BEL’s major business segments 1. Radar & Weapon systems 2. Network Centric Systems & Communication Systems
3. Electronic Warfare 4. Anti submarine Warfare
6. Electro-Optics 7. Tank Electronics
8. Civilian Products: Electronic Voting Machine Doppler Weather Radar
Source: Company, ICICIdirect.com Research

Page 6ICICI Securities Ltd | Retail Equity Research
BEL’s customers – Mostly armed forces and government organisations Defence forces - Army, navy and air force continue to be BEL’s prime customers. The company derives 87% of its revenue (exhibit 8 & 9) from them. BEL’s products for the army include battery level radars, advanced land navigation systems and intelligent message terminals. Command information decision support systems manufactured by BEL help commanders assess the battle situation and take real-time decisions for securing battle communications. BEL offers a compact, hand-held radio system with built-in high-grade digital secrecy for voice, in clear/secure mode. The company also manufactures broadband transmitting equipment that can be effectively used for jamming hostile receivers. To train gunners to track and engage moving targets in simulated battlefield conditions, BEL manufactures an anti-tank guided missile simulator.
The navy receives radars and launch preparation and centralised real-time control systems for advanced technology vehicles. New generation sonars for submarines, electronic warfare systems and fire control systems are all manufactured and supplied by BEL.
For the air force, BEL manufactures radars, communication systems, high accuracy direction finders, radar warning receivers and command & control systems. Exhibit 7: Products, services of BEL, customer-wise
Products and Services CustomersCommunications Army, Navy, Air Force & Paramilitary ForcesRadars
Naval Systems
Electro Optics
Electronic Warfare
Avionics
Tank Electronics
Weapon Systems
Command & Control Systems
Telecommunication, Terminals & NetworksDept of Telecommunication, Paramilitary Forces, Railways, Defence Research & Development Organization (DRDO)
Broadcast Systems & Satcom Products All India Radio (AIR), Doordarshan (DD), Indian Space Research Organization (ISRO)
Electronic Voting Machine Election Commission of IndiaSolar Products & Systems Police, Government & Private Organizations, Individuals
Turnkey Systems, e-Governance Networks ISRO, Police, State Governments, Public Sector Undertakings
Components AIR & DD, the National Radio & TV Broadcasters, Instrumentation Industry, Switching Industry, Entertainment Industry, Telephone Industry, Individuals
Source: Company, ICICIdirect.com Research

Page 7ICICI Securities Ltd | Retail Equity Research
Revenue segmentation, value of production (VoP), exports
Exhibit 8: Revenue segmentation (FY15), defence vs. civil
Defence87%
Civil13%
Source: Company, ICICIdirect.com Research
Exhibit 9: Revenue segmentation trend (FY08-FY15), defence vs. civil
83 8575 80
7385 83 87
17 1525 20
2715 17 13
0
20
40
60
80
100
FY08 FY09 FY10 FY11 FY12 FY13 FY14 FY15
%
Defence Civil
Source: Company, ICICIdirect.com Research
Exhibit 10: How rupee earned is distributed, FY14-15 – VoP
56.2
19.0
0.5
2.34.5
17.5
Materials Employee Benefits ExpenseOther Expenses (Net of other revenues) DepreciationTax Provisions Profit After Tax
Source: Company, ICICIdirect.com Research
Exhibit 11: Revenues from indigenous technologies at 80%
Indigenous80%
Imports & ToT from foreign
OEMs20%
Source: Company, ICICIdirect.com Research
Exhibit 12: Exports form 5.4% of sales (FY15) Exports
5.4%
Domestic94.6%
Source: Company, ICICIdirect.com Research

Page 8ICICI Securities Ltd | Retail Equity Research
Investment Rationale Industry scenario: Indian defence industry at inflexion point… India largest importer of major weapons in the world India has emerged as the world’s largest arms buyer in the last few years and is in the process of replacing an ageing Soviet-era military hardware with modern military weapons from major defence manufacturers like the US, Israel, Russia, UK and France. India is the largest importer of weapons globally. As per Stockholm International Peace Research Institute (SIPRI), for 2010-14, India accounted for about 15% total imports of major arms followed by China (5%) and Pakistan (5%). While India’s defence spend is only 2% of global defence spend, India’s contribution to global defence trade is a remarkable 14% (exhibit 13). Exhibit 13: Percentage imports 2010-14, India ranks first
15
5 54 4 4
3 3 3 3
02468
10121416
Indi
a
Saud
iAr
abia
Chin
a
UAE
Paki
stan
Aust
ralia
Turk
ey
USA
Sout
hKo
rea
Sing
apor
e
%
Global share (%)
Source: SIPRI year book 2015, ICICIdirect.com research
Defence industry: India vs. world Globally, 50 nations account for 92% of the world’s total spending on national defence. Within the top 50, six nations – the US, China, Russia, Saudi Arabia, Japan and France generate 60% of global defence spending. India’s current defence spend of $37 billion is roughly 2% of the global defence spend. Though small in the global basket, India is the second largest defence spender in Asia after China. In absolute terms, it is pegged at US$171 billion, less than one-third of China. These global defence spend numbers include revenue and capital expenditure. India’s capital spend as a proportion of overall defence spend is 38%. For China and US, on the other hand, capital spends account for 50-60% of their respective defence budgets. Effectively, in terms of capital spends India lags these countries much more than the headline numbers - suggesting massive business opportunities for all players, domestic and international.
As shown in Exhibit 14, global defence trade is at USD $70 billion (~4% of global defence spend) while India’s share is ~15%. Thus, while India’s defence spend is only 2% of global defence spend, India’s contribution to global defence trade is a remarkable ~15% and that too imports.

Page 9ICICI Securities Ltd | Retail Equity Research
Exhibit 14: Indian share as percentage of global spend
Global defence trade $ 70 bn (| 4,55,000 crore)
Global defence industry (spend) $ 1.7 trn (| 1,10,00,000 crore)
India defence spend (FY15)$ 34.2 bn (| 2,22,370 crore)
Capital expenditure at 39.5% $ 14 bn (| 88,000 crore)
India's share in global defence trade at ~ 15% (mostly imports) $ 10.2 bn (| 61,000 crore) )
70% of capital requirements are imported $ 10.2 bn (| 61,000 crore)
2%
Source: SIPRI, The finance commission XIV report, FICCI (India Aerospace and Defence), ICICIdirect.com Research
Defence is part of the 25 sectors identified for the ‘Make in India’ initiative, which GoI is aggressively marketing internally as well as externally with the aim of attracting the required investments to stimulate the economy. Need for increased military spends, capability building Despite the sustained expenditure over the last decade, the equipment profile of the armed forces is in an alarming state. As per the defence secretary’s testimony to Parliamentary Standing Committee early this year, while the desirable equipment profile is 30:40:30 (30% state-of-the-art, 40% current and 30% nearing obsolescence), experts estimate the current profile at 15:45:40. Building defence capabilities is one of the top priorities of the current government.
India is surrounded by difficult neighbours with frequent skirmishes at the borders, often in difficult terrains. Also, India’s neighbours have historically been large defence spenders. India enjoys the benefit of a larger GDP base but lacks the military grants that some of its neighbours have received. The Indian defence forces, thus, require a wide array of equipment given the highly varied climatic conditions across different borders with deserts like environments towards the North West, the tallest mountain range in the world toward the North and the North East and Oceans towards the South.
As shown in Exhibit 15, India lags behind the US and China in a variety of areas like
• Aircraft (US: 13,982 vs. India: 1,905),
• Serviceable airports (US: 13,513 vs. India: 346),
• Armoured fighting vehicles (US: 41,062 vs. India: 6,704),
• Multiple launch rocket systems (China: 1,770 vs. India: 292),
• Aircraft carriers (US: 20 vs. India: 2),
• Submarines (US: 72 vs. India: 15),
• Frigates (China: 47 vs. India: 15) and
• Destroyers (US: 62 vs. India: 9).

Page 10ICICI Securities Ltd | Retail Equity Research
Exhibit 15: Defence forces capabilities, India vs. the world
Country: India China Pakistan USA
Total Population: 1,236,344,631 1,355,692,576 196174380 320,202,220
Active Military Personnel: 1,325,000 2,333,000 617000 1,400,000
Aircraft (All Types): 1,905 2,860 914 13,892
Helicopters: 584 908 313 6196
Attack Helicopters: 20 196 48 920
Attack Aircraft (Fixed-Wing): 761 1,311 387 2797
Fighter Aircraft: 629 1,066 387 2,207
Trainer Aircraft: 263 352 170 2809
Transport Aircraft: 667 876 278 5366
Serviceable Airports: 346 507 151 13513
Tank Strength: 6,464 9,150 2924 8,848
Armoured fightinh vehicle Strength: 6,704 4,788 2828 41,062
SPG Strength: 290 1,710 465 1934
Towed Artillery: 7,414 6,246 3278 1,299
MLRS Strength: 292 1,770 134 1331
Merchant Marine Strength: 340 2,030 11 393
Major Ports / Terminals: 7 15 2 24
Fleet Strength: 202 673 74 473
Aircraft Carriers: 2 1 0 20
Submarines: 15 67 8 72
Frigates: 15 47 10 10
Destroyers: 9 25 0 62
Corvettes: 25 23 0 0
Mine Warfare Craft: 7 6 3 11
Patrol Craft: 46 11 12 13
Annual Defense Budget (USD): $38,000,000,000 $145,000,000,000 $7,000,000,000 $577,100,000,000
Coastline Coverage (km): 7,000 km 14,500 km 1,046 km 19,924 km
Shared Borders (km): 13,888 km 22,457 km 7,257 km 12,048 kmSquare Land Area (km): 3,287,263 km 9,596,961 km 796,095 km 9,826,675 km
Source: www.globalfirepower.com, ICICIdirect.com Research
Single customer with larger spending power; budget trends
Unlike other sectors, the defence industry is a monopsony, where the single buyer, the government, is the authority for decision making and also laying down procurement policies. This makes active government support extremely crucial for private defence manufacturers, a fact borne out by the experience of countries — the US, Israel, Brazil and France — where private defence industry has flourished. Historically, defence expenditure has grown at 11.3% CAGR in FY05-15. As per the Fourteenth Finance Commission report, the same is expected to grow at 13.2% CAGR in FY16E-20E (Exhibit 16).
Revenue expenditure does not add to any capacity building of armed forces. The same is consistently increasing due to wages and pension revisions. Capital expenditure, which adds to productive capacity, has been 38-40% of total expenditure in FY11-15. Capital expenditure has historically grown at 13% CAGR in FY11-15. We believe the same is likely to continue till FY20E on account of the renewed thrust on defence spending and capability building (Exhibit 17).

Page 11ICICI Securities Ltd | Retail Equity Research
Exhibit 16: Defence expenditure (total), to grow at 13.2% CAGR till FY18E
75900 80500 85500 91700114200
141800 154200 170900 181800203700 222370
246727281262
319752363510
413257
050000
100000150000200000250000300000350000400000450000
FY05 FY06 FY07 FY08 FY09 FY10 FY11 FY12 FY13 FY14 FY15 FY16E FY17E FY18E FY19E FY20E
| cr
ore
Revenue expenditure Capital expenditure Total Expenditure
11.3%
13.2%
Source: The finance commission XIV report, ICICIdirect.com Research
Exhibit 17: Capital expenditure by Indian armed forces, percentage of total expenditure and growth
62 68 71 79 88 95 108 123 140 160154 171 182 204 222 247281
320364
413
40
40
39 39
40
38 38 39 39 39
0
100
200
300
400
500
FY11 FY12 FY13 FY14 FY15 FY16E FY17E FY18E FY19E FY20E
| '0
00 c
rore
3738383939404041
%
Capital expenditure Total Expenditure Capital expenditure (%)
13%
Source: The finance commission XIV report, ICICIdirect.com Research
“Make in India’ for defence more than nomenclature, defence deals actually going through…
After facing a weak procurement cycle and snail-paced decision making by the Indian armed forces for the past 10-15 years, the Indian defence sector is now witnessing heightened activity due to the current government’s strong resolve to equip defence forces with ‘state of the art’ weapons and reducing import dependence from current 70% to 30% over the next seven to 10 years. Accordingly, a number of decisions have been taken by the current government across a wide area to;
1. Build the capability of armed forces,
2. Reduce the import bill by building indigenous capabilities and
3. Encourage private sector participation with the long-term goal of exports
Defence manufacturing has been identified as a priority sector in the current government’s flagship ‘Make in India’ scheme. While the nomenclature came into vogue last year, indigenous defence manufacturing has been a rather unsuccessful quest for decades. Capital acquisitions worth | 2, 39,049 crore have already received approvals from

Page 12ICICI Securities Ltd | Retail Equity Research
the apex decision-making council, Defence Acquisition Council (DAC) from July 2014 to October 2015. As seen in exhibit 18, the highest share of approvals is received by Indian navy 47%, followed by Army and Air force at 31% and 22%, respectively. These approvals also have significant offsets of | 16,934 crore (Army: 19%, Navy: 18% and Air Force: 63%) as highlighted in the later part of the report (Exhibit 34).
Exhibit 18: Capital acquisitions; force-wise from July 2014 to October 2015
73310
112938
52801
239049
0
50000
100000
150000
200000
250000
300000
Indian Army Indian Navy India Air Force Total
| cr
ore
Capital Acquisitions
Source: Ministry of Defence, ICICIdirect.com Research
After launching the “Make in India” campaign, 40 joint venture projects have been accorded (Indian as well as foreign manufacturers) the ‘Acceptance of Necessity’ (AoN) worth ~| 1, 01,264 crore. In addition to above clearances, the government has also announced a number of measures to expedite self-reliance in defence procurements (Exhibits 19, 20, 21 & 22). Some of the key bold initiatives include:
• Foreign direct investment (FDI) limit increased from 26% to 49% (and too) through the automatic route. Above 49%, the proposal may be considered by Foreign Investment Promotion Board (FIPB) and 100% FDI for critical technologies
• Defence products list for the purpose of industrial licensing has been substantively shortened and notified
• The government has notified a Defence Exports Strategy for faster clearance of export of defence items
• Interactions with industry intensified through DRDO and Department of Defence Production
• DRDO facilitates 75 licensing agreements for transfer of technology (LATOT) to 57 industries under Make in India programme
• Government of India sets up exclusive diplomacy panels for countries possessing critical technologies to expedite high-technology weapon procurement process
• Government to government deals for corruption-free and speedy clearances of large projects. E.g. procurement of 36 Rafael fighter aircraft from Dassault via Government of France
• Overhauling defence procurement policy (DPP) to make India an attractive destination
• Test in India: Military ranges, laboratories of DRDO, the three armed forces and defence PSUs opened to private players to test their equipment and systems within India. This change in policy is expected to be a game changer for indigenous research and development, given that in the past private players had to send

Page 13ICICI Securities Ltd | Retail Equity Research
equipment abroad for testing and certification, resulting in time and cost escalations
Exhibit 19: Actualising ‘Make In India’ via bold policy changes and swift decision making
Enabling Defence
Manufacturing via Reforms
Overhauling Defence
Procurement policy to make
India an attractive
destination
Gov t.to Govt. deals for global
transfer of technology,
speedy decisions. Ex: MCMVs for
Indian Navy
Retrospective changes, giving
foreign companies flexibilty to change
both offsets patners and products.
Increase in FDI to 49% via
automatic route. 100% FDI for
critical technologies
Defence ministry restores
"Services" as eligible offsets
Exclusive Diplomacy panel
to fast track bilateral relations
with weapon producing nations
Test In India: Military ranges, labs opened to
private players to test equipment
Source: PIB, Media Sources, ICICIdirect.com Research
• Defence ministry (MoD) restores ‘services’ as eligible offsets give a major boost to the maintenance, repair and overhaul (MRO) industry as well as companies involved in the upgradation of military systems and life extension projects of defence equipment
• MoD brings in major retrospective changes in offsets policy, giving foreign companies much more flexibility in choosing partners (even changing offset partners) & allocating work share
• DAC approves large projects at commendable pace (Exhibit 20)
Exhibit 20: Large projects approved by Defence Acquisition Council
Category | crore
36 Rafales 36000
Transport aircrafts (Avro replacements) 17500
Air Guns (L70 & Zu23) 16900
22 Apache & 15 Chinook helicopters 16250
110 Naval utility helicopter 15000
Military Planes 13000
8 P8I patrol aircrafts 9000
Support fleets for navy 9000
Integrated Air command & control systems 8000
48 Mi-17 V5 helicopter 7000 Source: PIB, Media Sources, ICICIdirect.com Research

Page 14ICICI Securities Ltd | Retail Equity Research
Exhibit 21: Actualising ‘Make In India’ by improving business environment
Augmenting Indiginesation through Hand-
holding
Record 121 licences in 18
months as against 96 in past 10 years Negotiated
resolutions over blind blacklistings. Approx 38 firms
to be benefit from this
Record approvals for 'Capital
acquisitions' by the highest
decision body -DAC for
| 2,39,000 crore
Compulsaory 'Integrity pacts' for deals over | 20 crore to
prevent corruption
Industrial license validity raised to 15 years from current 7 years
with further extension for 3
years
Lowest-bid contract award
system replaced with "right
partner concept"
Delicensing of non-lethal and
dual use items. Ex: Rescue & survelliance equipments
Source: PIB, Media Sources, ICICIdirect.com Research
Besides the above-mentioned measures, formalising the middleman role, creating working groups between countries, facilitating inter-country industry interactions through joint visits with policy makers, are few of the many measures that will go a long way in actualising defence manufacturing in India.
Pentagon, the headquarter of the US Department of Defence, has set up a first-ever country specific ‘defence cell’ for India besides encouraging American industry to come forward and identify pathfinder projects that can be taken up for co-development and co-production by the two countries. Some of the critical and large projects have been specifically identified for kick starting “Make in India” in a significant way. These areas have been reserved for mandatory private sector participation to bolster the country's fledging defence industrial base.
Exhibit 22: Enabling 'Make In India' for large / critical projects
Source: PIB, Media Sources, ICICIdirect.com Research
• Aircraft and their major systems • Warships of stated displacements, submarines and their major systems • Armoured fighting vehicles and their major systems • Complex weapons that rely on guidance system • Command and Control System (C4ISTR) • Critical materials (special alloys and composites)
Strategic areas in areas for 'Make In India' participation
Page 15ICICI Securities Ltd | Retail Equity Research
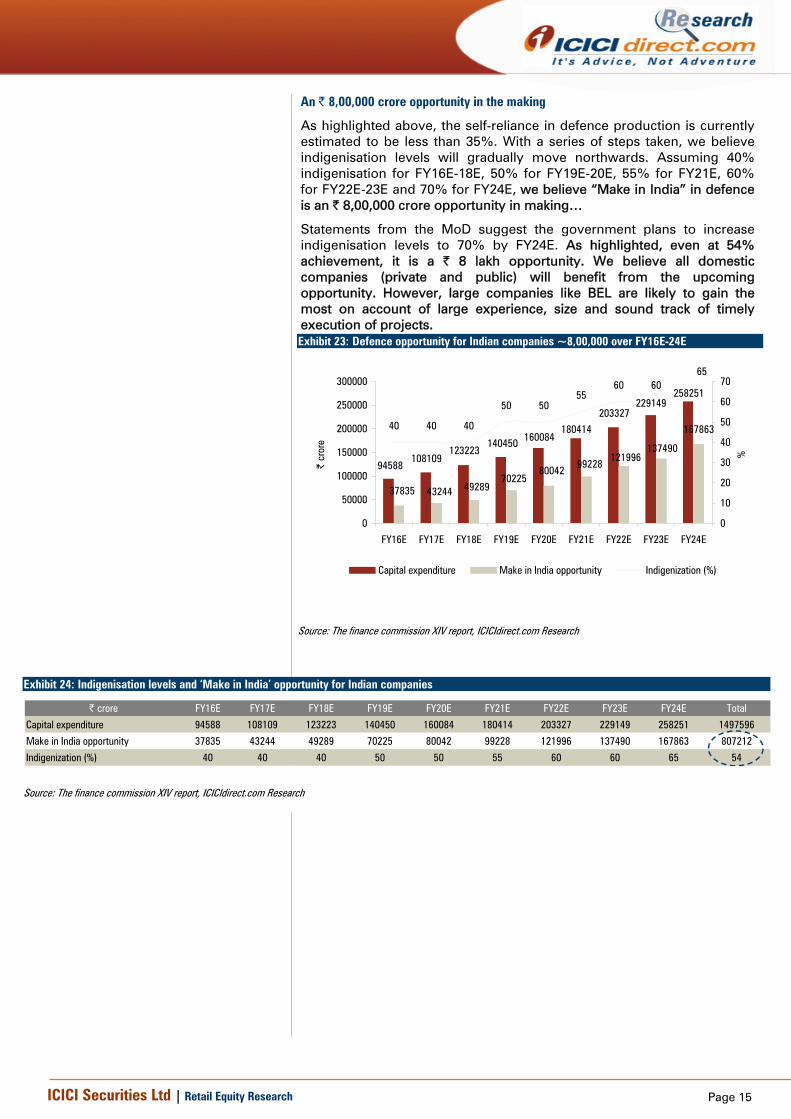
An | 8,00,000 crore opportunity in the making
As highlighted above, the self-reliance in defence production is currently estimated to be less than 35%. With a series of steps taken, we believe indigenisation levels will gradually move northwards. Assuming 40% indigenisation for FY16E-18E, 50% for FY19E-20E, 55% for FY21E, 60% for FY22E-23E and 70% for FY24E, we believe “Make in India” in defence is an | 8,00,000 crore opportunity in making…
Statements from the MoD suggest the government plans to increase indigenisation levels to 70% by FY24E. As highlighted, even at 54% achievement, it is a | 8 lakh opportunity. We believe all domestic companies (private and public) will benefit from the upcoming opportunity. However, large companies like BEL are likely to gain the most on account of large experience, size and sound track of timely execution of projects. Exhibit 23: Defence opportunity for Indian companies ~8,00,000 over FY16E-24E
94588108109
123223140450 160084
180414
203327229149
258251
37835 43244 4928970225
8004299228
121996137490
16786340 40 40
50 5055
60 6065
0
50000
100000
150000
200000
250000
300000
FY16E FY17E FY18E FY19E FY20E FY21E FY22E FY23E FY24E
| cr
ore
0
10
20
30
40
50
60
70
%
Capital expenditure Make in India opportunity Indigenization (%)
Source: The finance commission XIV report, ICICIdirect.com Research
Exhibit 24: Indigenisation levels and ‘Make in India’ opportunity for Indian companies
| crore FY16E FY17E FY18E FY19E FY20E FY21E FY22E FY23E FY24E Total
Capital expenditure 94588 108109 123223 140450 160084 180414 203327 229149 258251 1497596
Make in India opportunity 37835 43244 49289 70225 80042 99228 121996 137490 167863 807212
Indigenization (%) 40 40 40 50 50 55 60 60 65 54
Source: The finance commission XIV report, ICICIdirect.com Research

Page 16ICICI Securities Ltd | Retail Equity Research
Strategic/defence electronics – Critical area for capability building
Strategic electronics is one of the important areas in the electronic industry due to the criticality of the technology development targeting two aspects, viz. a) The technology applicable to the strategic sector, like defence purposes; and b) The emerging state-of-the-art technology in civilian applications
Specifically, electronic parts and equipment designed & manufactured to improve capabilities of armed forces is termed as defence electronics. Electronics today is an integral part of almost all defence systems. The Indian defence electronics industry has shown a significant uptrend over the past decade. Examples of major electronics products and systems include radars, unmanned aerial vehicles, thermal imagers, night vision devices, network centric systems, communication systems, electronic warfare, tactical communication systems, etc.
Exhibit 25: Operational model for strategic electronics
Source: TATA Power SED, ICICIdirect.com Research
It is envisaged that, going forward, electronic intelligence will gain increasing importance. Hence, use of electronic components would be more than 70%.
India's defence electronics market pegged at over $70 billion
India's defence electronics opportunity can total more than $70 billion over the next decade and a half, a white paper by consultancy firm Roland Berger and the industry lobby body ‘India Electronics and Semiconductor Association’ (IESA) said in its paper, presented at Deftronics 2015, a conference of aerospace and defence stakeholders. The opportunity for electronics in defence systems in India is spread across both standalone equipment and at a sub-system level. The opportunity at the standalone level is ~ $18.5 billion while the chunkier pie is at a sub-system level of ~$58 billion in the next 12-15 years.

Page 17ICICI Securities Ltd | Retail Equity Research
Exhibit 26: Defence electronics: India and the world
Source: Teal analyst, Teal Group Corporation, ICICIdirect.com Research
The strategic electronics industry has been growing at a CAGR of 16.5% over FY08-15. We believe the same will accelerate from here on account of large upcoming programs with major electronics’ content. To encourage local fabrication units, the government is mulling a proposal to make it mandatory for the strategic sectors of defence, space and atomic energy to use 'made in India' chips to take care of concerns of fabrication units about the demand for their products.
Accordingly, we expect the defence/strategic electronics industry to grow at 18% CAGR in FY16E-20E. This presents an aggregate opportunity of | 1, 32,500 crore for domestic players over the same period.
Exhibit 27: Strategic electronics industry, to grow at 16% CAGR
5400 6490 6980 7700 8500 9000
1380015700
1852621861
25796
30439
35918
0
5000
10000
15000
20000
25000
30000
35000
40000
FY08 FY09 FY10 FY11 FY12 FY13 FY14 FY15 FY16E FY17E FY18E FY19E FY20E
| cr
ore
Strategic Electronics (Value of production)
16.5%
18%
Source: (Actuals FY08-15) Annual report 2014-15, Department of Electronics & IT , (Estimates FY16E-FY20E) ICICIdirect.com Research
The following upcoming programmes of Indian defence have large electronics content and are likely to bring in huge business for both Indian companies and global OEMs with Indian partners: • Tactical Communication System (TCS)

Page 18ICICI Securities Ltd | Retail Equity Research
• Futuristic infantry soldier as a system (FINSAS) • Battlefield management system (BMS) • Battlefield surveillance system (BSS) • Futuristic infantry combat vehicle (FICV) • Quick reaction surface to air missile system (QRSAM) • Medium range surface to air missile system (MRSAM) • Integrated air command and control system (IACCS) • Network for spectrum (NFS)
Porter’s ‘competitive advantage’ analysis for defence electronics industry/BEL
The defence electronics industry is monopsonic in nature with the Government of India having a veto on all decisions. Thus, the bargaining power of the buyer is high. As it follows, the bargaining power of sellers is low as vendors/suppliers are fragmented. The terms are often dictated by large contractors or system integrators like BEL. Threat of new entrants is low as this is a regulated industry requiring licenses and approvals for manufacturing or supplying of products. Projects are also capital intensive and have a long gestation periods. This is one of the key reasons for industry players to shy away from this space. This industry has low threat of alternative or substitute products as these are mostly critical-technology products. This results in low rivalry within the industry and makes it an oligopoly market. Often this leads to existing or large players earning better margins and high return on investment (RoI) but for the risks mentioned above.
Exhibit 28: Porter’s five forces analysis for defence electronics industry / BEL
Industry rivalry(Low)
- Highly concentrated market- Few players with large market share
Bargaining power of Buyer(High)
The defence industry being monopsonic in nature, government has comtrol and commands over all decisions
Threat of new entrants(Low)
- Licences / approvals required- Projects are capital intensive with long gestation periods
Threat of substitute products(Low)
- Substitutes not easily available due to critical technolgies embedded in products/systems
Bargaining power of sellers(Low)
- Vendors / Suppliers are fragmented- Terms & conditions dictated by Systems integrators or large government companies (like HAL, BEL)
BEL has concentrated revenue base with over 85% from defence segment. However, it is gradually diversifing into civilian areas
However, BEL is the market leader with 45% market share. Company enjoys benefit of a wide product range and years of experience and relationships with defence and government agencies
BEL being a PSU has better response time in case of approvals / clearances. Strong balance sheet supports large, capital intensive projects.
Source: Company, ICICIdirect.com Research

Page 19ICICI Securities Ltd | Retail Equity Research
BEL – Market leader in domestic defence electronics
BEL has dominated the defence electronics industry for the past many years. As of FY15, BEL’s market share is at 44% (exhibit 30). Thus, the company is well placed to benefit from rising expenditure supported by a strong manufacturing base, years of experience, relationships with defence & government agencies and strategic collaboration with foreign technology partners for new products and processes. We believe over the next few years, the market share of BEL will stabilise at ~40% (Exhibit 29 and 30) but on a scaling opportunity. BEL is expected to be a major beneficiary of this significant upcoming opportunity of | 132,500 crore in the defence electronics segment over FY16E-20E.
Exhibit 29: Market share, falling due to increasing competition
75.2 70.6 74.2 72.5 67.9 67.8
45.5 43.6 40.4 40.5 38.8
0.010.020.030.040.050.060.070.080.0
FY08
FY09
FY10
FY11
FY12
FY13
FY14
FY15
FY16
E
FY17
E
FY18
E
%
BEL Market Share (%)
Source: Department of Electronics & IT, Company, ICICIdirect.com, Research
Exhibit 30: BEL market share in defence electronics (FY15)
Others 56%
BEL44%
Source: Department of Electronics & IT, Company, ICICIdirect.com, Research
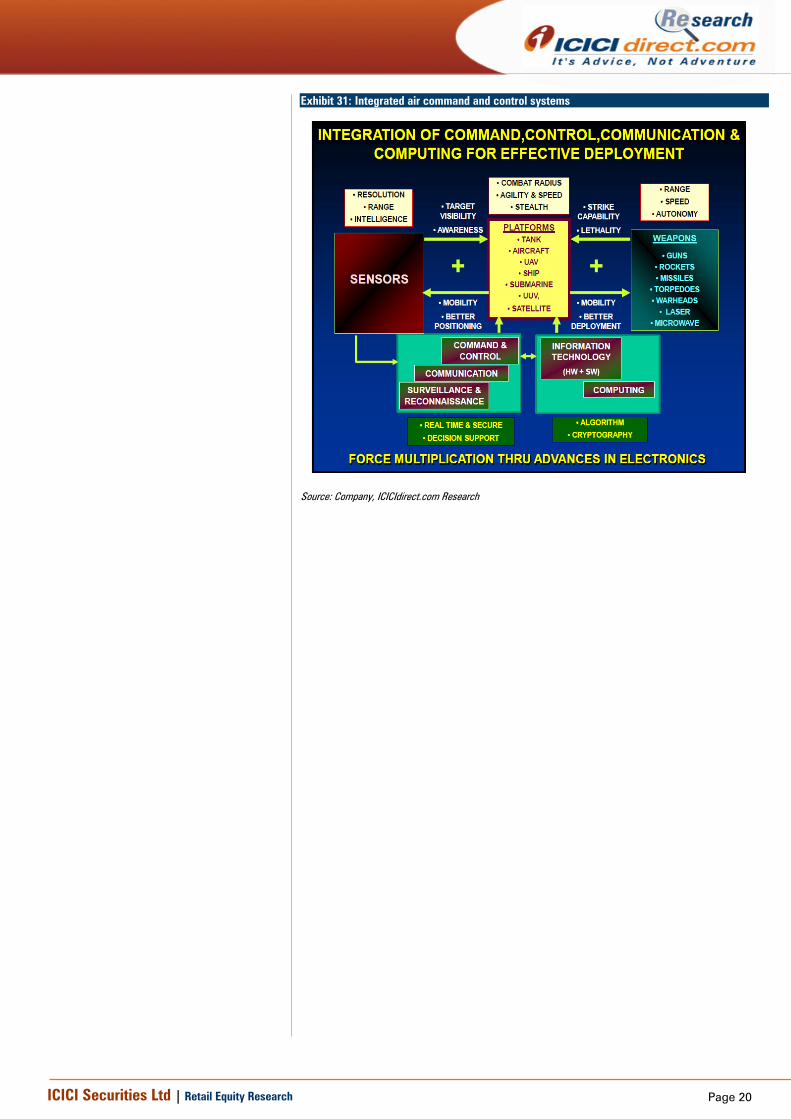
BEL – Natural beneficiary of all large and sensitive projects BEL is the primary defence electronics company for the Government of India. The company enjoys a near-monopoly in supplying high-tech defence products like radars, sonars, communication equipment and electronic warfare equipment. BEL has a strong position in the defence industry due to its strong base in R&D and its manufacturing skills. BEL’s ability to provide lifetime spares and services and its presence at war sites during conflict situations gives a competitive advantage to the company in defence services. Being a government company, it receives a number of orders on a nomination basis. Over the past five years, the company has received over 90% of orders in the defence segment on a nomination basis. The recently awarded large order of | 8000 crore of Integrated Air Command and Control Systems (IACCS) was also on a nomination basis. IACCS aims to integrate all ground and air sensors to give a composite air situation picture by integrating air force, army, navy, and civilian radars. All such large and sensitive projects are likely to be awarded to BEL in future also.
Page 20ICICI Securities Ltd | Retail Equity Research
Exhibit 31: Integrated air command and control systems
Source: Company, ICICIdirect.com Research

Page 21ICICI Securities Ltd | Retail Equity Research
BEL graduating from system integrator to global defence contractor BEL has already moved from being a pure product-selling company to one that takes the contract as a system integrator. This has led to a change in revenue mix and large order inflows. The government has made umpteen efforts to trigger rapid growth through an offset procurement policy that mandates foreign contractors must source components, systems from domestic companies for at least 30% of value of all orders that they get from the Indian armed forces and are worth more than | 300 crore. DPP 2016 proposes to increase this threshold to | 2000 crore. Highlights of DPP 2016 are explained later in this report.
Though the offset clause will be initially utilised for meeting mandatory requirements, we believe this offset clause will gradually help Indian companies to market their competence in areas of engineering design and IT systems. Such competence combined with general cost savings in material and labour will enable Indian companies to become preferred outsourcing partners in the medium to long term. For already established companies like BEL, such offsets collaborations will help it move up the value chain to become independent systems integrators across technology-design-system integration value chain.
As shown in exhibit 33, BEL has witnessed an increase in ‘order backlogs’ at a CAGR of 12.3% in FY08-15E. The same is likely to accelerate in FY16E, FY17E and FY18E on account of large projects being approved over the last few months and a large addressable opportunity over the next few years (exhibits 34 & 35). We believe the opportunity size for BEL is ~| 70,000 crore over FY16E-22E.
Exhibit 32: Trend in order inflows
5384 6144
17835
7916
5305 4527 5260
13500
10000 10000
02000400060008000
100001200014000160001800020000
FY09 FY10 FY11 FY12 FY13 FY14 FY15 FY16E FY17E FY18E
| cr
ore
Orders Inflows
Source: Company, ICICIdirect.com Research

Page 22ICICI Securities Ltd | Retail Equity Research
Exhibit 33: Trend in order backlog
9586 10386 11350
2360025748 24949
23200 21617
27714 28954 29068
0
5000
10000
15000
20000
25000
30000
35000
FY08 FY09 FY10 FY11 FY12 FY13 FY14 FY15 FY16E FY17E FY18E
| cr
ore
Order Backlog
12.3%
Source: Company, ICICIdirect.com Research

Page 23ICICI Securities Ltd | Retail Equity Research
Offsets and exports: Storehouse of tremendous potential
Offset provisions were promulgated by the Ministry of Defence (MoD), in the Defence Procurement Procedure (DPP), 2005. The offset policy has undergone several revisions since then and the latest DPP 2016 is proposed to be applicable from FY17E. The DPP 2016 proposes the following major changes over DPP 2013.
Highlights of DPP 2016
1) Design, not just make
Under the new DPP, a new category called the 'IDDM' or 'Indigenously Designed, Developed and Manufactured' platforms has been created. This category, with at least 40% indigenous content, will get top priority and will be the first to be chosen for tenders.
Exhibit 34: Categorisation for procurement of Indian armed forces
Buy
Categorization
Buy & Make Buy & Make (Indian) Make
Buy IndianBuy GlobalFor MSMEsGovt. funded Industry funded
Foreign & Indian Vendors
Indian Vendors with 30 % Indigenous Content
Purchase from Foreign Vendor followed by Licensed / Indigenous Production
RFP to be issued only to Indian Vendors
90% govt. funded. Remained 10% to be refunded, if RPF not issued in 24 months
IDDM
Designed with atleast 40% indigenous content (Top priority)
Industry funded: Development cost to be reimbursed, if tender not issued in 24 months
Exclusively reserved for MSMEs projects with development cost of less than | 3 crore.
Source: DPP 2013, Media Sources, ICICIdirect.com Research
2) Offset threshold raised to | 2,000 crore The offset threshold would be raised, with foreign vendors liable for offsets only in contracts worth over | 2,000 crore. Earlier, foreign vendors were liable for offsets in all contracts worth | 300 crore. The policy required them to plough back at least 30% of the contract value into the Indian defence sector. This will result in cost savings as the price of defence equipment rises by ~20% because of offsets. 3) Changes in L1 policy Under the new policy, 10% extra weightage will be given if a system possesses better qualities than required. 4) Expanding ‘Make’ category The revised ‘Make’ category has now been divided into three sub-categories. The idea is to fund Indian private entities in research and development (R&D) to encourage more local development. As shown in exhibit 34, in the first category, private entities will receive up to 90% of funding for their R&D or developing the prototype. The remaining 10% of development cost would be also be reimbursed, if the request for

Page 24ICICI Securities Ltd | Retail Equity Research
proposal (RFP) for the equipment developed is not issued within 24 months from the date of successful development of prototype. Similarly, in the second category, the industry will develop the prototype at its own cost with a cushion of reimbursement if the RFP is not issued within 24 months. The third category will be reserved for medium & small manufacturing enterprises (MSMEs) where development cost is expected to be less than | 3 crore. 5) Single vendor cases to go through The new DPP will allow procurements from a single vendor, if the requirements are specific. Countries around the world have leveraged their large purchasing power to benefit from the offsets. Israel, South Korea and China are three major countries that have tremendously benefited from their offset policies. We believe the current pragmatic approach of the Government of India on offsets will help not only to procure the denied technologies for the armed but also create specialised facilities into the country along with bringing huge business for Indian companies. Over the past 19 months, the Defence Acquisition Council has been extremely proactive with capital acquisitions decisions while proposals worth | 2, 39,049 have been cleared with offsets of | 16,934 crore. We believe if the momentum of approvals continues, premier companies like BEL are likely to gain much from these offset opportunities. Exhibit 35: Offset opportunity for Indian companies, July 2014 to October 2015
73310
112938
52801
239049
3248 3012 10673 16934
0250005000075000
100000125000150000175000200000225000250000275000
Indian Army Indian Navy India Air Force Total
| c
rore
Offset opportunity at significant | 16,934 crore
Source: Ministry of Defence, ICICIdirect.com Research

Page 25ICICI Securities Ltd | Retail Equity Research
Exhibit 36: Opportunity size for BEL over FY16E-22E
Particulars BEL opportunity Value (| crore)Electronic Voting Machines 5000Naval surveillance & detection sysytems 686Naval communication / Data transmission equipment 2112Communication and cipher equipment (Army) 5814Army Surveillance equipment 1665Simulators 545IAF weapons 1032Aviation Surveillance systems 532Radars, Gun upgrades, Night vision devices, Howitzers 8000Naval Aviation assets 10% of 10321 1000Tejas 100 Aircrafts 35% of 20000 crore 7000Kamov 200 helicopters 35% of 6000 crore 2100Rafale 15% of 36000 crore 5400Akash 4700Pinaka 14600Tank electronics 10% of 55000 5500Submarines 10% of 60000 6000TOTAL 71686
Source: Ministry of Defence, Media Sources, Company, ICICIdirect.com Research
Export opportunity
The Department of Defence Production in early September 2014 announced a ‘Strategy for defence exports’ followed by a number of policy changes such as exemption from ‘end-user certificate’, online procedures for approvals, opening up sectors such as armoured equipment, weapon control systems, countermeasure equipment, engines, underwater detection devices and military software for easy exports. A formal list of exportable defence items was also endorsed by the Ministry of Defence this year, bringing India at par with international laws governing arms trade. This identifies 16 broad categories of products that can be exported after clearance, bringing clarity to private companies pursuing overseas sales. Apart from the above-mentioned measures, the current government has taken several other initiatives like creating working groups between countries, facilitating inter-country industry interactions through joint visits with policy makers and inviting defence contractors from around the world to participate in “Make in India” initiative.
Major products for exports
• Ship Communication Systems• Electronic Warfare Systems• Electro Optic Fire Control System• Radar Finger Printing System• Identification of Friend or Foe• Hull Mounted Sonar• Radar Warning Receiver• Electronic Voting Machine
Major Products exported by BEL
Source: Company, ICICIdirect.com Research

Page 26ICICI Securities Ltd | Retail Equity Research
Exhibit 37: Export growth at 21% CAGR
15.43 17.7723.67
41.5338.45
32.78
42
58
0
10
20
30
40
50
60
70
FY08 FY09 FY10 FY11 FY12 FY13 FY14 FY15$
mn
Export turnover
Source: Company, ICICIdirect.com Research
In FY08-15, BEL grew its exports four-fold ($15 million to $58 million over seven years, exhibit 37). We believe the same will improve at an accelerated rate from here. BEL has also signed MoUs with global defence contractors, aerospace majors and global OEMs like Lockheed Martin, Boeing, Airbus, Northrop Grumman, Raytheon, Rafale, Elbit Systems, Honeywell, SAAB, etc. for joint development and production. The range of products and services exported has been increasing over the years. A number of international companies are using BEL’s facilities for contract manufacturing. The broad list of products and services being exported is listed below (exhibit 38). Exhibit 38: Exports - country-wise products & services
Products and Services Countries
Defence Communication equipment and spare parts Botswana, Indonesia, Suriname, Malaysia
Radars & Sub-systems Indonesia, Egypt, Switzerland
Electronic Warfare products and services Russia, Brazil
Opto-electronics products Sri Lanka, Nepal, Israel, South AfricaSemiconductor devices, Microwave Tubes and Transmitting Tubes
Malaysia, Singapore, Turkey, Netherlands, UK, USA, France, Hong Kong
Solar Products & SystemsSuriname, Germany, Zimbabwe, Botswana, Kenya, Nigeria
Vacuum Interrupters Malaysia, UAE, Uganda, Turkey, UK, Azerbaijan
Contract Manufacturing & Outsourcing Services USA, Canada, Belgium, Italy, Germany, France, UAE
Electronic Voting Systems Sri Lanka, Uganda, Malawi, South Africa
Radio & TV Broadcasting products and Systems Nepal, Mauritius
Telecom and SATCOM systems Nigeria, Kenya
Source: Company, ICICIdirect.com Research

Page 27ICICI Securities Ltd | Retail Equity Research
BEL has a dedicated business unit and marketing group for exports. With support from the central government and BEL’s expertise and experience in exporting products like sonars, night vision devices, thermal image cameras, coastal security solutions to Southeast Asian countries, we believe revenues from exports will grow at 25% CAGR in FY15-18E.
Exhibit 39: Expect exports to grow at 25.5% CAGR in FY15-18E
5180 5585 5768 6104 62766843
7490
886310003
98 164 474 168 251 367 449 576 7001.9
2.93
8.21
2.76
4
5.376
6.57
0
2000
4000
6000
8000
10000
12000
FY10 FY11 FY12 FY13 FY14 FY15 FY16E FY17E FY18E
| cr
ore
0123456789
%
Revenues Exports Exports as % of Revenue
Source: Company, ICICIdirect.com Research

Page 28ICICI Securities Ltd | Retail Equity Research
Stepping on the gas with high expenditure in R&D
BEL has a well-established R&D base with technology absorption and design capability to meet the technological demands through in-house R&D and strategic technical tie-ups with global players. The company’s R&D spend is around 8% of turnover. BEL derives 85% of its topline from indigenously developed products while around eight new products are introduced every year. The company is the largest production partner of DRDO and its R&D centre is recognised by the Department of Scientific and Industrial Research (DSIR). Some highlights are: • 80% sales revenue from indigenous R&D in past seven years, FY08-15 • Around eight new products introduced every year • BEL has unique three tier R&D structure (exhibit 40) • 2153 engineers deployed in R&D • R&D investment: around 8% of turnover • Level-5 Certification for software development • Largest production partner of DRDO • Patents - six registered, 36 filed • Consistently winning Raksha Mantri awards for design, innovation and indigenisation
Exhibit 40: Three Tier R&D structure with 2153 engineers and 30 R&D centres
Central Research Labs(Banglore & Ghaziabad)
Blue Sky Research - Futuristic Technologies
(Photonics, Cognitive Radios & Radios, Sensor Data Fusion, Networking Waveforms)
Development & Engg Groups at each Unit
Products & Systemsdevelopment
Core Design Groups
Core technology developmentfor running projects
(Defence Software, Encryption, RF & Microwave, Radar Signal Processing)
Source: Company, ICICIdirect.com Research
BEL – One of the highest spenders on R&D among DPSUs Among DPSUs, BEL is one of the few companies to consistently increase its R&D spend. The company’s R&D spend as a percentage of revenues has continuously improved from 5.1% in FY08 to 8.2% in FY15. Higher R&D spends are likely to continue, as the push on indigenisation demands higher allocation towards the same. Our interaction with the management suggests the company will spend 8-10% of its revenues on R&D over the next few years. With 30 R&D centres and a dedicated software technology centre, we believe BEL will emerge as a major beneficiary of “Indigenously designed and developed”, “Make” and “Buy & Make (Indian)” initiatives of the current government.

Page 29ICICI Securities Ltd | Retail Equity Research
Exhibit 41: BEL’s R&D spend, second highest among DPSUs
4103 46245220
5530 5704 6012 61746695
209 243 316 387 468 511 467 549
5.1 5.36.1
7.0
8.2 8.57.6
8.2
0
1000
2000
3000
4000
5000
6000
7000
8000
FY08 FY09 FY10 FY11 FY12 FY13 FY14 FY15
| cr
ore
0123456789
%
Revenues Approx R & D spend R & D as % of Revenues
Source: Company, ICICIdirect.com Research Exhibit 42: Percentage revenues: Indigenous vs. imports & ToT
8375
8378 81 78
8580
1725
1722 19 22
1520
0102030405060708090
FY08 FY09 FY10 FY11 FY12 FY13 FY14 FY15
%
Indigenous Imports & ToT from foreign OEMs
Source: Company, ICICIdirect.com Research
Capabilities built via R&D
• Akash Missile System• Central Acquisition Radar• Weapon lLocating Radar• VHF band Frequency Hopping Radio
• Low level Light Weight Radar• Electro-optical Fire Control System
• Advanced new generation hull mounted sonar
• Integrated air command and control system
Major Products through indigenous R&D
Source: Company, ICICIdirect.com Research

Page 30ICICI Securities Ltd | Retail Equity Research
Acquiring critical technologies through JVs & offset collaboration
BEL has established a joint venture with GE Medical Systems, US for X-ray tubes. The company also set up a subsidiary in Pune called BEL Optronic Devices, which conducts research, develops and manufactures image intensifier tubes and associated high voltage power supply units for use in military, security and commercial systems. BEL has also partnered with aerospace majors Lockheed Martin & Boeing, global defence companies Airbus & Northrop Grumman and other companies like Raytheon & Honeywell to acquire critical technologies and exploit opportunities arising out of offsets. Offsets would entail that the exports of BEL, which were mostly to third-world countries till date, will now be targeted towards the developed countries as well.
BEL has entered into a joint venture (JV) with French defence major Thales. This JV will focus on design, development, marketing, supply and support of civilian and select defence radars for Indian & global markets. Thales owns a 26% stake in the combined entity while BEL owns 74%. Thales has a significant presence in India and is a major supplier to Dassault's Rafale, which has been short-listed for the Indian Air Force's Medium Multi-Role Combat Aircraft (MMRCA) requirement, which is currently in its final stages of approval. Separately, the French defence major is also involved in the Indian Air Force's Mirage-2000 fighter upgrade programme.
If the MMRCA deal goes through with Rafale, it could throw up a significant offset opportunity for BEL as it has a long-standing relation with Thales. Exhibit 43: Summary of BEL ‘s joint venture and subsidiary
Joint Venture / Subsidary
Partner Area of Co-operationEquity
investment by BEL
Equity Holding by BEL
Joint Venture
GE BE Pvt LtdGeneral Electric,
USA
This JVC manufactures CT Max and otherlatest version X-Ray Tubes. BEL supplies someparts required for the products manufacturedby this JVC. BEL received dividend of | 3.7crores from this JVC in FY15
| 2.6 crore 26.0%
Subsidiary
BEL Optronics Ltd (BELOP)
BELOP manufactures Image Intensifier Tubes(I.I. Tubes). These tubes are supplied to thedefence customers and also used in the NightVision Devices manufactured by BEL.
| 9.36 crore 92.8%
BEL – Thales
Thales Air Systems SAS,
France and Thales India Pvt
Ltd (TIPL)
BEL & THALES have formed a joint venture inIndia focusing on the design, development,marketing, supply and support of civilian andselect defence radars for India and the globalmarkets. Incorporated on 28 August 2014,with an authorised capital of | 80 crore andwith a subscribed capital of | 9.6 crore. Duringthe first year of its operation, it incurred a lossof | 162.45 Lakhs.
| 7.1 crore 74.0%
Source: Company, ICICIdirect.com Research
• BEL Optronics Devices Ltd - Night Vision Image Intensifier tubes
• GE BE Pvt Ltd -Medical Electronics Parts, X-Ray Tubes
•BEL Thales Systems Ltd -Civil ATM and select Defence Radars
Subsidiary & JVs

Page 31ICICI Securities Ltd | Retail Equity Research
BEL – Conservative and well-run PSU with consistent track record
BEL has one of the soundest histories among large Indian public sector enterprises. The company delivered a topline, bottomline CAGR of 10.5%, 17.2%, respectively, in the past 15 years (FY00-15), with average RoCEs and RoEs of 22.5% and 21.6%, respectively. A consistent dividend payout of 20%, clean corporate governance, efficient working capital management, adequate R&D spend, ability to absorb latest technologies, timely execution of large projects, strong cash flow generation and prudent capital allocation, all make us believe BEL is an excellent combination of a stable business model with high quality management.
Over the last few decades, decisions in a sensitive industry like defence have happened at an extremely slow pace. With pro-active support from the central government, we believe the BEL story has just begun and several opportunities will open up, both for domestic markets & exports.
Exhibit 44: Strong FCF generation , FCF yield
3170
612
-1261
1668 1766
8701319
-471
-2000
-1000
0
1000
2000
3000
4000
FY11 FY12 FY13 FY14 FY15 FY16E FY17E FY18E
| cr
ore
-6.0
-3.0
0.0
3.0
6.0
9.0
12.0
%
FCF FCF Yield
Source: Company, ICICIdirect.com Research
Exhibit 45: Net cash as percentage of net worth (75% in FY15)
6519 6773
53034564
5882
7551 80849044
131120
7586 82 83
6584
0
2000
4000
6000
8000
10000
FY11 FY12 FY13 FY14 FY15 FY16E FY17E FY18E
| cr
ore
020406080100120140
%
Net Cash As %age of Networth
Source: Company, ICICIdirect.com Research
Exhibit 46: Book to bill, average 3.3x in FY08-15
2360025748 24949
2320021617
68436276610457685585518045844060
113501038695862.4 2.3 2.2
4.24.5
4.13.23.7
0
5000
10000
15000
20000
25000
30000
FY08 FY09 FY10 FY11 FY12 FY13 FY14 FY15
| cr
ore
0.00.51.01.52.02.53.03.54.04.55.0
Revenues Order Backlog Book to Bill
Source: Company, ICICIdirect.com Research

Page 32ICICI Securities Ltd | Retail Equity Research
Exhibit 47: CFO/EBITDA to remain strong
1.3
-1.6
-0.2
1.6
2.1
1.11.3
-1500
-1000
-500
0
500
1000
1500
2000
2500
FY12 FY13 FY14 FY15 FY16E FY17E FY18E
| cr
ore
-2.0
-1.5
-1.0
-0.5
0.0
0.5
1.0
1.5
2.0
2.5
(x)
CFO EBITDA CFO:EBITDA
Source: Company, ICICIdirect.com Research
Exhibit 48: Working capital, best-in-class despite large and lumpy orders
-146
-207
-52
31 33
-105 5
0
100
200
300
400
500
600
FY11 FY12 FY13 FY14 FY15 FY16E FY17E FY18E
Days
-250
-200
-150
-100
-50
0
50
NW
C da
ys
Inventory Days Debtor Days Creditor Days Net Working Capital Days
Source: Company, ICICIdirect.com Research
Exhibit 49: Dividend payout at 20% from past many years
35.9 34.6 37.1
58.462.1
7.2 6.9 7.4 7.8 9.7 10.1 11.7
48.6 50.638.8
12.4
20 20 20 20 20202020
0.0
10.0
20.0
30.0
40.0
50.0
60.0
70.0
FY11 FY12 FY13 FY14 FY15 FY16E FY17E FY18E
| pe
r sha
re
0
5
10
15
20
25%
EPS DPS Dividend Payout
Source: Company, ICICIdirect.com Research
BEL has planned a moderate capex of |1500 crore over the
next three years (| 500 crore/year for FY16E, FY17E and
FY18E, respectively)
BEL has a consistent history of dividend payout of ~20%
for the past 20 years

Page 33ICICI Securities Ltd | Retail Equity Research
Financials Revenues to grow at 13.5% CAGR in FY15-18E
In FY11-15, revenues of BEL have grown at a CAGR of 5.2%. While low single digit growth can be attributed to an indecisive political environment and bureaucratic inertia, we believe credible defence initiatives over the past 19 months will accelerate the revenue growth from here on. The same is also visible in increased order flows to BEL. The company has been awarded large orders like IACCS (order value | 8000 crore) and other orders like advanced composite communication systems, thermal image fire systems, armoured vehicles, etc. We believe order inflow to BEL for FY16E will be to the tune of ~| 12500 (order book for FY16E at ~| 32000 crore), a good 60% rise over last year’s order backlog of | 21671 crore. Thus, we expect revenues to grow at 13.5% CAGR in FY15-18E. Exhibit 50: Standalone revenues to growth at CAGR of 13.5% over FY15-18E
6,2766,843
7,4908,863
10,003
-
2,000
4,000
6,000
8,000
10,000
12,000
FY14 FY15 FY16E FY17E FY18E
| cr
ore
Source: Company, ICICIdirect.com Research
EBITDA to grow at 6.7% CAGR over FY15-18E
EBITDA grew at 3.7% CAGR in FY11-15. As highlighted earlier, BEL has transformed itself from a pure product-selling company to one that takes the contract as a system integrator. For instance, BEL used to win 25-30% of the contract for Akash missiles to supply its radars and related electronics but now BEL receives turnkey orders to supply Akash missiles. From just supplying the product, it now purchases equipment i.e. missiles from HAL and launchers from L&T, assembles the product and then supplies it to the air force. Though this has increased revenues and order inflows for the company, margins are expected come off as profitability on purchased equipment is not as high as its own product.
Going ahead, we expect EBITDA to grow at 6.7% CAGR in FY15-18E. We expect EBITDA margins to decline on account of large orders. Consequently, the EBITDA margin is expected to decline from 16.7% in FY15 to 13.9% in FY18E.
With high order inflows and an improved macro
environment, we expect revenues to grow at 13.5% CAGR
in FY15-18E
We expect EBITDA margins to decline on account of large
orders. This is because profitability on purchased
equipments or sub-parts is lower than its own product

Page 34ICICI Securities Ltd | Retail Equity Research
Exhibit 51: EBITDA and EBITDA margin trend
6,2766,843
7,490
8,86310,003
891 1,143 1,3901,2751,077
14.2
16.7
14.414.4
13.9
-
2,000
4,000
6,000
8,000
10,000
12,000
FY14 FY15 FY16E FY17E FY18E|
cror
e
0
2
4
6
8
10
12
14
16
18
%
Revenues EBITDA EBITDA margin (%)
Source: Company, ICICIdirect.com Research
PAT growth of 8.5% CAGR over FY15-18E
In FY11-FY15, PAT grew at 7.9% CAGR. With healthy topline growth and improvement in execution, we expect the bottomline to grow at 8.5% CAGR in FY15-18E. PAT margins are better than EBITDA margins in case of BEL. This is due to interest income earned by the company on its healthy cash reserves (~| 7500 in FY16E).
Exhibit 52: PAT and PAT margin trend
932
1,167 1,215
1,4011,490
14.8
17.116.2 15.8
14.9
-
200
400
600
800
1,000
1,200
1,400
1,600
FY14 FY15 FY16E FY17E FY18E
| cr
ore
1011121314151617181920
%
Net Profit Margins (%)
Source: Company, ICICIdirect.com Research
We expect EBITDA margins to decline to 13.9% in FY18E
vs. 16.7% in FY15
PAT is expected to grow at 8.5% CAGR over FY15-18E

Page 35ICICI Securities Ltd | Retail Equity Research
Return ratios to remain stable
The return ratios have exhibited a declining trend from RoCEs and RoEs of 20.4% and 14.8% in FY12 to 19.6% and 14.8% in FY15, respectively, for similar reasons of lower margins and large orders with long execution cycles. With moderate capex plans and demand growth revival, capacity utilisation levels are expected to improve leading to stable return ratios. BEL has been a consistent debt-free company with a cash balance of over | 6000 crore in FY15. The company has been prudent in its capital allocation over a past number of years. The same is reflected in its consistently superior return on invested capital (RoIC).
Exhibit 53: Return ratios to improve
-31.0
100.0
39.8
68.4
110.2
82.4 81.5
17.518.417.919.617.718.820.4
13.614.313.814.813.314.214.8
-40.0
-20.0
0.0
20.0
40.0
60.0
80.0
100.0
120.0
FY12 FY13 FY14 FY15 FY16E FY17E FY18E
%
RoCE RoE RoIC
Source: Company, ICICIdirect.com Research
RoEs and RoCEs are expected to remain stable at 17.5%
and 13.6% in FY18E vs. FY15 ratios of 19.6% and 14.8%,
respectively

Page 36ICICI Securities Ltd | Retail Equity Research
Risks & concerns Change of government or Change in stance Currently, the defence sector has been in the limelight mostly due to the government’s strong focus on making defence procurements central to the “Make in India” theme. A strong resolve to build the capability of armed forces indigenously coupled with swift decision making by ‘Ministry of Defence’ has led to a sentimental boost in this segment. Any deviation from this focus, due to policy inaction, slow decision-making or political instability can lead to a significant de-rating of P/E multiple from here. As shown below, the average premium that the company has received on its two year forward earnings is 13x. BEL is currently trading at a premium valuation of 19.3x FY18E in view of the large upcoming opportunity. Thus, for valuations to sustain or inch higher, it is necessary that BEL receives sustained order inflows and the ‘Make in India’ campaign keeps chugging along. Delay/lumpiness in ordering of defence contracts The defence market is monopolistic in nature with the Government of India being the sole buyer of equipment. This puts all large and small suppliers at a disadvantage. Further, defence procurement procedures are complex, tedious and time-consuming. Large orders move at an extraordinarily slow pace. This leads to a high degree of lumpiness in the order book. A delay in approvals, changing requirements of armed forces, delay by consortium partners and inadequate or delayed fund disbursements are some key risks that the company faces. Accordingly, we have worked out the sensitivity of FY17E and FY18E PAT to a delay in probable revenues of the company. Exhibit 54: Sensitivity of FY17E PAT to revenue growth
Revenues -15% -10% 0% +10% +15%FY17E 7533.7 7976.9 8863.2 9749.5 10192.7PAT 1268.6 1313.6 1403.4 1493.3 1538.2
Stansalone revenue FY17E at | 8863.2 crore (Base case)
Source: Company, ICICIdirect.com Research
Exhibit 55: Sensitivity of FY18E PAT to revenue growth
Revenues -15% -10% 0% +10% +15%FY18E 8502.3 9002.5 10002.7 11003.0 11503.1PAT 1350.6 1398 1492.8 1587.6 1635
Standalone revenue FY18E at | 10002.7 crore (Base case)
Source: Company, ICICIdirect.com Research
BEL is currently trading at a premium valuation of 23.9x
FY16E earnings in view of the large upcoming opportunity.
Thus, for valuations to sustain or inch higher, it is
necessary that BEL receives sustained order inflows and
the ‘Make in India’ campaign keeps humming

Page 37ICICI Securities Ltd | Retail Equity Research
Increased competition from private/foreign players to impact margins
The government has shown increased intent in involving private players in the defence procurement process and to develop an active private sector supply in the armed forces. We believe well-managed DPSUs like BEL have a strong competitive advantage over the private sector in the near to medium term. However, competition may gain momentum with private players tying up with foreign players. Foreign tie-ups with Indian private players are happening at a rapid pace. Hence, we believe the same can become serious competition only after a learning curve of five to seven years.
Moreover, due to shortage of trained manpower in the defence industry, it may be difficult for established companies like BEL to retain them. Aggressive bidding by private/foreign players may also lead to a negative impact on BEL’s margins. Gaps in some new technology areas, risk averse and a conservative approach in business development & marketing may also lead to some loss of business to private players and foreign competition. We have done a sensitivity analysis for probable fluctuations in EBITDA margin due to this competition (Exhibit 56 & 57).
Exhibit 56: Sensitivity of FY17E PAT to operating margins (EBITDA margins)
EBITDA margin(%) -200 bps -100 bps 0 bps 100 bps 200 bps12.4 13.4 14.4 15.4 16.4
FY17E 1099.0 1187.7 1274.8 1364.9 1453.6PAT 1260.7 1332.7 1403.4 1476.5 1548.5
Standalone revenue FY17E at | 8863.2 crore (Base case)
Source: Company, ICICIdirect.com Research
Exhibit 57: Sensitivity of FY18E PAT to operating margins (EBITDA margins)
EBITDA margin(%) -200 bps -100 bps 0 bps 100 bps 200 bps11.9 12.9 13.9 14.9 15.9
FY18E 1190.3 1290.4 1389.8 1490.4 1590.4PAT 1335.2 1414.3 1492.8 1572.3 1651.3
Standalone revenue FY18E at | 10002.7 crore (Base Case)
Source: Company, ICICIdirect.com Research
BEL may find it difficult to retain trained manpower and fill
new gaps in new technology areas. We believe large
private players may become serious competition to BEL
only after a learning curve of five to seven years
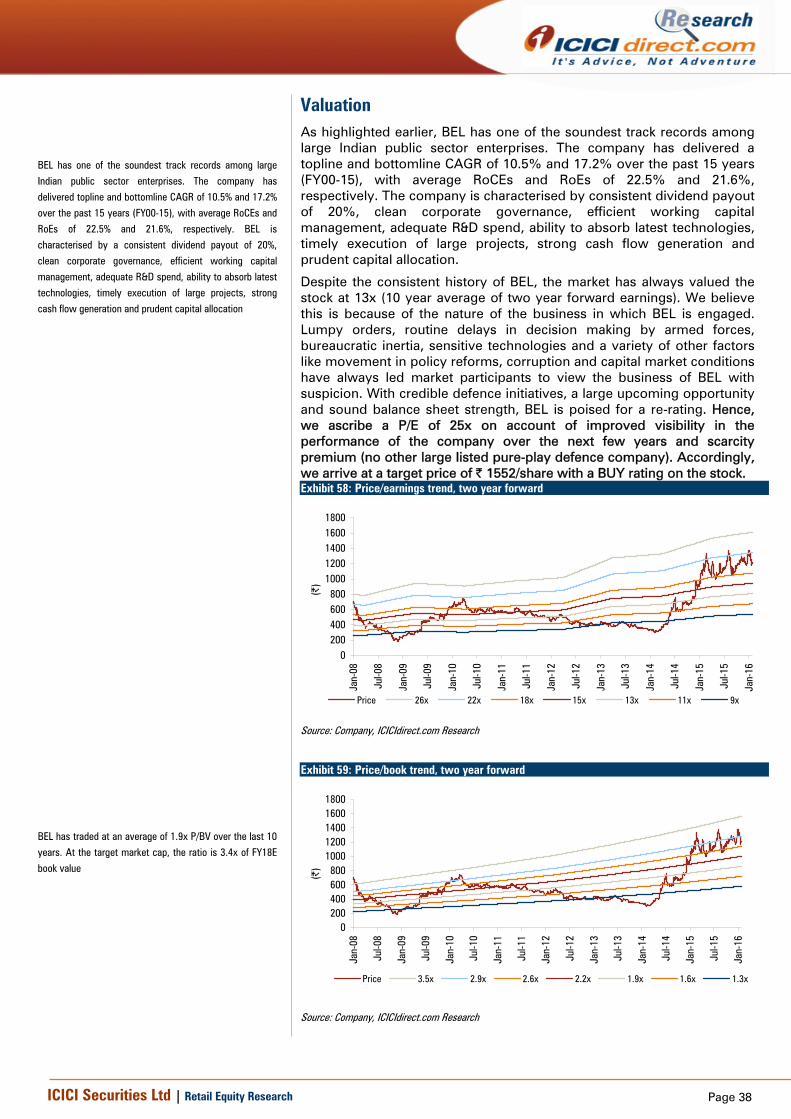
Page 38ICICI Securities Ltd | Retail Equity Research
Valuation As highlighted earlier, BEL has one of the soundest track records among large Indian public sector enterprises. The company has delivered a topline and bottomline CAGR of 10.5% and 17.2% over the past 15 years (FY00-15), with average RoCEs and RoEs of 22.5% and 21.6%, respectively. The company is characterised by consistent dividend payout of 20%, clean corporate governance, efficient working capital management, adequate R&D spend, ability to absorb latest technologies, timely execution of large projects, strong cash flow generation and prudent capital allocation.
Despite the consistent history of BEL, the market has always valued the stock at 13x (10 year average of two year forward earnings). We believe this is because of the nature of the business in which BEL is engaged. Lumpy orders, routine delays in decision making by armed forces, bureaucratic inertia, sensitive technologies and a variety of other factors like movement in policy reforms, corruption and capital market conditions have always led market participants to view the business of BEL with suspicion. With credible defence initiatives, a large upcoming opportunity and sound balance sheet strength, BEL is poised for a re-rating. Hence, we ascribe a P/E of 25x on account of improved visibility in the performance of the company over the next few years and scarcity premium (no other large listed pure-play defence company). Accordingly, we arrive at a target price of | 1552/share with a BUY rating on the stock. Exhibit 58: Price/earnings trend, two year forward
0200400600800
10001200140016001800
Jan-
08
Jul-0
8
Jan-
09
Jul-0
9
Jan-
10
Jul-1
0
Jan-
11
Jul-1
1
Jan-
12
Jul-1
2
Jan-
13
Jul-1
3
Jan-
14
Jul-1
4
Jan-
15
Jul-1
5
Jan-
16
(|)
Price 26x 22x 18x 15x 13x 11x 9x
Source: Company, ICICIdirect.com Research
Exhibit 59: Price/book trend, two year forward
0200400600800
10001200140016001800
Jan-
08
Jul-0
8
Jan-
09
Jul-0
9
Jan-
10
Jul-1
0
Jan-
11
Jul-1
1
Jan-
12
Jul-1
2
Jan-
13
Jul-1
3
Jan-
14
Jul-1
4
Jan-
15
Jul-1
5
Jan-
16
(|)
Price 3.5x 2.9x 2.6x 2.2x 1.9x 1.6x 1.3x
Source: Company, ICICIdirect.com Research
BEL has one of the soundest track records among large
Indian public sector enterprises. The company has
delivered topline and bottomline CAGR of 10.5% and 17.2%
over the past 15 years (FY00-15), with average RoCEs and
RoEs of 22.5% and 21.6%, respectively. BEL is
characterised by a consistent dividend payout of 20%,
clean corporate governance, efficient working capital
management, adequate R&D spend, ability to absorb latest
technologies, timely execution of large projects, strong
cash flow generation and prudent capital allocation
BEL has traded at an average of 1.9x P/BV over the last 10
years. At the target market cap, the ratio is 3.4x of FY18E
book value

Page 39ICICI Securities Ltd | Retail Equity Research
Relative valuations Indian peers: BEL business model more stable than other private players
We have compared BEL with domestic companies that have a major presence in the defence electronics space. Though there is no like-to-like peer for BEL either in terms of scale of operations, technical competence or otherwise, the closest companies are Astra Microwave Products and Centum Electronics. As seen in exhibit 60, the margins of these companies are superior to BEL, as BEL is more into system integration and undertakes large projects. However, we expect margins of almost all players to decline in lieu of increasing competition from a large number of new players, albeit with an increase in business for most players.
We highlight that in anticipation of the upcoming opportunity, all companies in this sector have been significantly re-rated by the market. For further upsides, it is important for earnings to catch up. Though we believe earnings will go up from here, we caution on early exuberance.
Exhibit 60: Growth trend comparison
FY13 FY14 FY15 FY13 FY14 FY15 FY13 FY14 FY15 FY13 FY14 FY15Astra Microwave Products Ltd 1091 92 227.5 531.2 633.6 61.5 84.9 112.8 27.1 16.0 17.8 37.2 50.8 62.8Centum Electronics Ltd 841 89 282.6 425.2 488.0 47.0 87.6 99.2 16.6 20.6 20.3 9.3 34.7 43.3Bharat Electronics Ltd 30168 25 6150.9 6335.9 6895.3 662.9 935.6 1174.6 10.8 14.8 17.0 910.8 951.3 1197.2
Company
PAT
Market Cap Debt
Sales EBITDA MarginEBITDA
Source: Company, Bloomberg, ICICIdirect.com Research
Exhibit 61: Profitability trend comparison and valuation
FY15 FY16E FY17E FY15 FY16E FY17E FY15 FY16E FY17E FY15 FY16E FY17E
Astra Microwave Products Ltd 1091 12.3 20.2 14.8 7.9 11.6 9.1 3.4 3.0 2.5 23.5 16.0 19.5
Centum Electronics Ltd 841 21.2 16.8 12.9 8.5 7.5 6.0 5.0 4.2 3.9 29.0 21.0 19.0
Bharat Electronics Ltd 30168 30.7 23.3 20.7 25.7 19.6 17.1 3.7 4.3 3.9 15.4 14.8 21.3
Company Market Cap
P/E EV/EBITDA P/BV ROE
Source: Company, Bloomberg, ICICIdirect.com Research
BEL’s business model is much more stable compared to other private players and even some multinational peers
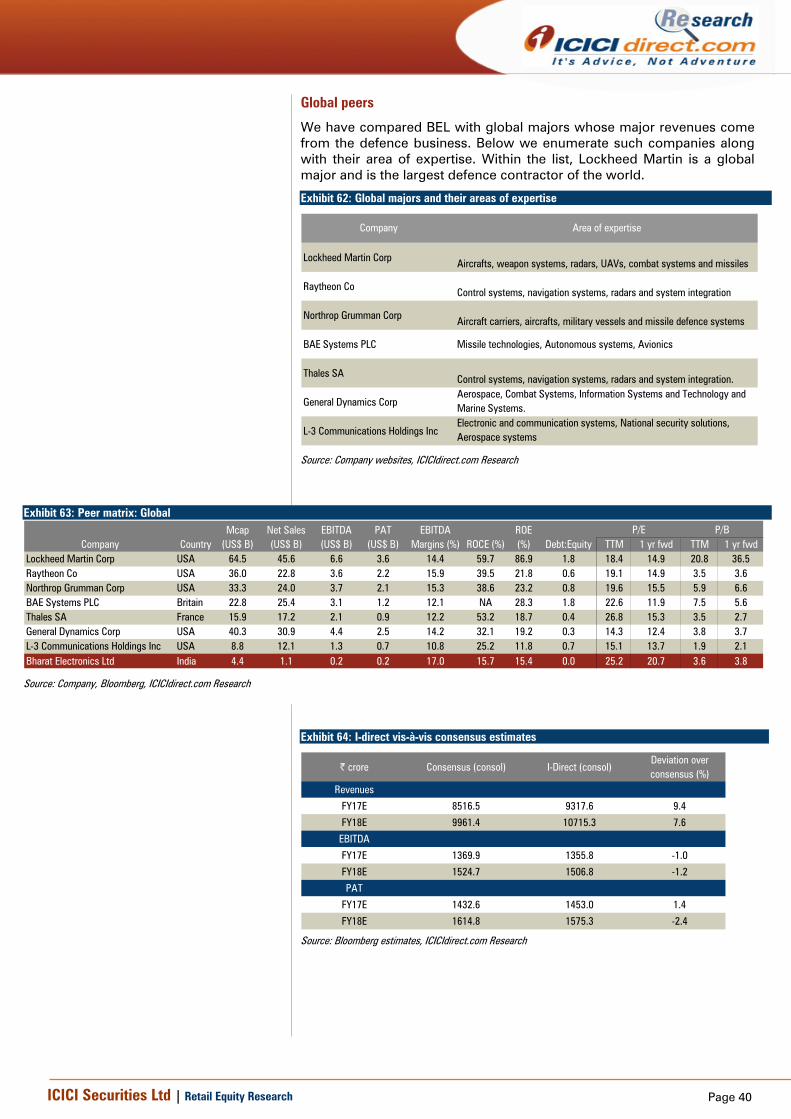
Page 40ICICI Securities Ltd | Retail Equity Research
Global peers
We have compared BEL with global majors whose major revenues come from the defence business. Below we enumerate such companies along with their area of expertise. Within the list, Lockheed Martin is a global major and is the largest defence contractor of the world.
Exhibit 62: Global majors and their areas of expertise
Lockheed Martin Corp Aircrafts, weapon systems, radars, UAVs, combat systems and missiles
Raytheon Co Control systems, navigation systems, radars and system integration
Northrop Grumman Corp Aircraft carriers, aircrafts, military vessels and missile defence systems
BAE Systems PLC Missile technologies, Autonomous systems, Avionics
Thales SA Control systems, navigation systems, radars and system integration.
General Dynamics CorpAerospace, Combat Systems, Information Systems and Technology and Marine Systems.
L-3 Communications Holdings IncElectronic and communication systems, National security solutions, Aerospace systems
Company Area of expertise
Source: Company websites, ICICIdirect.com Research
Exhibit 63: Peer matrix: Global
TTM 1 yr fwd TTM 1 yr fwdLockheed Martin Corp USA 64.5 45.6 6.6 3.6 14.4 59.7 86.9 1.8 18.4 14.9 20.8 36.5Raytheon Co USA 36.0 22.8 3.6 2.2 15.9 39.5 21.8 0.6 19.1 14.9 3.5 3.6Northrop Grumman Corp USA 33.3 24.0 3.7 2.1 15.3 38.6 23.2 0.8 19.6 15.5 5.9 6.6BAE Systems PLC Britain 22.8 25.4 3.1 1.2 12.1 NA 28.3 1.8 22.6 11.9 7.5 5.6Thales SA France 15.9 17.2 2.1 0.9 12.2 53.2 18.7 0.4 26.8 15.3 3.5 2.7General Dynamics Corp USA 40.3 30.9 4.4 2.5 14.2 32.1 19.2 0.3 14.3 12.4 3.8 3.7L-3 Communications Holdings Inc USA 8.8 12.1 1.3 0.7 10.8 25.2 11.8 0.7 15.1 13.7 1.9 2.1Bharat Electronics Ltd India 4.4 1.1 0.2 0.2 17.0 15.7 15.4 0.0 25.2 20.7 3.6 3.8
ROCE (%)ROE (%) Debt:Equity
P/E P/BCompany
Mcap (US$ B)
PAT (US$ B)
EBITDA Margins (%)
Net Sales (US$ B)
EBITDA (US$ B)Country
Source: Company, Bloomberg, ICICIdirect.com Research
Exhibit 64: I-direct vis-à-vis consensus estimates
| crore Consensus (consol) I-Direct (consol)Deviation over consensus (%)
Revenues
FY17E 8516.5 9317.6 9.4
FY18E 9961.4 10715.3 7.6
EBITDA
FY17E 1369.9 1355.8 -1.0
FY18E 1524.7 1506.8 -1.2
PAT
FY17E 1432.6 1453.0 1.4
FY18E 1614.8 1575.3 -2.4 Source: Bloomberg estimates, ICICIdirect.com Research
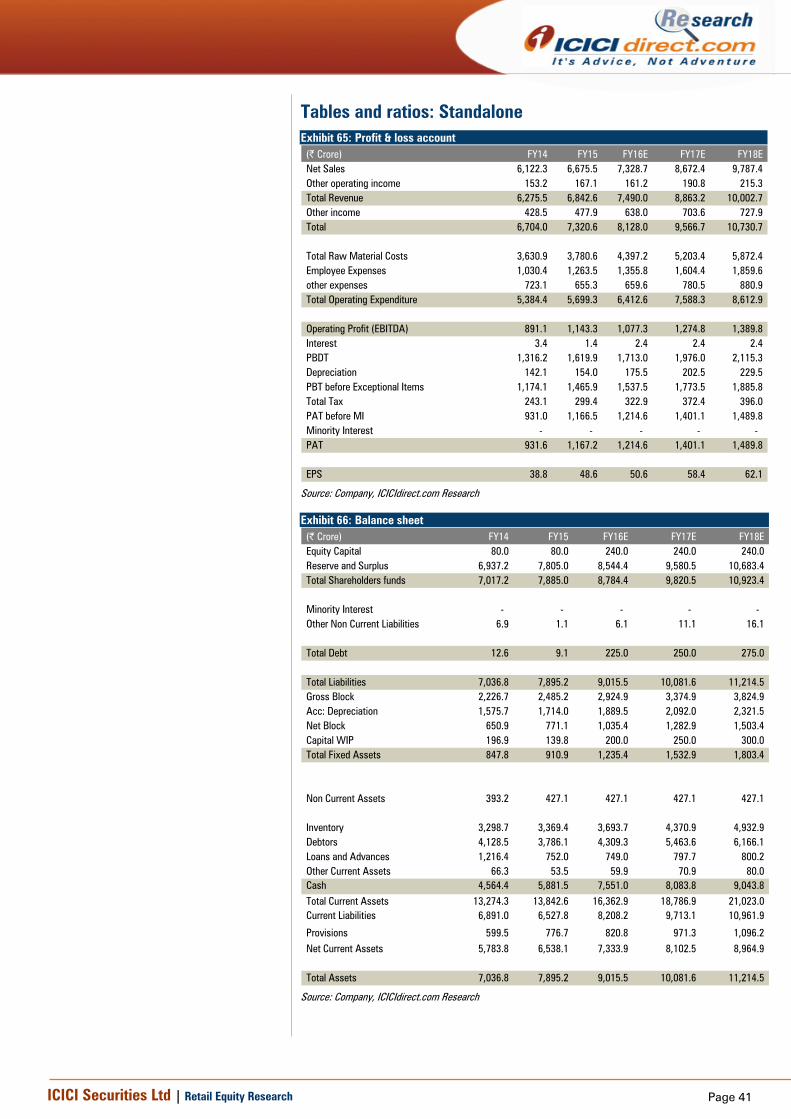
Page 41ICICI Securities Ltd | Retail Equity Research
Tables and ratios: Standalone Exhibit 65: Profit & loss account
(| Crore) FY14 FY15 FY16E FY17E FY18ENet Sales 6,122.3 6,675.5 7,328.7 8,672.4 9,787.4 Other operating income 153.2 167.1 161.2 190.8 215.3 Total Revenue 6,275.5 6,842.6 7,490.0 8,863.2 10,002.7 Other income 428.5 477.9 638.0 703.6 727.9 Total 6,704.0 7,320.6 8,128.0 9,566.7 10,730.7
Total Raw Material Costs 3,630.9 3,780.6 4,397.2 5,203.4 5,872.4 Employee Expenses 1,030.4 1,263.5 1,355.8 1,604.4 1,859.6 other expenses 723.1 655.3 659.6 780.5 880.9 Total Operating Expenditure 5,384.4 5,699.3 6,412.6 7,588.3 8,612.9
Operating Profit (EBITDA) 891.1 1,143.3 1,077.3 1,274.8 1,389.8 Interest 3.4 1.4 2.4 2.4 2.4 PBDT 1,316.2 1,619.9 1,713.0 1,976.0 2,115.3 Depreciation 142.1 154.0 175.5 202.5 229.5 PBT before Exceptional Items 1,174.1 1,465.9 1,537.5 1,773.5 1,885.8 Total Tax 243.1 299.4 322.9 372.4 396.0 PAT before MI 931.0 1,166.5 1,214.6 1,401.1 1,489.8 Minority Interest - - - - - PAT 931.6 1,167.2 1,214.6 1,401.1 1,489.8
EPS 38.8 48.6 50.6 58.4 62.1
Source: Company, ICICIdirect.com Research
Exhibit 66: Balance sheet (| Crore) FY14 FY15 FY16E FY17E FY18EEquity Capital 80.0 80.0 240.0 240.0 240.0 Reserve and Surplus 6,937.2 7,805.0 8,544.4 9,580.5 10,683.4 Total Shareholders funds 7,017.2 7,885.0 8,784.4 9,820.5 10,923.4
Minority Interest - - - - - Other Non Current Liabilities 6.9 1.1 6.1 11.1 16.1
Total Debt 12.6 9.1 225.0 250.0 275.0
Total Liabilities 7,036.8 7,895.2 9,015.5 10,081.6 11,214.5 Gross Block 2,226.7 2,485.2 2,924.9 3,374.9 3,824.9 Acc: Depreciation 1,575.7 1,714.0 1,889.5 2,092.0 2,321.5 Net Block 650.9 771.1 1,035.4 1,282.9 1,503.4 Capital WIP 196.9 139.8 200.0 250.0 300.0 Total Fixed Assets 847.8 910.9 1,235.4 1,532.9 1,803.4
Non Current Assets 393.2 427.1 427.1 427.1 427.1
Inventory 3,298.7 3,369.4 3,693.7 4,370.9 4,932.9 Debtors 4,128.5 3,786.1 4,309.3 5,463.6 6,166.1 Loans and Advances 1,216.4 752.0 749.0 797.7 800.2 Other Current Assets 66.3 53.5 59.9 70.9 80.0 Cash 4,564.4 5,881.5 7,551.0 8,083.8 9,043.8 Total Current Assets 13,274.3 13,842.6 16,362.9 18,786.9 21,023.0 Current Liabilities 6,891.0 6,527.8 8,208.2 9,713.1 10,961.9
Provisions 599.5 776.7 820.8 971.3 1,096.2 Net Current Assets 5,783.8 6,538.1 7,333.9 8,102.5 8,964.9
Total Assets 7,036.8 7,895.2 9,015.5 10,081.6 11,214.5
Source: Company, ICICIdirect.com Research

Page 42ICICI Securities Ltd | Retail Equity Research
Exhibit 67: Cash flow statement (| Crore) FY14 FY15 FY16E FY17E FY18EProfit after Tax 931.6 1,167.2 1,214.6 1,401.1 1,489.8 Depreciation 142.1 154.0 175.5 202.5 229.5 Interest 3.4 1.4 2.4 2.4 2.4 Cash Flow before WC changes 1,077.1 1,322.6 1,392.5 1,606.0 1,721.7 Changes in inventory (107.4) (70.7) (324.2) (677.2) (562.0) Changes in debtors (793.9) 342.4 (523.2) (1,154.3) (702.5) Changes in loans & Advances 221.9 464.4 3.0 (48.7) (2.5) Changes in other current assets 12.9 12.8 (6.4) (11.0) (9.1) Net Increase in Current Assets (666.5) 748.8 (850.8) (1,891.2) (1,276.1) Changes in creditors (511.8) (363.2) 1,680.4 1,504.9 1,248.8 Changes in provisions (116.7) 177.2 44.1 150.5 124.9 Net Increase in Current Liabilities (628.5) (186.0) 1,724.5 1,655.4 1,373.7
Net CF from Operating activities (217.9) 1,885.4 2,266.2 1,370.2 1,819.3
Changes in deferred tax assets (27.9) (38.3) - - - (Purchase)/Sale of Fixed Assets (253.1) (217.0) (500.0) (500.0) (500.0) Net CF from Investing activities (292.3) (263.9) (495.0) (495.0) (495.0)
Dividend and Dividend Tax (218.1) (281.0) (290.9) (337.0) (357.1) Net CF from Financing Activities (228.0) (304.3) (101.7) (342.4) (364.3)
Net Cash flow (738.2) 1,317.1 1,669.5 532.8 960.0 Opening Cash/Cash Equivalent 5,302.6 4,564.4 5,881.5 7,551.0 8,083.8 Closing Cash/ Cash Equivalent 4,564.4 5,881.5 7,551.0 8,083.8 9,043.8
Source: Company, ICICIdirect.com Research
Exhibit 68: Ratio analysis (Year-end March) FY14 FY15 FY16E FY17E FY18EPer Share DataEPS 38.8 48.6 50.6 58.4 62.1 Cash per Share 190.2 245.1 314.6 336.8 376.8 BV 292.4 328.5 366.0 409.2 455.1 Dividend per share 7.8 9.7 10.1 11.7 12.4 Dvidend payout ratio 0.2 0.2 0.2 0.2 0.2 Operating RatiosEBITDA Margin 14.6 17.1 14.7 14.7 14.2 PAT Margin 15.2 17.5 16.6 16.2 15.2 Return RatiosRoE 13.3 14.8 13.8 14.3 13.6 RoCE 17.7 19.6 17.9 18.4 17.5 RoIC 39.8 68.4 107.7 81.2 80.4 Valuation RatiosEV / EBITDA 27.5 20.3 20.2 16.6 14.6 P/E 31.2 24.9 23.9 20.7 19.5 EV / Net Sales 3.9 3.4 2.9 2.4 2.0 Sales / Equity 0.9 0.9 0.9 0.9 0.9 Market Cap / Sales 4.6 4.2 3.9 3.3 2.9 Price to Book Value 4.1 3.7 3.3 3.0 2.7 Turnover RatiosAsset turnover 2.5 3.4 4.4 3.9 4.1 Debtors Turnover Ratio 1.7 1.7 1.9 1.8 1.7 Creditors Turnover Ratio 0.9 1.0 1.0 1.0 1.0 Solvency RatiosDebt / Equity 0.0 0.0 0.0 0.0 0.0
Current Ratio 1.2 1.1 1.0 1.0 1.0 Quick Ratio 0.7 0.6 0.6 0.6 0.6
Source: Company, ICICIdirect.com Research
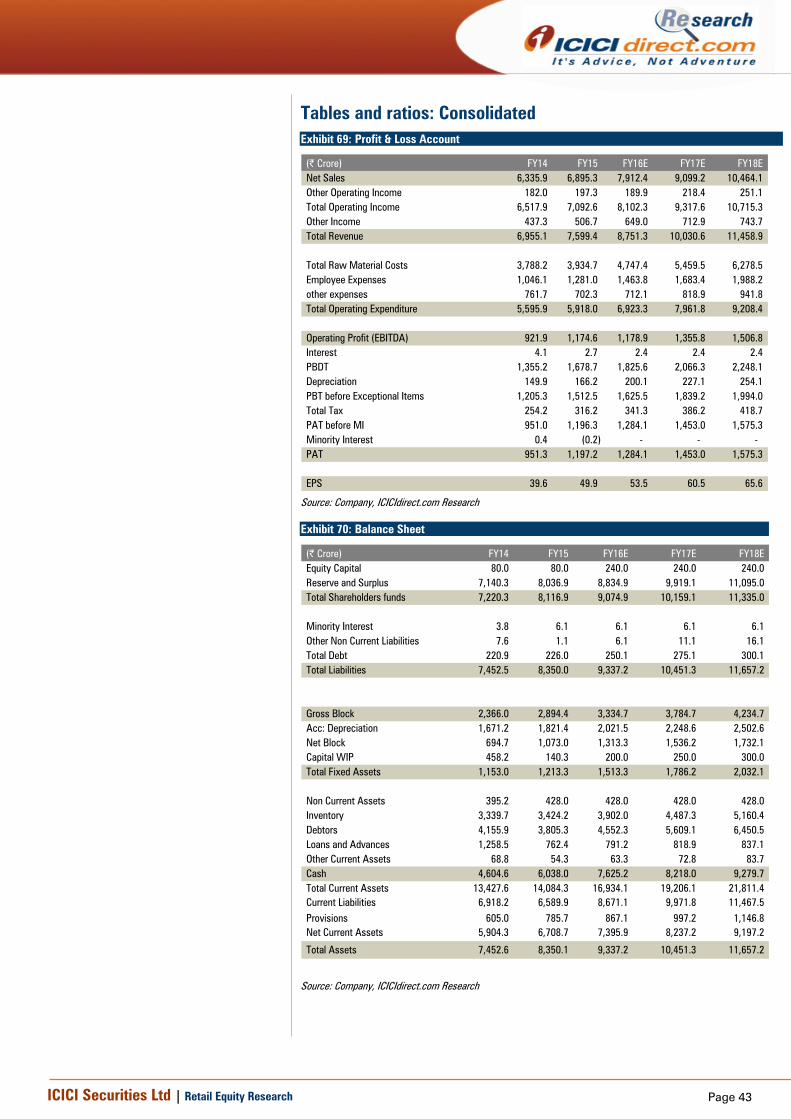
Page 43ICICI Securities Ltd | Retail Equity Research
Tables and ratios: Consolidated Exhibit 69: Profit & Loss Account
(| Crore) FY14 FY15 FY16E FY17E FY18ENet Sales 6,335.9 6,895.3 7,912.4 9,099.2 10,464.1 Other Operating Income 182.0 197.3 189.9 218.4 251.1 Total Operating Income 6,517.9 7,092.6 8,102.3 9,317.6 10,715.3 Other Income 437.3 506.7 649.0 712.9 743.7 Total Revenue 6,955.1 7,599.4 8,751.3 10,030.6 11,458.9
Total Raw Material Costs 3,788.2 3,934.7 4,747.4 5,459.5 6,278.5 Employee Expenses 1,046.1 1,281.0 1,463.8 1,683.4 1,988.2 other expenses 761.7 702.3 712.1 818.9 941.8 Total Operating Expenditure 5,595.9 5,918.0 6,923.3 7,961.8 9,208.4
Operating Profit (EBITDA) 921.9 1,174.6 1,178.9 1,355.8 1,506.8 Interest 4.1 2.7 2.4 2.4 2.4 PBDT 1,355.2 1,678.7 1,825.6 2,066.3 2,248.1 Depreciation 149.9 166.2 200.1 227.1 254.1 PBT before Exceptional Items 1,205.3 1,512.5 1,625.5 1,839.2 1,994.0 Total Tax 254.2 316.2 341.3 386.2 418.7 PAT before MI 951.0 1,196.3 1,284.1 1,453.0 1,575.3 Minority Interest 0.4 (0.2) - - - PAT 951.3 1,197.2 1,284.1 1,453.0 1,575.3
EPS 39.6 49.9 53.5 60.5 65.6 Source: Company, ICICIdirect.com Research
Exhibit 70: Balance Sheet
(| Crore) FY14 FY15 FY16E FY17E FY18EEquity Capital 80.0 80.0 240.0 240.0 240.0 Reserve and Surplus 7,140.3 8,036.9 8,834.9 9,919.1 11,095.0 Total Shareholders funds 7,220.3 8,116.9 9,074.9 10,159.1 11,335.0
Minority Interest 3.8 6.1 6.1 6.1 6.1 Other Non Current Liabilities 7.6 1.1 6.1 11.1 16.1 Total Debt 220.9 226.0 250.1 275.1 300.1 Total Liabilities 7,452.5 8,350.0 9,337.2 10,451.3 11,657.2
Gross Block 2,366.0 2,894.4 3,334.7 3,784.7 4,234.7 Acc: Depreciation 1,671.2 1,821.4 2,021.5 2,248.6 2,502.6 Net Block 694.7 1,073.0 1,313.3 1,536.2 1,732.1 Capital WIP 458.2 140.3 200.0 250.0 300.0 Total Fixed Assets 1,153.0 1,213.3 1,513.3 1,786.2 2,032.1
Non Current Assets 395.2 428.0 428.0 428.0 428.0 Inventory 3,339.7 3,424.2 3,902.0 4,487.3 5,160.4 Debtors 4,155.9 3,805.3 4,552.3 5,609.1 6,450.5 Loans and Advances 1,258.5 762.4 791.2 818.9 837.1 Other Current Assets 68.8 54.3 63.3 72.8 83.7 Cash 4,604.6 6,038.0 7,625.2 8,218.0 9,279.7 Total Current Assets 13,427.6 14,084.3 16,934.1 19,206.1 21,811.4 Current Liabilities 6,918.2 6,589.9 8,671.1 9,971.8 11,467.5 Provisions 605.0 785.7 867.1 997.2 1,146.8 Net Current Assets 5,904.3 6,708.7 7,395.9 8,237.2 9,197.2
Total Assets 7,452.6 8,350.1 9,337.2 10,451.3 11,657.2
Source: Company, ICICIdirect.com Research

Page 44ICICI Securities Ltd | Retail Equity Research
Exhibit 71: Cash Flow Statement
(| Crore) FY14 FY15 FY16E FY17E FY18EProfit after Tax 951.3 1,197.2 1,284.1 1,453.0 1,575.3 Depreciation 149.9 166.2 200.1 227.1 254.1 Interest 4.1 2.7 2.4 2.4 2.4 Cash Flow before WC changes 1,105.2 1,366.0 1,486.6 1,682.5 1,831.7 Changes in inventory (84.5) (84.5) (477.8) (585.3) (673.1) Changes in debtors (792.3) 350.6 (747.0) (1,056.8) (841.4) Changes in loans & Advances 279.8 496.1 (28.9) (27.7) (18.2) Changes in other current assets 12.3 14.5 (9.0) (9.5) (10.9) Net Increase in Current Assets (584.6) 776.7 (1,262.6) (1,679.3) (1,543.6) Changes in creditors (525.2) (328.3) 2,081.2 1,300.7 1,495.8 Changes in provisions (114.9) 180.6 81.4 130.1 149.6 Net Increase in Current Liabilities (640.1) (147.6) 2,162.6 1,430.7 1,645.3
Net CF from Operating activities (119.5) 1,995.1 2,386.6 1,433.9 1,933.5
Changes in deferred tax assets (27.5) (36.9) - - - (Purchase)/Sale of Fixed Assets (374.6) (226.5) (500.0) (500.0) (500.0) Net CF from Investing activities (444.9) (263.5) (495.0) (495.0) (495.0)
Dividend and Dividend Tax (218.5) (281.6) (300.5) (339.8) (367.8) Net CF from Financing Activities (161.6) (298.2) (304.4) (346.2) (376.8)
Net Cash flow (726.0) 1,433.4 1,587.2 592.7 1,061.8 Opening Cash/Cash Equivalent 5,330.6 4,604.6 6,038.0 7,625.2 8,218.0 Closing Cash/ Cash Equivalent 4,604.6 6,038.0 7,625.2 8,218.0 9,279.7
Source: Company, ICICIdirect.com Research
Exhibit 72: Ratio Analysis
(Year-end March) FY14 FY15 FY16E FY17E FY18EPer Share DataEPS 39.6 49.9 53.5 60.5 65.6 Cash per Share 191.9 251.6 317.7 342.4 386.7 BV 300.8 338.2 378.1 423.3 472.3 Dividend per share 7.8 9.7 10.7 12.1 13.1 Dvidend payout ratio 0.2 0.2 0.2 0.2 0.2 Operating RatiosEBITDA Margin 14.1 16.6 14.6 14.6 14.1 PAT Margin 14.6 16.9 15.8 15.6 14.7 Return RatiosRoE 13.2 14.7 14.2 14.3 13.9 RoCE 17.1 19.1 18.3 18.4 17.8 RoIC 38.7 57.8 90.3 72.6 75.9 Valuation RatiosEV / EBITDA 26.7 19.8 18.4 15.6 13.3 P/E 30.5 24.3 22.6 20.0 18.4 EV / Net Sales 3.9 3.4 2.7 2.3 1.9 Sales / Equity 0.9 0.8 0.9 0.9 0.9 Market Cap / Sales 4.6 4.2 3.7 3.2 2.8 Price to Book Value 4.0 3.6 3.2 2.9 2.6 Turnover RatiosAsset turnover 2.1 2.7 4.0 3.6 3.9 Debtors Turnover Ratio 1.7 1.8 1.9 1.8 1.8 Creditors Turnover Ratio 0.9 1.1 1.1 1.0 1.0 Solvency RatiosDebt / Equity 0.0 0.0 0.0 0.0 0.0
Current Ratio 1.2 1.1 1.0 1.0 1.0 Quick Ratio 0.7 0.6 0.6 0.6 0.6
Source: Company, ICICIdirect.com Research

Page 45ICICI Securities Ltd | Retail Equity Research
RATING RATIONALE ICICIdirect.com endeavours to provide objective opinions and recommendations. ICICIdirect.com assigns ratings to its stocks according to their notional target price vs. current market price and then categorises them as Strong Buy, Buy, Hold and Sell. The performance horizon is two years unless specified and the notional target price is defined as the analysts' valuation for a stock. Strong Buy: >15%/20% for large caps/midcaps, respectively, with high conviction; Buy: >10%/15% for large caps/midcaps, respectively; Hold: Up to +/-10%; Sell: -10% or more;
Pankaj Pandey Head – Research [email protected]
ICICIdirect.com Research Desk, ICICI Securities Limited, 1st Floor, Akruti Trade Centre, Road No. 7, MIDC, Andheri (East) Mumbai – 400 093

Page 46ICICI Securities Ltd | Retail Equity Research
Disclaimer
ANALYST CERTIFICATION We /I, Chirag Shah PGDBM; Sagar Gandhi MBA (Finance), Research Analysts, authors and the names subscribed to this report, hereby certify that all of the views expressed in this research report accurately reflect our views about the subject issuer(s) or securities. We also certify that no part of our compensation was, is, or will be directly or indirectly related to the specific recommendation(s) or view(s) in this report.
Terms & conditions and other disclosures: ICICI Securities Limited (ICICI Securities) is a Sebi registered Research Analyst having registration no. INH000000990. ICICI Securities Limited (ICICI Securities) is a full-service, integrated investment banking and is, inter alia, engaged in the business of stock brokering and distribution of financial products. ICICI Securities is a wholly-owned subsidiary of ICICI Bank which is India’s largest private sector bank and has its various subsidiaries engaged in businesses of housing finance, asset management, life insurance, general insurance, venture capital fund management, etc. (“associates”), the details in respect of which are available on www.icicibank.com. ICICI Securities is one of the leading merchant bankers/ underwriters of securities and participate in virtually all securities trading markets in India. We and our associates might have investment banking and other business relationship with a significant percentage of companies covered by our Investment Research Department. ICICI Securities generally prohibits its analysts, persons reporting to analysts and their relatives from maintaining a financial interest in the securities or derivatives of any companies that the analysts cover. The information and opinions in this report have been prepared by ICICI Securities and are subject to change without any notice. The report and information contained herein is strictly confidential and meant solely for the selected recipient and may not be altered in any way, transmitted to, copied or distributed, in part or in whole, to any other person or to the media or reproduced in any form, without prior written consent of ICICI Securities. While we would endeavour to update the information herein on a reasonable basis, ICICI Securities is under no obligation to update or keep the information current. Also, there may be regulatory, compliance or other reasons that may prevent ICICI Securities from doing so. Non-rated securities indicate that rating on a particular security has been suspended temporarily and such suspension is in compliance with applicable regulations and/or ICICI Securities policies, in circumstances where ICICI Securities might be acting in an advisory capacity to this company, or in certain other circumstances. This report is based on information obtained from public sources and sources believed to be reliable, but no independent verification has been made nor is its accuracy or completeness guaranteed. This report and information herein is solely for informational purpose and shall not be used or considered as an offer document or solicitation of offer to buy or sell or subscribe for securities or other financial instruments. Though disseminated to all the customers simultaneously, not all customers may receive this report at the same time. ICICI Securities will not treat recipients as customers by virtue of their receiving this report. Nothing in this report constitutes investment, legal, accounting and tax advice or a representation that any investment or strategy is suitable or appropriate to your specific circumstances. The securities discussed and opinions expressed in this report may not be suitable for all investors, who must make their own investment decisions, based on their own investment objectives, financial positions and needs of specific recipient. This may not be taken in substitution for the exercise of independent judgment by any recipient. The recipient should independently evaluate the investment risks. The value and return on investment may vary because of changes in interest rates, foreign exchange rates or any other reason. ICICI Securities accepts no liabilities whatsoever for any loss or damage of any kind arising out of the use of this report. Past performance is not necessarily a guide to future performance. Investors are advised to see Risk Disclosure Document to understand the risks associated before investing in the securities markets. Actual results may differ materially from those set forth in projections. Forward-looking statements are not predictions and may be subject to change without notice. ICICI Securities or its associates might have managed or co-managed public offering of securities for the subject company or might have been mandated by the subject company for any other assignment in the past twelve months. ICICI Securities or its associates might have received any compensation from the companies mentioned in the report during the period preceding twelve months from the date of this report for services in respect of managing or co-managing public offerings, corporate finance, investment banking or merchant banking, brokerage services or other advisory service in a merger or specific transaction. ICICI Securities or its associates might have received any compensation for products or services other than investment banking or merchant banking or brokerage services from the companies mentioned in the report in the past twelve months. ICICI Securities encourages independence in research report preparation and strives to minimize conflict in preparation of research report. ICICI Securities or its analysts did not receive any compensation or other benefits from the companies mentioned in the report or third party in connection with preparation of the research report. Accordingly, neither ICICI Securities nor Research Analysts have any material conflict of interest at the time of publication of this report. It is confirmed that Chirag Shah PGDBM; Sagar Gandhi MBA (Finance), Research Analysts of this report have not received any compensation from the companies mentioned in the report in the preceding twelve months. Compensation of our Research Analysts is not based on any specific merchant banking, investment banking or brokerage service transactions. ICICI Securities or its subsidiaries collectively or Research Analysts do not own 1% or more of the equity securities of the Company mentioned in the report as of the last day of the month preceding the publication of the research report. Since associates of ICICI Securities are engaged in various financial service businesses, they might have financial interests or beneficial ownership in various companies including the subject company/companies mentioned in this report. It is confirmed that Chirag Shah PGDBM; Sagar Gandhi MBA (Finance), Research Analysts do not serve as an officer, director or employee of the companies mentioned in the report. ICICI Securities may have issued other reports that are inconsistent with and reach different conclusion from the information presented in this report. Neither the Research Analysts nor ICICI Securities have been engaged in market making activity for the companies mentioned in the report. We submit that no material disciplinary action has been taken on ICICI Securities by any Regulatory Authority impacting Equity Research Analysis activities. This report is not directed or intended for distribution to, or use by, any person or entity who is a citizen or resident of or located in any locality, state, country or other jurisdiction, where such distribution, publication, availability or use would be contrary to law, regulation or which would subject ICICI Securities and affiliates to any registration or licensing requirement within such jurisdiction. The securities described herein may or may not be eligible for sale in all jurisdictions or to certain category of investors. Persons in whose possession this document may come are required to inform themselves of and to observe such restriction.
ICICI Securities has received an investment banking mandate from Government of India for disinvestment in Bharat Electronics Limited. This report is prepared based on publicly available information.