
Glenmark Pharmaceuticals (GLEPHA) | 699 - Open Online...
15
July 31, 2017 ICICI Securities Ltd | Retail Equity Research Result Update gZetia exclusivity, domestic growth drive Q1 Revenues grew 20% YoY to | 2363 crore (I-direct estimate: | 2146 crore) mainly due to 50% YoY growth in the US to | 1045 crore (I- direct estimate: | 920 crore) led by gZetia Exclusivity. India business surprisingly grew 15% YoY to | 616 crore (I-direct estimate: | 437 crore) despite GST transition EBITDA margins increased 519 bps YoY to 24.4% (I-direct estimate: 18.6%) attributable to lower raw material, employee and other expenses. EBITDA increased 52% YoY to | 578 crore (I-direct estimate: | 399 crore) Adjusted net profit increased 47% YoY to | 333 crore mainly due to a strong operational performance US growth from new launches to offset base business price erosion US generics (~44% of total revenues) grew at ~15% CAGR over FY12-17. Total USFDA filings as on date are 185. So far, the company has received approval for 118. Out of 67 pending ANDAs, ~27 are Para IV applications. Key therapies in the US, going forward, will be oncology dermatology and respiratory. The company expects to file 20-25 ANDAs and launch 10- 15 ANDAs annually in the US. We expect US sales to remain subdued in FY17-19E to | 3284 (ex-gZetia CAGR ~5% in constant currency), mainly due to higher base and pricing pressure in the US. Targeting specific therapies in IPM Glenmark is ranked fourteenth in domestic formulations with market share of 2.2%. It is a market leader in dermatology and improving its presence in therapies like respiratory, CVS, anti-infectives and even anti- diabetics. It has defied industry growth consistently for the last 60 months by continuous churning of the portfolio. In FY17, Glenmark’s growth was 14% vis-à-vis IPM growth of 9% as per IMS MAT. We expect India sales to grow at 12% CAGR in FY17-19E to | 2909 crore US, India main growth drivers The R&D setback in 2008-10 has, in fact, benefited the company as the focus shifted to more productive segments like the US generics, India and Europe. The changed focus has improved the leverage situation as the debt/EBITDA has improved from a high of 4.6x in FY09 to 1.8x in FY17. With a 10-year roadmap, the company has a well thought out strategy in place encompassing only three core therapy areas oncology, dermatology and respiratory across geographies and covering both specialty and generics. We expect improvement in FCF generation from FY18 on account of core business strength and lower debt stress. Product launches in US to hold key; downgrade to HOLD Strong Q1 was largely driven by gZetia exclusivity in the US and domestic formulation growth of 15% despite GST transition. The management has downgraded revenue guidance to 8-9% (12-15%) for FY18 owing to pricing pressure in the US and strengthening of the rupee. Despite strong 67 pending approvals in the US, we do not expect any meaningful launches at least in near term. Besides this, acute pricing pressure due to increased competition and client consolidation looms large on US growth in the near term. Ex-US, we expect strong growth from other markets due to new product launches and stabilisation of currency in emerging markets. However, a change in the product is likely to impact overall margins. We reduce our FY18E, FY19E EPS estimates by 18%, 20%, respectively. Accordingly, we arrive at our new target price of | 730 based on 18x FY19E EPS of | 40.6. Rating matrix Rating : Hold Target : | 730 Target Period : 12-15 months Potential Upside : 4% What’s Changed? Target Changed from | 910 to | 730 EPS FY18E Changed from | 47.2 to | 38.7 EPS FY19E Changed from | 50.5 to | 40.6 Rating Unchanged Quarterly Performance Q1FY18 Q1FY17 YoY (%) Q4FY17 QoQ (%) Revenue 2,363.0 1,969.4 20.0 2,457.2 -3.8 EBITDA 577.5 379.1 52.3 443.8 30.1 EBITDA (%) 24.4 19.2 518.9 18.1 637.4 Adj. Net Profit 333.4 226.8 47.0 264.7 25.9 Key Financials (| Crore) FY16 FY17E FY18E FY19E Revenues 7746.5 9287.7 9441.7 10075.9 EBITDA 1620.4 2138.8 1906.2 1964.1 Adjusted PAT 906.6 1294.2 1088.7 1143.1 EPS (|) 32.2 46.0 38.7 40.6 Valuation summary FY16 FY17E FY18E FY19E PE (x) 21.7 16.2 18.1 17.2 Target PE (x) 22.7 15.9 18.9 18.0 EV to EBITDA (x) 14.1 10.9 12.3 11.6 Price to book (x) 4.6 3.9 3.2 2.7 RoNW (%) 21.2 25.5 17.9 15.9 RoCE (%) 16.2 18.9 15.9 15.5 Stock data Particular Market Capitalisation Debt (FY17E) Cash (FY17E) EV 52 week H/L (|) 994/600 Equity capital Face value | 1 | 23429 crore Amount | 19717 crore | 4724 crore | 1011 crore | 28.2 crore Price performance (%) 1M 3M 6M 1Y Glenmark Pharma 5.1 18.7 5.7 -8.8 Divi's Labs 4.1 7.3 -3.7 -43.8 Cadila Healthcare -10.9 -7.8 -20.6 -18.4 Glenmark Pharmaceuticals (GLEPHA) | 699 Research Analyst Siddhant Khandekar [email protected] Mitesh Shah [email protected] Harshal Mehta [email protected]
Transcript of Glenmark Pharmaceuticals (GLEPHA) | 699 - Open Online...

July 31, 2017
ICICI Securities Ltd | Retail Equity Research
Result Update
gZetia exclusivity, domestic growth drive Q1
Revenues grew 20% YoY to | 2363 crore (I-direct estimate: | 2146
crore) mainly due to 50% YoY growth in the US to | 1045 crore (I-
direct estimate: | 920 crore) led by gZetia Exclusivity. India business
surprisingly grew 15% YoY to | 616 crore (I-direct estimate: | 437
crore) despite GST transition
EBITDA margins increased 519 bps YoY to 24.4% (I-direct estimate:
18.6%) attributable to lower raw material, employee and other
expenses. EBITDA increased 52% YoY to | 578 crore (I-direct
estimate: | 399 crore)
Adjusted net profit increased 47% YoY to | 333 crore mainly due to a
strong operational performance
US growth from new launches to offset base business price erosion
US generics (~44% of total revenues) grew at ~15% CAGR over FY12-17.
Total USFDA filings as on date are 185. So far, the company has received
approval for 118. Out of 67 pending ANDAs, ~27 are Para IV applications.
Key therapies in the US, going forward, will be oncology dermatology
and respiratory. The company expects to file 20-25 ANDAs and launch 10-
15 ANDAs annually in the US. We expect US sales to remain subdued in
FY17-19E to | 3284 (ex-gZetia CAGR ~5% in constant currency), mainly
due to higher base and pricing pressure in the US.
Targeting specific therapies in IPM
Glenmark is ranked fourteenth in domestic formulations with market
share of 2.2%. It is a market leader in dermatology and improving its
presence in therapies like respiratory, CVS, anti-infectives and even anti-
diabetics. It has defied industry growth consistently for the last 60 months
by continuous churning of the portfolio. In FY17, Glenmark’s growth was
14% vis-à-vis IPM growth of 9% as per IMS MAT. We expect India sales
to grow at 12% CAGR in FY17-19E to | 2909 crore
US, India main growth drivers
The R&D setback in 2008-10 has, in fact, benefited the company as the
focus shifted to more productive segments like the US generics, India and
Europe. The changed focus has improved the leverage situation as the
debt/EBITDA has improved from a high of 4.6x in FY09 to 1.8x in FY17.
With a 10-year roadmap, the company has a well thought out strategy in
place encompassing only three core therapy areas oncology,
dermatology and respiratory across geographies and covering both
specialty and generics. We expect improvement in FCF generation from
FY18 on account of core business strength and lower debt stress.
Product launches in US to hold key; downgrade to HOLD
Strong Q1 was largely driven by gZetia exclusivity in the US and domestic
formulation growth of 15% despite GST transition. The management has
downgraded revenue guidance to 8-9% (12-15%) for FY18 owing to
pricing pressure in the US and strengthening of the rupee. Despite strong
67 pending approvals in the US, we do not expect any meaningful
launches at least in near term. Besides this, acute pricing pressure due to
increased competition and client consolidation looms large on US growth
in the near term. Ex-US, we expect strong growth from other markets due
to new product launches and stabilisation of currency in emerging
markets. However, a change in the product is likely to impact overall
margins. We reduce our FY18E, FY19E EPS estimates by 18%, 20%,
respectively. Accordingly, we arrive at our new target price of | 730
based on 18x FY19E EPS of | 40.6.
Rating matrix
Rating : Hold
Target : | 730
Target Period : 12-15 months
Potential Upside : 4%
What’s Changed?
Target Changed from | 910 to | 730
EPS FY18E Changed from | 47.2 to | 38.7
EPS FY19E Changed from | 50.5 to | 40.6
Rating Unchanged
Quarterly Performance
Q1FY18 Q1FY17 YoY (%) Q4FY17 QoQ (%)
Revenue 2,363.0 1,969.4 20.0 2,457.2 -3.8
EBITDA 577.5 379.1 52.3 443.8 30.1
EBITDA (%) 24.4 19.2 518.9 18.1 637.4
Adj. Net Profit 333.4 226.8 47.0 264.7 25.9
Key Financials
(| Crore) FY16 FY17E FY18E FY19E
Revenues 7746.5 9287.7 9441.7 10075.9
EBITDA 1620.4 2138.8 1906.2 1964.1
Adjusted PAT 906.6 1294.2 1088.7 1143.1
EPS (|) 32.2 46.0 38.7 40.6
Valuation summary
FY16 FY17E FY18E FY19E
PE (x) 21.7 16.2 18.1 17.2
Target PE (x) 22.7 15.9 18.9 18.0
EV to EBITDA (x) 14.1 10.9 12.3 11.6
Price to book (x) 4.6 3.9 3.2 2.7
RoNW (%) 21.2 25.5 17.9 15.9
RoCE (%) 16.2 18.9 15.9 15.5
Stock data
Particular
Market Capitalisation
Debt (FY17E)
Cash (FY17E)
EV
52 week H/L (|) 994/600
Equity capital
Face value | 1
| 23429 crore
Amount
| 19717 crore
| 4724 crore
| 1011 crore
| 28.2 crore
Price performance (%)
1M 3M 6M 1Y
Glenmark Pharma 5.1 18.7 5.7 -8.8
Divi's Labs 4.1 7.3 -3.7 -43.8
Cadila Healthcare -10.9 -7.8 -20.6 -18.4
Glenmark Pharmaceuticals (GLEPHA) | 699
Research Analyst
Siddhant Khandekar
Mitesh Shah
Harshal Mehta
ICICI Securities Ltd | Retail Equity Research Page 2
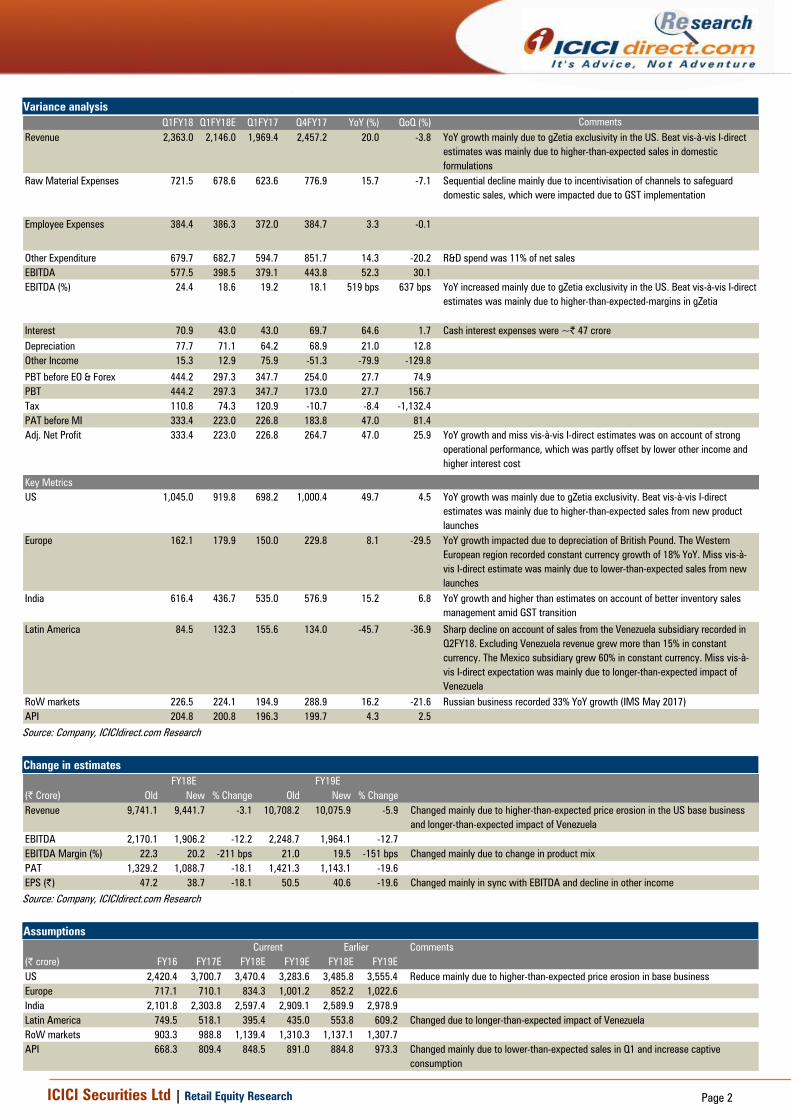
Variance analysis
Q1FY18 Q1FY18E Q1FY17 Q4FY17 YoY (%) QoQ (%) Comments
Revenue 2,363.0 2,146.0 1,969.4 2,457.2 20.0 -3.8 YoY growth mainly due to gZetia exclusivity in the US. Beat vis-à-vis I-direct
estimates was mainly due to higher-than-expected sales in domestic
formulations
Raw Material Expenses 721.5 678.6 623.6 776.9 15.7 -7.1 Sequential decline mainly due to incentivisation of channels to safeguard
domestic sales, which were impacted due to GST implementation
Employee Expenses 384.4 386.3 372.0 384.7 3.3 -0.1
Other Expenditure 679.7 682.7 594.7 851.7 14.3 -20.2 R&D spend was 11% of net sales
EBITDA 577.5 398.5 379.1 443.8 52.3 30.1
EBITDA (%) 24.4 18.6 19.2 18.1 519 bps 637 bps YoY increased mainly due to gZetia exclusivity in the US. Beat vis-à-vis I-direct
estimates was mainly due to higher-than-expected-margins in gZetia
Interest 70.9 43.0 43.0 69.7 64.6 1.7 Cash interest expenses were ~| 47 crore
Depreciation 77.7 71.1 64.2 68.9 21.0 12.8
Other Income 15.3 12.9 75.9 -51.3 -79.9 -129.8
PBT before EO & Forex 444.2 297.3 347.7 254.0 27.7 74.9
PBT 444.2 297.3 347.7 173.0 27.7 156.7
Tax 110.8 74.3 120.9 -10.7 -8.4 -1,132.4
PAT before MI 333.4 223.0 226.8 183.8 47.0 81.4
Adj. Net Profit 333.4 223.0 226.8 264.7 47.0 25.9 YoY growth and miss vis-à-vis I-direct estimates was on account of strong
operational performance, which was partly offset by lower other income and
higher interest cost
Key Metrics
US 1,045.0 919.8 698.2 1,000.4 49.7 4.5 YoY growth was mainly due to gZetia exclusivity. Beat vis-à-vis I-direct
estimates was mainly due to higher-than-expected sales from new product
launches
Europe 162.1 179.9 150.0 229.8 8.1 -29.5 YoY growth impacted due to depreciation of British Pound. The Western
European region recorded constant currency growth of 18% YoY. Miss vis-à-
vis I-direct estimate was mainly due to lower-than-expected sales from new
launches
India 616.4 436.7 535.0 576.9 15.2 6.8 YoY growth and higher than estimates on account of better inventory sales
management amid GST transition
Latin America 84.5 132.3 155.6 134.0 -45.7 -36.9 Sharp decline on account of sales from the Venezuela subsidiary recorded in
Q2FY18. Excluding Venezuela revenue grew more than 15% in constant
currency. The Mexico subsidiary grew 60% in constant currency. Miss vis-à-
vis I-direct expectation was mainly due to longer-than-expected impact of
Venezuela
RoW markets 226.5 224.1 194.9 288.9 16.2 -21.6 Russian business recorded 33% YoY growth (IMS May 2017)
API 204.8 200.8 196.3 199.7 4.3 2.5
Source: Company, ICICIdirect.com Research
Change in estimates
(| Crore) Old New % Change Old New % Change
Revenue 9,741.1 9,441.7 -3.1 10,708.2 10,075.9 -5.9 Changed mainly due to higher-than-expected price erosion in the US base business
and longer-than-expected impact of Venezuela
EBITDA 2,170.1 1,906.2 -12.2 2,248.7 1,964.1 -12.7
EBITDA Margin (%) 22.3 20.2 -211 bps 21.0 19.5 -151 bps Changed mainly due to change in product mix
PAT 1,329.2 1,088.7 -18.1 1,421.3 1,143.1 -19.6
EPS (|) 47.2 38.7 -18.1 50.5 40.6 -19.6 Changed mainly in sync with EBITDA and decline in other income
FY18E FY19E
Source: Company, ICICIdirect.com Research
Assumptions
Comments
(| crore) FY16 FY17E FY18E FY19E FY18E FY19E
US 2,420.4 3,700.7 3,470.4 3,283.6 3,485.8 3,555.4 Reduce mainly due to higher-than-expected price erosion in base business
Europe 717.1 710.1 834.3 1,001.2 852.2 1,022.6
India 2,101.8 2,303.8 2,597.4 2,909.1 2,589.9 2,978.9
Latin America 749.5 518.1 395.4 435.0 553.8 609.2 Changed due to longer-than-expected impact of Venezuela
RoW markets 903.3 988.8 1,139.4 1,310.3 1,137.1 1,307.7
API 668.3 809.4 848.5 891.0 884.8 973.3 Changed mainly due to lower-than-expected sales in Q1 and increase captive
consumption
Current Earlier

ICICI Securities Ltd | Retail Equity Research Page 3
Company Analysis
Incorporated in 1977, Glenmark was never a mass-market player with a
clear focus on niche areas like dermatology, respiratory and cardiology.
The company was one of the few Indian players (like Dr Reddy’s) to
identify the importance of dedicated R&D efforts in the nineties. Post its
maiden IPO in 2000, the company started ramping up the API business
via small acquisitions. In 2005, it struck its first out-licensing R&D seal with
US based Forest Laboratories for COPD, asthma molecule with
Oglemilast. Similar R&D deals were struck with innovator companies such
as Eli Lily and Merck KGaA (Germany). It received a substantial amount in
the nature of upfront – milestone payments.
However, it received a setback in most deals, one after another in 2007-
09, as clients were unsatisfied with the progress or uninterested in
pursuing the same any further due to changed priorities or budgetary
constraints. This had hit the company hard during that period as unlike
other Indian players, which hived off the risky R&D ventures into separate
companies to protect the core balance sheet, Glenmark hived off the
generic business. Its balance sheet got stretched with huge debts.
However, post the R&D debacle, the company refocused on the generics
business, especially in the US and Indian formulations putting R&D on the
backburner. The change has worked going by the performance in the last
two or three years as strong traction in the US, backed by forays into
niche areas such as oral contraceptives and dermatology, robust growth
in Indian formulations and strong tractions from RoW and LatAm markets
have improved the balance sheet and operating cash flows significantly.
The R&D deals are still active but the focus on innovative R&D and generic
R&D is almost equal. The company has almost fully recovered the amount
spent on innovative R&D, which is almost US$200 million in the last nine
years. With other geographies also chipping in, the growth, going ahead,
is likely to be broad based with India and the US, the largest geographies
growing at a decent pace and emerging segments such as RoW markets
and Latin America showing greater traction. The company also remains
committed to API exports. We expect revenues to grow at a CAGR of 4%
to | 10076 crore in FY17-19E.
Exhibit 1: Revenues to grow at CAGR of 4% in FY17-19E
4021.7
5013.7
6007.3
6644.8
7746.5
9287.7 9441.7
10075.9
0
2000
4000
6000
8000
10000
12000
FY12 FY13 FY14 FY15 FY16 FY17E FY18E FY19E
(| crore)
Revenues
Source: Company, ICICIdirect.com Research
14% CAGR
4.2% CAGR
ICICI Securities Ltd | Retail Equity Research Page 4
Glenmark has reclassified it operations into six categories - India, US,
Europe, Latin America, RoW markets and APIs. Earlier, the classification
was on the basis of - 1) specialty businesses and 2) generics businesses.
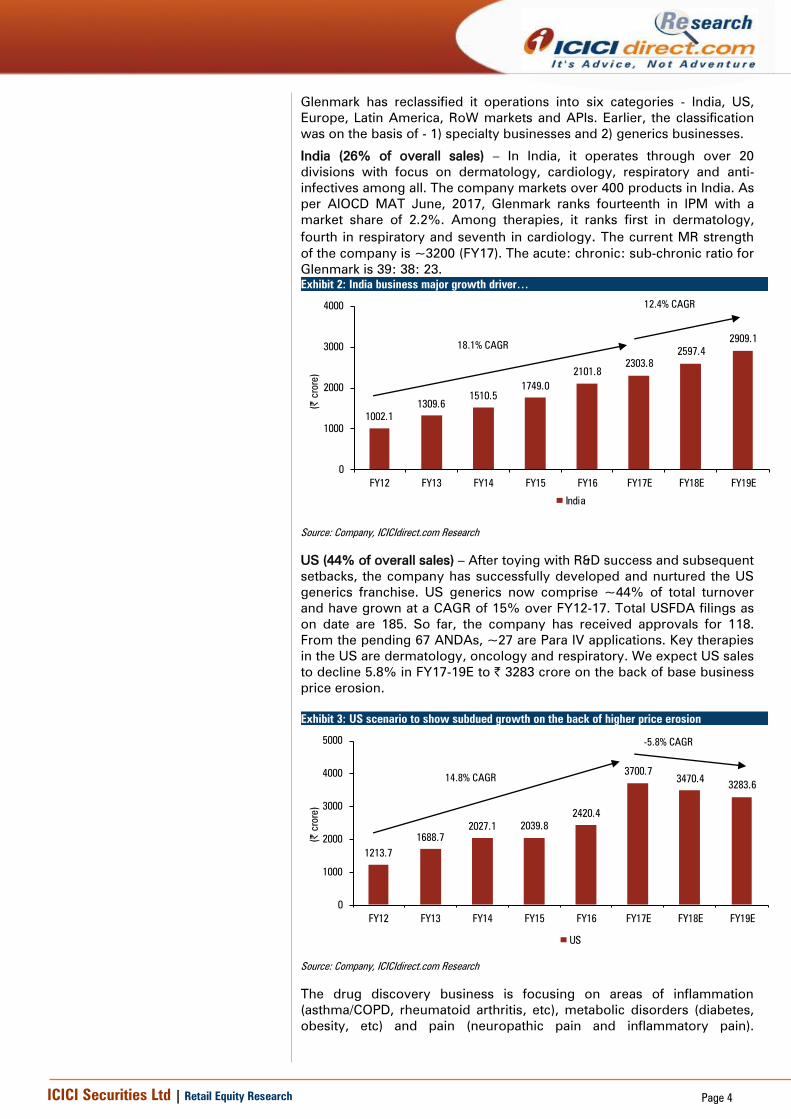
India (26% of overall sales) – In India, it operates through over 20
divisions with focus on dermatology, cardiology, respiratory and anti-
infectives among all. The company markets over 400 products in India. As
per AIOCD MAT June, 2017, Glenmark ranks fourteenth in IPM with a
market share of 2.2%. Among therapies, it ranks first in dermatology,
fourth in respiratory and seventh in cardiology. The current MR strength
of the company is ~3200 (FY17). The acute: chronic: sub-chronic ratio for
Glenmark is 39: 38: 23.
Exhibit 2: India business major growth driver…
1002.1
1309.6
1510.5
1749.0
2101.8
2303.8
2597.4
2909.1
0
1000
2000
3000
4000
FY12 FY13 FY14 FY15 FY16 FY17E FY18E FY19E
(| crore)
India
Source: Company, ICICIdirect.com Research
US (44% of overall sales) – After toying with R&D success and subsequent
setbacks, the company has successfully developed and nurtured the US
generics franchise. US generics now comprise ~44% of total turnover
and have grown at a CAGR of 15% over FY12-17. Total USFDA filings as
on date are 185. So far, the company has received approvals for 118.
From the pending 67 ANDAs, ~27 are Para IV applications. Key therapies
in the US are dermatology, oncology and respiratory. We expect US sales
to decline 5.8% in FY17-19E to | 3283 crore on the back of base business
price erosion.
Exhibit 3: US scenario to show subdued growth on the back of higher price erosion
1213.7
1688.7
2027.1 2039.8
2420.4
3700.7
3470.43283.6
0
1000
2000
3000
4000
5000
FY12 FY13 FY14 FY15 FY16 FY17E FY18E FY19E
(| crore)
US
Source: Company, ICICIdirect.com Research
The drug discovery business is focusing on areas of inflammation
(asthma/COPD, rheumatoid arthritis, etc), metabolic disorders (diabetes,
obesity, etc) and pain (neuropathic pain and inflammatory pain).
18.1% CAGR
12.4% CAGR
14.8% CAGR
-5.8% CAGR
ICICI Securities Ltd | Retail Equity Research Page 5
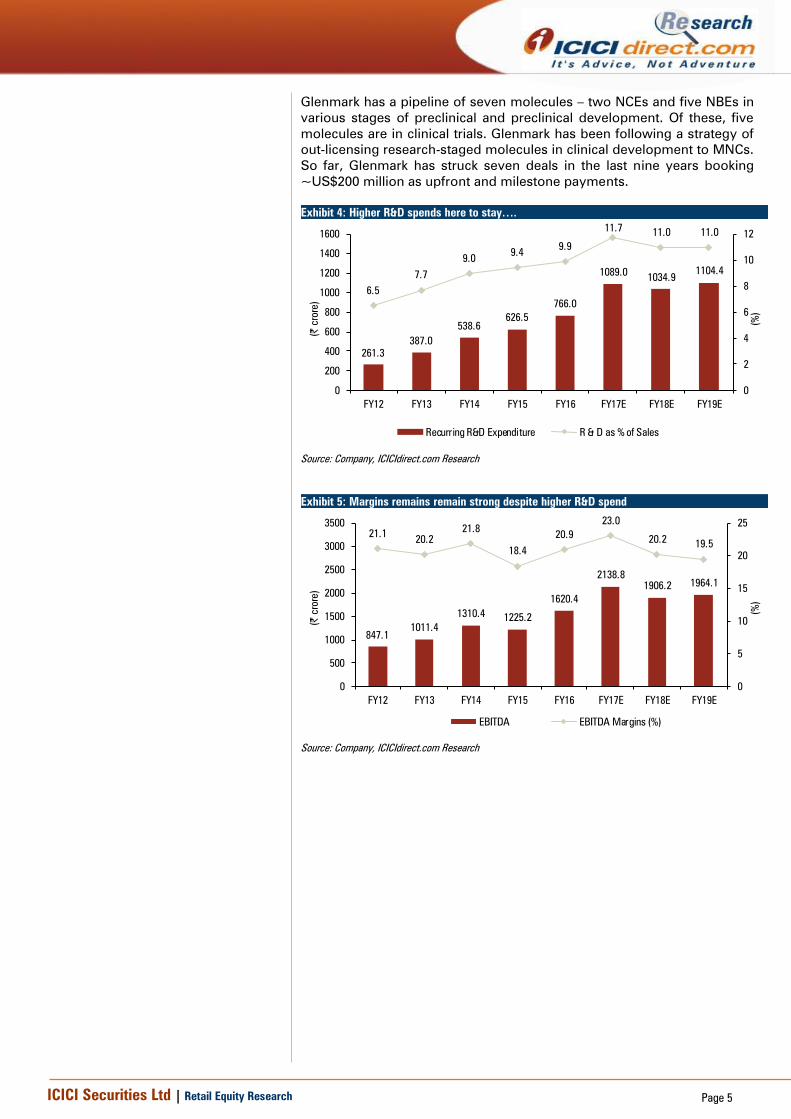
Glenmark has a pipeline of seven molecules – two NCEs and five NBEs in
various stages of preclinical and preclinical development. Of these, five
molecules are in clinical trials. Glenmark has been following a strategy of
out-licensing research-staged molecules in clinical development to MNCs.
So far, Glenmark has struck seven deals in the last nine years booking
~US$200 million as upfront and milestone payments.
Exhibit 4: Higher R&D spends here to stay….
261.3
387.0
538.6
626.5
766.0
1089.01034.9
1104.4
6.5
7.7
9.09.4
9.9
11.711.0 11.0
0
2
4
6
8
10
12
0
200
400
600
800
1000
1200
1400
1600
FY12 FY13 FY14 FY15 FY16 FY17E FY18E FY19E
(%
)
(| crore)
Recurring R&D Expenditure R & D as % of Sales
Source: Company, ICICIdirect.com Research
Exhibit 5: Margins remains remain strong despite higher R&D spend
847.1
1011.4
1310.41225.2
1620.4
2138.8
1906.2 1964.1
21.120.2
21.8
18.4
20.9
23.0
20.219.5
0
5
10
15
20
25
0
500
1000
1500
2000
2500
3000
3500
FY12 FY13 FY14 FY15 FY16 FY17E FY18E FY19E
(%
)
(| crore)
EBITDA EBITDA Margins (%)
Source: Company, ICICIdirect.com Research

ICICI Securities Ltd | Retail Equity Research Page 6
Exhibit 6: Net profit to grow at CAGR of 3% in FY17-19E on lower base
464.3
623.0
542.6 463.8
906.6
1213.2
1088.71143.1
0
200
400
600
800
1000
1200
1400
FY12 FY13 FY14 FY15 FY16 FY17E FY18E FY19E
(| crore)
Net Profit
Source: Company, ICICIdirect.com Research
Exhibit 7: Return ratios to improve, going ahead…
15.8 15.5
16.9
13.3
16.2
18.9
15.9 15.5
24.6
22.4
25.5
21.7 21.2
25.5
17.9
15.9
0
5
10
15
20
25
30
FY12 FY13 FY14 FY15 FY16 FY17E FY18E FY19E
(%
)
RoCE (%) RoNW (%)
Source: Company, ICICIdirect.com Research

ICICI Securities Ltd | Retail Equity Research Page 7
Exhibit 8: Trends in quarterly financials
(| Crore) Q1FY15 Q2FY15 Q3FY15 Q4FY15 Q1FY16 Q2FY16 Q3FY16 Q4FY16 Q1FY17 Q2FY17 Q3FY17 Q4FY17 Q1FY18 YoY (%) QoQ (%)
Total Operating Income 1486.9 1680.7 1701.3 1775.8 1647.7 1874.6 1778.3 2281.3 1969.4 2224.1 2535.0 2457.2 2363.0 20.0 -3.8
Raw Material Expenses 447.2 548.9 556.0 381.8 484.5 549.4 513.3 743.9 623.6 614.8 599.0 776.9 721.5 15.7 -7.1
% of revenue 30.1 32.7 32.7 21.5 29.4 29.3 28.9 32.6 31.7 27.6 23.6 31.6 30.5
Gross Profit 1039.7 1131.8 1145.3 1394.0 1163.3 1325.2 1265.0 1537.3 1345.8 1609.4 1936.0 1680.2 1641.6 22.0 -2.3
Gross Profit Margin (%) 69.9 67.3 67.3 78.5 70.6 70.7 71.1 67.4 68.3 72.4 76.4 68.4 69.5 113 bps 109 bps
Employee Expenses 276.4 355.3 316.5 254.2 286.3 398.4 345.1 348.2 372.0 482.4 401.7 384.7 384.4 3.3 -0.1
% of revenue 18.6 21.1 18.6 14.3 17.4 21.3 19.4 15.3 18.9 21.7 15.8 15.7 16.3
Other Manufacturing Expenses421.0 440.7 563.1 858.4 517.7 524.9 549.3 886.8 594.7 678.2 769.3 851.7 679.7 14.3 -20.2
% of revenue 28.3 26.2 33.1 48.3 31.4 28.0 30.9 38.9 30.2 30.5 30.3 34.7 28.8
Total Expenditure 1144.6 1344.9 1435.6 1494.4 1288.4 1472.8 1407.7 1978.9 1590.3 1775.3 1770.0 2013.3 1785.6 12.3 -11.3
% of revenue 77.0 80.0 84.4 84.2 78.2 78.6 79.2 86.7 80.8 79.8 69.8 81.9 75.6
EBITDA 342.3 335.8 265.7 281.4 359.3 401.9 370.6 302.4 379.1 448.8 765.0 443.8 577.5 52.3 30.1
EBITDA Margins (%) 23.0 20.0 15.6 15.8 21.8 21.4 20.8 13.3 19.2 20.2 30.2 18.1 24.4 519 bps 637 bps
Depreciation 65.1 65.0 65.5 64.5 65.4 63.4 51.5 58.4 64.2 68.7 62.5 68.9 77.7 21.0 12.8
Interest 48.1 51.6 51.3 39.7 41.9 42.6 46.9 47.5 43.0 62.9 61.7 69.7 70.9 64.6 1.7
Other Income 3.5 1.0 2.1 0.3 5.4 0.8 2.1 11.7 75.9 -1.8 14.6 -51.3 15.3 -79.9 -129.8
Forex & EO 0.0 0.0 0.0 -187.1 0.0 0.0 0.0 0.0 0.0 0.0 0.0 -80.9 0.0
PBT 232.6 220.2 151.0 -9.5 257.4 296.7 274.4 208.2 347.7 315.4 655.3 173.0 444.2 27.7 156.7
Total Tax 47.7 55.2 36.3 -20.1 74.5 96.2 78.3 59.4 120.9 91.8 178.2 -10.7 110.8 -8.4 -1132.4
Tax rate (%) 20.5 25.1 24.0 211.5 28.9 32.4 28.5 28.5 34.8 29.1 27.2 -6.2 24.9 -984 bps 3114 bps
PAT 184.9 165.0 114.8 10.6 182.9 200.4 196.1 148.7 226.8 223.6 477.1 183.8 333.4 47.0 81.4
Minority Interest 0.0 0.0 0.0 0.0 0.0 0.0 0.0 -0.1 0.0 0.0 0.1 0.0 0.0 NA NA
PAT after MI 184.9 165.0 114.8 10.6 182.9 200.4 196.2 148.8 226.8 223.6 477.0 183.8 333.4 47.0 81.4
EPS (|) 6.6 5.9 4.1 0.4 6.5 7.1 7.0 5.3 8.1 7.9 16.9 6.5 11.8 47.0 81.4
Source: Company, ICICIdirect.com Research
SWOT Analysis
Strengths - Prudent geographical mix covering high opportunity
emerging markets as well as developed markets. Presence in niche
therapies in the US such as oral contraceptives, dermatology, which is
relatively less crowded. Time tested R&D focused business model with a
portfolio of Innovative products. Well placed to monetise the R&D pipeline
in with product in various stages of completion
Weakness - High debt level. Presence of substantial intangibles on the
balance sheet. Higher R&D spends likely to put pressure on margins
Opportunities - In the US generics space, a lot of opportunities are
panning out in the oral contraceptives and respiratory space
Industry specific threats - Increased USFDA scrutiny across the globe
regarding cGMP issues, pricing pressure due to client consolidation in the
US, pricing probe by the Department of Justice (DoJ) in the US and
proposed tightening by the new regime by adapting to the bidding
process
Company specific threat: Currency volatility in LatAm and RoW markets

ICICI Securities Ltd | Retail Equity Research Page 8
Conference call highlights
The management has achieved its guided range of $170-180
million for gZetia sales during exclusivity period
On the out-licensing front, four molecules have been actively
pursued. 1) GBR830 (dermatology): The management expects
phase II data in a week and six to eight companies currently
interested in it to co-develop the product. 2) GSP301 (respiratory):
Has completed phase three and has a OTC component. ANDA
filing in FY18 and launch in FY19. 3) GBR1342 (oncology): It
received clearance from the USFDA on an Investigational New
Drug Application (IND) for GBR 1342 in May 2017 and plans to
initiate the study in the Q2-Q3 of this financial year
The company is EBITDA and cash positive in Latin America
On the domestic front, the company booked strong April-May
sales. However, June sales were challenging due to GST
transition
The management expects domestic revenue growth for Q2FY17
at 10-15% and ~15% in FY18
The management expects Q2FY18 to be challenging in terms of
margins. However, for FY18 it has guided for ~22% margins
The management has guided for Q2 US base of $125 million due
to late approvals in Q1 and expects three to four good approvals
in Q3 and Q4
The management expects to file gAdvair in FY19 or FY20
The management sees US base price erosion to continue in the
range of 10-12%
Net debt is expected to decline in FY18 by | 300 crore
Market Share: Domestic
MAT June 2017 (%) MAT June 2016 (%)
Cardiac 4.0 3.9
Respiratory 4.6 4.1
Anti Diabetic 1.6 2.1
Derma 9.2 8.8
Source: IMS, Company, ICICIdirect.com Research

ICICI Securities Ltd | Retail Equity Research Page 9
Exhibit 9: Facilities
Location Segment Regulatory Approvals Type
Nashik, India Formulations WHO GMP, ANVISA, NDA-Uganda, MOH-Nigeria, TFDA-Tanzania, MOH-Ethopia, MOH,
Congo, MCC-SA, MOH-Oman, MOH-Ukraine, INVIMA-Colombia
solid & liquid orals, external creams &
powders
Baddi, India Formulations USFDA, WHO GMP, ANVISA Brazil, UKMHRA, MCC SA, TGA Australia, NDA Uganda,
Ukraine GMP, DDA Nepal, TPD Canada, FDA Ghana, CHMP Kenya
solid orals, semi-solid and liquid orals as well
as external preparations like lotions, creams,
etc
Nalagarh, India Formulations ANVISA (Brazil), UGANDA, WHO GMP, Local FDA Liquid, Ointment/Cream, and Lotion
Sikkim, India Formulations Oral solids (Tablets and Capsules) Ointments,
Creams, Lotions and Liquids
Vysoke Myto, Czech Formulations Manufacturing licence for medicinal products (issued by SUKL), Distribution licence for
medicinal products (issued by SUKL), Certificate of GMP Compliance of Manufacturer
(issued by SUKL), Certificate of GMP Compliance of a Manufacturer (issued by USKVBL)
solid-orals and semi-solids (ointments)
Sao Paulo, Brazil Formulations WHO-GMP, ANVISA Brazil
Bardez, Goa Formulations USFDA, TPD (Canada), MCC (South Africa), WHO-GMP, ANVISA (Brazil), MHRA (UK),
ISO 14001:2004
Oral Solids, Semi Solids & Hormones
Solan, HP Formulations
Pithampur, Indore Formulations USFDA, UKMHRA solid oraldosage forms
Buenos Aires, Argentina Formulations cytotoxics, anti hormonals,
lyophilizedinjectables and supportive
therapies
Aurangabad, Maharashtra Formulations
Monroe, USA Formulations
Ankleshwar, Bharuch, Gujarat API WHO GMP, USFDA, MHRA - UK, MHRA - Romania and EMEA
Solapur, Maharashtra API
Pune Maharashtra API
Bharuch, Gujarat API
Source: Company, ICICIdirect.com Research
ICICI Securities Ltd | Retail Equity Research Page 10
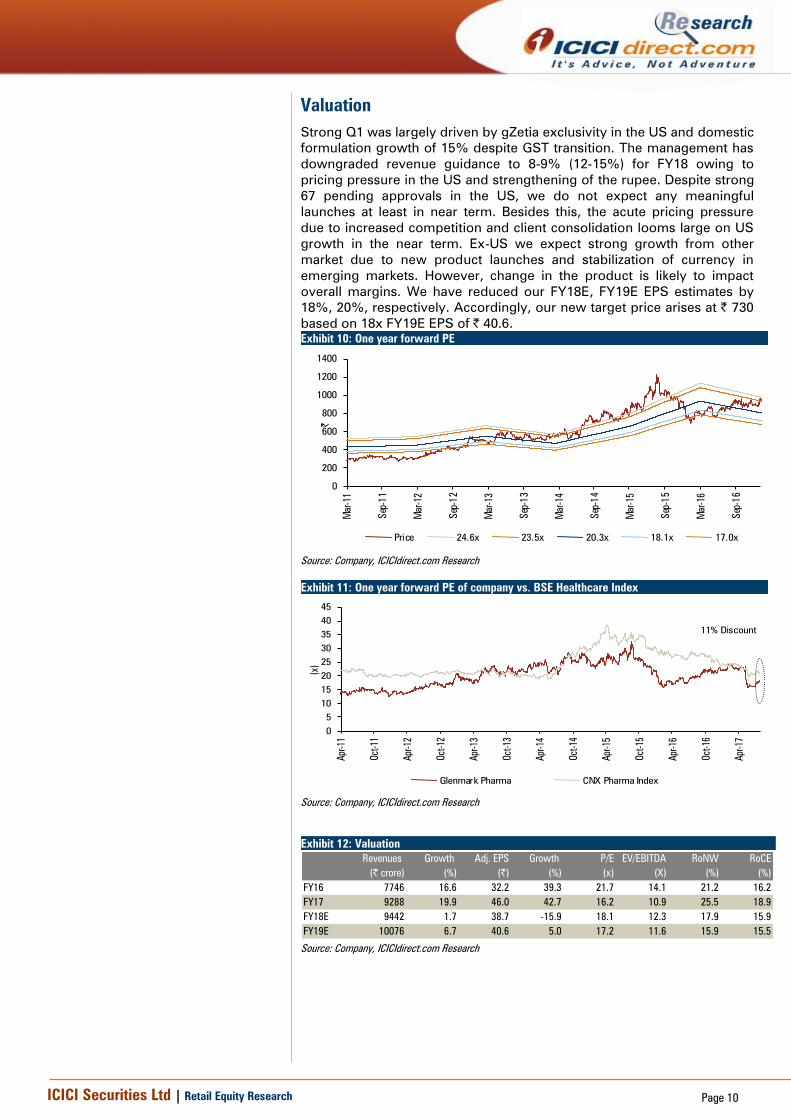
Valuation
Strong Q1 was largely driven by gZetia exclusivity in the US and domestic
formulation growth of 15% despite GST transition. The management has
downgraded revenue guidance to 8-9% (12-15%) for FY18 owing to
pricing pressure in the US and strengthening of the rupee. Despite strong
67 pending approvals in the US, we do not expect any meaningful
launches at least in near term. Besides this, the acute pricing pressure
due to increased competition and client consolidation looms large on US
growth in the near term. Ex-US we expect strong growth from other
market due to new product launches and stabilization of currency in
emerging markets. However, change in the product is likely to impact
overall margins. We have reduced our FY18E, FY19E EPS estimates by
18%, 20%, respectively. Accordingly, our new target price arises at | 730
based on 18x FY19E EPS of | 40.6.
Exhibit 10: One year forward PE
0
200
400
600
800
1000
1200
1400
Mar-
11
Sep-1
1
Mar-
12
Sep-1
2
Mar-
13
Sep-1
3
Mar-
14
Sep-1
4
Mar-
15
Sep-1
5
Mar-
16
Sep-1
6
|
Price 24.6x 23.5x 20.3x 18.1x 17.0x
[
Source: Company, ICICIdirect.com Research
Exhibit 11: One year forward PE of company vs. BSE Healthcare Index
0
5
10
15
20
25
30
35
40
45
Apr-
11
Oct-
11
Apr-
12
Oct-
12
Apr-
13
Oct-
13
Apr-
14
Oct-
14
Apr-
15
Oct-
15
Apr-
16
Oct-
16
Apr-
17
(x)
Glenmark Pharma CNX Pharma Index
11% Discount
Source: Company, ICICIdirect.com Research
Exhibit 12: Valuation
Revenues Growth Adj. EPS Growth P/E EV/EBITDA RoNW RoCE
(| crore) (%) (|) (%) (x) (X) (%) (%)
FY16 7746 16.6 32.2 39.3 21.7 14.1 21.2 16.2
FY17 9288 19.9 46.0 42.7 16.2 10.9 25.5 18.9
FY18E 9442 1.7 38.7 -15.9 18.1 12.3 17.9 15.9
FY19E 10076 6.7 40.6 5.0 17.2 11.6 15.9 15.5
Source: Company, ICICIdirect.com Research
ICICI Securities Ltd | Retail Equity Research Page 11
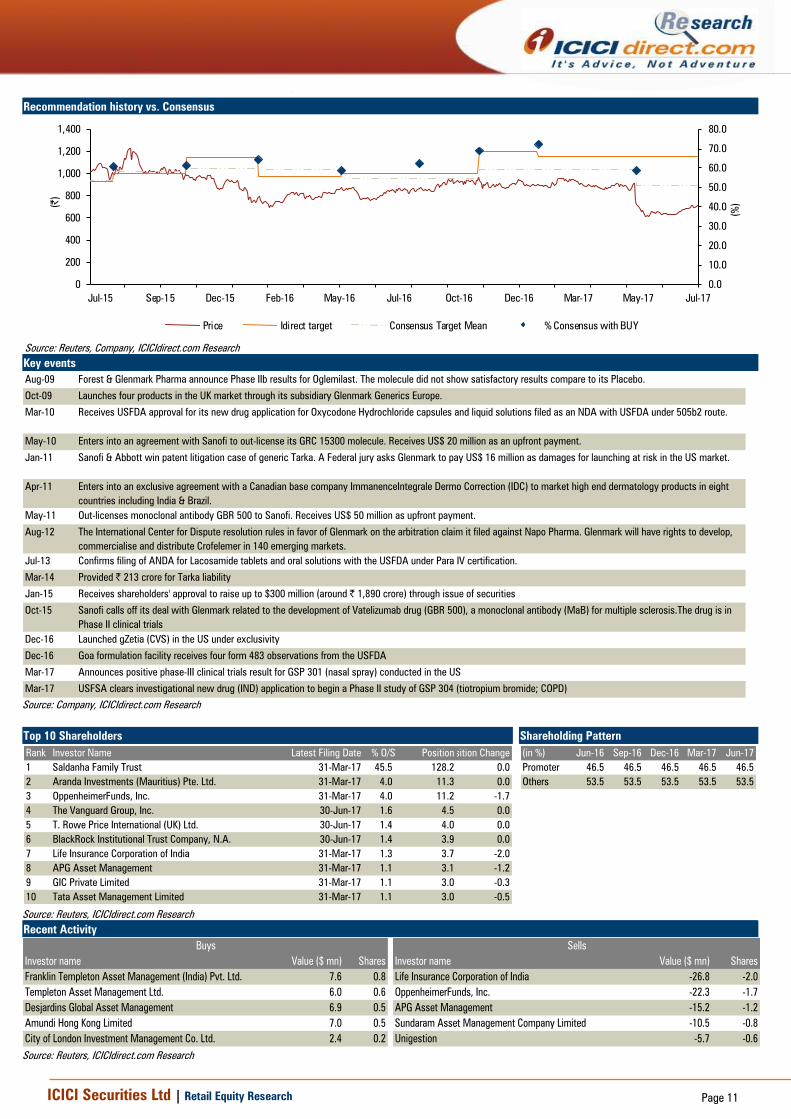
Recommendation history vs. Consensus
0.0
10.0
20.0
30.0
40.0
50.0
60.0
70.0
80.0
0
200
400
600
800
1,000
1,200
1,400
Jul-17May-17Mar-17Dec-16Oct-16Jul-16May-16Feb-16Dec-15Sep-15Jul-15
(%
)(|)
Price Idirect target Consensus Target Mean % Consensus with BUY
Source: Reuters, Company, ICICIdirect.com Research
Key events
Aug-09 Forest & Glenmark Pharma announce Phase IIb results for Oglemilast. The molecule did not show satisfactory results compare to its Placebo.
Oct-09 Launches four products in the UK market through its subsidiary Glenmark Generics Europe.
Mar-10 Receives USFDA approval for its new drug application for Oxycodone Hydrochloride capsules and liquid solutions filed as an NDA with USFDA under 505b2 route.
May-10 Enters into an agreement with Sanofi to out-license its GRC 15300 molecule. Receives US$ 20 million as an upfront payment.
Jan-11 Sanofi & Abbott win patent litigation case of generic Tarka. A Federal jury asks Glenmark to pay US$ 16 million as damages for launching at risk in the US market.
Apr-11 Enters into an exclusive agreement with a Canadian base company ImmanenceIntegrale Dermo Correction (IDC) to market high end dermatology products in eight
countries including India & Brazil.
May-11 Out-licenses monoclonal antibody GBR 500 to Sanofi. Receives US$ 50 million as upfront payment.
Aug-12 The International Center for Dispute resolution rules in favor of Glenmark on the arbitration claim it filed against Napo Pharma. Glenmark will have rights to develop,
commercialise and distribute Crofelemer in 140 emerging markets.
Jul-13 Confirms filing of ANDA for Lacosamide tablets and oral solutions with the USFDA under Para IV certification.
Mar-14 Provided | 213 crore for Tarka liability
Jan-15 Receives shareholders' approval to raise up to $300 million (around | 1,890 crore) through issue of securities
Oct-15 Sanofi calls off its deal with Glenmark related to the development of Vatelizumab drug (GBR 500), a monoclonal antibody (MaB) for multiple sclerosis.The drug is in
Phase II clinical trials
Dec-16 Launched gZetia (CVS) in the US under exclusivity
Dec-16 Goa formulation facility receives four form 483 observations from the USFDA
Mar-17 Announces positive phase-III clinical trials result for GSP 301 (nasal spray) conducted in the US
Mar-17 USFSA clears investigational new drug (IND) application to begin a Phase II study of GSP 304 (tiotropium bromide; COPD)
Source: Company, ICICIdirect.com Research
Top 10 Shareholders Shareholding Pattern
Rank Investor Name Latest Filing Date % O/S PositionPosition Change
1 Saldanha Family Trust 31-Mar-17 45.5 128.2 0.0
2 Aranda Investments (Mauritius) Pte. Ltd. 31-Mar-17 4.0 11.3 0.0
3 OppenheimerFunds, Inc. 31-Mar-17 4.0 11.2 -1.7
4 The Vanguard Group, Inc. 30-Jun-17 1.6 4.5 0.0
5 T. Rowe Price International (UK) Ltd. 30-Jun-17 1.4 4.0 0.0
6 BlackRock Institutional Trust Company, N.A. 30-Jun-17 1.4 3.9 0.0
7 Life Insurance Corporation of India 31-Mar-17 1.3 3.7 -2.0
8 APG Asset Management 31-Mar-17 1.1 3.1 -1.2
9 GIC Private Limited 31-Mar-17 1.1 3.0 -0.3
10 Tata Asset Management Limited 31-Mar-17 1.1 3.0 -0.5
(in %) Jun-16 Sep-16 Dec-16 Mar-17 Jun-17
Promoter 46.5 46.5 46.5 46.5 46.5
Others 53.5 53.5 53.5 53.5 53.5
Source: Reuters, ICICIdirect.com Research
Recent Activity
Investor name Value ($ mn) Shares Investor name Value ($ mn) Shares
Franklin Templeton Asset Management (India) Pvt. Ltd. 7.6 0.8 Life Insurance Corporation of India -26.8 -2.0
Templeton Asset Management Ltd. 6.0 0.6 OppenheimerFunds, Inc. -22.3 -1.7
Desjardins Global Asset Management 6.9 0.5 APG Asset Management -15.2 -1.2
Amundi Hong Kong Limited 7.0 0.5 Sundaram Asset Management Company Limited -10.5 -0.8
City of London Investment Management Co. Ltd. 2.4 0.2 Unigestion -5.7 -0.6
Buys Sells
Source: Reuters, ICICIdirect.com Research
ICICI Securities Ltd | Retail Equity Research Page 12
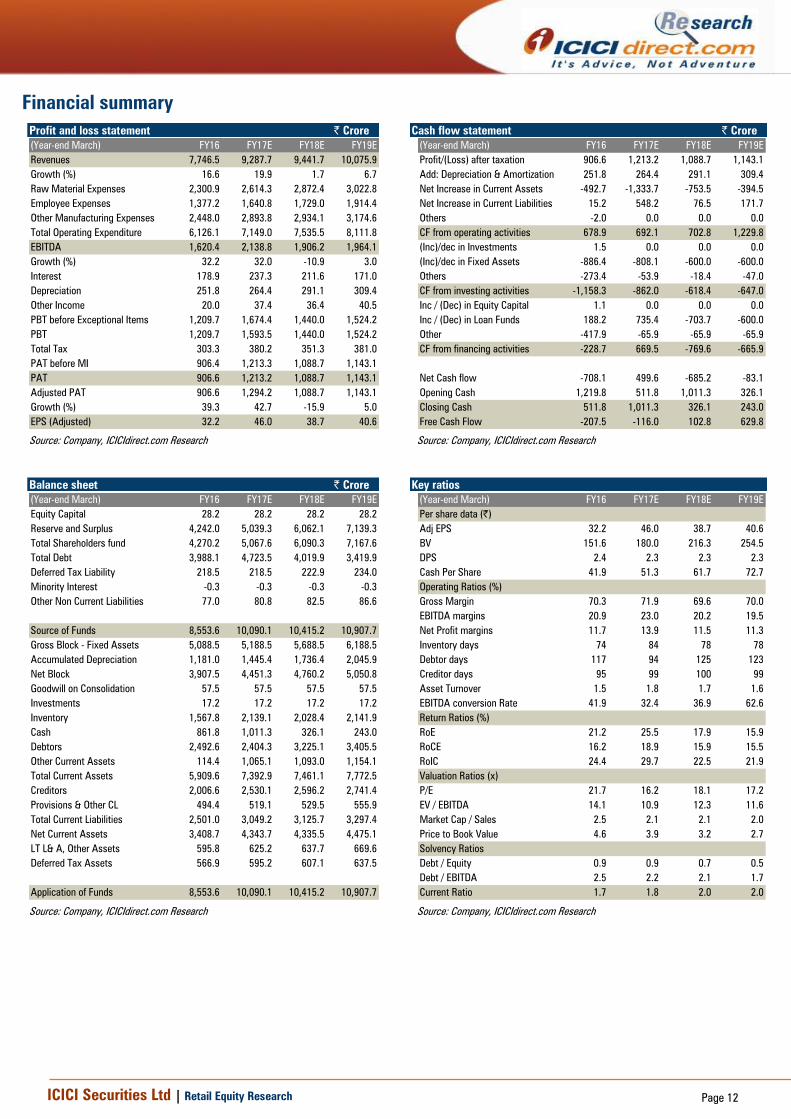
. Financial summary
Profit and loss statement | Crore
(Year-end March) FY16 FY17E FY18E FY19E
Revenues 7,746.5 9,287.7 9,441.7 10,075.9
Growth (%) 16.6 19.9 1.7 6.7
Raw Material Expenses 2,300.9 2,614.3 2,872.4 3,022.8
Employee Expenses 1,377.2 1,640.8 1,729.0 1,914.4
Other Manufacturing Expenses 2,448.0 2,893.8 2,934.1 3,174.6
Total Operating Expenditure 6,126.1 7,149.0 7,535.5 8,111.8
EBITDA 1,620.4 2,138.8 1,906.2 1,964.1
Growth (%) 32.2 32.0 -10.9 3.0
Interest 178.9 237.3 211.6 171.0
Depreciation 251.8 264.4 291.1 309.4
Other Income 20.0 37.4 36.4 40.5
PBT before Exceptional Items 1,209.7 1,674.4 1,440.0 1,524.2
PBT 1,209.7 1,593.5 1,440.0 1,524.2
Total Tax 303.3 380.2 351.3 381.0
PAT before MI 906.4 1,213.3 1,088.7 1,143.1
PAT 906.6 1,213.2 1,088.7 1,143.1
Adjusted PAT 906.6 1,294.2 1,088.7 1,143.1
Growth (%) 39.3 42.7 -15.9 5.0
EPS (Adjusted) 32.2 46.0 38.7 40.6
Source: Company, ICICIdirect.com Research
Cash flow statement | Crore
(Year-end March) FY16 FY17E FY18E FY19E
Profit/(Loss) after taxation 906.6 1,213.2 1,088.7 1,143.1
Add: Depreciation & Amortization 251.8 264.4 291.1 309.4
Net Increase in Current Assets -492.7 -1,333.7 -753.5 -394.5
Net Increase in Current Liabilities 15.2 548.2 76.5 171.7
Others -2.0 0.0 0.0 0.0
CF from operating activities 678.9 692.1 702.8 1,229.8
(Inc)/dec in Investments 1.5 0.0 0.0 0.0
(Inc)/dec in Fixed Assets -886.4 -808.1 -600.0 -600.0
Others -273.4 -53.9 -18.4 -47.0
CF from investing activities -1,158.3 -862.0 -618.4 -647.0
Inc / (Dec) in Equity Capital 1.1 0.0 0.0 0.0
Inc / (Dec) in Loan Funds 188.2 735.4 -703.7 -600.0
Other -417.9 -65.9 -65.9 -65.9
CF from financing activities -228.7 669.5 -769.6 -665.9
Net Cash flow -708.1 499.6 -685.2 -83.1
Opening Cash 1,219.8 511.8 1,011.3 326.1
Closing Cash 511.8 1,011.3 326.1 243.0
Free Cash Flow -207.5 -116.0 102.8 629.8
Source: Company, ICICIdirect.com Research
Balance sheet | Crore
(Year-end March) FY16 FY17E FY18E FY19E
Equity Capital 28.2 28.2 28.2 28.2
Reserve and Surplus 4,242.0 5,039.3 6,062.1 7,139.3
Total Shareholders fund 4,270.2 5,067.6 6,090.3 7,167.6
Total Debt 3,988.1 4,723.5 4,019.9 3,419.9
Deferred Tax Liability 218.5 218.5 222.9 234.0
Minority Interest -0.3 -0.3 -0.3 -0.3
Other Non Current Liabilities 77.0 80.8 82.5 86.6
Source of Funds 8,553.6 10,090.1 10,415.2 10,907.7
Gross Block - Fixed Assets 5,088.5 5,188.5 5,688.5 6,188.5
Accumulated Depreciation 1,181.0 1,445.4 1,736.4 2,045.9
Net Block 3,907.5 4,451.3 4,760.2 5,050.8
Goodwill on Consolidation 57.5 57.5 57.5 57.5
Investments 17.2 17.2 17.2 17.2
Inventory 1,567.8 2,139.1 2,028.4 2,141.9
Cash 861.8 1,011.3 326.1 243.0
Debtors 2,492.6 2,404.3 3,225.1 3,405.5
Other Current Assets 114.4 1,065.1 1,093.0 1,154.1
Total Current Assets 5,909.6 7,392.9 7,461.1 7,772.5
Creditors 2,006.6 2,530.1 2,596.2 2,741.4
Provisions & Other CL 494.4 519.1 529.5 555.9
Total Current Liabilities 2,501.0 3,049.2 3,125.7 3,297.4
Net Current Assets 3,408.7 4,343.7 4,335.5 4,475.1
LT L& A, Other Assets 595.8 625.2 637.7 669.6
Deferred Tax Assets 566.9 595.2 607.1 637.5
Application of Funds 8,553.6 10,090.1 10,415.2 10,907.7
Source: Company, ICICIdirect.com Research
Key ratios
(Year-end March) FY16 FY17E FY18E FY19E
Per share data (|)
Adj EPS 32.2 46.0 38.7 40.6
BV 151.6 180.0 216.3 254.5
DPS 2.4 2.3 2.3 2.3
Cash Per Share 41.9 51.3 61.7 72.7
Operating Ratios (%)
Gross Margin 70.3 71.9 69.6 70.0
EBITDA margins 20.9 23.0 20.2 19.5
Net Profit margins 11.7 13.9 11.5 11.3
Inventory days 74 84 78 78
Debtor days 117 94 125 123
Creditor days 95 99 100 99
Asset Turnover 1.5 1.8 1.7 1.6
EBITDA conversion Rate 41.9 32.4 36.9 62.6
Return Ratios (%)
RoE 21.2 25.5 17.9 15.9
RoCE 16.2 18.9 15.9 15.5
RoIC 24.4 29.7 22.5 21.9
Valuation Ratios (x)
P/E 21.7 16.2 18.1 17.2
EV / EBITDA 14.1 10.9 12.3 11.6
Market Cap / Sales 2.5 2.1 2.1 2.0
Price to Book Value 4.6 3.9 3.2 2.7
Solvency Ratios
Debt / Equity 0.9 0.9 0.7 0.5
Debt / EBITDA 2.5 2.2 2.1 1.7
Current Ratio 1.7 1.8 2.0 2.0
Source: Company, ICICIdirect.com Research

ICICI Securities Ltd | Retail Equity Research Page 13
ICICIdirect.com coverage universe (Healthcare)
Company I-Direct CMP TP Rating M Cap
Code (|) (|) (| Cr) FY16 FY17E FY18E FY19E FY16 FY17E FY18E FY19E FY16 FY17E FY18E FY19E FY16 FY17E FY18E FY19E
Ajanta Pharma AJAPHA 1403 1,880 Buy 12348.6 110.0 56.6 58.2 69.8 12.8 24.8 24.1 20.1 46.2 41.8 33.5 32.1 37.3 33.2 26.8 25.6
Alembic Pharma ALEMPHA 532 570 Hold 10020.6 38.2 21.2 19.1 28.6 13.9 25.1 27.8 18.6 52.2 25.3 18.7 23.9 45.1 21.0 16.5 20.8
Apollo Hospitals APOHOS 1263 1,400 Buy 17575.0 13.2 12.8 16.5 33.3 95.7 98.4 76.4 37.9 6.6 6.0 6.7 10.8 5.3 4.9 5.9 10.9
Aurobindo Pharma AURPHA 727 755 Buy 42581.9 33.9 38.3 37.1 42.1 21.4 19.0 19.6 17.3 23.3 24.8 19.6 19.9 28.1 23.9 19.0 17.9
Biocon BIOCON 392 380 Hold 23496.0 7.7 11.0 7.8 13.5 50.8 35.7 50.4 29.1 9.3 11.9 10.1 15.9 11.5 13.6 9.0 13.9
Cadila Healthcare CADHEA 541 420 Hold 55430.5 15.0 13.7 14.9 20.1 36.2 39.5 36.3 27.0 26.7 13.4 15.0 18.5 28.6 20.2 18.9 21.3
Cipla CIPLA 560 470 Hold 45073.8 18.5 12.9 17.8 25.3 30.3 43.6 31.4 22.2 12.0 8.0 11.0 14.5 12.5 8.1 10.4 13.1
Divi's Lab DIVLAB 673 665 Hold 17863.4 41.5 39.3 34.6 41.5 16.2 17.1 19.4 16.2 30.5 25.0 20.3 21.5 25.7 19.5 15.4 16.4
Dr Reddy's Labs DRREDD 2406 2,400 Hold 39880.8 141.4 70.6 72.4 126.2 17.0 34.1 33.2 19.1 15.3 6.1 6.8 11.9 19.2 9.5 9.0 13.9
Glenmark Pharma GLEPHA 699 730 Hold 19716.5 32.2 46.0 38.7 40.6 21.7 15.2 18.1 17.2 16.2 18.9 15.9 15.5 21.2 25.5 17.9 15.9
Indoco Remedies INDREM 201 180 Hold 1847.6 9.4 8.4 7.7 11.4 21.4 24.0 25.9 17.6 12.9 8.4 8.9 12.1 14.8 12.0 10.2 13.4
Ipca Laboratories IPCLAB 477 525 Hold 6020.3 7.4 15.4 17.6 27.9 64.6 30.9 27.1 17.1 4.5 8.7 9.3 13.2 4.1 7.9 8.4 12.0
Jubilant Life JUBLIF 720 845 Buy 11465.9 26.0 36.1 44.3 59.1 27.7 20.0 16.3 12.2 12.0 13.3 14.8 17.6 14.2 16.8 17.3 19.0
Lupin LUPIN 1048 1,335 Buy 47363.5 50.4 56.6 51.1 66.0 20.8 18.5 20.5 15.9 17.8 16.6 13.7 15.9 20.3 18.9 15.0 16.7
Natco Pharma NATPHA 977 1,055 Buy 17021.2 9.0 27.8 20.6 20.3 108.0 35.1 47.4 48.0 16.0 33.6 22.9 20.3 12.2 29.5 18.7 16.2
Sun Pharma SUNPHA 533 550 Hold 127963.8 23.4 29.0 20.3 25.5 22.8 18.4 26.3 20.9 18.6 19.8 13.5 15.0 18.0 19.0 12.0 13.4
Syngene Int. SYNINT 479 490 Hold 9571.0 11.1 14.3 14.3 17.4 43.6 33.6 33.6 27.7 14.1 16.8 16.2 17.8 21.6 20.3 17.2 17.4
Torrent Pharma TORPHA 1214 1,070 Hold 20543.7 110.9 55.2 46.2 56.3 10.9 22.0 26.3 21.6 46.5 18.9 16.3 17.0 53.7 21.5 15.8 16.9
Unichem Lab UNILAB 266 235 Hold 2415.3 12.3 12.0 11.8 16.6 21.6 22.2 22.5 16.0 13.8 12.0 11.0 13.9 11.7 10.5 9.5 12.0
RoE (%)EPS (|) PE(x) RoCE (%)
Source: Company, ICICIdirect.com Research
ICICI Securities Ltd | Retail Equity Research Page 14
RATING RATIONALE
ICICIdirect.com endeavours to provide objective opinions and recommendations. ICICIdirect.com assigns
ratings to its stocks according to their notional target price vs. current market price and then categorises them
as Strong Buy, Buy, Hold and Sell. The performance horizon is two years unless specified and the notional
target price is defined as the analysts' valuation for a stock.
Strong Buy: >15%/20% for large caps/midcaps, respectively, with high conviction;
Buy: >10%/15% for large caps/midcaps, respectively;
Hold: Up to +/-10%;
Sell: -10% or more;
Pankaj Pandey Head – Research [email protected]
ICICIdirect.com Research Desk,
ICICI Securities Limited,
1st Floor, Akruti Trade Centre,
Road No 7, MIDC,
Andheri (East)
Mumbai – 400 093
ICICI Securities Ltd | Retail Equity Research Page 15
ANALYST CERTIFICATION
We /I, Siddhant Khandekar CA-INTER, Mitesh Shah MS (Finance) Harshal Mehta M.Tech (Biotechnology) Research Analysts, authors and the names subscribed to this report, hereby certify that all of the
views expressed in this research report accurately reflect our views about the subject issuer(s) or securities. We also certi fy that no part of our compensation was, is, or will be directly or indirectly related
to the specific recommendation(s) or view(s) in this report.
Terms & conditions and other disclosures:
ICICI Securities Limited (ICICI Securities) is a full-service, integrated investment banking and is, inter alia, engaged in the business of stock brokering and distribution of financial products. ICICI Securities
Limited is a Sebi registered Research Analyst with Sebi Registration Number – INH000000990. ICICI Securities is a wholly-owned subsidiary of ICICI Bank which is India’s largest private sector bank and has
its various subsidiaries engaged in businesses of housing finance, asset management, life insurance, general insurance, venture capital fund management, etc. (“associates”), the details in respect of which
are available on www.icicibank.com.
ICICI Securities is one of the leading merchant bankers/ underwriters of securities and participate in virtually all securities trading markets in India. We and our associates might have investment banking
and other business relationship with a significant percentage of companies covered by our Investment Research Department. ICICI Securities generally prohibits its analysts, persons reporting to analysts
and their relatives from maintaining a financial interest in the securities or derivatives of any companies that the analysts cover.
The information and opinions in this report have been prepared by ICICI Securities and are subject to change without any notice. The report and information contained herein is strictly confidential and
meant solely for the selected recipient and may not be altered in any way, transmitted to, copied or distributed, in part or in whole, to any other person or to the media or reproduced in any form, without
prior written consent of ICICI Securities. While we would endeavour to update the information herein on a reasonable basis, ICICI Securities is under no obligation to update or keep the information current.
Also, there may be regulatory, compliance or other reasons that may prevent ICICI Securities from doing so. Non-rated securities indicate that rating on a particular security has been suspended
temporarily and such suspension is in compliance with applicable regulations and/or ICICI Securities policies, in circumstances where ICICI Securities might be acting in an advisory capacity to this
company, or in certain other circumstances.
This report is based on information obtained from public sources and sources believed to be reliable, but no independent verification has been made nor is its accuracy or completeness guaranteed. This
report and information herein is solely for informational purpose and shall not be used or considered as an offer document or solicitation of offer to buy or sell or subscribe for securities or other financial
instruments. Though disseminated to all the customers simultaneously, not all customers may receive this report at the same time. ICICI Securities will not treat recipients as customers by virtue of their
receiving this report. Nothing in this report constitutes investment, legal, accounting and tax advice or a representation that any investment or strategy is suitable or appropriate to your specific
circumstances. The securities discussed and opinions expressed in this report may not be suitable for all investors, who must make their own investment decisions, based on their own investment
objectives, financial positions and needs of specific recipient. This may not be taken in substitution for the exercise of independent judgment by any recipient. The recipient should independently evaluate
the investment risks. The value and return on investment may vary because of changes in interest rates, foreign exchange rates or any other reason. ICICI Securities accepts no liabilities whatsoever for any
loss or damage of any kind arising out of the use of this report. Past performance is not necessarily a guide to future performance. Investors are advised to see Risk Disclosure Document to understand the
risks associated before investing in the securities markets. Actual results may differ materially from those set forth in projections. Forward-looking statements are not predictions and may be subject to
change without notice.
ICICI Securities or its associates might have managed or co-managed public offering of securities for the subject company or might have been mandated by the subject company for any other assignment
in the past twelve months.
ICICI Securities or its associates might have received any compensation from the companies mentioned in the report during the period preceding twelve months from the date of this report for services in
respect of managing or co-managing public offerings, corporate finance, investment banking or merchant banking, brokerage services or other advisory service in a merger or specific transaction.
ICICI Securities or its associates might have received any compensation for products or services other than investment banking or merchant banking or brokerage services from the companies mentioned
in the report in the past twelve months.
ICICI Securities encourages independence in research report preparation and strives to minimize conflict in preparation of research report. ICICI Securities or its associates or its analysts did not receive any
compensation or other benefits from the companies mentioned in the report or third party in connection with preparation of the research report. Accordingly, neither ICICI Securities nor Research Analysts
and their relatives have any material conflict of interest at the time of publication of this report.
It is confirmed that Siddhant Khandekar CA-INTER, Mitesh Shah MS (Finance) Harshal Mehta MTech (Biotechnology) Research Analysts of this report have not received any compensation from the
companies mentioned in the report in the preceding twelve months.
Compensation of our Research Analysts is not based on any specific merchant banking, investment banking or brokerage service transactions.
ICICI Securities or its subsidiaries collectively or Research Analysts or their relatives do not own 1% or more of the equity securities of the Company mentioned in the report as of the last day of the month
preceding the publication of the research report.
Since associates of ICICI Securities are engaged in various financial service businesses, they might have financial interests or beneficial ownership in various companies including the subject
company/companies mentioned in this report.
It is confirmed that Siddhant Khandekar CA-INTER, Mitesh Shah MS (Finance) Harshal Mehta MTech (Biotechnology) Research Analysts do not serve as an officer, director or employee of the companies
mentioned in the report.
ICICI Securities may have issued other reports that are inconsistent with and reach different conclusion from the information presented in this report.
Neither the Research Analysts nor ICICI Securities have been engaged in market making activity for the companies mentioned in the report.
We submit that no material disciplinary action has been taken on ICICI Securities by any Regulatory Authority impacting Equity Research Analysis activities.
This report is not directed or intended for distribution to, or use by, any person or entity who is a citizen or resident of or located in any locality, state, country or other jurisdiction, where such distribution,
publication, availability or use would be contrary to law, regulation or which would subject ICICI Securities and affiliates to any registration or licensing requirement within such jurisdiction. The securities
described herein may or may not be eligible for sale in all jurisdictions or to certain category of investors. Persons in whose possession this document may come are required to inform themselves of and
to observe such restriction.
report and information herein is solely for informational purpose and shall not be used or considered as an offer document or solicitation of offer to buy or sell or subscribe for securities or other financial
instruments. Though disseminated to all the customers simultaneously, not all customers may receive this report at the same time. ICICI Securities will not treat recipients as customers by virtue of their
receiving this report. Nothing in this report constitutes investment, legal, accounting and tax advice or a representation that any investment or strategy is suitable or appropriate to your specific
circumstances. The securities discussed and opinions expressed in this report may not be suitable for all investors, who must make their own investment decisions, based on their own investment
objectives, financial positions and needs of specific recipient. This may not be taken in substitution for the exercise of independent judgment by any recipient. The recipient should independently evaluate
the investment risks. The value and return on investment may vary because of changes in interest rates, foreign exchange rates or any other reason. ICICI Securities accepts no liabilities whatsoever for any
loss or damage of any kind arising out of the use of this report. Past performance is not necessarily a guide to future performance. Investors are advised to see Risk Disclosure Document to understand the
risks associated before investing in the securities markets. Actual results may differ materially from those set forth in projections. Forward-looking statements are not predictions and may be subject to
change without notice.
ICICI Securities or its associates might have managed or co-managed public offering of securities for the subject company or might have been mandated by the subject company for any other assignment
in the past twelve months.
ICICI Securities or its associates might have received any compensation from the companies mentioned in the report during the period preceding twelve months from the date of this report for services in
respect of managing or co-managing public offerings, corporate finance, investment banking or merchant banking, brokerage services or other advisory service in a merger or specific transaction.
ICICI Securities or its associates might have received any compensation for products or services other than investment banking or merchant banking or brokerage services from the companies mentioned
in the report in the past twelve months.
ICICI Securities encourages independence in research report preparation and strives to minimize conflict in preparation of research report. ICICI Securities or its analysts did not receive any compensation
or other benefits from the companies mentioned in the report or third party in connection with preparation of the research report. Accordingly, neither ICICI Securities nor Research Analysts have any
material conflict of interest at the time of publication of this report.
It is confirmed that Siddhant Khandekar CA-INTER Mitesh Shah MS (Finance), Harshal Mehta MTech (Biotechnology) Research Analysts of this report have not received any compensation from the
companies mentioned in the report in the preceding twelve months.
Compensation of our Research Analysts is not based on any specific merchant banking, investment banking or brokerage service transactions.