Selectivity and Timing: Evidence from the Performance of ...pertanika2.upm.edu.my/Pertanika...
13
Pertanika J. Soc. Sci. & Hum. 5(1): 45-57 (1997) ISSN: 0128-7702 © Universiti Putra Malaysia Press Selectivity and Timing: Evidence from the Performance of Malaysian Unit Trusts ANNUAR MD NASSIR, SHAMSHER MOHAMED and NGU MEE HUA Faculty of Economics and Management Universiti Putra Malaysia 43400, Serdang, Selangor, Malaysia Keywords: unit trusts, market timing, selectivity, diversification ABSTRAK Kajian ini mengkaji pemilihan dan pemasaan pasaran untuk 31 saham amanah yang beroperasi di Malaysia. Keputusan menunjukkan bahawa bagi jangka masa 1990-1995, saham amanah di Malaysia tidak mempunyai pemasaan pasaran kecuali saham amanah Kuala Lumpur Growth Fund. Namun demikian, terdapat bukti yang menunjukkan pengurus dana mempunyai kebijaksaan dalam pemilihan saham-saham terpilih. Adalah didapati 81% saham amanah dalam kajian ini menghasilkan pulangan yang melebihi pulangan pasaran dan Kuala Lumpur Growth Fund mempunyai ukuran pemilihan yang tertinggi. Hubungan positif antara pemilihan dan pemasaan pasaran didapati dalam kajian ini dengan pekali korelasinya bernilai 0.53. Tahap pempelbagaian untuk 81% saham amanah adalah di bawah jangkaan dan ciri risiko-pulangannya adalah tidak konsisten dengan objektif yang telah ditetapkan. ABSTRACT This paper presents an empirical examination of the selectivity and timing performance of 31 unit trusts in Malaysia. The empirical results indicate that during the 1990-1995 period, Malaysian unit trusts appear to possess no market timing ability, except for the Kuala Lumpur Growth Fund. However, there is some evidence of superior selection ability on the part of fund managers in picking up **good” stocks. Eighty-one per cent of the sample of unit trusts are able to beat the market return and the Kuala Lumpur Growth Fund ranked highest in terms of selectivity measure. The study found a positive correlation coefficient of 0.53 between selectivity and timing performance among the unit trusts. Further evidence suggests that 81% of the unit trusts have not achieved the expected level of diversification, and risk-return characteristics of the trusts are generally inconsistent with their stated objectives. INTRODUCTION The development of the unit trust industry in Malaysia is still in its infancy and is expected to take off in the years ahead in the light of recent positive developments within the industry. Such developments include the introduction of new unit trusts (including the recently launched Amanah Saham Wawasan and several State unit trusts) and newly created unit trusts based on Islamic principles. In this respect, unit trusts will play an important role in the development of the Malaysian capital market through the proliferation of different types of funds to suit the various needs and risk-return profiles of investors. Unit trust funds are classified into different risk categories to cater for investors with different risk preference levels. There are six types of funds currently available in Malaysia: aggressive growth funds, growth funds, growth and income funds, income funds, balanced funds and bond funds. Bond funds are new in Malaysia the only such fund was launched in 1996. Overview of the Malaysian Unit Trust Industry In many developed and several emerging markets, unit trusts or mutual funds comprise a large section of the capital market. In the United States, for example, there are over 1,800 mutual funds with a staggering US$2 trillion in assets. In neighbouring Thailand and Singapore, unit trusts constitute a bigger and faster growing share of market capitalization of equity markets than in Malaysia (Refer to Table 1).
Transcript of Selectivity and Timing: Evidence from the Performance of ...pertanika2.upm.edu.my/Pertanika...

Pertanika J. Soc. Sci. & Hum. 5(1): 45-57 (1997) ISSN: 0128-7702 © Universiti Putra Malaysia Press
Selectivity and Timing: Evidence from the Performance of Malaysian Unit Trusts
ANNUAR MD NASSIR, SHAMSHER MOHAMED and NGU MEE HUA Faculty of Economics and Management
Universiti Putra Malaysia 43400, Serdang, Selangor, Malaysia
Keywords: unit trusts, market timing, selectivity, diversificationABSTRAK
Kajian ini mengkaji pemilihan dan pemasaan pasaran untuk 31 saham amanah yang beroperasi di Malaysia. Keputusan menunjukkan bahawa bagi jangka masa 1990-1995, saham amanah di Malaysia tidak mempunyai pemasaan pasaran kecuali saham amanah Kuala Lumpur Growth Fund. Namun demikian, terdapat bukti yang menunjukkan pengurus dana mempunyai kebijaksaan dalam pemilihan saham-saham terpilih. Adalah didapati 81% saham amanah dalam kajian ini menghasilkan pulangan yang melebihi pulangan pasaran dan Kuala Lumpur Growth Fund mempunyai ukuran pemilihan yang tertinggi. Hubungan positif antara pemilihan dan pemasaan pasaran didapati dalam kajian ini dengan pekali korelasinya bernilai 0.53. Tahap pempelbagaian untuk 81% saham amanah adalah di bawah jangkaan dan ciri risiko-pulangannya adalah tidak konsisten dengan objektif yang telah ditetapkan.
ABSTRACTThis paper presents an empirical examination of the selectivity and timing performance of 31 unit trusts in Malaysia. The empirical results indicate that during the 1990-1995 period, Malaysian unit trusts appear to possess no market timing ability, except for the Kuala Lumpur Growth Fund. However, there is some evidence of superior selection ability on the part of fund managers in picking up **good” stocks. Eighty-one per cent of the sample of unit trusts are able to beat the market return and the Kuala Lumpur Growth Fund ranked highest in terms of selectivity measure. The study found a positive correlation coefficient of 0.53 between selectivity and timing performance among the unit trusts. Further evidence suggests that 81% of the unit trusts have not achieved the expected level of diversification, and risk-return characteristics of the trusts are generally inconsistent with their stated objectives.
INTRODUCTIONThe development of the unit trust industry in Malaysia is still in its infancy and is expected to take off in the years ahead in the light of recent positive developments within the industry. Such developments include the introduction of new unit trusts (including the recently launched Amanah Saham Wawasan and several State unit trusts) and newly created unit trusts based on Islamic principles. In this respect, unit trusts will play an important role in the development of the Malaysian capital m arket through the proliferation of different types of funds to suit the various needs and risk-return profiles of investors.
Unit trust funds are classified into different risk categories to cater for investors with different
risk preference levels. There are six types of funds currently available in Malaysia: aggressive growth funds, growth funds, growth and income funds, income funds, balanced funds and bond funds. Bond funds are new in Malaysia the only such fund was launched in 1996.
Overview of the Malaysian Unit Trust Industry In many developed and several em erging markets, unit trusts or mutual funds comprise a large section of the capital market. In the United States, for example, there are over 1,800 mutual funds with a staggering US$2 trillion in assets. In neighbouring Thailand and Singapore, unit trusts constitute a bigger and faster growing share of market capitalization of equity markets than in Malaysia (Refer to Table 1).

Annuar Md. Nassir, Shamsher Mohamed and Ngu Mee Hua
TABLE 1Investment by unit trusts as a percentage
of market capitalization
Country % o f Market Capitalization
Japan 48Australia 40United States 40India 25Thailand 16Malaysia 5*
Source: Business Times 6 /2 /9 4* The latest published figure as at June 30 1995 is
7.9%, with total net asset value of RM43.1 billion, of which Amanah Saham Nasional and Amanah Saham B um iputera accou n ted for RM27.9 billion.
However, in the past few years, the Malaysian unit trust industry has been rapidly making up for lost time and 1994 seems to have been the year of unit trusts, judging from the proliferation of unit trusts funds and the rapid increase in their popularity. As much as RM3 billion was invested by the middle of 1994 and doubtless, more will be channelled into new funds in the future. Presently, there are 29 unit trust management companies, including 4 property trust companies, managing a total of 57 (69 according to the latest statistics) funds in the Malaysian market. The unit trust industry is expected to play a more important role in the economy and garner at least 20% of the market capitalization by the year 2000 given the strong economic fundamentals and the government’s encouragement of savings.
Many unit trust companies declare dividends of over 10 per cent per annum and combined with unit value capital gains ensure many investors a return of over 10% per annum on their investments. Given these returns, who would not want to invest in unit trusts ? However, two critical issues need to be addressed namely, Uming and selection abilities. Timing ability refers to a fund manager’s ability to forecast price movements of the general market as a whole, while selection ability involves identification of individual stocks which are good bargains.
Timing and Selection AbilitiesFama (1972) suggested portfolio m anagers’forecasting skills could be partitioned into two
distinct components: (1) forecasts of price movements of selected individual stocks (security analysis or micro-forecasting); and (2) forecasts of price movements of the general stock market as a whole (market timing or macro-forecasting). This partitioning of forecasting skills is also evident in Treynor and Black (1973), who have shown that portfolio managers can effectively separate actions related to security analysis from those related to market timing.
Micro-forecasting or security analysis involves identification of individual stocks which are undervalued or overvalued relative to equities in general. Within the specification of the capital asset pricing model (CAPM), a micro-forecaster attempts to identify securities having expected returns that lie significantly off the security market line. Specifically, the micro-forecaster only forecasts non-systematic or security specific components of security return. Following Jensen (1972: 132) the excess return on portfolio can be written as:
R = P R + e. (1)j t * j ml jt v '
where Rji is the excess (net of risk-free rate) return on j th portfolio, R nt is the excess (net of risk-free rate) return on the market portfolio. . measures the sensitivity of the portfolio return to the market return and e. is a random errorj»which has an expected value of zero. Within this framework, microforecasts about the j th portfolio would involve concentrating in e.(. If the portfolio manager is a superior forecaster (perhaps because of special knowledge not available to others) he will tend to selectsecurities which realize e. > 0. Hence, hisj1portfolio will earn more than the ‘normal’ risk premium for its level of risk. Allowance for such forecasting ability can be made by simply not constraining the estimating regression to pass through the origin. That is, we allow for the possible existence of a non-zero constant in equation (1) as follows:
The new error term u will now have an expected value of zero. Thus if the portfolio manager has an ability to forecast security prices, the intercept a. in equation (2) will be positive. A passive strategy (random buy and hold policy) can be expected to yield a zero intercept.
46 PertanikaJ. Soc. Sci. 8c Hum. Vol. 5 No. 1 1997

Selectivity and Timing: Evidence from the Malaysian Unit Trusts Performance
On the other hand, if the manager is not doing as well as a random selection buy and hold policy, a. will be negative. Such results may very well be due to large expenses in unsuccessful forecasting attempts.
Macro-forecasting or market timing refers to forecasts of future realizations of the market portfolio. A macro-forecaster will attempt to capitalize on any expectation he may have regarding the behaviour of the market return in the next period. If the manager believes that he can make better than average forecasts of market returns, he will adjust his portfolio risk level in anticipation of market movements. If successful, he will earn abnormal returns relative to an appropriate benchmark. For example, if the manager (correcdy) perceives that there is a high probability that the market return will rise next period, he will be able to increase the return on his portfolio by increasing its risk. On the other hand, if the market return is expected to fall next period, he can reduce the losses on the portfolio by reducing the risk level of the portfolio.
Practically, a portfolio manager can adjust his portfolio risk by changing the asset mix such as the stocks versus money m arket (cash) securities in a common stock mutual fund, and /o r readjusting the proportion of aggressive vs. defensive stocks. In either case, the systematic risk of the portfolio should be altered. Indeed, the market timer switches from more risky to less risky securities (or vice versa) in an attempt to outguess the movement of the market. Therefore, we can allow for the existence of timing ability in equation (2) by permitting the sensitivity coefficient (p.) to be stochastic. Market-timing ability will be present where (3. and Rmt are positively correlated.
Substantial research in the area of unit trust performance has concentrated on the portfolio manager’s investment decision making ability. One weakness of this approach is that it fails to separate the aggressiveness of a fund manager from the quality of the information he possesses. It is apparent that superior performance occurs when fund manager is able to “time” the market (market timing) and forecast the returns on individual assets (selection ability).
Thus, attention has been shifted toward the distinction between security selection and market timing abilities. This distinction not only allows one to more finely measure the performance of
portfolio managers based upon their expertise, but also deals with the question of which activities are more economically rewarding. In addition, it is important for regulators that formulate policy concerning the operations of the marketplace.
Research ObjectiveThis study focuses on the performance of 31 unit trusts funds in Malaysia for the period 1990- 95. The main objective of this study is to examine the selectivity and timing ability of Malaysian unit trusts managers. Specifically, this paper attempts to investigate the following issues:1. Correlation between mutual fund’s selectivity
and timing performance.2. Degree of diversification of unit trusts.3. Risk-return characteristics of unit trusts.4. Fitness of the Treynor and Mazuy model.
REVIEW OF PRIOR STUDIESStudies on the performance of unit trusts in developed economies were prompted by the need to compare their performance with other investm ents, which was facilitated by the availability o f com posite m easures of performance. This section reviews the findings of some of these studies.
Significant Timing and Selection Performance at Individual Fund I evelFew studies found significant timing and selection performance at the individual fund level (Kon 1983; Lehmann and Modest 1987). Bhattacharya and Pfleiderer (1983) also indicated that at the individual fund level there is some evidence of fund manager’s superior forecasting ability. This implies that funds with no forecasting skills might only consider a totally passive management strategy and just provide a diversification service to their shareholders.
Grinblatt and Titman (1989a) examined the Jensen measure for a sample of 274 funds during the period 1974-84 and their results indicated that superior performance may in fact exist, particularly among aggressive growth and growth funds and those funds with the smallest net asset values. Lee and Rahman (1990) also found a positive correlation of 0.47 between stock selection and m arket timing perform ance, indicating that the funds did not exhibit particular specialization in one forecasting skill.
PertanikaJ. Soc. Sci. 8c Hum. Vol. 5 No. 1 1997 47

Annuar Md. Nassir, Shamsher Mohamed and Ngu Mee Hua
They found evidence of superior timing and selection at the individual fund level.
However, a couple of studies offer a different set of results. Sharpe (1966) studied 34 open- ended unit trusts with annual data for the period 1954-63 and found that on average, unit trusts did not outperform the market. Out of the 34 unit trusts, only 11 did better than the DJIA (Dow Jones Industrial Average). Another study carried out by Jensen (1968) for the period 1945-64 also reported similar results. The evidence on unit trust performance indicates not only that the 115 unit trusts examined were on average not able to predict security prices well enough to outperform a buy-the-market- and-hold policy, but also that there is very little evidence that any individual fund was able to perfo rm b e tte r than expecta tions. The conclusions discussed were valid even when the returns were measured gross of management expenses (that is assume their bookkeeping, research and other expenses except brokerage commissions were obtained free). Thus, on average the funds were apparently not quite successful enough in their trading activities to recoup even their brokerage expenses. However, the question of diversification was not considered.
Firth (1977) studied the performance of 72 unit trusts in the United Kingdom using the capital asset pricing model and Sharpe’s reward- variability index for the period 1965-75 showed that on average, managers of unit trusts were not able to forecast share prices accurately enough to outperform a simple buy and hold policy. None of the unit trusts examined provided investors with the opportunity to invest in a portfolio of greater volatility than the market portfolio. The results also imply that unit trust managers have no superior investment selection ability, this perhaps is not surprising in view of the competitive nature of the British stock market.
Kon and Jen (1979) examined the possibility of changing levels of market-related risk over time for unit trust portfolios. They separated their data sample into different risk regimes and found that a large number of funds engage in timing activities. There are also a number of studies documenting negative timing skill of unit trust managers. Coggin et al. (1993) studied the performance of US equity pension fund managers and found that the average timing measure was negative regardless of the choice of
benchmark portfolio or estimation model. These results are consistent with those of previous studies on unit trust performance (see Kon 1983; Chang and Lwellen 1984; Henriksson 1984; Lehmann and Modest 1987; Cumby and Glen 1990; Connor and Korajczyk 1991; Coggin and H unter 1993). These studies found m ore evidence of negative market timing than positive, and also found some evidence of negative selection ability of unit trusts.
Negative Correlation between Selectivity and TimingStudies of the micro and macro-forecasting ability of mutual fund managers generally find a zero or negative performance for the average fund, suggesting that the average fund m anager displays no significant selection or timing ability. Further, a negative correlation between selection and timing performance, suggestive of reverse skills or activity specialization, is reported by Kon (1983), Henriksson (1984) and Chang and Lewellen (1984). Similar results were also reported by Chen et al. (1992). They studied a sample of 93 unit trusts with monthly data for the period 1977-84 and found that 62% of the funds exhibited negative timing parameters, indicating a lack of timing ability for average portfolio managers. Furthermore, the results also suggested that there was a trade-off between security selection and market timing for funds involved in both activities.
However, Jagannathan and Korajezyk (1986) argued that such results could arise from artificial market timing due to the differential leverage of the firms in the indices and those invested in by the unit trusts. They theoretically and empirically demonstrated how to create a portfolio that would exh ib it positive (negative) tim ing performance and negative (positive) security selection when no true timing or selectivity exists. They suggested that funds invest in highly levered stocks will show a positive m arket tim ing performance while those investing in litde or no risky debt stocks will show a negative timing performance.
Unlike the predictions in Jagannathan and Korajczyk (1986), Lehmann and Modest (1987) found no systematic evidence that funds with large negative timing terms have large positive selectivity. Specifically, they were unable to detect any substantive correlation between selectivity and timing terms. Bello’s (1995) study also hypothesized that the preponderance of negadve
48 PertanikaJ. Soc. Sci. & Hum. Vol. 5 No. 1 1997

Selectivity and Timing: Evidence from the Malaysian Unit Trusts Performance
timing performance and the negative correlation between timing performance and selectivity were explained by the form of the return-generating model used in those studies and not by the leverage characteristics of the fund’s assets. Therefore, the negative correlation between selectivity and timing presents a problem of interpretation.
Another study carried out by Hunter et a l (1992) showed that the correlation between the estimates of selectivity and timing will necessarily be negative if the regression model is being used. They showed that this is because the sampling errors for the two estimates are negatively correlated. Similar result was also reported by Coggin et a l (1993). Grinblatt and Titman (1989b) have shown that many of the desirable properties of a performance measurement model which seeks to estimate both selectivity and market timing skill are not present if selectivity and timing are correlated. Therefore, the correlation between selectivity and market timing is an unsettled question in the literature.
Models of Selectivity and Timing
At present, it is an accepted practice to model selectivity and timing simultaneously. Jensen (1968, 1969) formulated a return-generating model to measure performance of managed portfolios. The model is:
R = a + p R t + jUt (3)pt p “ p mt " p t ' '
where Rp( is the excess (net of risk-free rate) return on the pih portfolio. Rmt is the excess (net of risk-free rate) return on the market portfolio, a p is a measure of security selection ability, pp measures the sensitivity of the portfolio to the market return, /ipt is a random error which has expected value of zero and t denotes time. This specification assumes that the risk level of the portfolio under consideration is stationary through time and ignores the market timing skill of the managers. Indeed, portfolio managers may shift the overall risk composition of their portfolio in anticipation of broad market price movements. Fama (1972) and Jensen (1972) addressed this issue and suggested a somewhat finer breakdown of performance.
T reynor and Mazuy (1966) added a quadratic term to equation (3) to test for market timing skill. They argued that if a manager can forecast market returns, he will hold a greater
proportion of the market portfolio when the return on the market is high and a smaller proportion when the return on the market is low. Thus, the portfolio return will be a nonlinear function of the market return as follows:
R = a + P R + y(R t)2 + e (4)pt p “ p mt 1 v m t' p i ' '
A positive value of y would imply positive market timing skill.
Jensen (1 9 7 2 ) developed a similar model to detect selectivity and timing skill of managers. Jensen’s measure of market timing performance calls for a fund manager to forecast the deviation of the market portfolio return from its consensus expected return. By assuming that the forecasted return and the actual return on the market have a joint normal distribution, Jensen shows that a market timer’s forecasting skill can be measured by the correlation between the market timer’s forecast and the realized return on the market.
Bhattacharya and Pfleiderer (1 9 8 3 ) extended the work of Jensen ( 1 9 7 2 ) . By correcting an error made in Jensen ( 1 9 7 2 ) , they show that one can use a simple regression technique to obtain measures of timing and selection ability. Jensen assumed that the manager uses unadjusted forecast of the market return in the timing decision. Bhattacharya and Pfleiderer assume that the manager adjusts forecasts to minimize the variance of the forecast error. They specify a relationship in terms of observable variables, which is similar to the Treynor and Mazuy’s (1 9 6 6 ) model:
Rpl = a + 0 E (R J(l-T )R mi + ‘i'e(Rml)J + e ^ R , , + npi ■ (5)
where
a p = security selection ability,0 = fund manager’s response to information,
i.e., risk level deviation from the target risk level depending on the optimal forecast of the market return.
4* = coefficient of determ ination between the manager’s forecast and the excess return on the market, and
fi, 8 = the error of the manager’s forecast.
The quadratic regression of Rpt on Rmi will detect the existence of stock selection ability, as revealed by a p The disturbance term in equation (5) :
PertanikaJ. Soc. Sci. & Hum. Vol. 5 No. 1 1997 49

Annuar Md. Nassir, Shamsher Mohamed and Ngu Mee Hua
OJ, = 6'i'e<Rmt + Hp, (6)contains the information needed to quantify the manager’s timing skill by regressing (GJt)2 on (R ,)2:' m l'
(OJ,)2 = 02V2 (oe)2 (Rml)2+ St (7)
The proposed regression produces a consistent estimator of where (ae)2 is the varianceof the m anager’s fbrecast error. Using the consistent estimator of 04*, recovered from equation (5) we can obtain (ae)2. This, coupled with knowledge about (arc)2, the variance of excess return on the market, allows us to estimate 4* = (G7i)2/[(cra)2 +(ae)2] = p2, where p is the correlation between the manager’s forecast and excess return on the market and truly measures the quality of the manager’s timing information. It should be noted that the disturbance term is heteroscedastic and does not produce the most efficient estimates of the parameters.
The Bhattacharya and Pfleiderer (1983) model of equation (5) is a refinement of the Treynor and Mazuy model. It focuses on the efficient of the squared excess market return as an indication of timing skill. It was the first model to analyse the error term to identify a manager’s forecasting skill. Such a refinement should make the model more useful than previous ones. However, as noted in Coggin and Hunter (1993), one weakness of the Treynor and Mazuy and the Bhattacharya and Pfleiderer models is that they ignore negative or inferior market timing.
There are other models in the literature that permit identification and separation of selectivity and timing skills of portfolio managers, e.g., models by Grinblatt and Titman (1989b), H enriksson and M erton (1981), and an alternative to the Henriksson and Merton model proposed by Kon and Jen (1978, 1979). The G rinblatt and Titm an model requires the historical sequence of portfolio weights (i.e., the amount invested in each stock ) for the manager. Unfortunately, data on portfolio weights are very costly, time-consuming, and often not available.
DATA AND METHODOLOGYTo detect selection ability and market timing skill of Malaysian mutual fund managers, monthly returns for 62 months (July 1990 to August 1995) for a sample of 31 unit trusts were used.
The sample was grouped into 3 investment objectives, consisting of 18 balanced funds, 10 growth funds and 3 income funds. The monthly rate of return on the KLSE Composite Index was used to proxy for the market’s return. Both monthly unit trust data and dividend data were obtained from New Straits Times Sdn Bhd’s database. The yield on 91-day Treasury Bills was obtained from Bank Negara's Quarterly Bulletin.
Treynor and Mazuy Model (TM Model)T he stock selection and m arket tim ing performance of each managed portfolio are estimated with Treynor and Mazuy (1966) equation:
R = a + p,R + P9R 2 + e tpi p ' 1 mt “ 2 ml pt
where
Rpt = the dividend-adjusted return on portfolio p in month t minus the yield on 91-day Treasury bills in month t (Rft) ;
R = the observed return on the KLSEml
Composite Index in month t minus Rf( ; a p = the estimated selectivity;Pj = the beta risk of unit trust;P2 = the estimated timing performance;£p( = the residual excess return on portfolio p
in month t.
Computation of Variables
The dividend-adjusted return on the unit trust (Rpt) was calculated as follows:
where
Pt = fund’s selling price at the end of month t Ptl = fund’s selling price one month before t D( = dividends distributed at time t
The return on the market index (R ) was' m l'measured as follows:
50 PertanikaJ. Soc. Sci. 8c Hum. Vol. 5 No. 1 1997
Selectivity and Timing: Evidence from the Malaysian Unit Trusts Performance
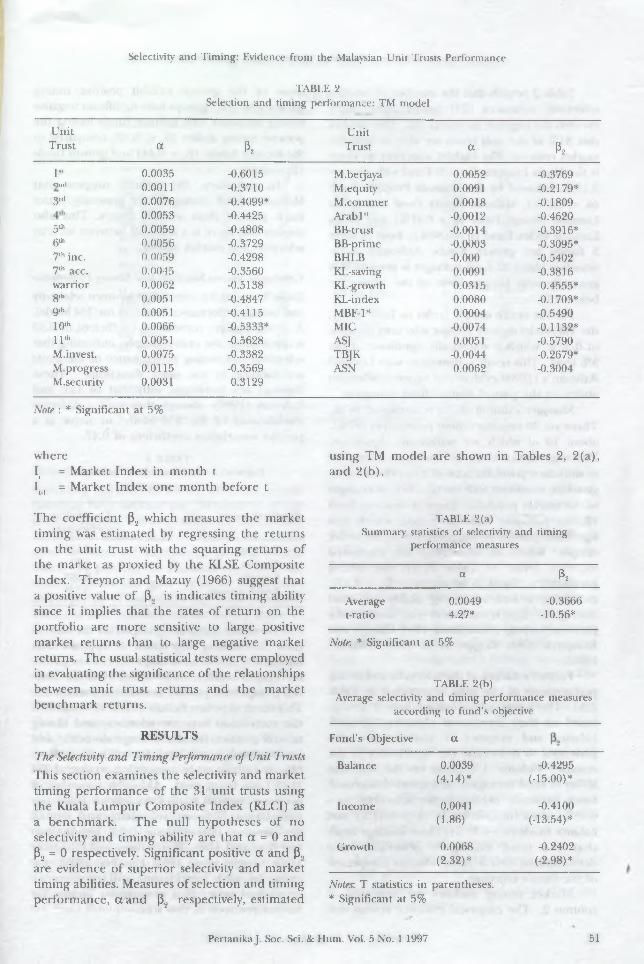
TABLE 2Selection and timing performance: TM model
UnitTrust a P2
UnitTrust a P2
l'1 0.0035 -0.6015 M.berjaya 0.0052 -0.3769Ond 0.0011 -0.3710 M.equity 0.0091 -0.2179*3rd 0.0076 -0.4099* M.commer 0.0018 -0.1809
0.0053 -0.4425 Arab 1st -0.0012 -0.46205th 0.0059 -0.4808 BB-trust -0.0014 -0.3916*6,h 0.0056 -0.3729 BB-prime -0.0003 -0.3095*7,h inc. 0.0059 -0.4298 BHLB -0.000 -0.54027,h acc. 0.0045 -0.3560 Ki .-saving 0.0091 -0.3816warrior 0.0062 -0.5138 KI .-growth 0.0315 0.4555*8«h 0.0051 -0.4847 KL-index 0.0080 -0.1703*9,h 0.0051 -0.4115 MBF-l* 0.0004 -0.549010,h 0.0066 -0.5333* MIC -0.0074 -0.1132*11th 0.0051 -0.5628 ASJ 0.0051 -0.5790M. invest. 0.0075 -0.3382 TBJK -0.0044 -0.2679*M. progress 0.0115 -0.3569 ASN 0.0062 -0.3004M.security 0.0031 0.3129
Note : * Significant at 5%
whereI( = Market Index in month tI( = Market Index one month before t
The coefficient p2 which measures the market timing was estimated by regressing the returns on the unit trust with the squaring returns of the market as proxied by the KLSE Composite Index. Treynor and Mazuy (1966) suggest that a positive value of p2 is indicates timing ability since it implies that the rates of return on the portfolio are more sensitive to large positive market returns than to large negative market returns. The usual statistical tests were employed in evaluating the significance of the relationships between unit trust returns and the market benchmark returns.
RESULTSThe Selectivity and Timing Performance of Unit Trusts This section examines the selectivity and market timing performance of the 31 unit trusts using the Kuala Lumpur Composite Index (KLCI) as a benchmark. The null hypotheses of no selectivity and timing ability are that a = 0 and P2 = 0 respectively. Significant positive a and p., are evidence of superior selectivity and market timing abilities. Measures of selection and timing performance, a and P2 respectively, estimated
using TM model are shown in Tables 2, 2(a), and 2(b).
TABLE 2(a)Summary statistics of selectivity and timing
performance measures
a e,Average 0.0049 -0.3666t-ratio 4.27* -10.56*
Note: * Significant at 5%
TABLE 2(b)Average selectivity and timing performance measures
according to fund’s objective
Fund's Objective a
Balance 0.0039 -0.4295(4.14)* (-15.00)*
Income 0.0041 -0.4100(1.86) (-13.54)*
Growth 0.0068 -0.2402(2.32)* (-2.98)*
Notes: T statistics in parentheses.* Significant at 5%
Pertanika J. Soc. Sci. 8c Hum. Vol. 5 No. 1 1997 51

Annuar Met. Nassir, Shamsher Mohamed and Ngu Mee Hua
Table 2 reveals that the number of positive selectivity measures (25) found significantly exceeds the negative measures (6). This implies that 81% of the unit trusts are able to beat the market returns. The highest selectivity measure is the Kuala Lumpur Growth Fund with the a = 3.15%, followed by the Malaysia Progress Fund (a = 1.15%), Malaysia Equity Fund and Kuala Lumpur Savings Fund (a = 0.91%) and Kuala Lumpur Index Fund (a = 0.80%). Four of these 5 funds are growth funds. Although some selection ability of fund manager is present, it is generally weak because most of the values are below 1%.
For the entire sample (refer to Table 2(a)), the TM model shows a positive selectivity measure of 0.49%, which is statistically significant at the 5% level. This result is consistent with Lee and Rahman’s (1990) evidence of superior selection ability on the part of mutual fund managers.
Manager’s timing ability is measured by p„. There are 30 negative timing parameters (97%), about 10 of which are statistically significant. This suggests that about 10 funds have attempted to shift their portfolio betas in a way that was not generally consistent with the direction of changes in the market portfolio. There is only one fund (Kuala Lum pur Growth Fund) which has significant positive timing parameter in the entire sample. When all unit trusts are examined together (refer to Table 2(a)), the timing parameter is found to be negative (p9 = -0.37), indicating a lack of timing ability for fund managers. This is consistent with most of the previous findings (Henriksson 1984: Connor and Korajcyzk 1991; Coggin et al. 1993; Fletcher 1995).
Further evidence of the selectivity and timing performance of the trust is reported in Table 2(b). The trusts are classified into 3 groups based on their investment objectives (growth, balance and income). T statistics are also presented to determine the significance of the results. Column 1 reports on the selection ability of fund managers. It appears that growth funds generally exhibit better selectivity (a = 0.68%) than income funds (a = 0.41%) and balance funds (a = 0.39%). These findings imply th a t the fund m anagers generally have demonstrated their selection abilities irrespective of the fund’s objective.
Market timing abilities are reported in column 2. The empirical evidence reveals that
none of the groups exhibit positive timing parameters. All 3 groups have significant negative timing measures with balance funds having the poorest timing ability (p2 = -0.43) compared to the income funds (P., = -0.41) and growth funds (P2 = -0.24).
In summary, the results suggest that Malaysian fund managers are generally better stock pickers than market timers. This also implies that there is a trade-off between security selection and market timing.
Correlation l)etxoeen Selectivity and l iming Performance Table 3 reports the correlation between selectivity and timing performance based on the TM Model. A strong positive correlation coefficient of 0.53 is observed in the entire sample, indicating that selectivity and timing performance of the trusts are moving in the same directions. These findings are consistent with that of Lee and Rahman (1990) though they used a different modification of the TM Model to arrive at a positive correlation coefficient of 0.47.
TABLE 3Pearson's correlation between selectivity
and timing performance
Fund's objective Correlation coefficient (r)
Balance -0.55*Income 0.81Growth 0.89*Entire sample 0.53*
When the funds are grouped on the basis of their investment objectives, it appears that balance funds have sign ifican t negative correlation coefficients (r= 0.55), while the other two groups have positive correlation coefficients. This result supports Bello’s (1995) findings that the correlation between selectivity and timing turned positive for the average domestic and international funds, and for each investment objective group when a modified version of TM Model was being used. Although a number of previous research studies documented negative correlation between selectivity and timing performance (Hendriksson 1984; Jagannathan and Korajcyzk 1986; Bhattacharya and Pfleiderer 1983; Coggin et al. 1993; Fletcher 1995), the cause of such correlation still remains an unresolved issue, thus proving an avenue for further research in this area.
52 Pertanika J. Soc. Sci. 8c Hum. Vol. 5 No. 1 1997

Selectivity and Timing: Evidence from the Malaysian Unit Trusts Performance
TABLE 4Extent o f diversification* o f unit trusts in Malaysia
UnitTrust K Rank
UnitTrust K Rank
8th Bumi 0.57 1 M, Progress 0.41 17 -6th Bumi 0.54 2 ASJ 0.38 187th Acc. 0.53 3 1st Bumi 0.38 194th Bumi 0.52 4 M. Commer 0.37 202nd Bumi 0.51 5 11 th Bumi 0.34 21M. berjaya 0.51 6 M. secutiry 0.31 22Warrior 0.49 7 BBMB Trust 0.25 237th inc. 0.48 8 10th Bumi 0.24 24M. invest. 0.47 9 BBMB Prime 0.23 25BHLB 0.47 10 5th Bumi 0.23 26ASN 0.45 11 3rd Bumi 0.21 279th Bumi 0.45 12 KL Index 0.15 28KL Saving 0.42 13 MIC 0.13 29M. Equitu 0.41 14 TB|K 0.06 30Arab 1st 0.41 15 KL growth 0.01 31MBF 1st 0.41 16
* The average R2 = 0.37. The R2 for perfect diversification = 1.00.
Diversification of the Unit Trusts Spreading risk and capitalizing on future growth potential have become the cornerstone of the prudent investor’s strategy following the October 1987 stock market crash. That is why many small investors are increasingly turning to unit trusts. By pooling the financial resources, the small investors can gain access to the services and expertise of top money and fund managers. They can also benefit from the fund’s ability to invest in d iffe ren t security m arkets and diversification in investment portfolio in each market otherwise available only to institutions and wealthy individuals. The degree of diversification of a unit trust is measured by the R2 statistic which ranges in value from 0 to 1. The R2 statistic can be estimated by the extent to which the unit trust returns covary with the market. The R2 statistics of the total sample and sub-sample are summarized in Tables 4 and 4(a), respectively.
Table 4 exhibits that the R2 statistic of the 31 unit trusts range between 0.01 to 0.57. The result shows that 81% of the unit trusts are not well-diversified, with the R2 values below the 0.5 cut-off points. Only 6 funds in the sample (19%) have achieved the expected level of diversification with the R2 values above 0.5; 5 of these 6 funds are Mara Bumiputera Funds. The average value
of R2 is 0.37, which implies that the unit trusts have about 37% diversification. Of the 31 funds in the sample, 20 (65%) have achieved the average diversification with the R2 values above 0.37. However, there are 2 least diversified funds (TBJK and KL Growth) in the sample with the R2 values below 10%.
We can conclude that the degree of diversification of unit trusts appears to be low in Malaysia. This may be due to the stringent trust provisions that discourage fund managers choosing more risky stocks to include in then funds or the management’s strategy to sacrifice diversification to earn a higher return. The investment constraints imposed by the Securities Commission (SC) on unit trusts include the following:
• The maximum size of a unit trust fund shall not be more than 500 million units.
• A unit trust fund is only permitted to invest up to 10% in the securities listed on a foreign stock exchange, and prior approval o f the SC m ust be o b ta in ed before undertaking such investments.
• A unit trust fund shall not invest more than 50% of the fund in non-trustee securities.
• Investment in the securities of any company shall not exceed
Pertanika J. Soc. Sci. & Hum. Vol. 5 No. 1 1997 53

Annuar Md. Nassir, Shamsher Mohamed and Ngu Mee Hua
(i) 10% of the net asset value of the fund; or
(ii) 10% of the issued capital of the company, whichever is lower.
• Investment in any group of companies shall not exceed 15% of the net asset value of the fund.
• At least 10% of the net asset value of the fund should be maintained in the form of liquid assets at all times.
• The trust fund is not allowed to guarantee or grant any loans or engage in any short selling of securities.
TABLE 4(a)Diversification measure of unit trusts with different
investment objectives
Fund’s objective * R2
Income 0.46Balance 0.38Growth 0.31
Table 4(a) shows that the income funds are relatively more diversified (0.46) than balance funds (0.38) and growth funds (0.31). Although th e ' income trusts are marginally better than
o ther categories, none have achieved the expected level of diversification (R2 greater than 0.5). These findings imply that Malaysian unit trusts have very little diversification relative to those reported in more developed markets (Ippolito 1989) where the average degree of diversification is as high as 0.70. Therefore, there is room for further diversification and fund recomposition.
Market Risk of Unit TrustsAn important characteristic of the unit trusts is their market risk or p which measures the amount of non-diversifiable marketwide risk. Tables 5 and 5(a) summarize these beta values for the 31 unit trusts.
Table 5 shows that all 31 unit trusts in the sample possess low market risk with beta values substantially below 1.00. This makes intuitive sense given partial diversification benefits, as explained by modern portfolio theory. The average market risk is 0.39, which makes the unit trust investments relatively safer than in markets where the beta is close to 1.00. The KL Growth Fund appears to have the lowest risk (P = -0.26) fund in the sample. Strictly speaking, negative beta does not offer any intuitive interpretation of rule. The other funds have a risk of 0.23-0.53.
TABLE 5Measure of market risk* in unit trusts
UnitTrusts P. Rank
UnitTrusts P, Rank
KL-growth -0.26 1 9th 0.43 17MIC 0.23 2 MBF-lst 0.43 18M. commer 0.25 3 7th inc. 0.44 19KL-index 0.25 4 M. progress 0.44 20M.security 0.33 5 BHLB 0.44 21TBJK 0.34 6 3rds 0.45 225th 0.37 7 4th 0.45 236th 0.38 8 KL=saving 0.46 247th acc. 0.39 10 ASj 0.47 26ASN 0.39 11 8th 0.48 272nd 0.40. 12 M. berjaya 0.50 28Warrior 0.42 13 10th 0.51 29M. invest 0.42 14 Arab 1st 0.52 30BB-prime 0.42 15 11th 0.53 311st 0.43 16
* The average (3, = 0.39. The (3, for the market is 1.00
54 Pertanika J. Soc. Sci. & Hum. Vol. 5 No. 1 1997

Selectivity and Timing: Evidence from the Malaysian Unit Trusts Performance
TABLE 5(a) xMeasure of market risk according to
investment objectives
Fund's objective 3,
IncomeBalanceGrowth
0.460.420.32
Correlation of Return between Unit Trust and Market U nit trusts are m anaged by professional managers, and investors expect returns on their investment to be higher than that of a naive buy- and-hold strategy with equivalent risk. The usual benchmark used by investors to evaluate the investment performance of unit trusts is the returns on the market portfolio proxied by the market index (KLSE Composite Index). The correlation of returns between types of funds and the market return are presented in Table 6.
Table 6 illustrates the correlations for the balance, income and growth funds are 60, 68 and 53% respectively. The income fund is relatively more diversified and the growth fund is least diversified. Since the growth fund goes for capital gains, it is expected to be the least diversified.
TABLE 6Correlation of returns between type of fund and
the market returns (KLCI)
Fund's Objective KLCI
Balance 0.60(18.65)*
Income 0.68(48.37)*
Growth 0.53(9.34)*
Regression QualityThe strength of the relationship between dependent variable (return of unit trusts) and independent variable (KLSE Composite Index) as a whole is measured by the F statistic. Table 7 shows that 90% of the F statistics are statistically significant at the 5% level, thus indicating the TM model has provided a good fit to unit trust data. However, R2 which m easures the explanatory power of the TM model was within a range of 0.01 to 0.57. This shows that the m odel has partia l exp lanato ry power. Collectively, the TM model is still applicable in
TABLE 7 F statistics and R2 : TM model
UnitTrust F R2
UnitTrust F R2
1st 11.835 0.3757 M. Berjaya 20.527 0.51072nd 20.576 0.5113 M. equity 13.831 0.41293rd 5.355 0.2140 M. Commer 11.580 0.37064th 20.908 0.5153 Arab 1st 13.746 0.41145th 5.868 0.2298 BB Trust 6.563 0.25026th 22.857 0.5386 BB Prime 4.743 0.23247th Inc. 18.477 0.4844 BHLB 14.039 0.47267th Acc. 22.482 0.5334 KL Savings 14.365 0.4221Warrior 18.566 0.4856 KL Growth 0.109* 0.00558th 25.932 0.5687 KL Index 2.083 0.15159th 15.871 0.4466 MBF-lst 10.914 0.410610th 6.238 0.2408 MIC 2.934 0.129811th 10.226 0.3421 ASJ 11.850 0.3760M. Invest. 17.737 0.4742 TBJK 1.273* 0.0608M. Progress 13.543 0.4078 ASN. 14.275 0.4469M. Security 8.856 0.3105
Note: *Not significant at 5%
PertanikaJ. Soc. Sci. & Hum. Vol. 5 No. 1 1997 55

Annuar Md. Nassir, Shamsher Mohamed and Ngu Mee Hua
evaluating the selectivity and timing performance of fund managers in Malaysia although the explanatory power is poor.
CONCLUSIONThis paper applies the TM model to examine selectivity and timing performance of 31 unit trusts for a period of 62 months (July 1990- August 1995). The selectivity performance of the trusts is on average positive, but the timing performance is on average negative. Only one fund possesses a superior timing ability, i.e. Kuala Lumpur Growth Fund, while the other 30 funds show inferior timing ability, implying that most unit trusts do not possess market timing ability. However, some appear to exhibit superior selection ability as 81% of the sample of unit trusts are able to outperform the market returns and the Kuala Lumpur Growth Fund ranked highest in term of selectivity measure. The study also found a positive correlation between selectivity and timing performance which is consistent with previous studies of unit trust performance (Lee and Rahman 1990; Bello 1995).
The degree of diversification of unit trusts and risk-return characteristics associated with the unit trusts were also examined. The findings indicate that the degree of diversification of the Malaysian unit trusts are generally below expectations and risk-return characteristics of the trusts are inconsistent with their stated objectives. The lackadaisical performance of these unit trusts could be partially attributable to the regulatory constraints imposed by the Security Commission, strict advertising code for the unit trust industry and lack of fund managers’ expertise. However, with Malaysian’s salient economic performance, unit trusts provide an extra investment vehicle for investors at large and promise a bright future.
REFERENCESB e l l o , Z.Y. 1995. An empirical study of the
correlation between mutual funds’ selectivity and timing performance. In Managerial Finance in the Corporate Economy, ed. Philip K. Ghosh & Shahriar Khaksari, p. 71-94. London: Routledg.
B h a t t a c h a r y a , S., and P . P fle id er e r . 1983 A note on performance evaluation, Technical Report 714, Stanford University.
C h e n , C a r l R ., C h e n g F. L e e , S h a f iq u r R aj im an and A n t h o n y C h a n . 1992. A cross-sectional analysis of mutual fund’s market timing and security selection skill. Journal of Business Finance & Accounting; 19(5): 659-674.
C h a n g , E ric: C . and W il b u r L e w e l l e n . 1984. Market timing and mutual fund investm ent performance. Journal of Business 57(1): 57-72.
C o g g in , T.D., and J.E. H u n t e r . 1993. A meta-analysis of mutual fund performance. Review of Quantitative Finance and Accounting 3: 189-201.
C o g g in , T.D., F.J. F ab o z z i and S. R a h m a n . 1993. The investment performance of U.S. equity pension fund managers: An empirical investigation, Journal of Finance 3: 1039-1055.
C o n n o r , G ., and R . K orajczyk . 1991. The attributes, behaviour and performance of U.S. mutual funds. Review of Quantitative Finance and Accounting 1: 5-26.
C um by , R o b e r t E . and J ack D. G l e n . 1990. Evaluating the performance of international mutual funds. Journal of Finance 45(2): 497-521.
F a m a , E. F . 1972. Components of investment portfolio. Journal of Finance 27:551-567.
F ir t h , M.A. 1977. The investment performance of unit trusts in the period 1965-76. Journal of Money, Credit and Banking 9.
F l e t c h e r , J. 1995. An examination of the selectivity and market timing performance of UK unit trusts. Journal of Business Finance & Accounting 22(1): 143-156.
G r in b l a t t , M., and S. T it m a n . 1989a. Mutual fund performance: An analysis of quarterly portfolio holdings. Journal of Business 5: 393-416.
G r in b l a t t , M., and S . T it m a n . 1989b. Portfolio performance evaluation: Old issues and new insights. Reviexu of Financial Studies 5(2): 393- 421
H e n d r ik s s o n , R o y D. 1984. Market timing and mutual fund performance: an empirical investigation. Journal of Business 57(1): 73-96.
H e n d r ik s s o n , Roy D. and R.C. M e r t o n . 1981. On the market timing and investment performance : Statistical procedures for evaluating forecasting skills. Journal of Business 54: 513- 533.
H u n t e r , J.E., T.D. C o g g in , and S. R a h m a n . 1992. The correlation between sampling errors in
56 Pertanika J. Soc. Sci. 8c Hum. Vol. 5 No. 1 1997

Selectivity and Timing: Evidence from the Malaysian Unit Trusts Performance
the estimation of security selection and market timing skill. Working paper, Michigan State University, East Lansing.
I p p o l i t o , R.A. 1989. Efficiency with costly inform ation: A study of mutual fund performance 1965-84. Quarterly Journal of Economics (February): 1-23.
J a g a n n a t h a n , R avi and R o b e r t A. K orajczyk . 1986. Assessing the market timing performance of managed portfolio. Journal of Business 59(2): 217-235.
J e n s e n , M.C. 1968. The performance of mutual funds in the period 1945-1964. Journal of Finance 23(2): 389-416.
J e n s e n , M.C. 1972. Optimal utilisation of market forecasts and the evaluation of investment performance. In Mathematical Methods in Investment and Finance, eds. G.P. S/ego and K. Shell, Amsterdam: Elsevier.
K o n , S.J. 1983. The market timing performance of mutual fund managers. Journal of Business 56(3): 321-47.
K o n , S.J. and F.C. J e n . 1979. The investment performance of mutual funds: An empirical investigation of timing, selectivity and market efficiency. Journal of Business 52: 263-289.
L e e , C h e n g F. and S h a f iq u r R a h m a n . 1990. Market timing, selectivity, and amutual fund performance: An empirical examination. Journal of Business 63: 261-278.
L e h m a n n , B r u c e N. and D a v id M. M o d e s t . 1987. Mutual fund performance evaluation: A comparison of benchmarks and benchmark comparisons. Journal of Finance 42(2): 233-265.
S h a r p e , W.F. 1966. Mutual fund performance. Journal of Business 39(1): 119-138.
T rey no r , J .L . and F. Bl\ck. 1973. How to use security analysis to improve portfolio selection. Journal of Business 46: 66-86.
T re y n o r , J.L. and K ay K. M azu y . 1966. Can mutual funds outguess the market? Harvard Business Review 44: 131-6.
Received 24 April 1996)
PertanikaJ. Soc. Sci. 8c Hum. Vol. 5 No. 1 1997 57