Selectivity and Timing: Evidence from the Perfonnance of...
13
Pertanika J. Soc. Sci. & Hum. 5(1); 45-57 (1997) ISSN; 0128-7702 © Universiti Putra Malaysia Press Selectivity and Timing: Evidence from the Perfonnance of Malaysian Unit Trusts AN UAR MD ASSIR, SHAMSHER MOHAMED and NGU MEE HUA Faculty of Economics and Management Universiti Putra Malaysia 43400, Serdang, Selangor, Malaysia Keywords: unit trusts, market timing, selectivity, diversification ABSTRAK Kajian ini mengkaji pemilihan dan pemasaan pasaran untuk 3] saham amanah yang beroperasi di Malaysia. Keputusan menunjukkan bahawa bagi jangka masa ]990-1995, saham amanah di Malaysia tidak mempunyai pemasaan pasaran kecuali saham amanah Kuala Lumpur Growth Fund. Namun demikian, terdapat bukti yang menunjukkan pengurus dana mempunyai kebijaksaan dalam pemilihan saham-saham terpilih. Aclalah cliclapati 8] % saham amanah dalam kajian ini menghasilkan pulangan yang melebihi pulangan pasaran clan Kuala Lumpur Growth Fund mempunyai ukuran pemilihan yang tertinggi. Hubungan positif antara pemilihan dan pemasaan pasaran didapati dalam kajian ini dengan pekali korelasinya bernilai 0.53. Tahap pempelbagaian untuk 81 % saham amanah adalah di bawah jangkaan dan ciri risiko-pulangannya adalah ticlak konsisten dengan objektif yang telah ditetapkan. ABSTRACT This paper presents an empirical examination of the selectivity and timing performance of 31 unit trusts in Malaysia. The empirical results indicate that during the] 990-1 995 period, Malaysian unit trusts appear to possess no market timing ability, except for the Kuala Lumpur Growth Fund. However, there is some evidence of superior selection ability on the part of fund managers in picking up "good" stocks. Eighty-one per cent of the sample of unit trusts are able to beat the market return and the Kuala Lumpur Growth Fund ranked highest in terms of measure. The study found a positive correlation coefficient of 0.53 between selectivity and timing pe"formance among the unit u·usts. Further evidence suggests that 81 % of the unit trusts have not achieved the expected level of diversification, and risk-return characteristics of the trusts are generally inconsistent with their stated objectives. INTRODUCTION The development of the unit trust industry in Malaysia is still in its infancy and is expected to take off in the years ahead in the light of recent positive developments within the industry. Such developments include the introduction of new unit trusts (including the recently launched Amanah Saham Wawasan and several State unit trusts) and newly created unit trusts based on Islamic principles. In this respect, unit trusts will play an important role in the development of the Malaysian capital market through the proliferation of different types of funds to suit the various needs and risk-return profiles of investors. Unit trust funds are classified into different risk categories to cater for investors with different risk preference levels. There are six types of funds currently available in Malaysia: aggressive growth funds, growth funds, growth and income funds, income funds, balanced funds and bond funds. Bond funds are new in Malaysia the only such fund was launched in 1996. Overview oj the Malaysian Unit Trust Industry In many developed and several emerging markets, unit trusts or mutual funds comprise a large section of the capital market. In the United States, for example, there are over 1,800 mutual funds with a staggering US$2 trillion in assets. In neighbouring Thailand and Singapore, unit trusts constitute a bigger and faster growing share of market capitalization of equity markets than in Malaysia (Refer to Table I).
Transcript of Selectivity and Timing: Evidence from the Perfonnance of...

Pertanika J. Soc. Sci. & Hum. 5(1); 45-57 (1997) ISSN; 0128-7702© Universiti Putra Malaysia Press
Selectivity and Timing: Evidence from the Perfonnanceof Malaysian Unit Trusts
AN UAR MD ASSIR, SHAMSHER MOHAMED and NGU MEE HUAFaculty of Economics and Management
Universiti Putra Malaysia43400, Serdang, Selangor, Malaysia
Keywords: unit trusts, market timing, selectivity, diversification
ABSTRAK
Kajian ini mengkaji pemilihan dan pemasaan pasaran untuk 3] saham amanah yang beroperasi di Malaysia.Keputusan menunjukkan bahawa bagi jangka masa ] 990-1995, saham amanah di Malaysia tidak mempunyaipemasaan pasaran kecuali saham amanah Kuala Lumpur Growth Fund. Namun demikian, terdapat buktiyang menunjukkan pengurus dana mempunyai kebijaksaan dalam pemilihan saham-saham terpilih. Aclalahcliclapati 8] % saham amanah dalam kajian ini menghasilkan pulangan yang melebihi pulangan pasaran clanKuala Lumpur Growth Fund mempunyai ukuran pemilihan yang tertinggi. Hubungan positif antarapemilihan dan pemasaan pasaran didapati dalam kajian ini dengan pekali korelasinya bernilai 0.53. Tahappempelbagaian untuk 81 % saham amanah adalah di bawah jangkaan dan ciri risiko-pulangannya adalahticlak konsisten dengan objektif yang telah ditetapkan.
ABSTRACT
This paper presents an empirical examination of the selectivity and timing performance of 31 unit trusts inMalaysia. The empirical results indicate that during the] 990-1 995 period, Malaysian unit trusts appear to
possess no market timing ability, except for the Kuala Lumpur Growth Fund. However, there is someevidence of superior selection ability on the part of fund managers in picking up "good" stocks. Eighty-oneper cent of the sample of unit trusts are able to beat the market return and the Kuala Lumpur Growth Fundranked highest in terms of selecti,~ty measure. The study found a positive correlation coefficient of 0.53between selectivity and timing pe"formance among the unit u·usts. Further evidence suggests that 81 % of theunit trusts have not achieved the expected level of diversification, and risk-return characteristics of the trustsare generally inconsistent with their stated objectives.
INTRODUCTION
The development of the unit trust industry inMalaysia is still in its infancy and is expected totake off in the years ahead in the light of recentpositive developments within the industry. Suchdevelopments include the introduction of newunit trusts (including the recently launchedAmanah Saham Wawasan and several State unittrusts) and newly created unit trusts based onIslamic principles. In this respect, unit trusts willplay an important role in the development ofthe Malaysian capital market through theproliferation of different types of funds to suitthe various needs and risk-return profiles ofinvestors.
Unit trust funds are classified into differentrisk categories to cater for investors with different
risk preference levels. There are six types offunds currently available in Malaysia: aggressivegrowth funds, growth funds, growth and incomefunds, income funds, balanced funds and bondfunds. Bond funds are new in Malaysia the onlysuch fund was launched in 1996.
Overview oj the Malaysian Unit Trust Industry
In many developed and several emergingmarkets, unit trusts or mutual funds comprise alarge section of the capital market. In theUnited States, for example, there are over 1,800mutual funds with a staggering US$2 trillion inassets. In neighbouring Thailand and Singapore,unit trusts constitute a bigger and faster growingshare of market capitalization of equity marketsthan in Malaysia (Refer to Table I).

Annuar Md. Nassir, Shamsher Mohamed and Ngu Mee Hua
TABLE 1Investment by unit trusts as a percentage
of mal-ket capitalization
Timing and Selection AbilitiesFama (1972) suggested portfolio managersforecasting skills could be partitioned into two
Source: Business Times 6/2/94* The latest published figure as at June 30 1995 is
7.9%, with total net asset value of RM43.1 billion,of which Amanah Saham Nasional and AmanahSaham Bumiputera accounted for RM27.9billion.
However, in the past few years, the Malaysianunit trust industry has been rapidly making upfor lost time and 1994 seems to have been theyear of unit trusts, judging from the proliferationof unit trusts funds and the rapid increase intheir popularity. As much as RM3 billion wasinvested by the middle of 1994 and doubtless,more will be channelled into new funds in thefuture. Presently, there are 29 unit trustmanagement companies, including 4 propertytrust companies, managing a total of 57 (69according to the latest statistics) funds in theMalaysian market. The unit trust industry isexpected to playa more important role in theeconomy and garner at least 20% of the marketcapitalization by the year 2000 given the strongeconomic fundamentals and the government'sencouragement of savings.
Many unit trust companies declare dividendsof over 10 per cent per annum and combinedwith unit value capital gains ensure manyinvestors a return of over 10% per annum ontheir investments. Given these returns, whowould not want to invest in unit trusts? However,two critical issues need to be addressed namely,timing and selection abilities. Timing ability refersto a fund manager's ability to forecast pricemovements of the general market as a whole,while selection ability involves identification ofindividual stocks which are good bargains.
(1)
(2)R = cx. +. R + u.JI J J 1111 .II
R = ~. R + e.Jt J Illt It
where ~I is the excess (net of risk-free rate)return on jIlt portfolio, R
oulis the excess (net of
risk-free rate) return on the market portfolio. j
measures the sensitivity of the portfolio returnto the market return and e. is a random error
Jl
which has an expected value of zero. Withinthis framework, microforecasts about the jIltportfolio would involve concentrating in e.. If
Jl
the portfolio manager is a superior forecaster(perhaps because of special knowledge notavailable to others) he will tend to selectsecurities which realize e. > O. Hence, his
Jl
portfolio will earn more than the 'normal' riskpremium for its level of risk. Allowance for suchforecasting ability can be made by simply notconstraining the estimating regression to passthrough the origin. That is, we allow for thepossible existence of a non-zero constant inequation (1) as follows:
The new error term u. will now have anJl
expected value of zero. Thus if the portfoliomanager has an ability to forecast security prices,the intercept cx. in equation (2) will be positive.
JA passive strategy (random buy and hold policy)can be expected to yield a zero intercept.
distinct components: (1) forecasts of pricemovemen ts of selected individual stocks (securityanalysis or micro-forecasting); and (2) forecastsof price movements of the general stock marketas a whole (market timing or macro-forecasting).This partitioning of forecasting skills is alsoevident in Treynor and Black (1973), who haveshown that portfolio managers can effectivelyseparate actions related to security analysis fromthose related to market timing.
Micro-forecasting or security analysis involvesidentification of individual stocks which areundervalued or overvalued relative to equities ingeneral. Within the specification of the capitalasset pricing model (CAPM), a micro-forecasterattempts to identify securities having expectedreturns that lie significantly off the securitymarket line. Specifically, the micro-forecasteronly forecasts non-systematic or security specificcomponents of security return. FollowingJensen(1972: 132) the excess return on portfolio canbe written as:
4840402516
5*
% of Market Capitalization
JapanAustralia
nited StatesIndiaThailandMalaysia
Country
46 PertanikaJ. Soc. Sci. & Hum. Vol. 5 No.1 1997
Selectivity and Timing: Evidence from the Malaysian Unit Trusts Performance
On the other hand, if the manager is notdoing as well as a random selection buy andhold policy, u
jwill be negative. Such results may
very well be due to large expenses in unsuccessfulforecasting attempts.
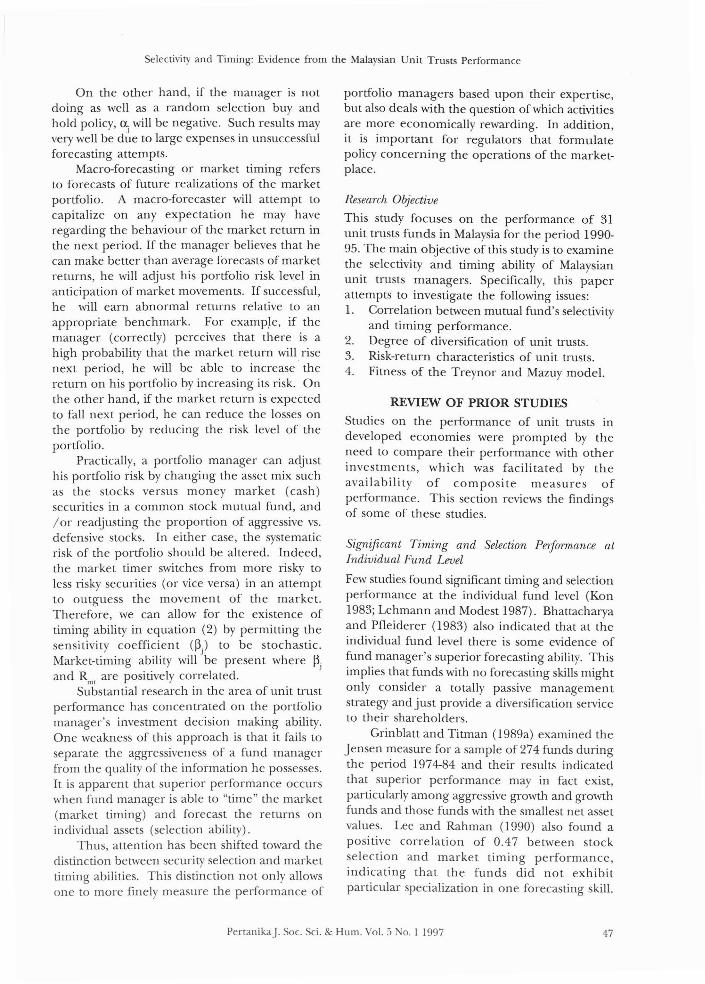
Macro-forecasting or market timing refersto forecasts of future realizations of the marketportfolio. A macro-forecaster will attempt tocapitalize on any expectation he may haveregarding the behaviour of the market return inthe next period. If the manager believes that hecan make better than average forecasts of marketreturns, he will adjust his portfolio risk level inanticipation of market movements. If successful,he will earn abnormal returns relative to anappropriate benchmark. For exampJe, if themanager (correctly) perceives that there is ahigh probability that the market return will risenext period, he will be able to increase thereturn on his portfolio by increasing its risk. Onthe other hand, if the market return is expeCtedto fall next period, he can reduce the losses onthe portfolio by reducing the risk level of theportfolio.
Practically, a portfolio manager can adjusthis portfolio risk by changing the asset mix suchas the stocks versus money market (cash)securities in a common stock mutual fund, and/ or readjusting the proportion of aggressive vs.defensive stocks. In either case, the systematicrisk of the portfolio should be altered. Indeed,the market timer switches from more risky toless risky securities (or vice versa) in an attemptto outguess the movement of the market.Therefore, we can allow for the existence oftiming ability in equation (2) by permitting thesensitivity coefficient (~.) to be stochastic.
J
Market-timing ability will be present where ~
and R are positively correlated. JnH
Substantial research in the area of unit trustperformance has concentrated on the portfoliomanager's investment decision making ability.One weakness of this approach is that it fails toseparate the aggressiveness of a fund managerfrom the quality of the information he possesses.It is apparent that superior performance occurswhen fund manager is able to "time" the market(market timing) and forecast the returns onindividual assets (selection ability).
Thus, attention has been shifted toward thedistinction between security selection and markettiming abilities. This distinction not only allowsone to more finely measure the performance of
portfolio managers based upon their expertise,but also deals with the question of which activitiesare more economically rewarding. In addition,it is important for regulators that formulatepolicy concerning the operations of the marketplace.
Research Objective
This study focuses on the performance of 31unit trusts funds in Malaysia for the period 199095. The main objective of this study is to examinethe selectivity and timing ability of Malaysianunit trusts managers. Specifically, this paperattempts to investigate the following issues:1. Correlation between mutual fund's selectivity
and timing performance.2. Degree of diversification of unit trusts.3. Risk-return characteristics of unit trusts.4. Fitness of the Treynor and Mazuy model.
REVIEW OF PRIOR STUDIES
Studies on the performance of unit trusts indeveloped economies were prompted by theneed to compare their performance with otherinvestments, which was facilitated by theavailability of composite measures ofperformance. This section reviews the findingsof some of these studies.
Significant Timing and Selection Performance atIndividual Fund Level
Few studies found significant timing and selectionperformance at the individual fund level (Kon1983; Lehmann and Modest 1987). Bhattacharyaand Pfleiderer (1983) also indicated that at theindividual fund level there is some evidence offund manager's superior forecasting ability. Thisimplies that funds with no forecasting skills mightonly consider a totally passive managementstrategy and just provide a diversification serviceto their shareholders.
Grinblatt and Titman (1989a) examined theJensen measure for a sample of 274 funds duringthe period 1974-84 and their results indicatedthat superior performance may in fact exist,particularly among aggressive growth and growthfunds and those funds with the smallest net assetvalues. Lee and Rahman (1990) also found aposi tive correlation of 0.47 between stockselection and market timing performance,indicating that the funds did not exhibitparticular specialization in one forecasting skill.
PertanikaJ. Soc. Sci. & Hum. Vol. 5 1 O. I 1997 47

Annuar Md. Nassir, Shamsher Mohamed and Ngu Mee Hua
They found evidence of superior timing andselection at the individual fund level.
However, a couple of studies offer a differentset of results. Sharpe (1966) studied 34 openended unit trusts with annual data for the period1954-63 and found that on average, unit trustsdid not outperform the market. Out of the 34unit trusts, only 11 did better than the DJIA(Dow Jones Industrial Average). Another studycarried out by Jensen (1968) for the period1945-64 also reported similar results. Theevidence on unit trust performance indicatesnot only that the 115 unit trusts examined wereon average not able to predict security priceswell enough to outperform a buy-the-marketand-hold policy, but also that there is very littleevidence that any individual fund was able toperform better than expectations. Theconclusions discussed were valid even when thereturns were measured gross of managementexpenses (that is assume their bookkeeping,research and other expenses except brokeragecommissions were obtained free). Thus, onaverage the funds were apparently not quitesuccessful enough in their trading activities torecoup even their brokerage expenses. However,the question of diversification was not considered.
Firth (1977) studied the performance of 72unit trusts in the United Kingdom using thecapital asset pricing model and Sharpe's rewardvariability index for the period 1965-75 showedthat on average, managers of unit trusts werenot able to forecast share prices accuratelyenough to outperform a simple buy and holdpolicy. None of the unit trusts examinedprovided investors with the opportunity to investin a portfolio of greater volatility than the marketportfolio. The results also imply that unit trustmanagers have no superior investment selectionability, this perhaps is not surprising in view ofthe competitive nature of the British stockmarket.
Kon andJen (1979) examined the possibilityof changing levels of market-related risk overtime for unit trust portfolios. They separatedtheir data sample into different risk regimes andfound that a large number of funds engage intiming activities. There are also a number ofstudies documenting negative timing skill ofunit trust managers. Coggin et al. (1993) studiedthe performance of US equity pension fundmanagers and found that the average timingmeasure was negative regardless of the choice of
benchmark portfolio or estimation model. Theseresults are consistent with those of previousstudies on unit trust performance (see Kon 1983;Chang and Lwellen 1984; Henriksson 1984;Lehmann and Modest 1987; Cumby and Glen1990; Connor and Korajczyk 1991; Coggin andHunter 1993). These studies found moreevidence of negative market timing than positive,and also found some evidence of negativeselection ability of unit trusts.
Negative Correlation between Selectivity and Timing
Studies of the micro and macro-forecasting abilityof mutual fund managers generally find a zeroor negative performance for the average fund,suggesting that the average fund managerdisplays no significant selection or timing ability.Further, a negative correlation between selectionand timing performance, suggestive of reverseskills or activity specialization, is reported byKon (1983), Henriksson (1984) and Chang andLewellen (1984). Similar results were alsoreported by Chen et at. (1992). They studied asample of 93 unit trusts with monthly data forthe period 1977-84 and found that 62% of thefunds exhibited negative timing parameters,indicating a lack of timing ability for averageportfolio managers. Furthermore, the results alsosuggested that there was a trade-off betweensecurity selection and market timing for fundsinvolved in both activities.
However,Jagannathan and Korajezyk (1986)argued that such results could arise from artificialmarket timing due to the differential leverage ofthe firms in the indices and those invested in bythe unit trusts. They theoretically and empiricallydemonstrated how to create a portfolio thatwould exhibit positive (negative) timingperformance and negative (positive) securityselection when no true timing or selectivity exists.They suggested that funds invest in highly leveredstocks will show a positive market timingperformance while those investing in little or norisky debt stocks will show a negative timingperformance.
Unlike the predictions in Jagannathan andKorajczyk (1986), Lehmann and Modest (1987)found no systematic evidence that funds withlarge negative timing terms have large positiveselectivity. Specifically, they were unable to detectany substantive correlation between selectivityand timing terms. Bello's (1995) study alsohypothesized that the preponderance of negative
48 PertanikaJ. Soc. Sci. & Hum. Vol. 5 No.1 1997

Selectivity and Timing: Evidence from the Malaysian Unit Trusts Performance
Models oj Selectivity and Timing
At present, it is an accepted practice to modelselectivity and timing simultaneously. Jensen(1968, 1969) formulated a return-generatingmodel to measure performance of managedportfolios. The model is:
where R is the excess (net of risk-free rate)p'
return on the P'h portfolio. Rm1 is the excess (netof risk-free rate) return on the market portfolio,a is a measure of security selection ability, ~
rri'easures the sensitivity of the portfolio to th~market return, j1 is a random error which has
p'expected value of zero and t denotes time. Thisspecification assumes that the risk level of theportfolio under consideration is stationarythrough time and ignores the market timingskill of the managers. Indeed, portfolio managersmay shift the overall risk composition of theirportfolio in anticipation of broad market pricemovements. Fama (1972) and Jensen (1972)addressed this issue and suggested a somewhatfiner breakdown of performance.
Treynor and Mazuy (1966) added aquadratic term to equation (3) to test for markettiming skill. They argued that if a manager canforecast market returns, he will hold a greater
timing performance and the negative correlationbetween timing performance and selectivity wereexplained by the form of the return-generatingmodel used in those studies and not by theleverage characteristics of the fund's assets.Therefore, the negative correlation betweenselectivity and timing presents a problem ofinterpretation.
Another study carried out by Hunter et al.(1992) showed that the correlation between theestimates of selectivity and timing will necessarilybe negative if the regression model is beingused. They showed that this is because thesampling errors for the two estimates are negativelycorrelated. Similar result was also reported byCoggin et al. (1993). Grinblatt and Titman(1989b) have shown that many of the desirableproperties of a performance measurement modelwhich seeks to estimate both selectivity andmarket timing skill are not present if selectivityand timing are correlated. Therefore, thecorrelation between selectivity and market timingis an unsettled question in the literature.
(4)R = a + f.l. R + y(R )2 + Ept p JJp ml fit pi
A positive value of y would imply positivemarket timing skill.
Jensen (1972) developed a similar model todetect selectivity and timing skill of managers.Jensen's measure of market timing performancecalls for a fund manager to forecast the deviationof the market portfolio return from its consensusexpected return. By assuming that the forecastedreturn and the actual return on the market havea joint normal distribution, Jensen shows that amarket timer's forecasting skill can be measuredby the correlation between the market timer'sforecast and the realized return on the market.
Bhattacharya and Pfleiderer (1983) extendedthe work of Jensen (1972). By correcting anerror made in Jensen (1972), they show that onecan use a simple regression technique to obtainmeasures of timing and selection ability. Jensenassumed that the manager uses unadjustedforecast of the market return in the timingdecision. Bhattacharya and Pfleiderer assumethat the manager adjusts forecasts to minimizethe variance of the forecast error. They specifya relationship in terms of observable variables,which is similar to the Treynor and Mazuy's(1966) model:
a = security selection ability,eP
= fund manager's response to information,i.e., risk level deviation from the targetrisk level depending on the optimalforecast of the market return.
\fI = coefficient of determination betweenthe manager's forecast and the excessreturn on the market, and
j1, E = the error of the manager's forecast.
where
proportion of the market portfolio when thereturn on the market is high and a smallerproportion when the return on the market islow. Thus, the portfolio return will be a nonlinear function of the market return as follows:
The quadratic regression of R on R will detectpI mt
the existence of stock selection ability, as revealedby a
p. The disturbance term in equation (5) :
(3)R =a +f.l.R +j1pi P PI' mt pi
PertanikaJ. Soc. Sci. & Hum. Vol. 5 No.1 1997 49

Annuar Md. Nassir, Shamsher Mohamed and Ngu Mee Hua
contains the information needed to quantify themanager's timing skill by regressing (m? on(R
m)2:
the dividend-adjusted return on portfoliop in month t minus the yield on 91-dayTreasury bills in month t (Rft);
Rmt
- the observed return on the KLSEComposite Index in month t minus R
ft;
the estimated selectivity;the beta risk of unit trust;
= the estimated timing performance;Cpt = the residual excess return on portfolio p
in month t.
Rpt
pt• 1
R =---pt
Pt
= fund's selling price at the end of month tp
t• 1 = fund's selling price one month before t
Dt
= dividends distributed at time t
Computation of Variables
The dividend-adjusted return on the unit trust(Rp) was calculated as follows:
The return on the market index (RnJ wasmeasured as follows:
R =cx. +pR +pR 2+£pt p I rnt 2 mt pt
where
where
Treynor and Mazuy Model (TM Model)
The stock selection and market timingperformance of each managed portfolio areestimated with Treynor and Mazuy (1966)equation:
The sample was grouped into 3 investmentobjectives, consisting of 18 balanced funds, 10growth funds and 3 income funds. The monthlyrate of return on the KLSE Composite Indexwas used to proxy for the market's return. Bothmonthly unit trust data and dividend data wereobtained from New Straits Times Sdn Bhd'sdatabase. The yield on 91-day Treasury Bills wasobtained from Bank Negara's Qy,arterly Bulletin.
(7)
(6)
The proposed regression produces a consistentestimator of 82qJ2cr2£, where (cr£)2 is the varianceof the manager's forecast error. Using theconsistent estimator of 8'¥, recovered fromequation (5) we can obtain (cr£)2. This, coupledwith knowledge about (crrc) 2, the variance ofexcess return on the ma'rket, allows us to estimate'¥ = (crrc)2/[(crrc)2 +(cr£)2J = p2, where p is thecorrelation between the manager's forecast andexcess return on the market and truly measuresthe quality of the manager's timing information.It should be noted that the disturbance term isheteroscedastic and does not produce the mostefficient estimates of the parameters.
The Bhattacharya and Pfleiderer (1983)model of equation (5) is a refinement of theTreynor and Mazuy model. It focuses on theefficient of the squared excess market return asan indication of timing skill. It was the firstmodel to analyse the error term to identify amanager's forecasting skill. Such a refinementshould make the model more useful thanprevious ones. However, as noted in Cogginand Hunter (1993), one weakness of the Treynorand Mazuy and the Bhattacharya and Pfleiderermodels is that they ignore negative or inferiormarket timing.
There are other models in the literaturethat permit identification and separation ofselectivity and timing skills of portfolio managers,e.g., models by Grinblatt and Titman (1989b),Henriksson and Merton (1981), and analternative to the Henriksson and Merton modelproposed by Kon and Jen (1978, 1979). TheGrinblatt and Titman model requires thehistorical sequence of portfolio weights (i.e., theamount invested in each stock) for the manager.Unfortunately, data on portfolio weights are verycostly, time-consuming, and often not available.
DATA AND METHODOLOGY
To detect selection ability and market timingskill of Malaysian mutual fund managers, monthlyreturns for 62 months Quly 1990 to August1995) for a sample of 31 unit trusts were used.
I - It 1-1
R =Ill{
It.1
50 Pertanikaj. Soc. Sci. & Hum, Vol. 5 No, I 1997
Selectivity and Timing: Evidence from the Malaysian Unit Trusts Performance
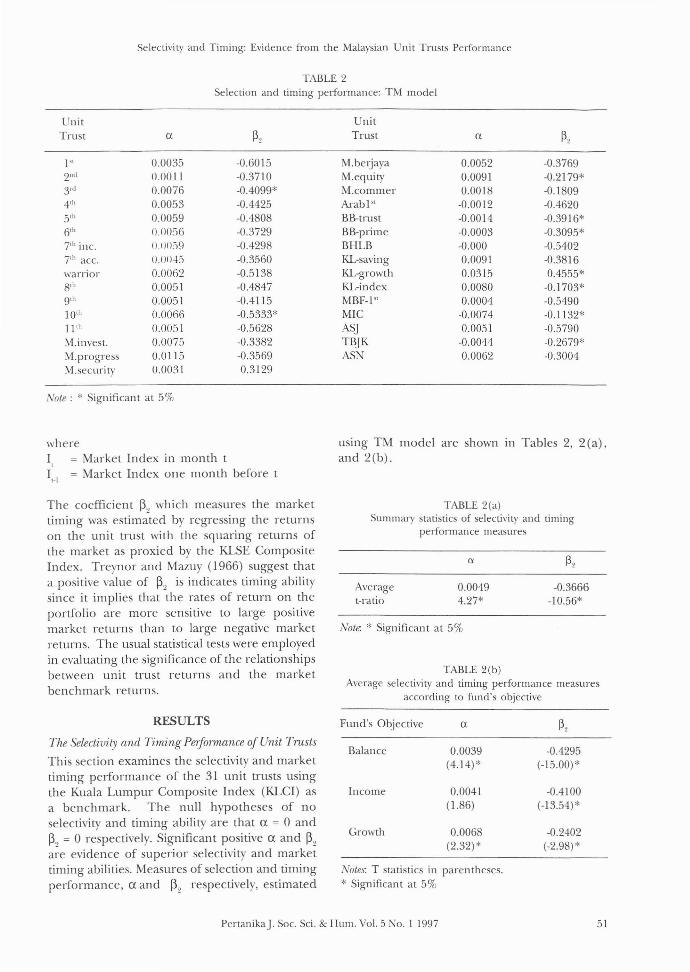
TABLE 2Selection and timing pelformance: TM model
UnitTrust a p,
1" 0.0035 -0.60152nd 0.0011 -0.37103'd 0.0076 -0.4099*4lh 0.0053 -0.442551h 0.0059 -0.48086'h 0.0056 -0.372971h inc. II IIO:"i9 -0.429871h ace. O.OIl·Ei -0.3560warrior 0.0062 -0.51388'h 0.0051 -0.48479'h 0.0051 -0.411510'h 0.0066 -0.5333*11 'h 0.0051 -0.5628M.invesl. 0.0075 -0.3382M.progress 0.0115 -0.3569M.security 0.0031 0.3129
Note: * Significant at 5%
whereI = Market Index in month t,1'.1 = Market Index one month before t
UnitTrust a p,
M.betjaya 0.0052 -0.3769M.equity 0.0091 -0.2179*M.commer 0.0018 -0.1809ArabI" -0.0012 -0.4620BB-trust -0.0014 -0.3916*BB-prime -0.0003 -0.3095*BHLB -0.000 -0.5402KL-saving 0.0091 -0.3816KL-growth 0.0315 0.4555*KL-index 0.0080 -0.1703*MBF-l" 0.0004 -0.5490MIC -0.0074 -0.1132*ASJ 0.0051 -0.5790TBJK -0.0044 -0.2679':'ASN 0.0062 -0.3004
using TM model are shown In Tables 2, 2 (a),and 2(b).
TABLE 2(a)Summary statistics of selecti\~ty and timing
performance measures
TABLE 2(b)Average selectivity and timing performance measUl'es
according to fund's objective
Note. * Significant at 5%
Notes: T statistics in parentheses.* Significant at 5%
The coefficient ~2 which measures the markettiming was estimated by regressing the returnson the unit trust with the squaring returns ofthe market as proxied by the KLSE CompositeIndex. Treynor and Mazuy (1966) suggest thata positive value of ~2 is indicates timing abilitysince it implies that the rates of return on theportfolio are more sensitive to large positivemarket returns than to large negative marketreturns. The usual statistical tests were employedin evaluating the significance of the relationshipsbetween unit trust returns and the marketbenchmark returns.
RESULTS
The Selectivity and Timing Performance of Unit Trusts
This section examines the selectivity and markettiming performance of the 31 unit trusts usingthe Kuala Lumpur Composite Index (KLCI) asa benchmark. The null hypotheses of noselectivity and timing ability are that ex = 0 and~') = 0 respectively. Significant positive ex and ~"
a~e evidence of superior selectivity and markettiming abilities. Measures of selection and timingperformance, ex and ~2 respectively, estimated
Averaget-ratio
Fund's Objective
Balance
Income
Growth
0.00494.27*
a
0.0039(4.14)*
0.0041(1.86)
0.0068(2.32) *
-0.3666-10.56*
-0.4295(-15.00)*
-0.4100(-13.54) *
-0.2402(-2.98)*
PenanikaJ. Soc. Sci. & Hum. Vol. 5 No.1 1997 51

Annual' Md. Nassir, Shamsher Mohamed and Ngu Mee Hua
TABLE 3Pearson's correlation between selectivity
and timing pelformance
none of the groups exhibit posItIve timingparameters. All 3 groups have significant negativetiming measures with balance funds having thepoorest timing ability ([3~ = -0.43) compared tothe income funds ([32 = -0.41) and growth funds([3~ = -0.24).
In summary, the results suggest thatMalaysian fund managers are generally betterstock pickers than market timers. This alsoimplies that there is a trade-off between securityselection and market timing.
C01Teiation between Selectivity and Timing Peljonnanre
Table 3 reports the correlation between selectivityand timing performance based on the TM Model.A strong positive correlation coefficient of 0.53is observed in the entire sample, indicating thatselectivity and timing performance of the trustsare moving in the same directjol1s. Thesefindings are consistent with that of Lee andRahman (1990) though they used a differentmodification of the TM Model to arrive at apositive correlation coetficient of 0.47.
When the funds are grouped on the basis oftheir investment objectives, it appears thatbalance funds have significant negativecorrelation coefficients (r= 0.55), while the othertwo groups have positive correlation coefficients.This result supports Bello's (1995) findings thatthe correlation between selectivity and timingturned positive for the average domestic andinternational funds, and for each investmentobjective group when a modified version of TMModel was being used. Although a number ofprevious research studies documented negativecorrelation between selectivity and timingperformance (Hendriksson 1984; Jagannathanand Kor~cyzk 1986; Bhattacharya and Pfleiderer1983; Coggin et al. 1993; Fletcher 1995), thecause of such correlation still remains anunresolved issue, thus proving an avenue forfurther research in this area.
-0.55*0.810.89*0.53*
Correlationcoefficient(r)
BalanceIncomeGrowthEntire sample
Fund's objective
Table 2 reveals that the number of positiveselectivity measures (25) found significantlyexceeds the negative measures (6). This impliesthat 81 % of the unit trusts are able to beat themarket returns. The highest selectivity measureis the Kuala Lumpur Growth Fund with the a =3.15%, followed by the Malaysia Progress Fund(a = 1.15%), Malaysia Equity Fund and KualaLumpur Savings Fund (a = 0.91 %) and KualaLumpur Index Fund (a = 0.80%). Four of these5 funds are growth funds. Although someselection ability of fund manager is present, it isgenerally weak because most of the values arebelow 1%.
For the entire sample (refer to Table 2(a)),the TM model shows a positive selectivity measureof 0.49%, which is statistically significant at the5% level. This result is consistent with Lee andRahman's (1990) evidence of superior selectionability on the pan of mutual fund managers.
Manager's timing ability is measured by [3~.
There are 30 negative timing parameters (97%),about 10 of which are statistically significant.This suggests that about 10 funds have attemptedto shift their portfolio betas in a way that was notgenerally consistent with the direction of changesin the market portfolio. There is only one fund(Kuala Lumpur Growth Fund) which hassignificant positive timing parameter in the entiresample. When all unit trusts are examinedtogether (refer to Table 2(a)), the timingparameter is found to be negative ([32 = -0.37),indicating a lack of timing ability for fundmanagers. This is consistent with most of theprevious findings (Henriksson 1984: Connor andKorajcyzk 1991; Coggin et ai. 1993; Fletcher1995) .
Further evidence of the selectivity and timingperformance of the trust is reported in Table2(b). The trusts are classified into 3 groupsbased on their investment objectives (growth,balance and income). T statistics are alsopresented to determine the significance of theresults: Column 1 reports on the selectionability of fund managers. It appears that growthfunds generally exhibit better selectivity (a =0.68%) than income funds (a = 0.41 %) andbalance funds (a = 0.39%). These findings implythat the fund managers generally havedemonstrated their selection abilities irrespectiveof the fund's objective.
Market timing abilities are reponed incolumn 2. The empirical evidence reveals that
52 PenanikaJ. Soc. Sci. & Hum. Vol. 5 No. I 1997

Selectidty and Timing: Evidence from the Malaysian Unit Trusts Performance
TABLE 4Extent of diversification'" of unit trusts in Malaysia
Unit UnitTrust ~ Rank Trust R" Rank
8th Bumi 0.57 1 M, Progress 0.41 176th Bumi 0.54 2 AS] 0.38 187th Acc. 0.53 3 1st Bumi 0.38 194th Bumi 0.52 4 M. Commer 0.37 202nd Bumi 0.51 5 11 th Bumi 0.34 21M. berjaya 0.51 6 M. secutiry 0.31 22Warrior 0.49 7 BBMB Trust 0.25 237th inc. 0.48 8 10th Bumi 0.24 24M. invest. 0.47 9 BBMB Prime 0.23 25BHLB 0.47 10 5th Bumi 0.23 26ASN 0.45 11 3rd Bumi 0.21 279th Bumi 0.4:') 12 KL Index 0.15 28KL Savino- 0.42 13 MIC 0.13 29C>
M. Equitu 0.41 14 TBJK 0.06 30A.rab 1st 0.41 15 KL growth 0.01 31MBF 1st 0.41 16
'" The average R2 = 0.37. The R2 for perfect diversification = 1.00.
of R~ is 0.37, which implies that the unit trustshave about 37% diversification. Of the 31 fundsin the sample, 20 (65%) have achieved theaverage diversification with the R~ values above0.37. However, there are 2 least diversified funds(T~JK and KL Growth) in the sample with theR2 values below 10%.
We can conclude that the degree ofdiversification of unit trusts appears to be low inMalaysia. This may be due to the stringent trustprovisions that discourage fund managersch()osing more risky stocks to include in thenfunds or the management's strategy to sacrificediversification to earn a higher return. Theinvestment constraints imposed by the SecuritiesCommission (SC) on unit trusts include thefollowing:
Diversification oj the Unit Trusts
Spreading risk and capitalizing on future growthpotential have become the cornerstone of theprudent investor's strategy following the October1987 stock market crash. That is why manysmall investors are increasingly turning to unittrusts. By pooling the financial resources, thesmall investors can gain access to the servicesand expertise of top money and fund managers.They can also benefit from the fund's ability toinvest in different security markets anddiversification in investment portfolio in eachmarket othelwise available only to institutionsand wealthy individuals. The degree ofdiversification of a unit trust is measured by theR" statistic which ranges in value from 0 to 1.The R~ statistic can be estimated by the extent towhich the unit trust returns covary with themarket. The R~ statistics of the total sample andsub-sample are summarized in Tables 4 and4(a), respectively.
Table 4 exhibits that the R~ statistic of the31 unit trusts range between 0.01 to 0.57. Theresult shows that 81 % of the unit trusts are notwell-diversified, with the R~ values below the 0.5cut-off points. Only 6 funds in the sample (19%)have achieved the expected level of diversificationwith the R" values above 0.5; 5 of these 6 fundsare Mara Bumiputera Funds. The average value
•
•
•
•
The maximum size of a unit trust fund shallnot be more than 500 million units.A unit trust fund is only permitted to investup to 10% in the securities listed on aforeign stock exchange, and prior approvalof the SC must be obtained beforeundertaking such investments.A unit trust fund shall not invest more than50% of the fund in non-trustee securities.Investment in the securities of any companyshall not exceed
PertanikaJ. Soc. Sci. & Hum. Vol. 5 No.1 1997 53

Annuar Mel. Nassir, Shamsher ~1ohamed and ;\Igu i\kl' Ilua
TABLE 4(a)Di"ersification measure of unit trllsts with different
investment objectives
(i) 10% of the net asset value of the fund;or
(ii) 10% of the issued capital of thecompany, whichever is lower.
Table 4(a) shows that the income funds arerelatively more diversified (0.46) than balancefunds (0.38) and growth funds (0.31). Althoughthe income trusts are marginally better than
• Investment in any group of companies shallnot exceed 15% of the net asset \'alue of thefund.
• At least 10% of the net asset value of thefund should be maintained in the form ofliquid assets at all times.
• The trust fund is not allowed to guaranteeor grant any loans or engage in any shortselling of securities.
Markel Risk of Unil Trusts
An important characteristic of the unit trusts istheir market risk or ~ which measures the amountof non-diversifiable marketwide risk. Tables 5and 5 (a) summarize these beta values for the 31unit trusts.
Table 5 shows that all 31 unit trusts in thesample possess low market risk with beta valuessubstantially below 1.00. This makes intuitivesense given partial diversification benefi ts, asexplained by modern portfolio theory. Theaverage market risk is 0.39, which makes theunit trust inveSllllents relatively safer than inmarkets where 1hl' beta is close to 1.00. The KLGrowth Fund appears to have the lowest risk (~
= -0.26) fund i11 the sample. Strictly speaking,negative beta does not offer any intuitiveinterpretation of rule. The other funds have arisk of 0.23-0.53.
other categories, none have achieved theexpected level of diversification (R2 greater than0.5). These findings imply that Malaysian unittrusts have very little diversification relative tothose reported in more developed markets(Ippolito 1989) where the average degree ofdiversification is as high as 0.70. Therefore,there is room for further diversification andfund recomposition.
0.460.380.31
IncomeBalanceGrowth
Fund's objective
TABLE .5
Measure of market risk* in unit trusts
nit UnitTrusts ~, Rank Trusts ~, Rallk
KL-growth -0.26 1 9th 0.43 17Mle 0.23 2 MBF-1st 0.43 IKM. commer 0.25 3 7th inc. 0.44 19KL-index 0.25 4 M. progress 0.44 20M.security 0.33 5 BHLB 0.44 21
TBJK 0.34 6 3rds 0.45 225th 0.37 7 4th 0.45 236th 0.38 8 KL=saving 0.46 247th acc. 0.39 10 ASJ 0.47 26ASN 0.39 11 8th 0.48 272nd 0.40 12 M. berjaya 0.50 28Warrior 0.42 13 10th 0.51 29M. invest 0.42 14 Arab 1st 0.52 30BB-prime 0.42 15 11th 0.53 311st 0.43 16
,~ The average ~, = 0.39. The ~l for the market is 1.00
54 Penanikaj. Soc. Sci. &: Hum. Vol. 5 NO.1 1997
Selectivity and Timing: Evidence from the Malaysian Unit Trusts Performance
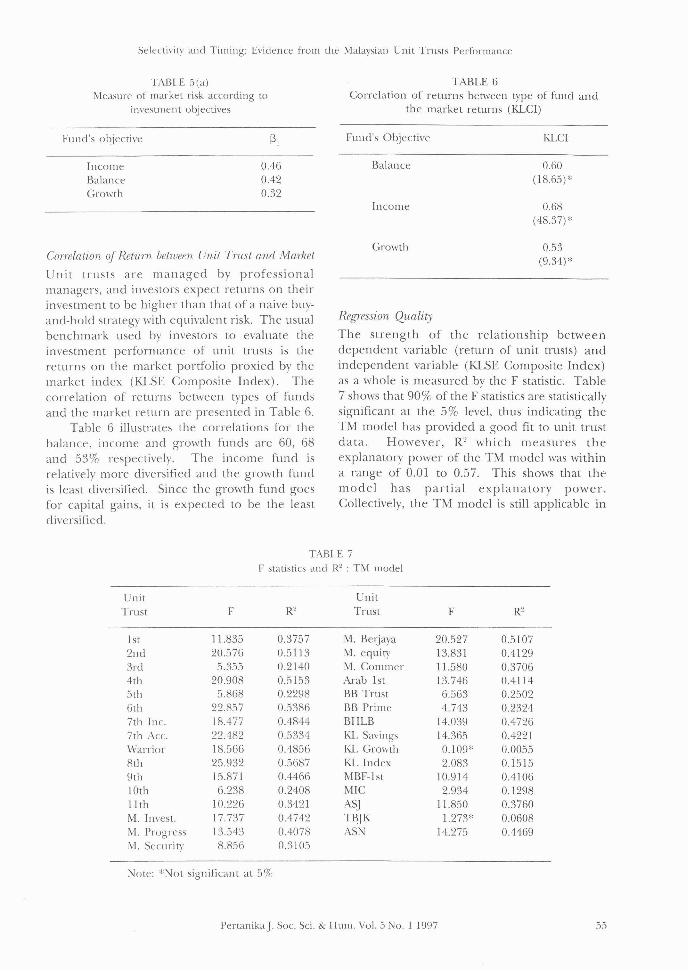
TABLE 5(a)Measure of market risk according to
investment objectives
TABLE 6Correlation of returns between type of fund and
the market returns (KLCI)
(3,Fund's objective Fund's Objective KLC!
IncomeBalanceGrowth
0.460.420.32
Balance
Income
0.60(18.65)*
0.68(48.37)*
Regression Quality
The strength of the relationship betweendependent variable (return of unit trusts) andindependent variable (KLSE Composite Index)as a whole is measured by the F statistic. Table7 shows that 90% of the F statistics are statisticallysignificant at the 5% level, thus indicating theTM model has provided a good fit to unit trustdata. However, R2 which measures theexplanatory power of the TM model was withina range of 0.01 to 0.57. This shows that themodel has partial explanatory power.Collectively, the TM model is still applicable in
Correlation oj Retum between Unit Tiust and Market
Unit trusts are managed by professionalmanagers, and investors expect returns on theirinvestment to be higher than that of a naive buyand-hold strategy with equivalent risk. The usualbenchmark used by investors to evaluate theinvestment performance of unit trusts is thereturns on the market portfolio proxied by themarket index (KLSE Composite Index). Thecorrelation of returns between types of fundsand the market return are presented in Table 6.
Table 6 illustrates the correlations for thebalance, income and growth funds are 60, 68and 53% respectively. The income fund isrelatively more diversified and the growth fundis least diversified. Since the growth fund goesfor capital gains, it is expected to be the leastdiversified.
Growth 0.53(9.34)*
TABLE 7F statistics and R2 : TM model
Unit UnitTrust F R2 Trust F R2
1st 11.835 0.3757 M. Beljaya 20.527 0.51072nd 20.576 0.51l3 M. equity 13.831 0.41293rd 5.355 0.2140 M. Cammer 11.580 0.37064th 20.908 0.5153 Arab 1st 13.746 0.41l45th 5.868 0.2298 BB Trust 6.563 0.25026th 22.857 0.5386 BB Prime 4.743 0.23247th Inc. 18.477 0.4844 BHLB 14.039 0.47267th Acc. 22.482 0.5334 K1. Savings 14.365 0.4221Warrior 18.566 0.4856 K1. Growth 0.109* 0.00558th 25.932 0.5687 KL Index 2.083 0.15159th 15.871 0.4466 MBF-l st 10.914 0.410610th 6.238 0.2408 MIC 2.934 0.129811th 10.226 0.3421 ASJ 11.850 0.3760M. Invest. 17.737 0.4742 TBJK 1.273* 0.0608M. Progress 13.543 0.4078 ASN 14.275 0.4469M. Security 8.856 0.3105
Note: *Not significant at 5%
Penanikaj. Soc. Sci. & Hum. Vol. 5 No.1 1997 55
Annuar .\1d. Nassir, Shamsher Mohamed and ~gll Mee Hua
evaluating the selectivity and timing performanceof fund managers in Malaysia although theexplanatory power is poor.
CONCLUSION
This paper applies the TM model to examineselectivity and timing performance of 31 unittrusts [or a period of 62 mon ths Uuly 1990August 1995). The selectivity performance ofthe trusts is on average positive, but the timingperformancc is on average negative. Only onefund possesses a superior timing ability, i.e. KualaLumpur Growth Fund, while the other 30 fundsshow inferior tillling ability, implying that mostunit trusts do not possess market timing ability.However, somc appear to exhibit superiorselection ability as 81 % of the sample of unittrusts are able to outperform the market returnsand the Kuala Lumpur Growth Fund rankedhighest in term of selectivity measure. The studyalso found a positivc correlation betweenselectivity and timing performance which isconsisten t wi th previous studies of un it trustperformance (Lee and Rahman 1990; Bello
1995) .The degree of diversification of unit trusts
and risk-return characteristics associated withthe unit trusts were also examined. The findingsindicate that the degree of diversification of theMalaysian unit trusts are generally belowexpectations and risk-return characteristics ofthe trusts are inconsistent with their statedobjectives. The lackadaisical performance ofthese unit trusts could be partially attributableto the regulatory constraints imposed by theSecurity Commission, strict advertising code forthe unit trust industry and lack of fund managers'expertise. However, with Malaysian's salienteconomic performance, unit trusts prlJvide anextra investment vehicle for investors at largeand promise a bright future.
REFERENCES
BEL.LO, Z.Y. 1995. An em pirica! study of thecorrelation between mutual funds' selectivityand timing performance. In Mrl1lagl'lial Financeill the COIpomte F.mnomy, eel. Philip K. Ghosh &Shah rial' Khaksari, p. 71-94. London: Routledg.
BII.\TLlCH,\R';\, 5., and P. PFL.EIDERER. 1983 A note onperformance cVi\luation, Technical Report 714,Stanford University.
OIE:\, CARL. R., OIE:\(; F. LEE, SIlAFIQCR RAm'!.....:\ andA:-:THO:--'Y 01.....:\. 1992. A cross-sectional analysisof mutual [und's market timing and securityselection skill. Jouma.l oj Business Finance &'Accounting, 19(5): 659-674.
CII.·\"IG, ERIC C. and WILI\LR LEWEL.I.E"I. 1984. Markettiming and mutual fund investmentperformance. Joul71al oj Business 57(1): 57-72.
COCCI:-i, T.O., andJ.E. HC"ITER. 1993. A meta-analysisof mutual fund performance. Review ojQuantitativI' Finance and Acrounting 3: 189-20 I.
COCCI:", T.O., FJ FABOzzl and S. R.\H~H:\. 1993. Theinvestment pelformance of U.S. equity pensionfund managers: An empirical im'estigation,.lOUT/wi of Finance 3: 1039-1055.
CO"l:\OR, G., and R. KORAjcZYK. 1991. The attributes,behaviour and performance of .5. mutualfunds. ReviPlv of QuantitativI' Finance andAcrau nting 1: 5-26.
CLMBY, ROBERT E. and JACK O. GLEN. 1990. Evaluatingthe perlormance of in ternational mutual funds..loumal of Finance 45(2): 497-521.
FA\IA, E. F. 1972. Components of investmentportfolio. Journal of Finance 27:551-567.
FIRTH, M.A. 1977. The investment performance ofun it trusts in the period 1965-76. .Journal ofMoney, Credit and Banking 9.
FLETCHER, J 1995. An examination of the selectivityand market timing pelformance of UK unittrusts. .Journal of Business Finance &' Ac(Ountillg22(1): 143-156.
GRI"IBIXn, \'1.. and S. TInIA:\". 1989a. Mutual fundperformance: An analysis of quarterly portfolioholdings. .Jou.mal oj Business 5: 393-416.
GRI:\I\LATT, M., and S. TITMA:\, 1989b. Portfolioped'ormance evaluation: Old issues and newinsights. P..eview oJ Financial Studies 5(2): 393421
HE?\DRIKSS(J:\, Roy O. 1984. Market timing andmutual fund performance: an empiricalinvestigation. Journal vJ Business 57(1): 73-96.
HE:\DRIKSSO:\, Roy O. and R.C. MERIT):\. 1981. Onthe market timing and investment performance: Statistical procedures for evaluatingforecasting skills. .Journal oJ Businpss 54: 513533.
HC:\TER, JE., T.O. CO(;CI:\, and S. ~\II\IA:\. 1992.The correlation between sampling errors in
56 PertanikaJ. Soc. Sci. & HUIll. Vol. 5 :'-10. I 1997

Selectivity and Timing: Evidence from the Malaysian Unit Trusts Performance
the estimation of security selection and markettiming skill. Working paper, Michigan StateUniversity, East Lansing.
IpPOLITO, R.A. 1989. Efficiency with costlyinformation: A study of mutual fundperformance 1965-84. Quarterly Journal ofEconomics (February): 1-23.
J-\CA!';)\ATHA;\, ~WI and ROBERT A. KORAICZ\K 1986.Assessing the market timing performance ofmanaged portfolio. Joumal of Business 59(2):217-235.
jE:-ISE:'-:, M.e. 1968. The performance of mutualfunds in the period 1945-1964. Joumal ofFinance23(2): 389-416.
jE:-JSE:\, M.e. 1972. Optimal utilisation of marketforecasts and the evaluation of investmentperformance. In Mathematical Methods inInvestment and Finance, eds. G.P. Szego and K.Shell, Amsterdam: Elsevier.
KON, SJ. 1983. The market timing performance ofmutual fund managers. Journal o/Business 56(3):321-47.
Ko)\, SJ. and F.e. JEN. 1979. The investmentperformance of mutual funds: An empiricalinvestigation of timing, selectivity and marketefficiency. Journal of Business 52: 263-289.
LEE, CHENG F. and SHAFIQUR R\Hrvl."''\l. 1990. Mal-kettiming, selectivity, and amutual fundperformance: An empirical examination.Journal of Business 63: 261-278.
LEHMA:-JN, BRUCE N. and DAVID M. MODEST. 1987.Mutual fund performance evaluation: Acomparison of benchmarks and benchmarkcomparisons. Journal of Finance 42(2): 233-265.
SHARPE, W.F. 1966. Mutual fund performance.Journal of Business 39(1): 119-138.
TREY:-JOR, J.L. and F. BLACK. 1973. How to use securityanalysis to improve portfolio selection. Journalof Business 46: 66-86.
TREYNOR, J.L. and Kw K. MAZUY. 1966. Can mutualfunds outguess the market? Hamanl BusinessReview 44: 131-6.
Received 24 April 1996)
PertanikaJ. Soc. Sci. & Hum. Vol. 5 No. I ]997 57