A retrospective investigation of selectivity for Pacific halibut CAPAM Selectivity workshop
41
A retrospective investigation of selectivity for Pacific halibut CAPAM Selectivity workshop 14 March, 2013 Ian Stewart & Steve Martell
description
A retrospective investigation of selectivity for Pacific halibut CAPAM Selectivity workshop 14 March, 2013 Ian Stewart & Steve Martell. Overview. 1) H istory 2) C ontributing factors 3 ) 2012 Assessment investigation 4 ) Path forward. Assessment model evolution. - PowerPoint PPT Presentation
Transcript of A retrospective investigation of selectivity for Pacific halibut CAPAM Selectivity workshop
A retrospective investigation of selectivity for Pacific halibut
CAPAM Selectivity workshop14 March, 2013
Ian Stewart & Steve Martell

Overview1) History2) Contributing factors3) 2012 Assessment investigation4) Path forward
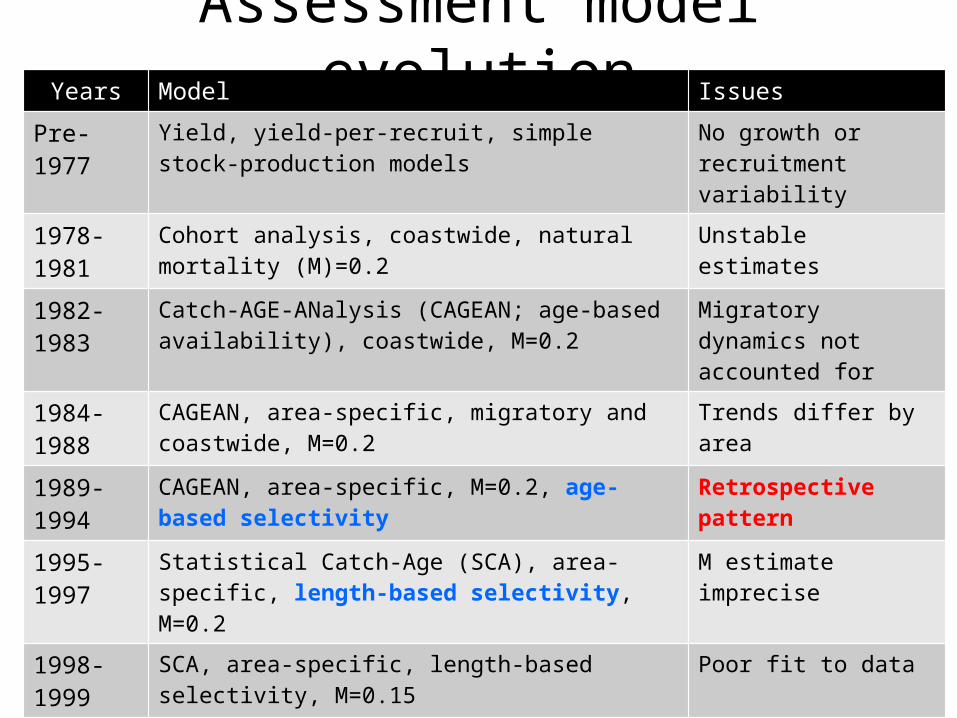
Years Model Issues
Pre-1977 Yield, yield-per-recruit, simple stock-production models No growth or recruitment variability
1978-1981 Cohort analysis, coastwide, natural mortality (M)=0.2 Unstable estimates
1982-1983 Catch-AGE-ANalysis (CAGEAN; age-based availability), coastwide, M=0.2
Migratory dynamics not accounted for
1984-1988 CAGEAN, area-specific, migratory and coastwide, M=0.2 Trends differ by area
1989-1994 CAGEAN, area-specific, M=0.2, age-based selectivity Retrospective pattern
1995-1997 Statistical Catch-Age (SCA), area-specific, length-based selectivity, M=0.2
M estimate imprecise
1998-1999 SCA, area-specific, length-based selectivity, M=0.15 Poor fit to data
2000-2002 New SCA, area-specific, constant age-based selectivity, M=0.15
Retrospective pattern
2003-2006 SCA, area-specific, constant length-based selectivity, M=0.15
Migratory dynamics created bias
2006-2011 SCA, coastwide, constant length-based selectivity, M=0.15
Retrospective pattern
Assessment model evolution
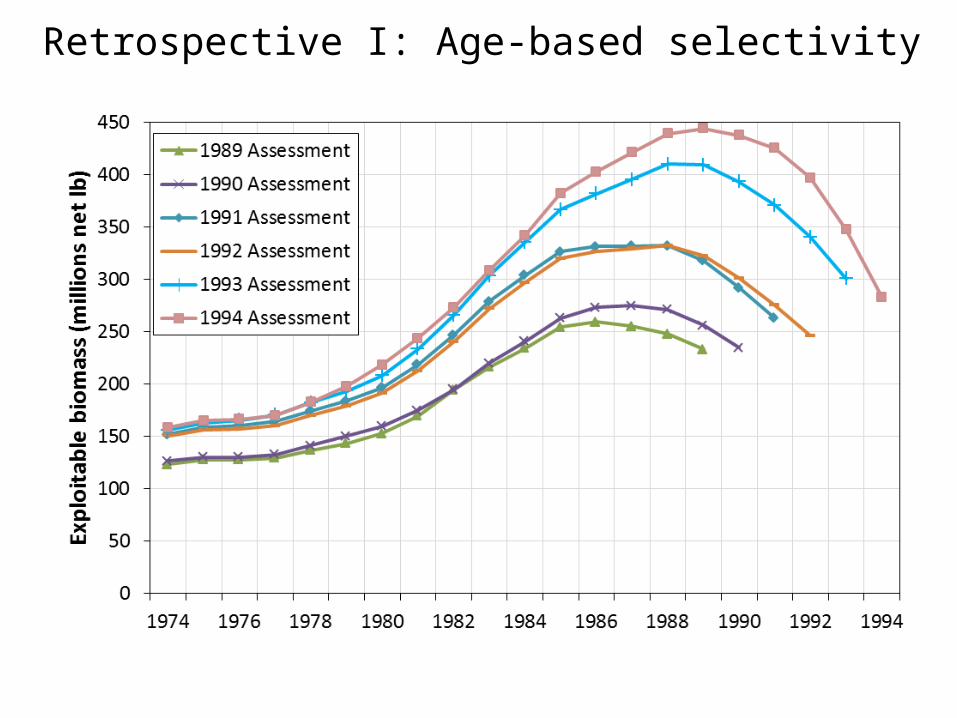
Retrospective I: Age-based selectivity
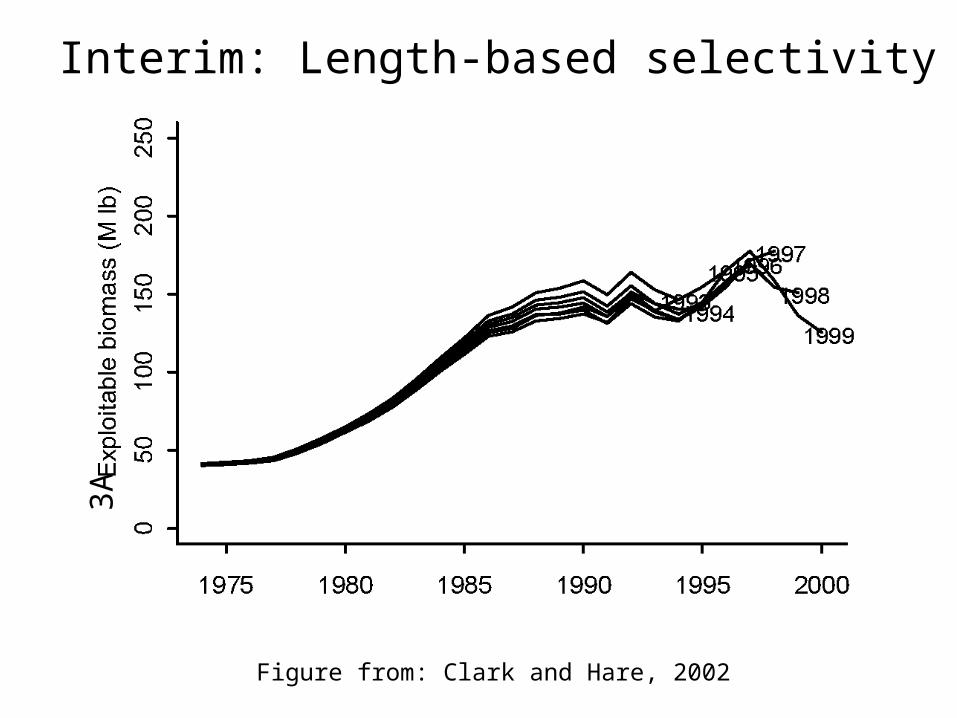
Interim: Length-based selectivity
Figure from: Clark and Hare, 2002
3A
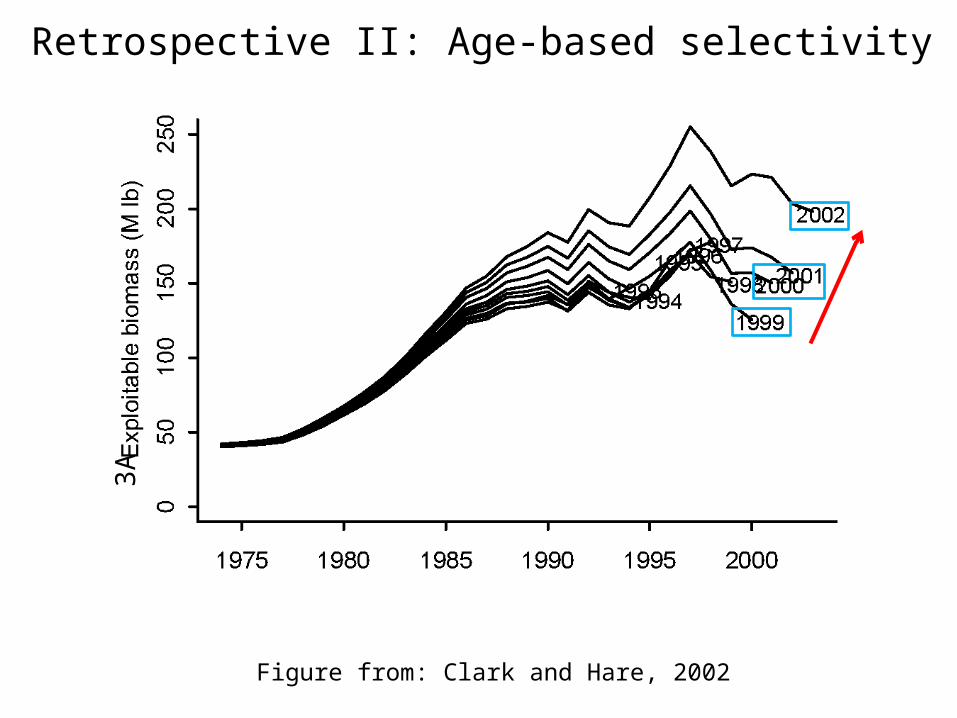
Retrospective II: Age-based selectivity
Figure from: Clark and Hare, 2002
3A
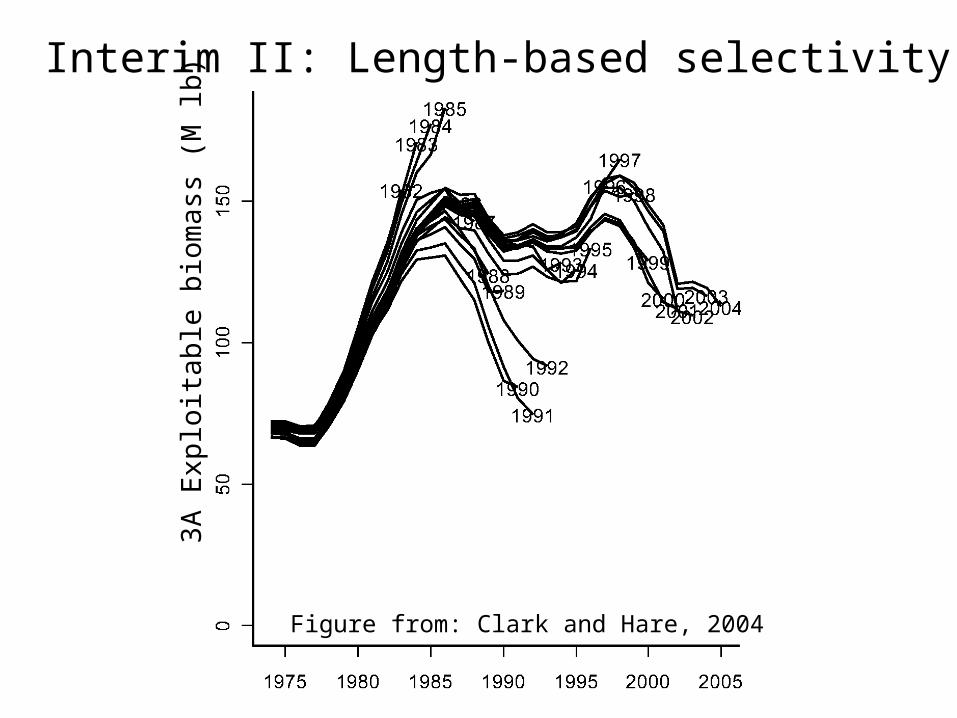
Interim II: Length-based selectivity
3A E
xplo
itabl
e bi
omas
s (M
lb)
Figure from: Clark and Hare, 2004
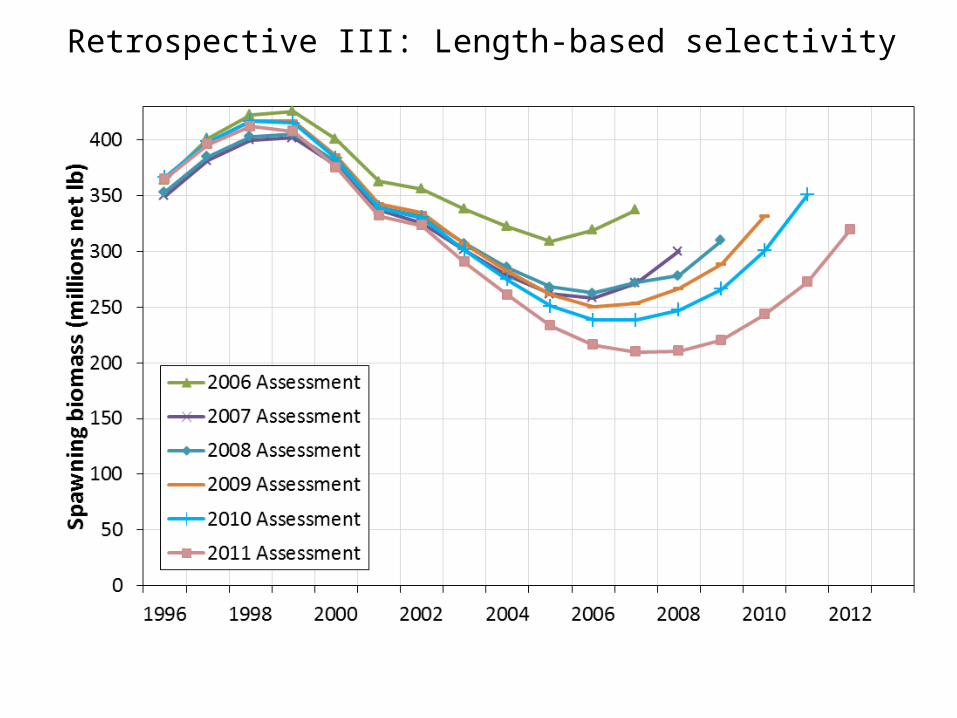
Retrospective III: Length-based selectivity

Overview1) History2) Contributing factors3) 2012 Assessment investigation4) Path forward
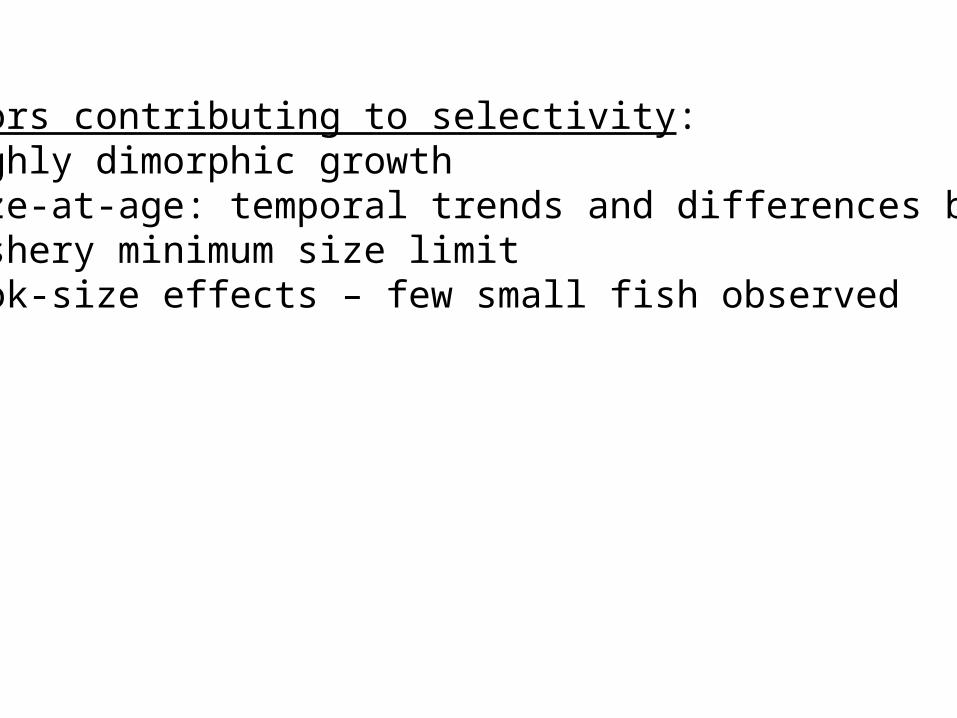
Factors contributing to selectivity:- Highly dimorphic growth- Size-at-age: temporal trends and differences by area- Fishery minimum size limit- Hook-size effects – few small fish observed
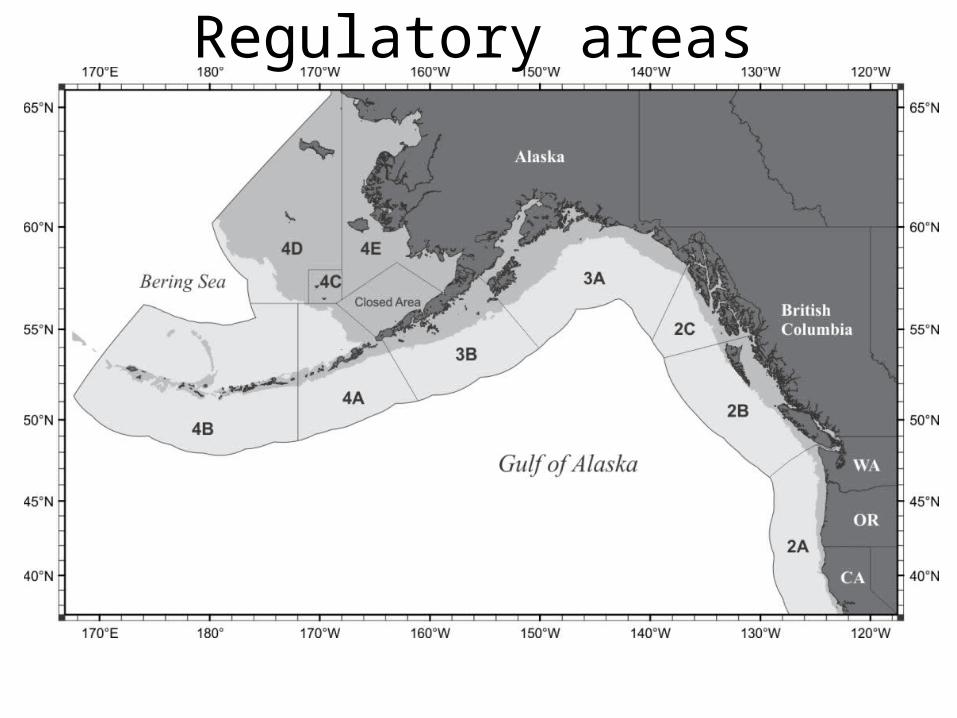
Regulatory areas
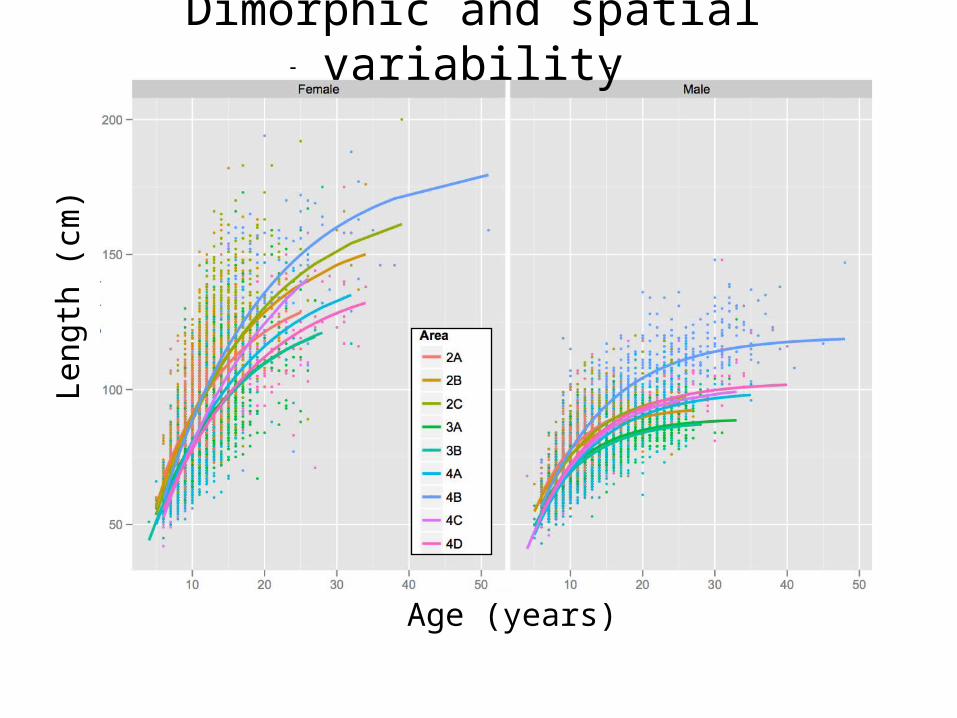
Growth curves by area
Age (years)
Leng
th (c
m)
Dimorphic and spatial variability
05
10
15
1920 1960 2000
Age 6 05
10
15
1920 1960 2000
Age 7 05
10
15
20
25
30
1920 1960 2000
Age 8 010
20
30
40
1920 1960 2000
Age 9 010
20
30
40
50
1920 1960 2000
Age 10
010
30
50
70
1920 1960 2000
Age 11 020
40
60
80
1920 1960 2000
Age 12 020
40
60
80
100
1920 1960 2000
Age 13 020
40
60
80
100
1920 1960 2000
Age 14 020
40
60
80
100
1920 1960 2000
Age 15
020
40
60
80
120
1920 1960 2000
Age 16 050
100
150
1920 1960 2000
Age 17 050
100
150
1920 1960 2000
Age 18 050
100
150
1920 1960 2000
Age 19 050
100
150
1920 1960 2000
Age 20
Weig
ht
(net
lbs)
Year (1926 to 2011)
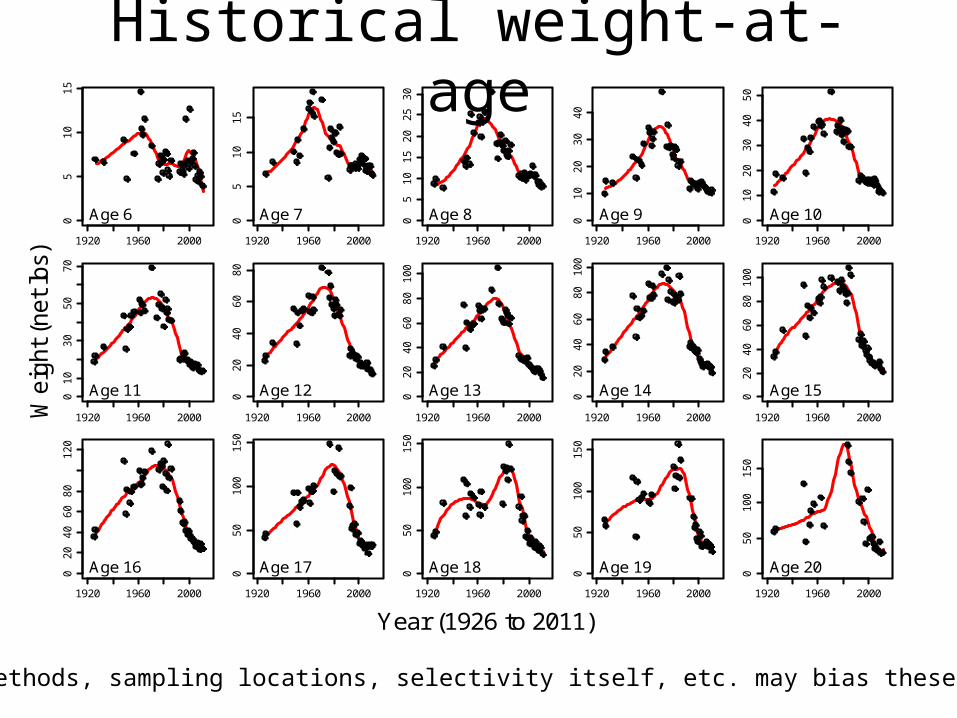
Historical weight-at-age
(Ageing methods, sampling locations, selectivity itself, etc. may bias these trends)
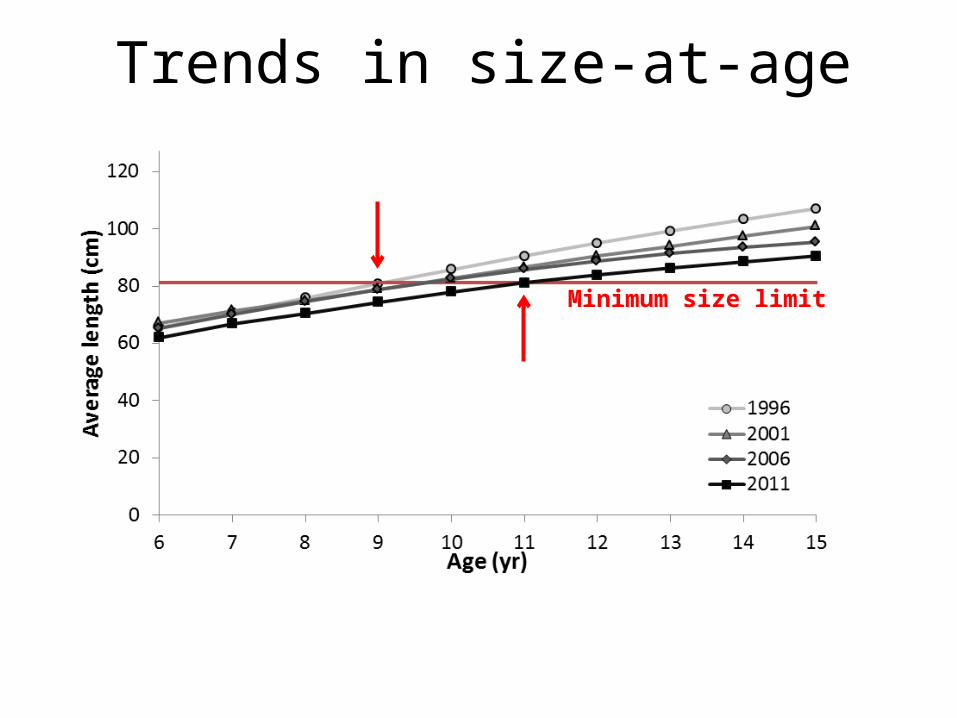
Trends in size-at-age
Minimum size limit
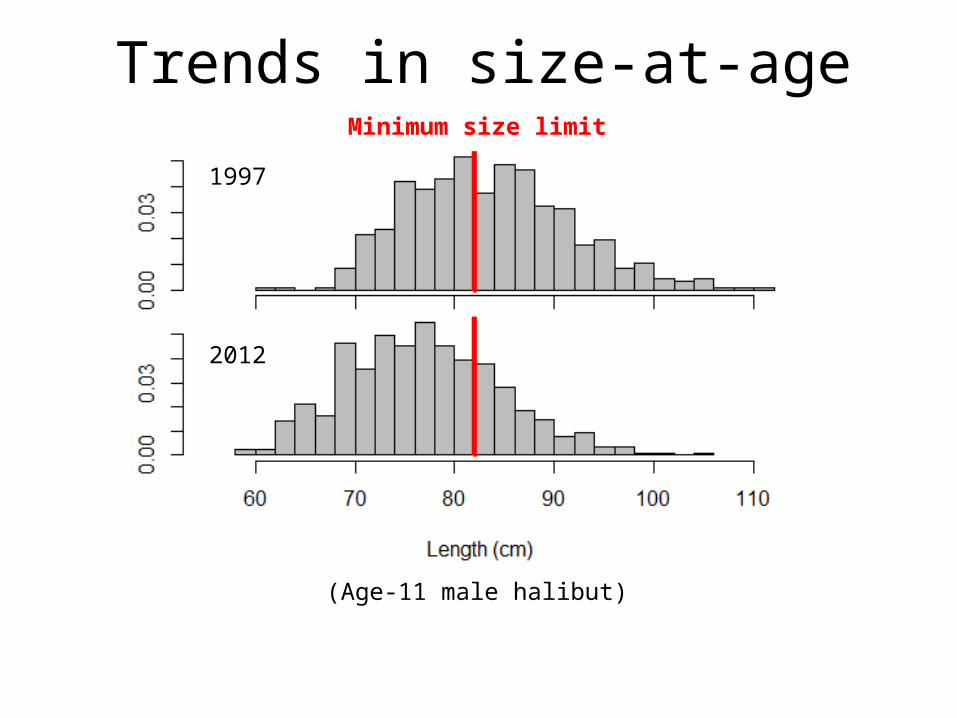
Trends in size-at-age
1997
2012
(Age-11 male halibut)
Minimum size limit

Directly observed gear selectivity (vulnerability)
Based on Didson acoustic camera observations (S. Kaimmer; In prep)
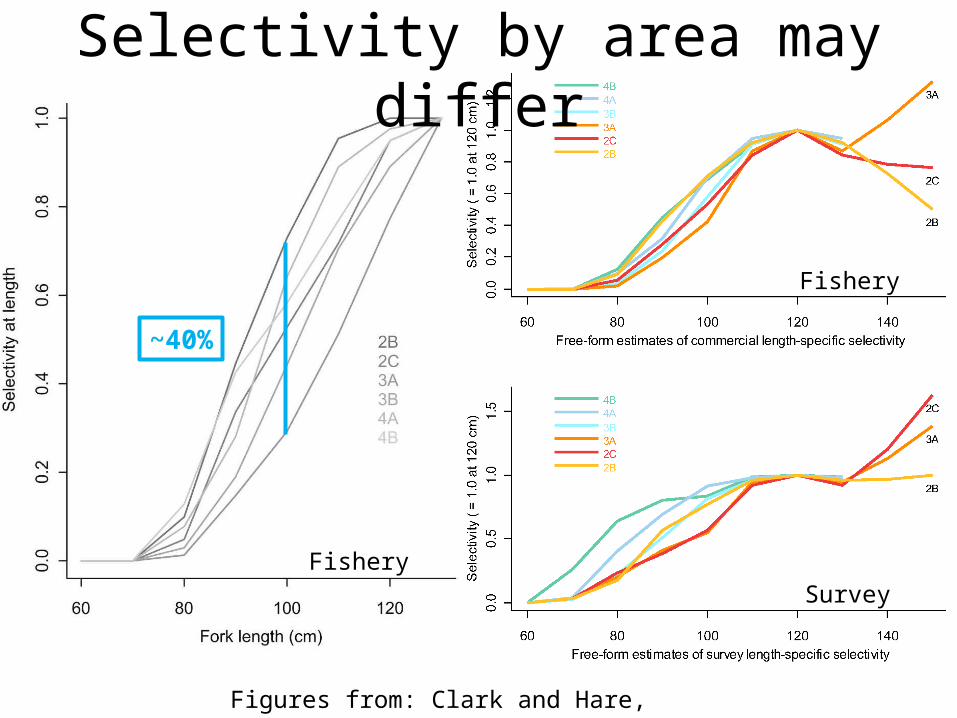
Figures from: Clark and Hare, 2003 & 2004
Selectivity by area may differ
~40%
Fishery
SurveyFishery
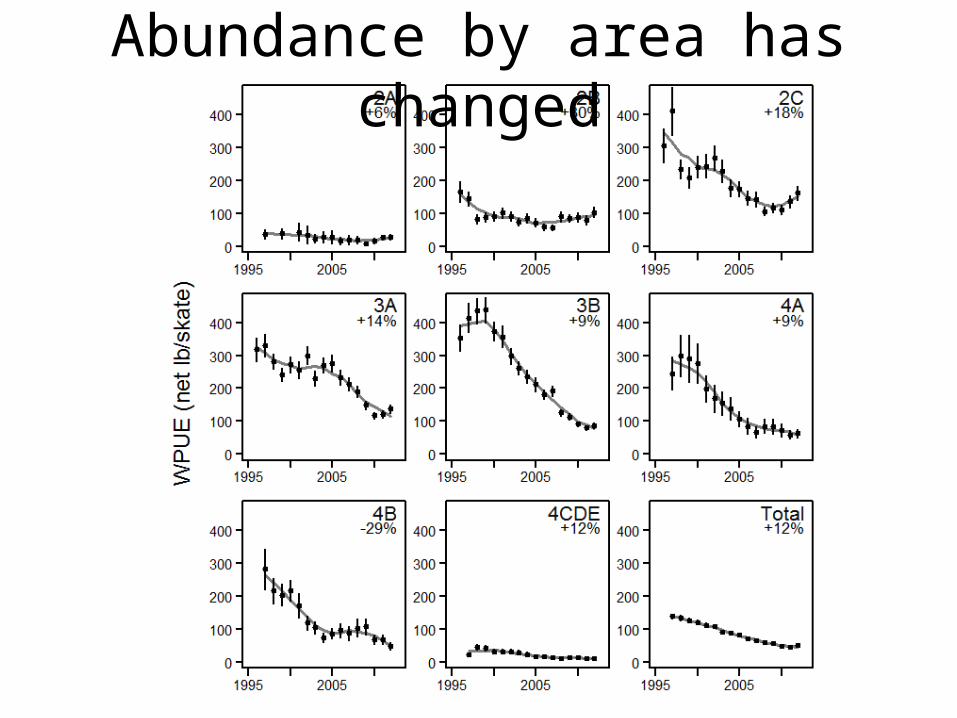
Abundance by area has changed
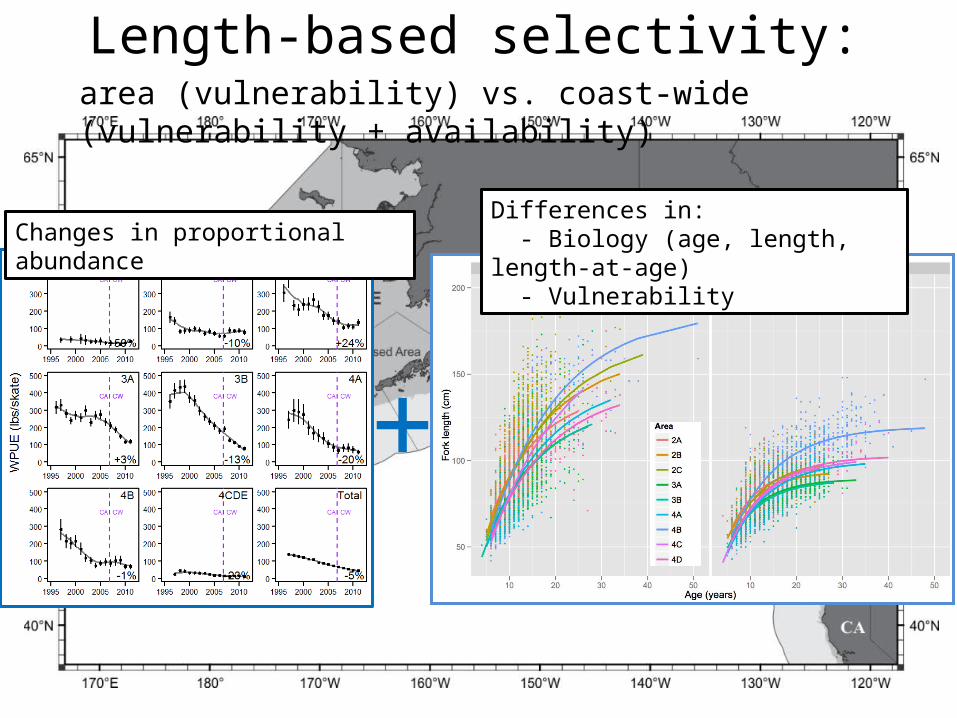
Length-based selectivity: area (vulnerability) vs. coast-wide (vulnerability + availability)
Changes in proportional abundance
+
Differences in: - Biology (age, length, length-at-age) - Vulnerability
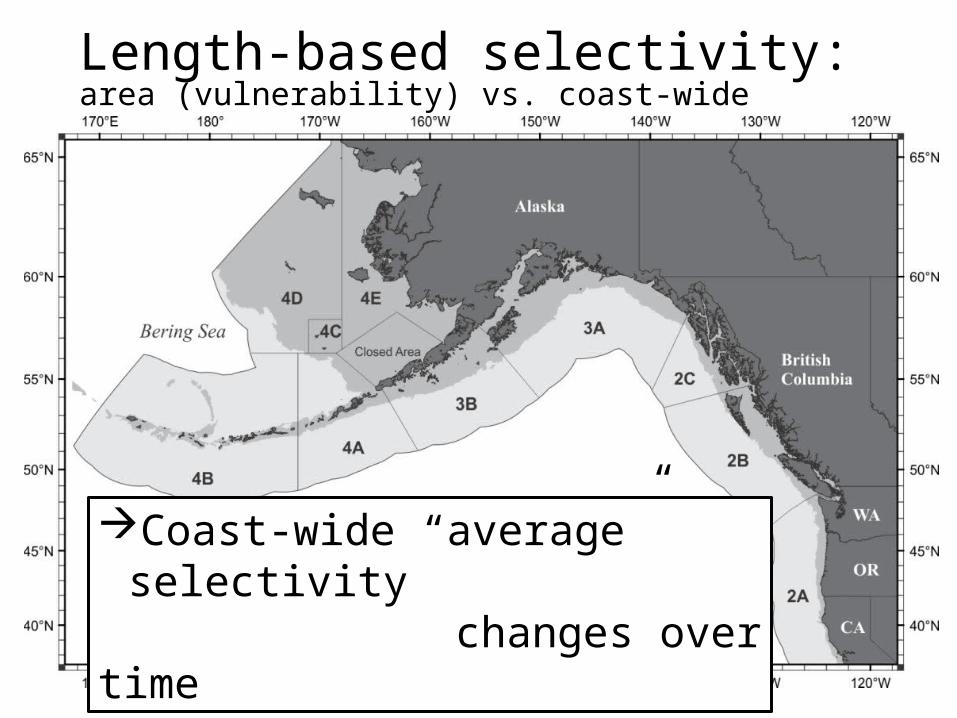
Length-based selectivity: area (vulnerability) vs. coast-wide (vulnerability + availability)
Coast-wide “average” selectivity changes over time
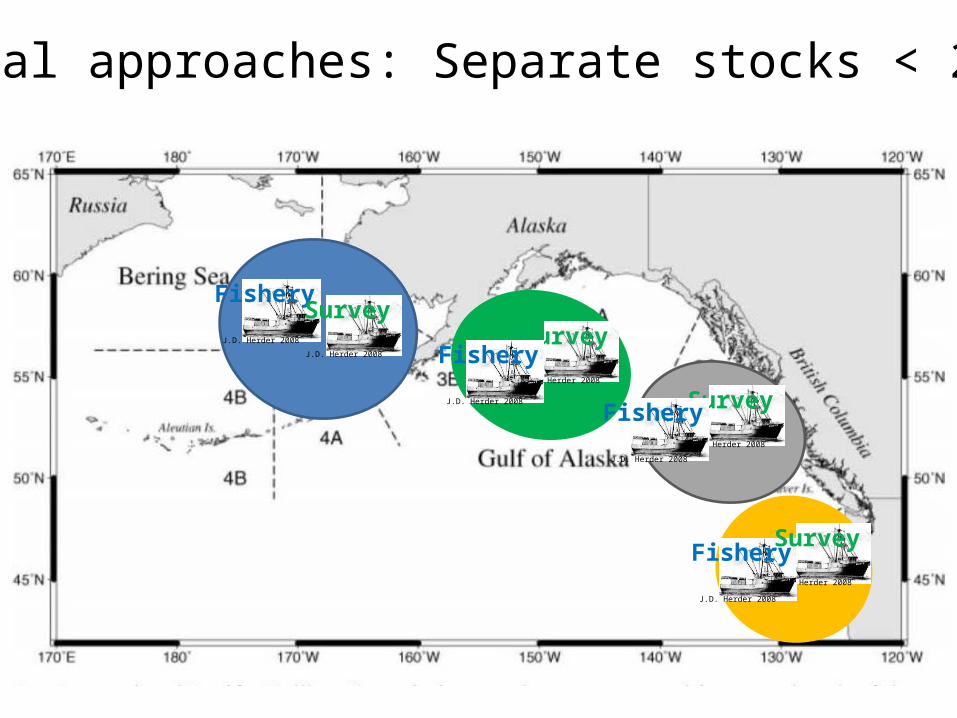
Spatial approaches: Separate stocks < 2006
J.D. Herder 2008
Fishery
J.D. Herder 2008
Survey
J.D. Herder 2008
Survey
J.D. Herder 2008
Fishery
J.D. Herder 2008
FisheryJ.D. Herder 2008
Survey
J.D. Herder 2008
Survey
J.D. Herder 2008
Fishery
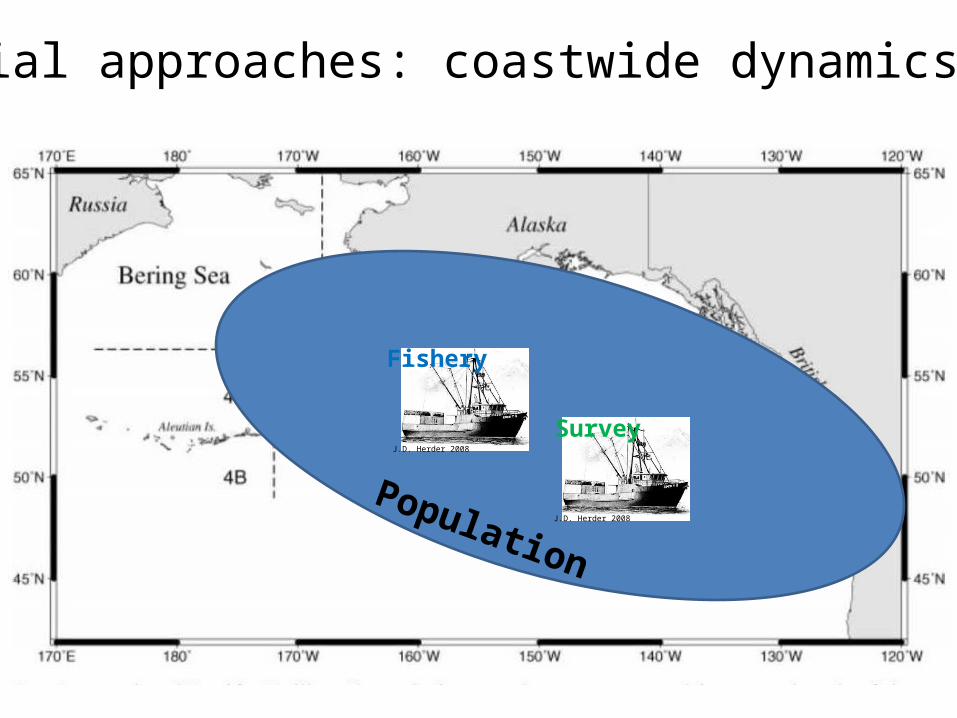
Spatial approaches: coastwide dynamics 2006+
J.D. Herder 2008
Fishery
J.D. Herder 2008
Survey
Population

Overview1) History2) Contributing factors3) 2012 Assessment investigation4) Path forward
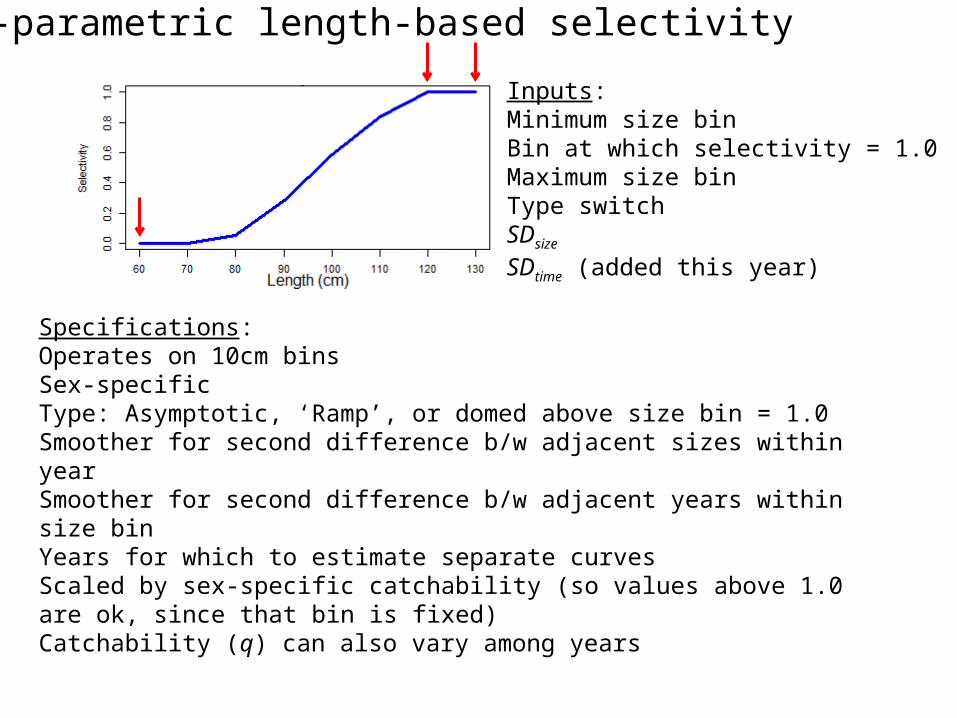
Non-parametric length-based selectivity
Inputs:Minimum size binBin at which selectivity = 1.0Maximum size binType switchSDsize
SDtime (added this year)
Specifications:Operates on 10cm binsSex-specificType: Asymptotic, ‘Ramp’, or domed above size bin = 1.0Smoother for second difference b/w adjacent sizes within yearSmoother for second difference b/w adjacent years within size binYears for which to estimate separate curvesScaled by sex-specific catchability (so values above 1.0 are ok, since that bin is fixed)Catchability (q) can also vary among years
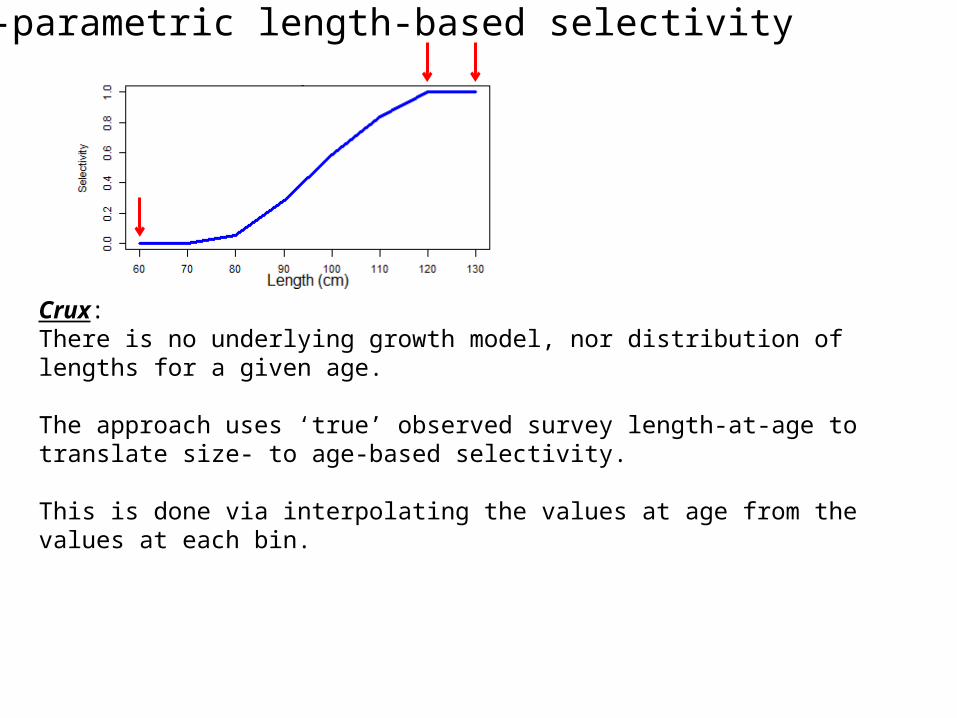
Crux: There is no underlying growth model, nor distribution of lengths for a given age.
The approach uses ‘true’ observed survey length-at-age to translate size- to age-based selectivity.
This is done via interpolating the values at age from the values at each bin.
Non-parametric length-based selectivity
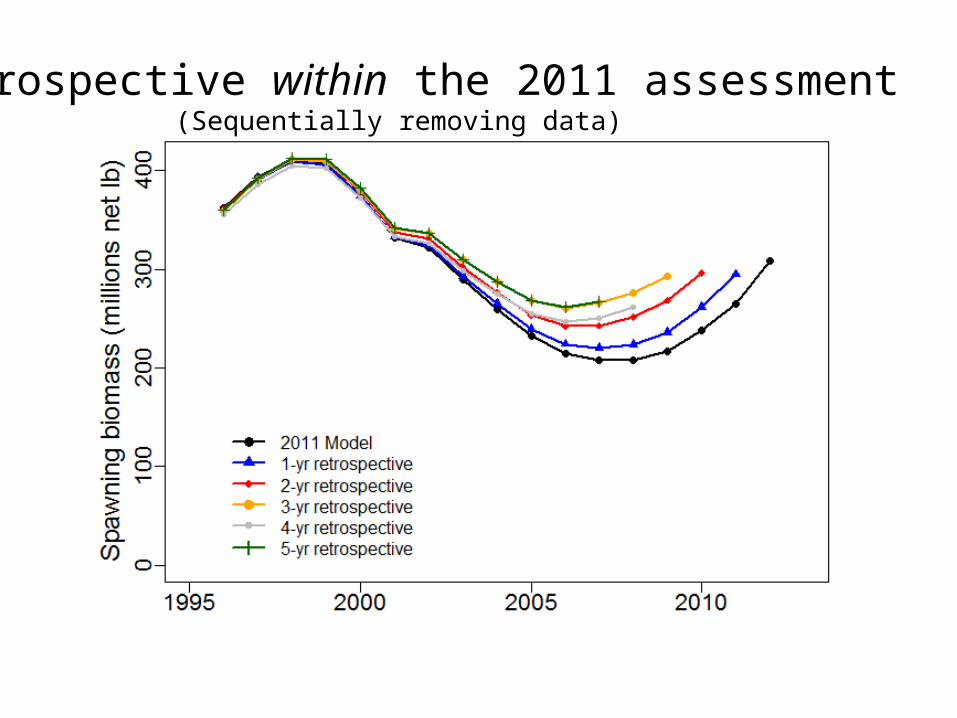
Retrospective within the 2011 assessment(Sequentially removing data)
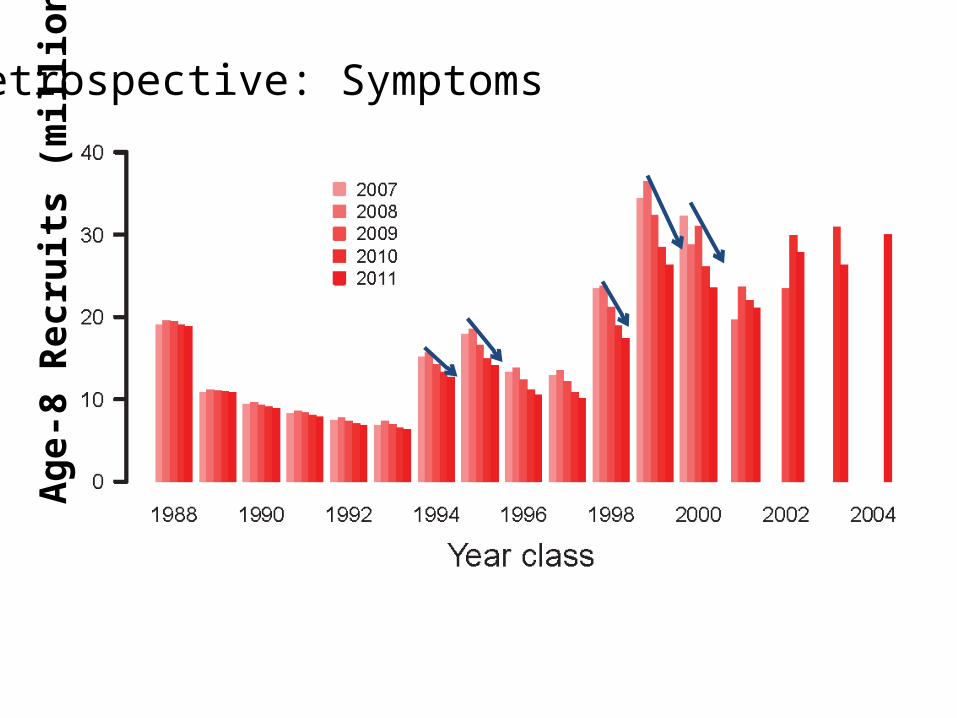
Retrospective: SymptomsAg
e-8
Recr
uits
(mill
ions
)
0
50
100
150
200
250
300
350
400
450
1995 1997 1999 2001 2003 2005 2007 2009 2011 2013
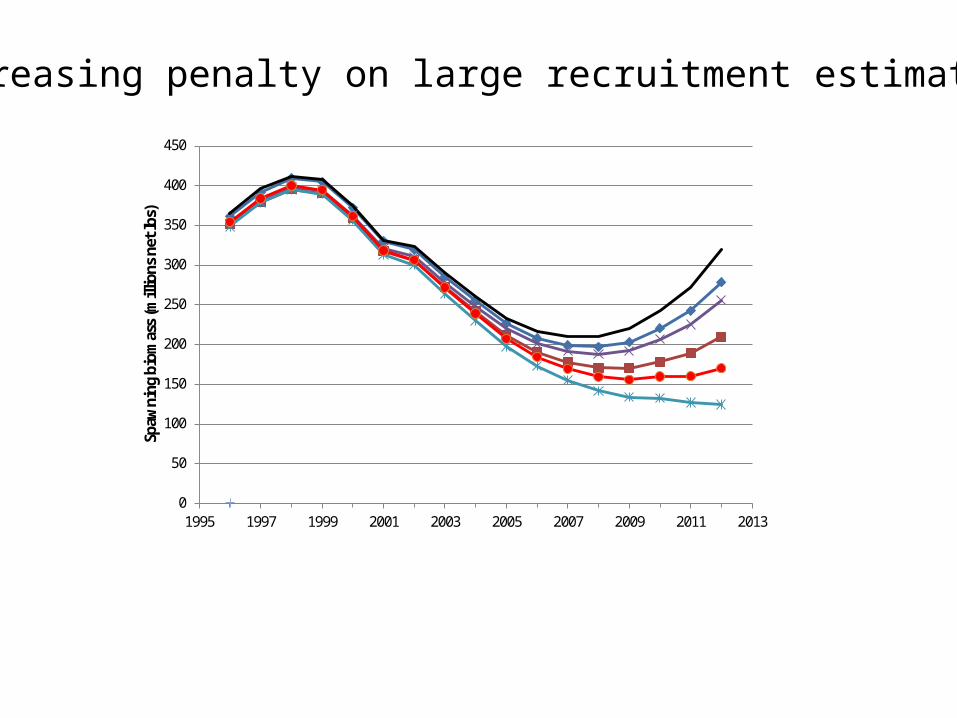
Spaw
ning
bio
mas
s (m
illio
ns n
et lb
s)
Increasing penalty on large recruitment estimates
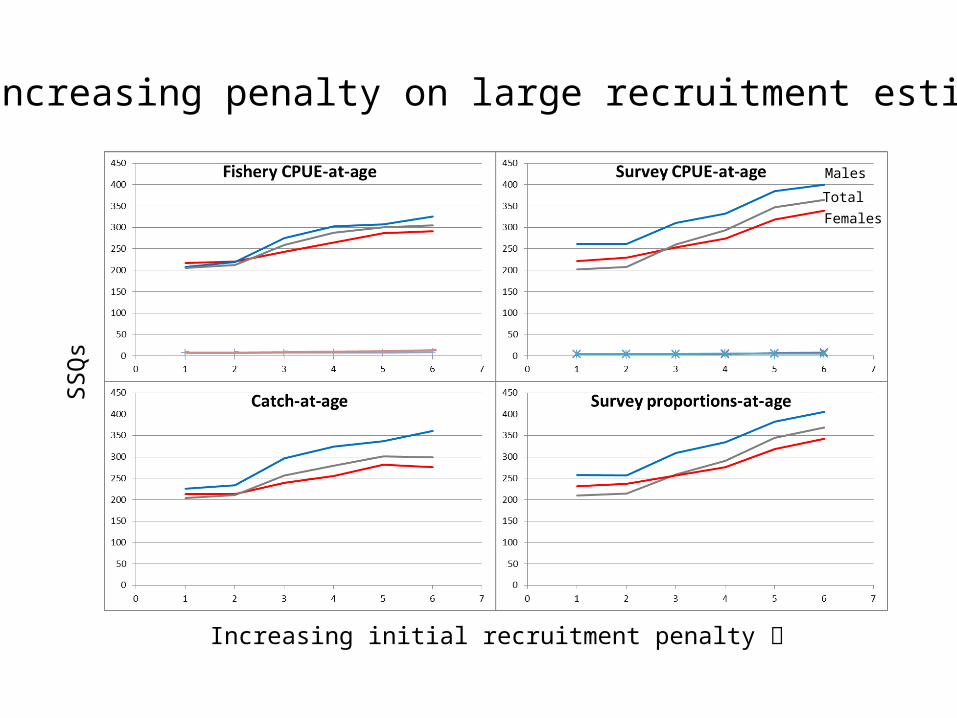
Increasing penalty on large recruitment estimatesSS
Qs
Increasing initial recruitment penalty
Males
Females
Total
Secondary exploration: Investigate increasing the relative survey weight Explore process error in selectivity (time-varying)
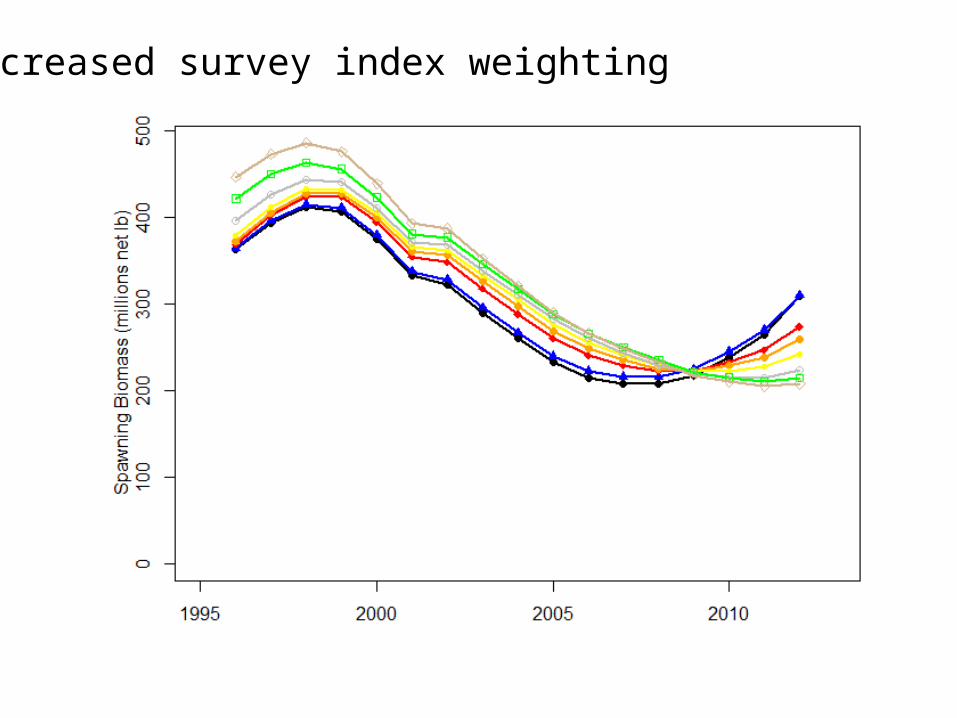
Increased survey index weighting
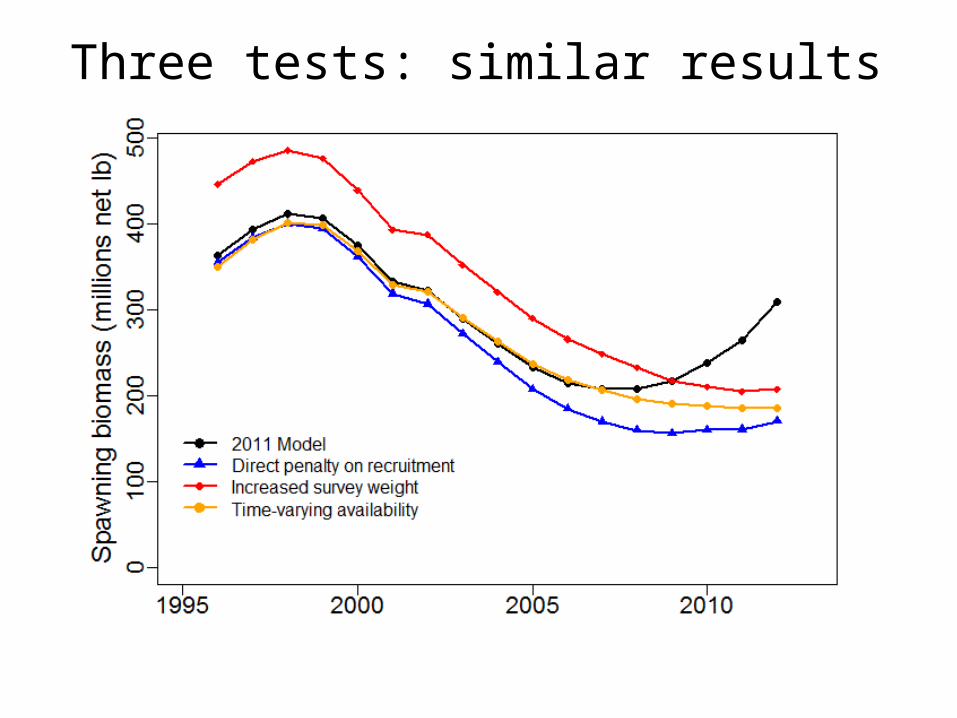
Three tests: similar results
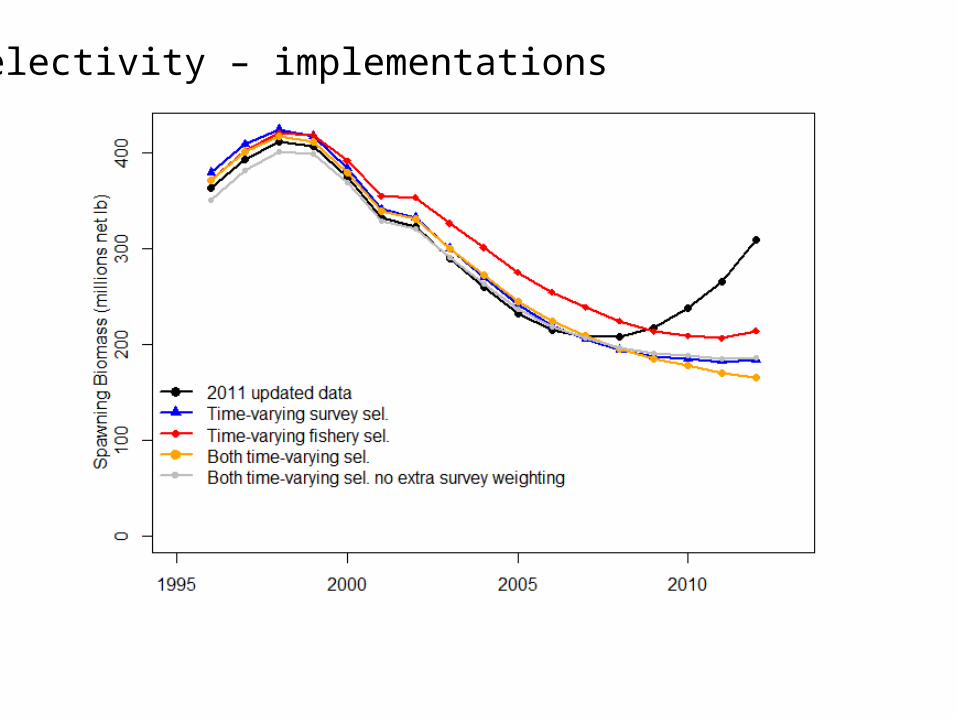
Selectivity – implementations
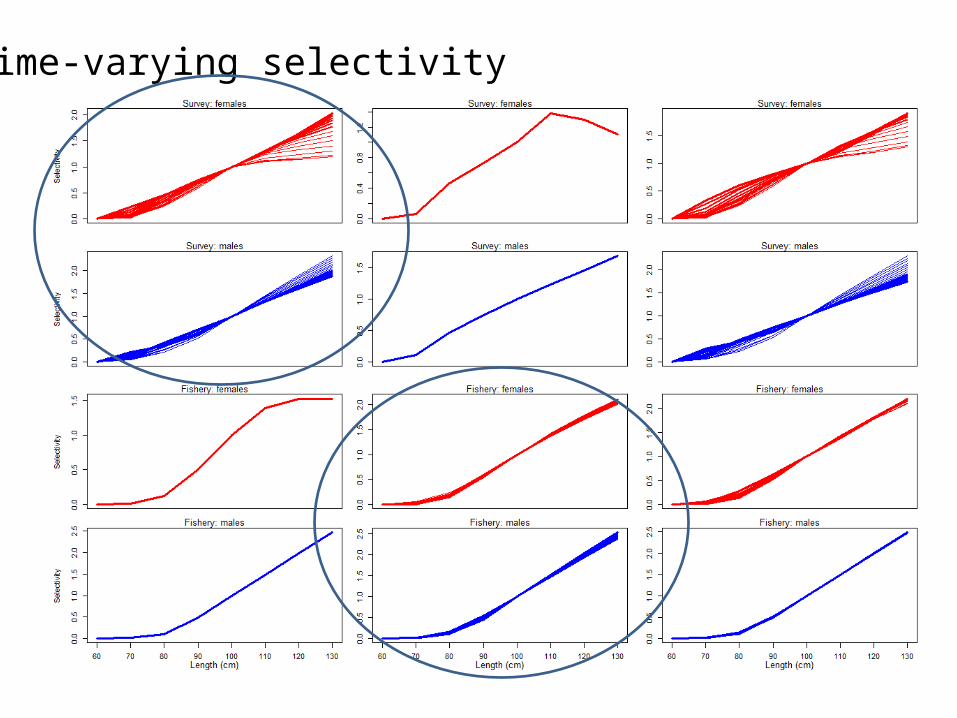
Time-varying selectivity
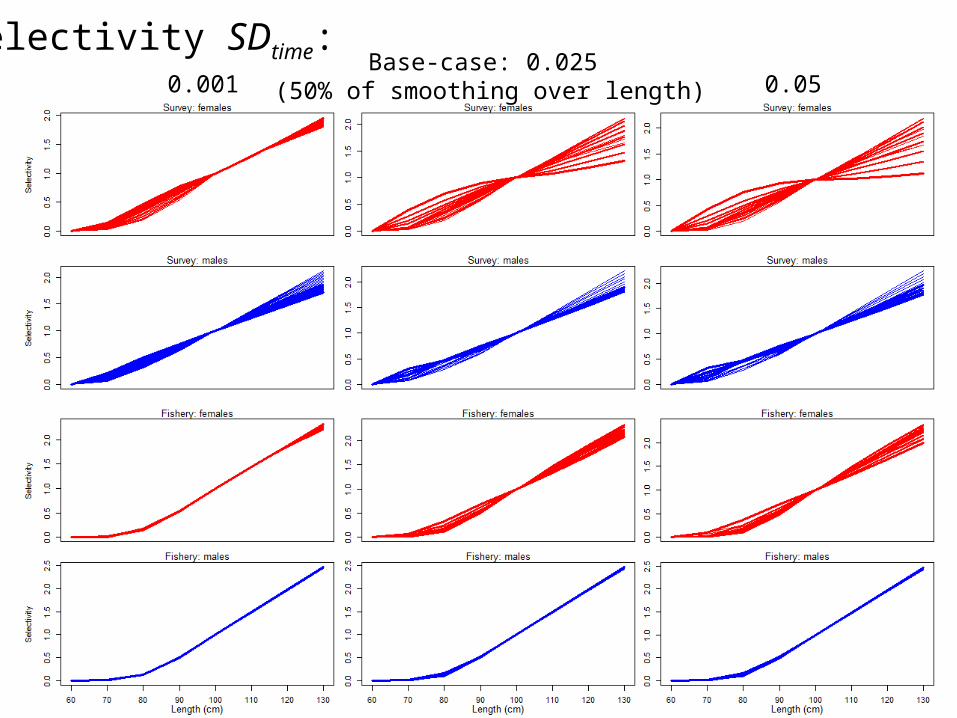
Selectivity SDtime: Base-case: 0.025 (50% of smoothing over length) 0.050.001
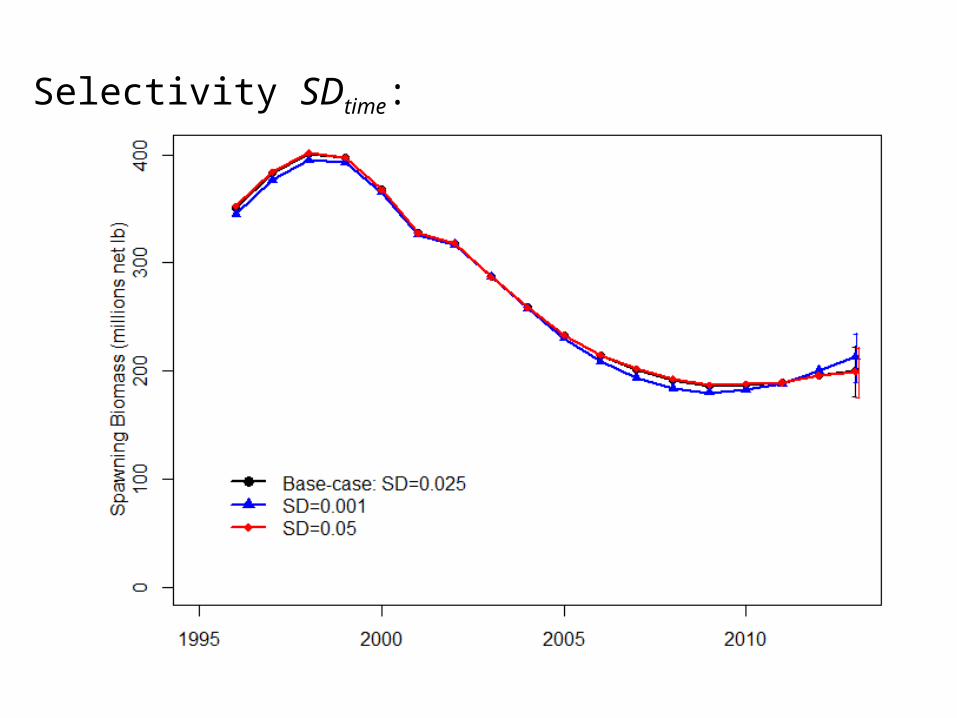
Selectivity SDtime:
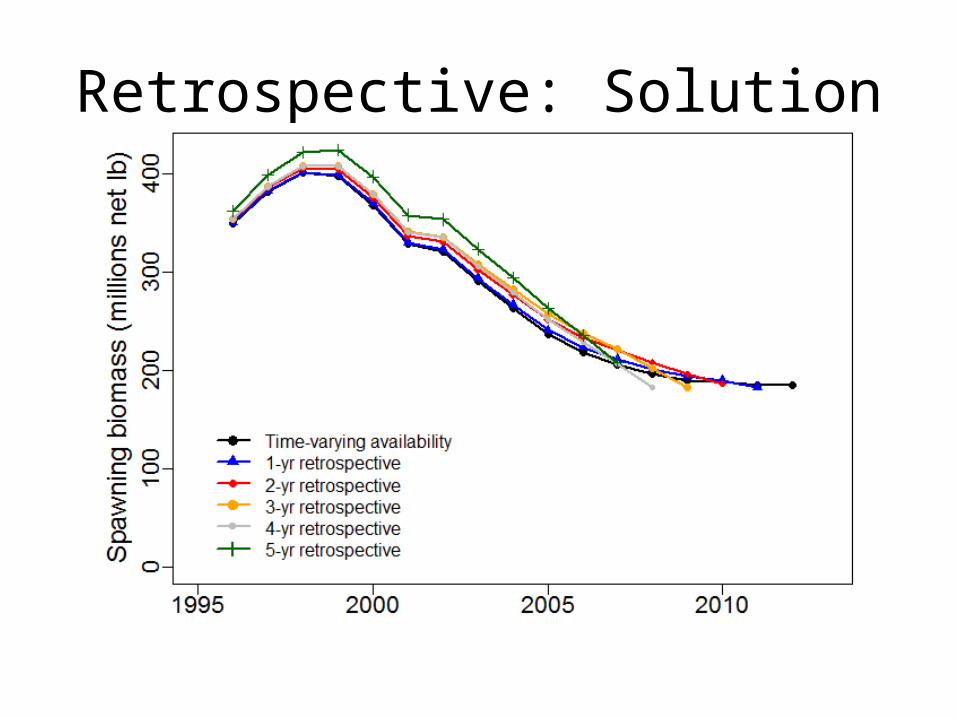
Retrospective: Solution
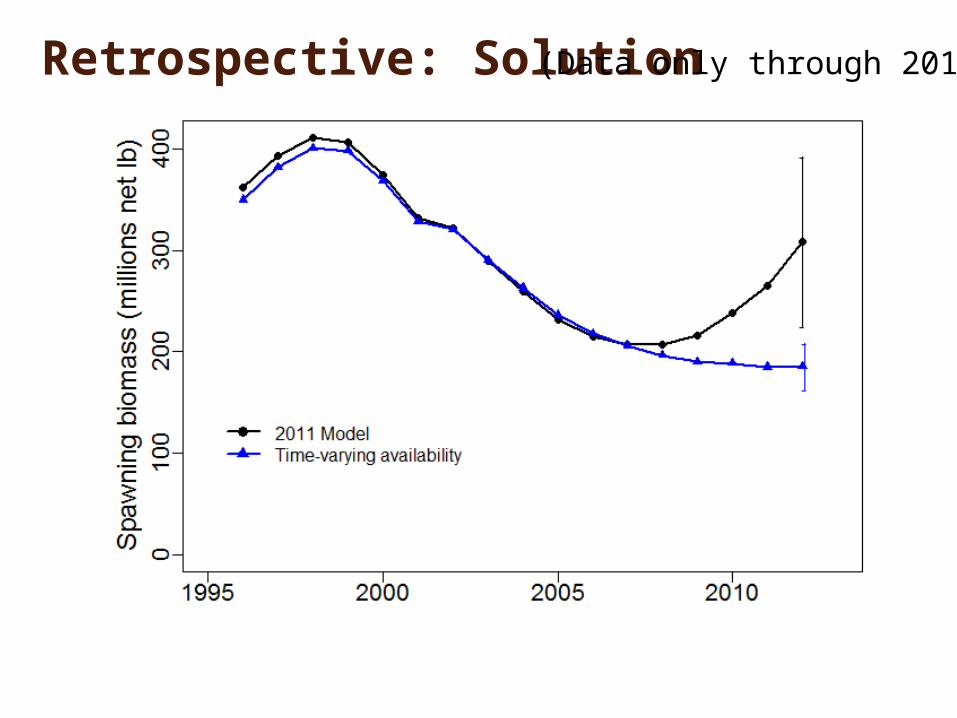
Retrospective: Solution (Data only through 2011)
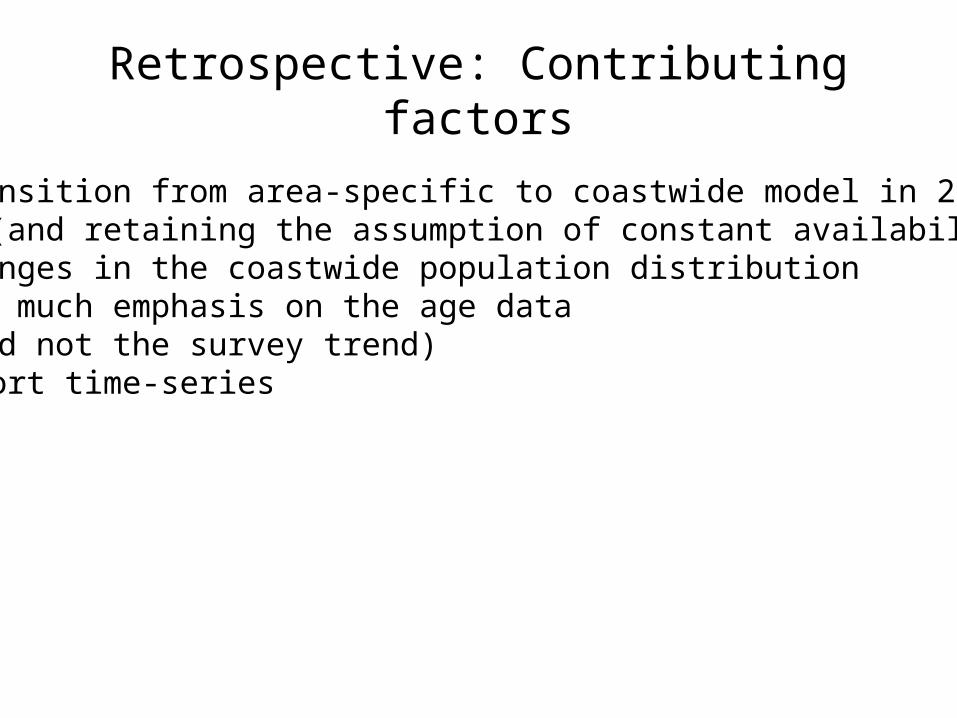
Retrospective: Contributing factors
1) Transition from area-specific to coastwide model in 2006(and retaining the assumption of constant availability)
2) Changes in the coastwide population distribution3) Too much emphasis on the age data
(and not the survey trend)4) Short time-series
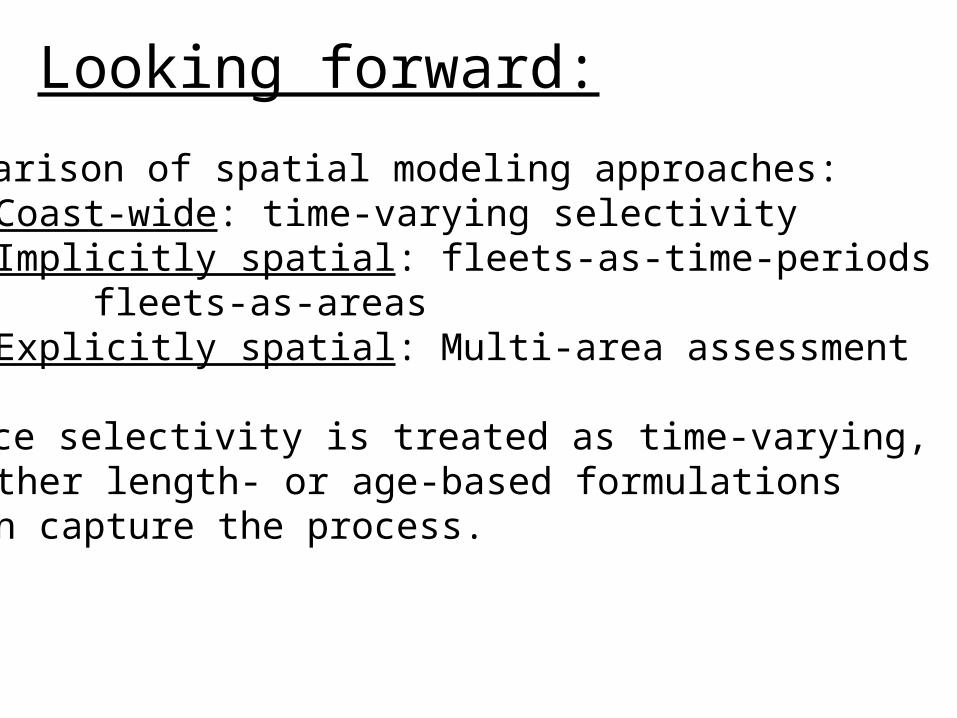
Looking forward:
Comparison of spatial modeling approaches: - Coast-wide: time-varying selectivity
- Implicitly spatial: fleets-as-time-periodsfleets-as-areas
- Explicitly spatial: Multi-area assessment
Once selectivity is treated as time-varying, either length- or age-based formulations can capture the process.
Questions?

![Capam Tt Case Study 2005[1]](https://static.fdocuments.in/doc/165x107/577ce7291a28abf103947a49/capam-tt-case-study-20051.jpg)