Sel sh Algorithm and Emergence of Collective Intelligence
16
Selfish Algorithm and Emergence of Collective Intelligence Korosh Mahmoodi 1* , Bruce J. West 2 , and Cleotilde Gonzalez 1 1) Dynamic Decision Making Laboratory, Department of Social and Decision Sciences, Carnegie Mellon University, 5000 Forbes ave., Pittsburgh, PA15213 USA 2) Information Sciences Directorate, Army Research Office, Research Triangle Park, NC 27708, USA We propose a model for demonstrating spontaneous emergence of collective intelligent behavior from selfish individual agents. Agents’ behavior is modeled using our proposed selfish algorithm (SA) with three learning mechanisms: reinforced learning (SAL), trust (SAT ) and connection (SAC). Each of these mechanisms provides a distinctly different way an agent can increase the individual benefit accrued through playing the prisoner’s dilemma game (PDG) with other agents. The SA provides a generalization of the self-organized temporal criticality (SOTC) model and shows that self-interested individuals can simultaneously produce maximum social benefit from their decisions. The mechanisms in the SA are self-tuned by the internal dynamics and without having a pre-established network structure. Our results demonstrate emergence of mutual cooperation, emergence of dynamic networks, and adaptation and resilience of social systems after perturbations. The implications and applications of the SA are discussed. Keywords: Selfish Algorithm, Reinforcement Learning, Emergence of Collective Intelligence, Emergence of Network Reciprocity, Resilience I. INTRODUCTION In this paper we address the problem of resolving the paradox of cooperative behavior emerging in situa- tions in which individuals are assumed to act solely in their own self interest, that is, selfishly. This particular paradox has a long history and has been widely studied in sociology and in the cognitive sciences. Game theory has been among the leading descriptors of normative behav- ior in this regard. In particular, the Prisoner’s Dilemma Game (PDG) has been a leading metaphor for the study of the evolution of cooperative behavior in populations in which selfishness is substantially rewarded in the short- term [1, 2]. Herein we integrate the PDG behavior into a recently developed model of self-organized behavior [3], but before we become immersed in the formalization of our proposed model, we examine the behavior of interest from a qualitative perspective. It is nearly two centuries since Lloyd [4] introduced the tragedy of the commons scenario to highlight the lim- itations of human rationality in a social context. We subsequently update this scenario to modern situations in which individuals, with self-centered interests, must share a common resource. If each individual acts self- ishly, without regard for the others sharing the resource, the unavoidable result will be the depletion of resources and subsequent tragedy. There is still much to be gained in reviewing the original scenario before adapting it to our present concerns. The ’commons’ is an old-English term for a land area whose use is open to the public. Lloyd considered a pasture to be a commons, which is shared by a number of cattle herders, each of which re- tains as many cattle as possible. External factors such as * Corresponding author: [email protected] wars, disease, poaching and so on, act to keep the num- ber of men and beasts well below the maximum level that can be safely supported by the commons. The dynamic response to these disruptions is robust, but eventually, so- cial stability ensues. However, instead of enhancing the well being of the situation, the stability inevitably leads to tragedy. How does this counterintuitive development arise? In Lloyd’s argument, the assumption is made that all herdsmen act rationally. On the socially stable commons, rationality leads to a herdsman acting in his own self- interest in order to maximize the gain made from grazing and selling his cattle. He reasons that, on the downside, to grow his herd incurs certain costs, the purchase price and the incremental cost of overgrazing, by adding an- other animal to his herd. On the upside, the overgrazing cost is shared by all the herdsmen on the commons. Con- sequently, since he does not share with others the profit of selling this additional animal, it makes economic sense for him to add the animal to his herd. This argument is valid for adding additional animals as well. This same conclu- sion is independently reached by each of the other herds- men on the commons, since they are equally rational; re- sulting in tragedy, since with the growing herds the com- mons grazing capacity will inevitably be destroyed over time. The herdsman are trapped in a rational system that logically compels them to increase, without limit, the size of their herd and to do this in the face of lim- ited resources. Disaster and failure is the end point of this logical sequence in which all participants act in their own self-interest. One can find a number of weak points in this arcane argument, which we pose here as questions. Do people al- ways (or ever) behave strictly rationally? Do individuals ever act independently of what others in their commu- nity are doing? Do people typically completely disregard the effects of their actions on the behavior of others? We arXiv:2001.00907v1 [nlin.AO] 3 Jan 2020
Transcript of Sel sh Algorithm and Emergence of Collective Intelligence

Selfish Algorithm and Emergence of Collective Intelligence
Korosh Mahmoodi1∗, Bruce J. West2, and Cleotilde Gonzalez1
1) Dynamic Decision Making Laboratory, Department of Social and Decision Sciences,Carnegie Mellon University, 5000 Forbes ave., Pittsburgh, PA15213 USA
2) Information Sciences Directorate, Army Research Office, Research Triangle Park, NC 27708, USA
We propose a model for demonstrating spontaneous emergence of collective intelligent behaviorfrom selfish individual agents. Agents’ behavior is modeled using our proposed selfish algorithm(SA) with three learning mechanisms: reinforced learning (SAL), trust (SAT ) and connection(SAC). Each of these mechanisms provides a distinctly different way an agent can increase theindividual benefit accrued through playing the prisoner’s dilemma game (PDG) with other agents.The SA provides a generalization of the self-organized temporal criticality (SOTC) model andshows that self-interested individuals can simultaneously produce maximum social benefit from theirdecisions. The mechanisms in the SA are self-tuned by the internal dynamics and without havinga pre-established network structure. Our results demonstrate emergence of mutual cooperation,emergence of dynamic networks, and adaptation and resilience of social systems after perturbations.The implications and applications of the SA are discussed.
Keywords: Selfish Algorithm, Reinforcement Learning, Emergence of Collective Intelligence,Emergence of Network Reciprocity, Resilience
I. INTRODUCTION
In this paper we address the problem of resolvingthe paradox of cooperative behavior emerging in situa-tions in which individuals are assumed to act solely intheir own self interest, that is, selfishly. This particularparadox has a long history and has been widely studied insociology and in the cognitive sciences. Game theory hasbeen among the leading descriptors of normative behav-ior in this regard. In particular, the Prisoner’s DilemmaGame (PDG) has been a leading metaphor for the studyof the evolution of cooperative behavior in populations inwhich selfishness is substantially rewarded in the short-term [1, 2]. Herein we integrate the PDG behavior intoa recently developed model of self-organized behavior [3],but before we become immersed in the formalization ofour proposed model, we examine the behavior of interestfrom a qualitative perspective.
It is nearly two centuries since Lloyd [4] introduced thetragedy of the commons scenario to highlight the lim-itations of human rationality in a social context. Wesubsequently update this scenario to modern situationsin which individuals, with self-centered interests, mustshare a common resource. If each individual acts self-ishly, without regard for the others sharing the resource,the unavoidable result will be the depletion of resourcesand subsequent tragedy. There is still much to be gainedin reviewing the original scenario before adapting it toour present concerns. The ’commons’ is an old-Englishterm for a land area whose use is open to the public.Lloyd considered a pasture to be a commons, which isshared by a number of cattle herders, each of which re-tains as many cattle as possible. External factors such as
∗Corresponding author: [email protected]
wars, disease, poaching and so on, act to keep the num-ber of men and beasts well below the maximum level thatcan be safely supported by the commons. The dynamicresponse to these disruptions is robust, but eventually, so-cial stability ensues. However, instead of enhancing thewell being of the situation, the stability inevitably leadsto tragedy. How does this counterintuitive developmentarise?
In Lloyd’s argument, the assumption is made that allherdsmen act rationally. On the socially stable commons,rationality leads to a herdsman acting in his own self-interest in order to maximize the gain made from grazingand selling his cattle. He reasons that, on the downside,to grow his herd incurs certain costs, the purchase priceand the incremental cost of overgrazing, by adding an-other animal to his herd. On the upside, the overgrazingcost is shared by all the herdsmen on the commons. Con-sequently, since he does not share with others the profit ofselling this additional animal, it makes economic sense forhim to add the animal to his herd. This argument is validfor adding additional animals as well. This same conclu-sion is independently reached by each of the other herds-men on the commons, since they are equally rational; re-sulting in tragedy, since with the growing herds the com-mons grazing capacity will inevitably be destroyed overtime. The herdsman are trapped in a rational systemthat logically compels them to increase, without limit,the size of their herd and to do this in the face of lim-ited resources. Disaster and failure is the end point ofthis logical sequence in which all participants act in theirown self-interest.
One can find a number of weak points in this arcaneargument, which we pose here as questions. Do people al-ways (or ever) behave strictly rationally? Do individualsever act independently of what others in their commu-nity are doing? Do people typically completely disregardthe effects of their actions on the behavior of others? We
arX
iv:2
001.
0090
7v1
[nl
in.A
O]
3 J
an 2
020

2
subsequently address each of these questions and othersin a more general context. For the moment it is suffi-cient to point out that the ”straw man” of the tragedyof the commons is an example of linear logical thinkingand its deadly flaw is the unrealistic way it is applied toresolving paradoxes in our complex world.
a. The Altruism Paradox Altruism is one conceptthat was missing from Lloyd’s tragedy of the commonsdiscussion, but which seems to be no less important thanthe notion of selfishness, which was foundational to hisargument. Moreover, if selfishness is entailed by rational-ity in decision making, as he maintained, then altruismmust be realized through an irrational mechanism in de-cision making. In point of fact, the competition betweenthe two aspects of human decision making [5, 6], the ra-tional and irrational, may well save the commons fromruin.
Let us consider the altruism paradox (AP ), which iden-tifies a self-contradictory condition regarding the charac-teristics of species. This dates back to Darwin’s recogni-tion that some individuals in a number of species act ina manner that although helpful to other members of thespecies, may jeopardize their own survival. Yet this prop-erty is often characteristic of that species. He also iden-tified such altruism as contradicting his theory of evo-lution, the natural selection [7]. Darwin also proposed aresolution to this problem by speculating that natural se-lection is not restricted to the lowest element of the socialgroup, the individual, but can occur at all levels of a bi-ological hierarchy, which constitutes multilevel selectiontheory [8].
As discussed by West et al. [9] the theory of sociobiol-ogy was developed in the last century for the purpose of,at least in part, explaining how and why Darwin’s the-ory of biological evolution is compatible with sociology.Wilson and Wilson [8] were able to demonstrate the con-vergence of scientific consensus on the use of multilevelselection theory to resolve the AP in sociobiology. Randand Nowak [10] emphasize that natural selection sup-presses the development of cooperation unless it is bal-anced by specific counter mechanisms. Five such mecha-nism found in the literature are: multilevel selection, spa-tial selection, direct reciprocity, indirect reciprocity andkin selection. In their paper they discuss models of thesemechanisms, as well as, the empirical evidence support-ing their existence in situations where people cooperated,but in the context of evolutionary game theory. The res-olution of such fundamental problems as the AP may beidentified at the birth of each of the scientific disciplines;new perspectives designed to ignore large domains of sci-ence thought to be irrelevant within the narrow confinesof the new discipline. The complexity of a given phe-nomenon can therefore be measured by the number ofdifferent disciplines interwoven to describe its behavior.
b. Prisoner’s Dilemma Game The PDG datesback to the early development of game theory [11], andis a familiar mathematical formulation of the essentialelements of many social situations involving cooperative
TABLE I: The general payoffs of PDG. The first valueof each pair is the payoff of agent i and the second value
is the payoff of the agent j.
Player j
C D
Player iC (R,R) (S, T )
D (T, S) (P, P )
behavior. PDGs are generally represented with a payoffmatrix that provides payoffs according to the actions oftwo players (see Table I). When both players cooperate,each of them gains the payoff R, and when both playersdefect, each of them gains P . If in a social group agentsi and j play the PDG, when i defects and j cooperates,i gains the payoff T and j gains the payoff S and whenthe decisions are switched, so too are the payoffs. Theconstraints on the payoffs in the PDG are T > R >P > S and S + T < 2R. The temptation to defect isestablished by setting the condition T > R.
The dilemma arises from the fact that although it isclear that for a social group (in the short-term) and for anindividual (in the long-term) the optimal mutual actionis for both to cooperate, each individual is tempted todefect because that decision elicits the higher immediatereward to the individual defecting. But, assuming theother player also acts to selfishly maximize her own ben-efit, the pair will end up in a defector-defector situation,having the minimum payoff P for both players. How doindividuals realize that cooperation is mutually beneficialin the long-term? This question has been answered bymany researchers, at various levels of inquiry, involvingpairs of agents [2? ], as well as, larger social networks[1]. Research suggests that, at the pair level, people dy-namically adjust their actions according to their observa-tions of each others’ actions and outcomes; at the com-plex dynamic network or societal level, this same researchsuggests that the emergence of cooperation may be ex-plained by network reciprocity, whereby individuals playprimarily with those agents with whom they are alreadyconnected in a network structure. The demonstration ofhow social networks and structured populations with ex-plicit connections foster cooperation was introduced byNowak and May [13]. Alternative models based on net-work reciprocity assume agents in a network play thePDG only with those agents to whom they have specificlinks. Agents act by copying the strategy of the richestneighbor, basing their decisions on the observation of theothers’ payoffs. Thus, network reciprocity depends onthe existence of a network structure (an already prede-fined set of links among agents) and on the awareness ofthe behavior and payoffs of interconnected agents.
c. Empirical evidence of emergence of cooperationPast research has supported the conclusion that the sur-vival of cooperators requires the observation of the ac-tions and/or outcomes of others and the existence of pre-defined connections (links) among agents. Indeed, empir-

3
ical work suggests that the survival and growth of coop-eration within the social group depends on the level ofinformation available to each agent [14]. The less infor-mation about other agents available, the more difficultit is for cooperative behavior to emerge [11, 14]. On theother hand, other experiments suggest that humans donot consider the payoffs to others when making their de-cisions, and that a network structure does not influencethe final cooperative outcome [15]. In fact, in many as-pects of life, we influence others through our choices andthe choices of others affect us, but we are not necessarilyaware of the exact actions and rewards received by oth-ers that have affected us. For example, when a memberof society avoids air travel in order to reduce their car-bon footprint, s/he might not be able to observe whetherothers are reducing their air travel as well, yet they relyon decisions others make, influencing the community as awhole. Thus, it is difficult to explain how behaviors canbe self-perpetuating even when the source of influence isunknown [14].
These empirical observations support an important hy-pothesis emerging from the work presented herein. Ourhypothesis is that mutual cooperation emerges and sur-vives, even when the social group consists exclusively ofselfish agents and there is no conscious awareness of thepayoffs to other agents. Moreover a network structurecan emerge dynamically from the connections formed andguided by individual selfishness. Note that this is the dy-namics of a network, as distinct from the more familiardynamics on a network. The dynamics on a networkassumes a static network structure, as in evolutionarygame theory, whereupon the strengths of the links be-tween agents may change, but the agents sit at the nodesof the network and interact with the same nearest neigh-bors. On the other hand, the dynamics of a networksmakes no such assumption and the dynamics consist ofthe formation and dissolution of links between any twoagents within the social group.
II. CONTRIBUTIONS
Herein, we aim to clarify how collective intelligenceemerges without explicit knowledge of the actions andoutcomes of others, and in the absence of a predefinednetwork structure linking agents within a society. Weintroduce an algorithm (the Selfish Algorithm, SA) todemonstrate that collective intelligence can emerge andsurvive between agents in a social group, out of selfish-ness. We construct a computational model of the SA andgenerate simulations of the evolution of mutual coopera-tion and networks out of selfishness.
First, the SA model provides a resolution of the altru-ism paradox (AP ) and shows how agents create a self-organized critical group out of individual selfish behav-ior, simultaneously maximizing the benefit of individualand of the whole group. Second, the SA model demon-strates how adaptation can naturally emerge from the
same mechanisms in the model. Adaptation is an im-portant property of living things, which allows them torespond to a changing environment in a way that opti-mizes their performance and survivability.
We studied four systems governed with different learn-ing mechanisms proposed by the SA, where the behaviorof the agents is modeled using three modes of learning:reinforced learning (SAL), trust (SAT ), and connection(SAC). The first system studied has only the SAL mech-anism active. The other three systems are a combinationof SAL and SAT (SALT ), SAL and SAC (SALC),and the combination of all the mechanisms (SALTC).Next, we tested the sensitivity of the collective behaviorthat emerged from these systems to changes in the so-cial makeup by modifying a fraction of the agents havingthem exchanged with zealots at a given time. A zealotis an agent that will not change its decision regardless ofthe payoff. The comparison of the mutual cooperation ofthe systems versus the number of the zealots is a mea-sure of resilience, or robustness (i.e., the resistance of thecollective behavior to perturbations).
The computational results show that these systems canbe ranked from strongest to weakest in their resilience asSALTC>SALC>SALT>SAL. The SALC and SALTCsystems have a high resilience because using SAC in thedecision making process enables agents to learn to avoidpairing with the zealots. This way of pairing is differentfrom the popular mechanism of preferential attachment[16], which uses rules according to which an agent wouldhave a higher chance of linking with other agents thatalready have many links, those being agents with a sub-stantial reputation. In contrast, the SA demonstratesthat such chances to connect to other agents emerge dy-namically, according to the experienced benefits that theother agent brings to the individual’s own benefit (SAC).This high adaptability of SA shows that each agent canbe observed to act as a local leader, making decisionsbased on changes in its environment toward maximizingits own benefit and, at the same time, the local deci-sions made by agents also affect the choices taken by thesystem as a whole, leading it to its optimal state.
a. Network reciprocity and survival of cooperatorsTo put our contributions in perspective, let us highlightthe main differences between the SA model and those ofprevious studies. First, the works following the strategyof the Nowak-May agents [13] typically compare their in-dividual payoff with the payoffs of the other agents whenmaking their next decision. One way to realize this strat-egy is to adopt the decision of the most successful neigh-bor. In contrast, all the updates in the SA are basedon the last two payoffs to the self-same individual. Inother words, SA agents do not rely on information aboutthe other members of society to determine its evolution.SA agents are connected to other agents, only indirectly,through their local payoffs in time. The most recent pay-off to the individual is the result of its interaction withits most recent partner, but its previous payoff, used fortuning its tendencies (presented below in Equation 1),

4
FIG. 1: The colors on the left and right panel show the average of the ratio of Mutual Cooperation (RMC) at time100, when each agent played the PDG for 100 times with its eight nearest neighbors, and updated its decision by
imitating the decision of the richest neighbor (including themselves). The agents were located on a regulartwo-dimensional lattice of size 10×10 (left panel) and 30×30 (right panel). The horizontal axis of the panels showsthe degree of temptation to cheat experienced by the agents and the vertical axis is the ratio to initial cooperators
on the lattice. 100 ensembles were was used to evaluate the average RMC at time 100.
FIG. 2: Left panel: The time evolution of the Ratio of Mutual Cooperation (RMC) for agents located on a regulartwo-dimensional lattice with 10×10 (black curve) and 30×30 agents (red curve). Initially 75% of agents randomlypicked to be cooperators and at each time agents played PDG with Tc = 0.25 with their 8 nearest neighbors andimitated the decision of its richest neighbor (including themselves). Right panel: The time evolution of the RMC
for the agents with similar condition as those adopted in the left panel except that at each time two agents arepicked randomly and played PDG (no predefined connections). The curves are averaged over 100 realizations.
might be the result of playing with a different partner.Second, the Nowak-May agents [13] are assumed to belocated at the nodes of a lattice and to be connected bylinks, as they were also assumed to be in the decisionmaking model (DMM) [9]. For example, because of so-cial interactions these lattice networks are regularly usedto model complex networks and have historically beenassumed to mimic the behavior of real social systems.These studies emphasized the important role of networkcomplexity in sustaining, or promoting, cooperation [17].
This was accomplished without explicitly introducing aself-organizing mechanism for the network formation it-self.
To show the importance of the specific connection ofagents on a lattice in Nowak and May [13] model, wereplicated their simulation work. In this simulation theagents are located on a regular two-dimensional lattice,each having eight nearest neighbors to play the PDG.There is an agent located at each node of the lattice andthey each update their decision at each round of the com-

5
putation by imitating the decision of the richest agentin their neighborhood (including themselves). Figure 1shows our replication of their work. The colors on thepanels indicate the average of the Ratio of Mutual Coop-eration (RMC) which sustained between the agents lo-cated on the 10×10 lattice (left panel) and on the 30×30lattice (right panel) after each agent played 100 timeswith its eight nearest neighbors. The yellow areas corre-spond to high RMC which happened for low temptationto cheat Tc (i.e., agent’s selection of the Defect action inthe PDG) and high initial number of cooperators. Theyellow area is more extended in the case of agents locatedon the larger lattice of size 30×30 (right panel).
To explicitly show the importance of Nowak and May’sassumption of the lattice structure for survival of mutualcooperation, we ran their model and compared time evo-lution of the RMC between these agents in the case wherethe agents were paired up randomly. The left panel ofFigure 2 shows the ensemble average of 100 simulationsfor 100 agents (black curve) and 900 agents (red curve)connected on a two-dimensional lattice. At each timeround, each agent plays the PDG, with a low tempta-tion to cheat Tc(= 0.25), with all its eight neighbors.Initially 75% of the agents were cooperators, but theRMC evolved and sustained in both cases. The rightpanel of Figure 2 shows the results of the same exper-iment, but selecting the interacting pairs randomly (nolattice structure is assumed for the agents). As shownin the figure, the RMC vanishes in the absence of thenetwork structure.
As we demonstrate next, the SA does not rely on alattice network, yet, mutual cooperation is subsequentlyshown to emerge and survive the induce of perturbations.In fact, we show that the network reciprocity can be in-terpreted to be a byproduct of SA, emerging out of theselfishness of the SA agents.
III. THE SELFISH ALGORITHM (SA)
The selfish algorithm (SA) proposed in this re-search belongs to a family of agent-based models in mod-ern evolutionary game theory [18]. Specifically, SA rep-resents a generalization of a model introduced by Mah-moodi et al. [3] which is a coupling of DMM with evo-lutionary game theory put into a social context. Thisearlier introduction led to the self-organized temporalcriticality (SOTC) concept and the notion that a socialgroup could and would adjust their behavior to achieveconsensus, interpreted as a form of group intelligence, ashad been suggested by the collective behavior observedin animal studies [19]. The SOTC agents, like Nowakand May’s agents [13], assumes a pre-existing networkbetween the agents which use the DMM (belonging tothe Ising universality class of models for decision making[20]). SA overcomes this limitation, resulting in a gen-eral model for emergence of collective intelligence and acomplex dynamic network.
The general notion that the SA adopted from Mah-moodi et al. [3] is that an agent i makes a decisionaccording to the change in a cumulative tendency (i.e.,preference). The change in this cumulative tendency, ∆,is a function of the last two payoffs of agent i who playedwith agent j and k:
∆i,jk = χΠij(t)−Πik(t− 1)
|Πij(t)|+ |Πik(t− 1)|, (1)
where χ is a positive number that represents the sensi-tivity of the agent to its last two payoffs. The quantityΠij(t) is the payoff to the agent i played with agent j attime t and Πik(t− 1) is the payoff to the agent i playedwith agent k at time t − 1. We used the S value in thePDG that is > 0 and assumed ∆i,jk = 0 when the de-nominator of Eq. ( 1) is zero.
A simplified version of the SA was previously intro-duced elsewhere [21], and an abbreviated version of thealgorithm and its mathematical details are included inAppendix A. In the first cycle of the SA, a pair of ran-domly selected agents i and j ”agree” to play. Only onepair of agents play at each time cycle. Each of the agentsof a pair engages in three decisions; each decision is rep-resented in a learning mechanism (a cumulative propen-sity lever, ranging from 0 to 1) by which the agent cangain information about the social environment: learningfrom their own past outcomes (Selfish Algorithm Learn-ing, SAL), trust the decision of other agents (Selfish Al-gorithm Trust, SAT ), and make social connections thatare beneficial (Selfish algorithm-based connection, SAC).Each of these levers is updated according to the agent’sself interest (selfishness): a decision is made according tothe state of each lever, and the lever is updated accordingto ∆ as formalized in Eq. ( 1).
In the SAL mechanism, an agent decides to cooper-ate (C) or defect (D) while playing the PDG with thepaired partner, according to the state of the cumulativepropensity of playing C or D. The cumulative propen-sity of the agent to pick C or D increases (or decreases) ifit’s payoff is increased (or decreased) with respect to itsprevious payoff, as per Eq. ( 1). The updated cumula-tive tendency to play C or D with the same agent is usedfor the next time agent i is paired with the same agentj. Our simulation results show that the SAL mechanismattracts the agents toward mutual cooperation.
In the SAT decision, an agent decides to rely on thedecision of its partner, instead of using its own decisionmade using SAL, according to the state of the cumula-tive propensity of ”trusting” the other’s decision or not.Each SAT agent can tune this propensity to rely on itspartner’s decision according to ∆ as formalized in Eq.( 1). The SAT agent increases (or decreases) its ten-dency to trust its partner’s decision if it increased (ordecreased) its payoff with respect to its previous payoffs.Our simulation results show that the SALT (both SALand SAT active) mechanism amplifies the mutual coop-eration between the agents regardless of the value of theincentive to cheat Tc.

6
TABLE II: The payoffs of the PDG. The first value ofeach pair is the payoff of agent i and the second value is
the payoff of the agent j.
Player j
C D
Player iC (1, 1) (0, 1 + Tc)
D (1 + Tc, 0) (0, 0)
Finally, the SAC is a decision of an agent to pick thepartner with whom to play in each round. Each SACagent can tune its propensity of selecting its partner ac-cording to ∆ as formalized in Eq. ( 1). A SAC agentincreases (or decreases) its tendency of playing with thesame partner if the payoff received after playing with thatpartner is higher (or lower) than the agent’s own previ-ous payoffs. Our simulation results show that a networkof connections emerge over time between SAC agents,and that this network amplifies the mutual cooperationbetween agents.
IV. SIMULATION RESULTS
We studied 20 agent system and set the parameters forthe calculations as follows: Initially all the agents weredefectors, had payoff of zero, a propensity of 0.9 to remaina defector, propensity of 0 to trust the partner’s decision,and equal propensity of 1/(20-1) to connect with each ofthe other agents. We set the sensitivity coefficient toχ = 200. The parameter χ controls the magnitude ofthe changes of the cumulative tendencies at each updatewhere we set the maximum and minimum of the cumu-lative tendencies to be 1000 and 0, respectively. As aboundary condition, if the updated cumulative tendencygoes beyond 1000 (or below 0) then it is set back to 1000(or 0). A smaller χ, with respect to the maximum valueof the cumulative tendency, slows down the process oflearning, but it does not qualitatively change behavior,but merely scales the dynamical properties of the system.The time for simulations are picked to be sufficiently longto show the asymptotic behavior of the systems.
The payoff matrix used in the simulations is shown inTable II as suggested by Gintis [22]: R = 1, P = 0 andS = 0. So, the maximum possible value of T = 1 + Tcis 2. We selected the value Tc = 0.9 (unless otherwiseexplicitly mentioned) which provides a strong incentiveto defect. This simple payoff matrix has the spirit of thePDG and allows us to emphasize the main properties ofthe SA model.
A. Emergence of mutual cooperation by SAL
In this section we demonstrate that the learning mech-anism of SAL attracts agents, playing the PDG, to a
FIG. 3: Each curve shows the time evolution of theRatio of Mutual Cooperation (RMC) for 20 agents
used SAL and played the PDG withTc = 0.1, 0.3, 0.5, 0.7, 0.9 corresponding to the black,
red, blue, green and purple curves, respectively.
state of mutual cooperation. Figure 3 shows the time evo-lution of the RMC in simulations where the 20 agents,randomly partnered in each cycle, used only the SALmechanism to update their decisions. The RMC in-creased from zero and asymptotically saturates to a valuethat depends on the value of the temptation to cheat Tc.The smaller the Tc value the higher the saturated RMCvalue and the greater the size of the collective coopera-tion. Using SAL, each agent learns, by social interactionswith the other agents, to modify its tendency to play Cor D. These agents are connected through their payoffs.Each agent compares its recent payoff with its previousone, which, with high propensity, earned by playing witha different agent. This mutual interaction between theselfish agents led them to form an intelligent group thatlearns the advantage of mutual cooperation in a freelyconnected environment whose dynamics are representedby the PDG.
To explain how the collective cooperation emerges, welooked into the evolution of the propensities to cooperatebetween two selected agents (among 20). Figure 4 depictsthe time evolution of the propensity of two agents topick cooperation (C) in the PDG. The propensity ofagent 1 to cooperate with agent 2 (drawn in red), and thepropensity of agent 2 to cooperate with agent 1 (drawn inblack). Generally, we observe a high correlation betweenthe propensities to cooperate between the two agents.
The left panel presents these propensities when thetemptation to defect is Tc = 0.9, and the right panelpresents the propensities when the temptation to defectis Tc = 0.1. The correlation between the propensity ofthe two agents is 0.65 for Tc = 0.9 and 0.84 for Tc = 0.1.The correlation between the agents is the result of thelearning process between them. Let’s assume Tc = 0.5and that agent 1 played C and agent 2 played D at time

7
FIG. 4: The curves show the time evolution of the propensity of agent 1 to play as C with agent 2 (red curve)(PC12) and the propensity of agent 2 to play as C with agent 1 (black curve) (PC21). Agents 1 and two are among
20 agents using SAL to update their decisions and had Tc = 0.9 (left panel) and Tc = 0.1 (right panels).
t which results in payoffs of 0 and 1.5 for them, respec-tively. Comparing its payoff with its previous payoff,earned playing with other agent (= 1.5, 0, 1 or 0), agent1 would change its accumulative tendency to play C fornext time it is randomly paired with player 2 by −χ, 0,−χ or 0. This means that agent 1 reacts to the defectivebehavior of agent 2 by tending to behave D and conse-quently agent 2 wouldn’t continue to have the advantageof a cooperative environment. On the other hand, agent2 would change its accumulative tendency to play D withagent 1 by 0, χ, 0.2χ or χ. This means agent 2 wouldlike to play as D next time it pairs with agent 1. So,both agents learn to play D with one another, leadingto coordination state of DD where both get payoff of0. Such pairs compare this payoff (= 0) with their pre-vious payoff, played with other agent, and would changetheir accumulative tendency to play D by −χ, 0, −χ or 0which shift their future decisions toward the coordinationstate of CC. These agents would change their tendencyto play C by −0.2χ, χ, 0 or χ which favors their stayas C toward one another. However, because of the timeto time change of −0.2χ (depending on the value of Tc)in the accumulative tendency to play C with other pairs,there is always a chance for agents to play D for a while,before they are pulled back by other agents to behaveas C. This creates a dynamic equilibrium between CCand DD states and defines the level of emerged mutualcooperation observed in Figure 3. Thus, the dual dy-namic interaction, based on self-interest, between eachagent and its environment causes the emergence of mu-tual cooperation between the agents who play PDG anduse SAL to update their decisions. Note that in humanexperiments, humans learning from only their own out-comes without awareness of the partners’ outcomes didnot lead to mutual cooperation [14] as the rational agentsof SAL can do. High correlation between the propensi-ties of the pairs of the agents using SAL means high co-
ordination between their decisions which also can occurif the ”Trust” mechanism is active between the agents.Trust lowers the intermediate CD pairings and leads theagents to coordinate and converge in the same decision.In the next section we show that combining SAL withSAT amplifies the RMC between the agents. Our cur-rent experimental work [23] also confirms that adding thetrust mechanism in decision making experiments with ofhuman pairs helped them to realize the advantage of mu-tual cooperation.
B. Enhancement of Mutual Cooperation by SALT ;Trust as a Dynamic Decision
Figure 5 shows the enhancing effect on the emergenceof collective cooperation when each agent is allowed tomake a decision whether to ”Trust” or rely on the deci-sion made by the paired agent or not (SAT ).
The SALT mechanism also decreases the time foragents to realize the benefit of mutual cooperation. InFigure 6 we compare the ratio of CD partners in a groupof 20 agents playing the PDG with a temptation to cheatof Tc = 0.9 when using the SALT model (dashed lines)and when using the SAL model (solid lines). It is appar-ent that because of the trust mechanism, SALT agentscoordinate more often than they do without it and con-sequently avoid the formation of CD pairs. We also plotthe ratio of DD pairs for the two systems. These curvesshow that SALT agents learn to select CC pairs over CDpairs more readily than do SAL agents, thereby pushingthe RMC up to approximately 0.9. The average correla-tion between the propensity of two agents to play C withone another is about 0.92 when Tc = 0.9 which is a signof high coordination. We highlighted the difference be-tween trust used in the literature with our dynamic trustmodel in Appendix C.

8
FIG. 5: Each curve shows the time evolution of theRatio of Mutual Cooperation (RMC) for 20 agents
using SALT and playing the PDG withTc = 0.1, 0.3, 0.5, 0.7, 0.9 corresponding to the black,
red, blue, green, and purple curves, respectively.
FIG. 6: The solid black and the solid red curves show,respectively, the time evolution of the ratio of CD and
CD pairs played PDG and used SALT to makedecision. The dashed black and dashed red curves show,respectively, the time evolution of the ratio of CD and
CD pairs played PDG and used SALT to makedecision. M = 20, Tc = 0.9.
C. Emergence of network reciprocity from SALCand SALTC
By activating the ability of the agents to make deci-sions about the social connections that are beneficial tothemselves (SAC), we expect that an even larger andfaster increase in collective cooperation. The Connec-tion mechanism allows each agent to select a partner thathelped the agent to increase its payoff with respect to itsprevious payoff.
We demonstrate the increase in the RMC for a model
without the Trust mechanism SALC and a model withthe Trust mechanism SALTC. The Left panel of Figure 7shows an increase in the RMC of the agents using SALC(left panel), and using SALTC (right panel). When com-paring the SALC model behavior to that of the agentswithout the connection mechanism (paired randomly) inFigure 3, we observe that the dependence on the tempta-tion to cheat Tc is weaker. For example at time t = 106
the average RMC for the agents using SALC are about0.84, 0.80, 0.75, 0.65 and 0.62 for Tc = 0.1, 0.3, 0.5, 0.7and 0.9, respectively, whereas for the agents using SALthe average RMC for the same conditions are about 0.76,0.64, 0.58, 0.52 and 0.45, respectively. On the right panelof Figure 7, we observe that using the Learning, Trust,and Connection mechanism in conjunction (SALTC),the level of collective cooperation is the highest with theleast dependence on the temptation to cheat.
To show that the reciprocity emerged between theagents using the SAC mechanism, we plotted in Fig-ure 8 the propensities of making connections between atypical agent (agent 1) and the other 19 agents whereagents used SALC (left panel) or SALTC (right panel)to update their decisions. In both cases, these figuresshow that agent 1 developed a preferential partner andlearned to play most of the time with one of the agentsamong others.
The manner in which the network develops over time isschematically depicted in Figure 9. This figure shows therecorded connection propensities between 20 SA agentsat three time periods. Intensity of the lines between pairsshow the magnitude of the propensity of one to connectto the other and the directions show the intensity belongsto which agent and towards which one.
The colors of the nodes represent the state of the agentsat that time, red as defector and green as cooperator.The figure shows the connections among the agents att = 101 (left panel), passing through an intermediatestate (middle panel, t = 103) and after reaching dynamicequilibrium (right panel, t = 105). The preferential con-nections forming the dynamic network emerge here overtime and are based on the perception of the benefit thatan agent receives from other agents, with whom it in-teracts. Some connections become stronger whereas oth-ers become weaker according to the SAC mechanism.In [21] we showed that SAC creates a complex tempo-ral network with an inverse power law (IPL) probabilitydensity function (PDF ) 1/pβ of the propensity p of mak-ing connections between agents with IPL index β = 1.3.The IPL PDF is very different from the Poisson PDF ,the latter having an exponentially diminishing probabil-ity of changing the propensity compared with the muchgreater IPL value. Consequently, the propensity of form-ing a link between partners is much greater for the IPLand the SAC forms a much more complex network thandoes a Poisson PDF .
In the next section we study the adaptability of socialsystems ruled by different steps of the SA. Disruptingthese systems is done by changing some agents to zealots

9
FIG. 7: Each curve shows the time evolution of the Ratio of Mutual Cooperation (RMC) for 20 agents used SALC(left panel) or SALC (right panel) and played the PDG with Tc = 0.1, 0.3, 0.5, 0.7, 0.9 corresponding to the black,
red, blue, green and purple curves, respectively.
FIG. 8: Left and right panels show the time evolution of the propensity of pairings between agent 1 and the other 19agents when agents used SAC or SALTC, respectively. Agents had Tc = 0.9.
and tracking the changes among the remaining agents inresponse to the zealots.
D. Complex adaptation of a selfish organization
To investigate the dynamics of the SA agents we dis-rupt the stable behavior pattern emerging from the socialgroup by fixing a fraction f = 0.5 of the N = 20 agentsto be zealots and calculating the response of the remain-ing agents. A zealot is an agent whose properties are:zero tendency to be a Cooperator; zero trust to otheragents; and a uniform tendency to play the PDG withother agents. This divides the system into two subsys-tems: a fraction f = 0.5 of the agents that continue toevolve based on SAL, SALT , SALC or SALTC (sub-system S) and (1−f)N agents as zealots (subsystem S).
We investigate how the remaining fN agents of systemS adapt to the new environment by various modes oflearning. The degree to which these agents can sustaintheir mutual cooperation in the presence of the zealots isa measure of their resilience, or its compliment is a mea-sure of their fragility, a fundamental property of complexnetworks subject to perturbation.
To track the behavioral changes of the agents in Sfrom those in S we study the chance of an event happen-ing within a given SA cycle. This could be the chanceof finding the pairings Cooperation-Cooperation, Trust-Trust, etc. In previous sections we used the ratio ofevents, which was useful as there was no perturbationin the systems to detect. To evaluate the chance of theevent occurring we used ensemble averages over 103 re-alizations of each simulation.
The blue and orange curves in the panels of Figure 10

10
FIG. 9: Emergence of reciprocity from dynamics of the network. From left to right the panels show the snapshots ofthe propensities of connections between 20 agents played the PDG and updating their decisions based on SALTC
at t = 1, 5× 10³ and 5× 10⁵, respectively. Intensity of the lines between pairs represent the magnitude of thepropensity of one to another and the directions show the intensity belongs to which agent and towards which one.
The colors of the nodes represent the state of the agents at that time, red as defector and green as cooperator.
show the CMC within a group of N = 20 agents andCMC within the subsystem of the 10 agents (CMCS)who were not exchanged with zealots after time tz. Thetop-left panel, shows the CMC and CMCS between theagents which used SAL to update their decisions, beforeand after 10 of them being replaced by zealots at timetz = 2.5 × 10⁵. There is a drop in the CMC because ofthe inevitable pairings between the SAL-agents and thezealots. The CMCS between the 10 agents who were notswitched with zealots increased after their interactionswith the zealots, despite the overall decrease in the CMCin the system. In other words, the agents of the subgroupS improved their mutual cooperation from about 0.1 toabout 0.25. This is because when the agent of subsystemS is randomly paired with a zealot of the subsystem S,with high probability, it ended up as a sucker and receivedthe minimum payoff of zero. The agent used this payoffas a measure on which to base its next decision. Whenan agent of subsystem S paired with another agent of thesame subsystem, with high chance (because of their pastexperience of playing together) played C, but because ofthe low payoff it received previously playing with a zealot,still increases its tendency to play C with this agent.
The top-right panel in Figure 10 depicts the CMC andCMCS between agents used SALT to make decisions,before and after the switching time tz = 2.5 × 10⁵. Al-though SALT highly increased the CMC level, it failedto sustain that level due to the influence of the zealots.After the switching time tz only the agents of the sub-system S contributed to the mutual cooperation.
The bottom-left panel in the figure depicts the advan-tage of adding the SAC to the SAL mechanism in sus-taining the CMC of the system after the switching timetz = 2.5 × 10⁶. This figure shows that after the time tzthe CMCS of the subsystem S increases, as the onlycontribution for mutual cooperation, and saturates atabout 0.85. The bottom-right panel of the figure shows
the CMC and CMCS of the agents use SALTC (en-tire SA algorithm) to update their decisions. The panelshows a very high resilience of the system even after thismassive number of SA-agents switched to zealots at timetz = 2.5×10⁶. Similar to the system governed by SALC,there is a drop in the CMC but the agents could sus-tain the level of CMCS to about 0.95. This is becausethe SA-agents of this system learned to disconnect them-selves from the zealots using the SAC mechanism, whichhighly increased the robustness of the emerging mutualcooperation. Notice that after the switching time tz allthe mutual cooperation occurs within subsystem S.
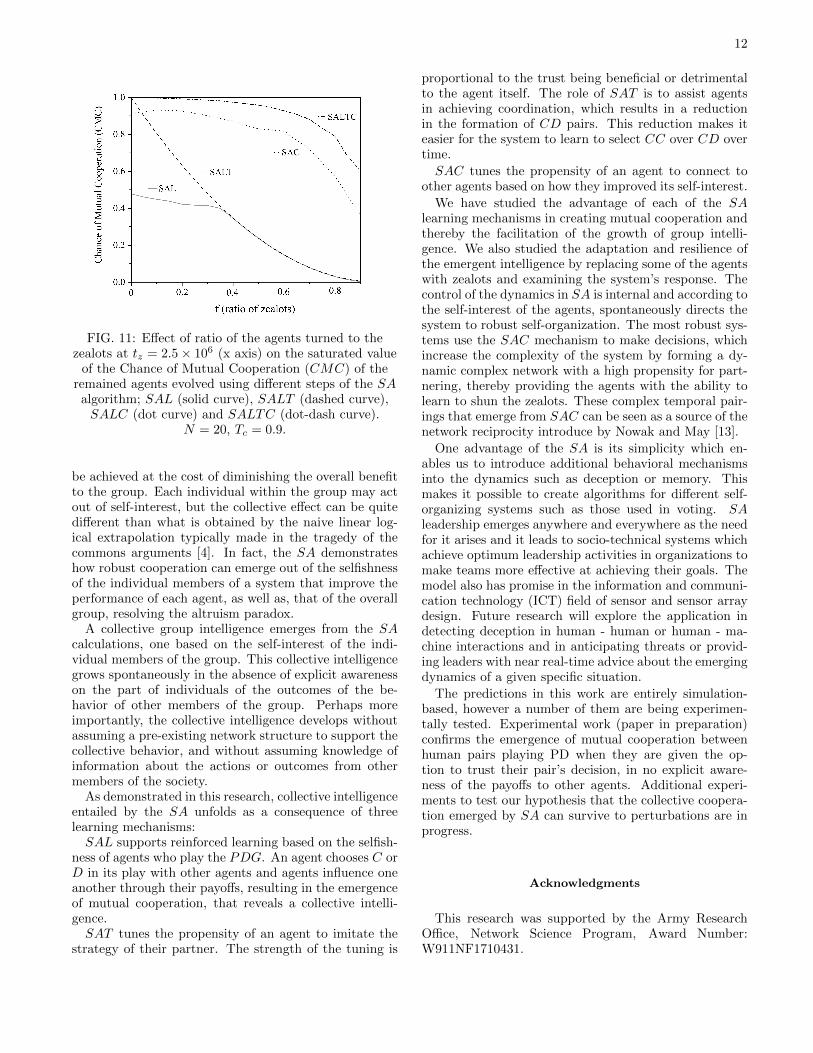
Figure 11 summarizes the influence a given fractionof zealots within a group manifest under the differentlearning mechanisms. The figure shows the saturatedvalue of CMCS of the SA agents, using different stepsof the SA algorithm for decision making, after a fractionf of the agents turned to zealots at time tz. The moreadaptable the system, the higher the saturation valueof CMCS that can be achieved by the remaining (1-f)agents. This provides us with a measure of the resilienceof the system. The solid curve is the saturated CMCSfor the agents using SAL as a function of the fraction (f)of the agents who switched to zealots at time tz . Forf ¡ 0.4 (8 zealots) the system retains a CMCS slightlyabove 0.4. Beyond this fraction of zealots there is anexponential decay of CMCS . In this situation the SAagents learn to modify their decisions (C orD) dependingon whether or not their pair is a zealot or another SAagent using SAL to make its decisions.
The dashed curve in the figure is the saturated valueof the CMC of the SA agents, using SALT , after theswitching time tz. Introducing the SAT learning im-proves the resilience of the system for f < 0.4 above thatof SAL alone. However, beyond f = 0.4 the calculationconverges with the earlier one indicating that the addi-tional learning mechanism of trust ceases to be of value

11
FIG. 10: The blue curves show the time evolution of the Chance of Mutual Cooperation (CMC) (chance of CC tohappen among 20 agents at time t) and the orange curves shows the CMC between 10 agents who didn’t forced tobe zealot. In top-left panel agents used SAL and in top-right panel used SALT to update their decisions while sincetz = 2.5× 10⁵ 10 of the agents forced to be zealots. In bottom-left panel the agents used SALC and in bottom-right
panel used SALTC to update their decisions while since tz = 2.5× 10⁶ 10 of the agents forced to be zealots.N = 20, Tc = 0.9.
beyond a specific level of zealotry.
The two top curves of Figure 11 are saturated CMCfor the SA agents using SALC (doted curve) andSALTC (dot-dash curve) to make decisions, after theswitching time tz. These two curves show substantialimprovement in the system’s resilience to an increase inthe fraction of zealots. Or said differently, the robust-ness of the system to perturbations is insensitive to thenumber of zealots, that is, until the zealots constitutethe majority of group membership. The SAC learningin the decision making of the SA-agents have the abil-ity to avoid pairing with the zealots. Once the fractionof zealots exceeds 0.6 the resilience drops rapidly. Thesaturated CMC for the SALTC is highest where thethree learning levels (decision, trust, connection) are ac-tive, giving the SA-agents maximum adaptability, that is,flexibility to change in order to maximize their self inter-est. This realization of self-interest improves the payoff
of the whole system as well.Notice that as the number of the zealots increases, it
takes longer for agents to agree to play, but when theydo play, they do so with a high propensity that they willcooperate with each other. In other words, increasing thenumber of zealots slows down the response of the system.
In Appendix B we show complementary analyses of theevolution of the propensity of an agent to interact withother agents after zealots are introduced, as well as thesnapshots of the propensities of connections among the20 agents.
V. DISCUSSION AND IMPLICATIONS OFRESULTS
The Selfish Algorithm provides a demonstration thatthe benefit to an individual within a social group need not
12
FIG. 11: Effect of ratio of the agents turned to thezealots at tz = 2.5× 10⁶ (x axis) on the saturated value
of the Chance of Mutual Cooperation (CMC) of theremained agents evolved using different steps of the SA
algorithm; SAL (solid curve), SALT (dashed curve),SALC (dot curve) and SALTC (dot-dash curve).
N = 20, Tc = 0.9.
be achieved at the cost of diminishing the overall benefitto the group. Each individual within the group may actout of self-interest, but the collective effect can be quitedifferent than what is obtained by the naive linear log-ical extrapolation typically made in the tragedy of thecommons arguments [4]. In fact, the SA demonstrateshow robust cooperation can emerge out of the selfishnessof the individual members of a system that improve theperformance of each agent, as well as, that of the overallgroup, resolving the altruism paradox.
A collective group intelligence emerges from the SAcalculations, one based on the self-interest of the indi-vidual members of the group. This collective intelligencegrows spontaneously in the absence of explicit awarenesson the part of individuals of the outcomes of the be-havior of other members of the group. Perhaps moreimportantly, the collective intelligence develops withoutassuming a pre-existing network structure to support thecollective behavior, and without assuming knowledge ofinformation about the actions or outcomes from othermembers of the society.
As demonstrated in this research, collective intelligenceentailed by the SA unfolds as a consequence of threelearning mechanisms:SAL supports reinforced learning based on the selfish-
ness of agents who play the PDG. An agent chooses C orD in its play with other agents and agents influence oneanother through their payoffs, resulting in the emergenceof mutual cooperation, that reveals a collective intelli-gence.SAT tunes the propensity of an agent to imitate the
strategy of their partner. The strength of the tuning is
proportional to the trust being beneficial or detrimentalto the agent itself. The role of SAT is to assist agentsin achieving coordination, which results in a reductionin the formation of CD pairs. This reduction makes iteasier for the system to learn to select CC over CD overtime.
SAC tunes the propensity of an agent to connect toother agents based on how they improved its self-interest.
We have studied the advantage of each of the SAlearning mechanisms in creating mutual cooperation andthereby the facilitation of the growth of group intelli-gence. We also studied the adaptation and resilience ofthe emergent intelligence by replacing some of the agentswith zealots and examining the system’s response. Thecontrol of the dynamics in SA is internal and according tothe self-interest of the agents, spontaneously directs thesystem to robust self-organization. The most robust sys-tems use the SAC mechanism to make decisions, whichincrease the complexity of the system by forming a dy-namic complex network with a high propensity for part-nering, thereby providing the agents with the ability tolearn to shun the zealots. These complex temporal pair-ings that emerge from SAC can be seen as a source of thenetwork reciprocity introduce by Nowak and May [13].
One advantage of the SA is its simplicity which en-ables us to introduce additional behavioral mechanismsinto the dynamics such as deception or memory. Thismakes it possible to create algorithms for different self-organizing systems such as those used in voting. SAleadership emerges anywhere and everywhere as the needfor it arises and it leads to socio-technical systems whichachieve optimum leadership activities in organizations tomake teams more effective at achieving their goals. Themodel also has promise in the information and communi-cation technology (ICT) field of sensor and sensor arraydesign. Future research will explore the application indetecting deception in human - human or human - ma-chine interactions and in anticipating threats or provid-ing leaders with near real-time advice about the emergingdynamics of a given specific situation.
The predictions in this work are entirely simulation-based, however a number of them are being experimen-tally tested. Experimental work (paper in preparation)confirms the emergence of mutual cooperation betweenhuman pairs playing PD when they are given the op-tion to trust their pair’s decision, in no explicit aware-ness of the payoffs to other agents. Additional experi-ments to test our hypothesis that the collective coopera-tion emerged by SA can survive to perturbations are inprogress.
Acknowledgments
This research was supported by the Army ResearchOffice, Network Science Program, Award Number:W911NF1710431.

13
[1] Nowak M, Sigmund K, A strategy of win-stay, lose-shiftthat outperforms tit-for-tat in the Prisoner’s Dilemmagame, Nature, 364, 56–58 (1993).
[2] Gonzalez C, Ben-Asher, N Martin JM, Dutt V, A Cog-nitive Model of Dynamic Cooperation With Varied Inter-dependency Information, Cognitive Science, 39, 457-495(2015).
[3] Mahmoodi K, West BJ, Grigolini P, Self-organizing com-plex networks: individual versus global rules, Frontiers inphysiology, 8, 478 (2017).
[4] Lloyd WF, Two Lectures on the Checks to Population:Delivered Before the University of Oxford, in MichaelmasTerm 1832, JH Parker (1833).
[5] Ariely D, Predictably irrational: The hidden forces thatshape our decisions, HarperCollins (2008).
[6] Kahneman D, Thinking, fast and slow, Macmillan (2011).[7] Darwin C, The Origin of the Species and the Descent of
Man, Modern Library, NY (1871).[8] Wilson DS, Wilson EO, ethinking the theoretical founda-
tion of sociobiology, The Quarterly review of biology, 4,327–348 (2007).
[9] West BJ, Mahmoodi K, Grigolini P, Empirical Para-dox, Complexity Thinking and Generating New Kinds ofKnowledge, Cambridge Scholars Publishing (2019).
[10] Rand DG, Nowak, Martin A, Human cooperatio, Trendsin cognitive sciences, 17,413–425 (2013).
[11] Rapoport A, Chammah AM, Prisoner’s Dilemma: AStudy in Conflict and Cooperation,University of Michi-gan Press (1965).
[12] Moisan F, ten Brincke R, Murphy RO, Gonzalez C, Notall Prisoner’s Dilemma games are equal: Incentives, so-cial preferences, and cooperation, Decision, 5, 306–322(2018).
[13] Nowak MA, May RM, Evolutionary games and spatialchaos, Nature, 359, 826 (1992).
[14] Martin JM, Gonzalez C, Juvina I, Lebiere C, ADescription-Experience Gap in Social Interactions: In-formation about Interdependence and Its Effects on Co-operation, Journal of Behavioral Decision Making, 27,349-362 (2014).
[15] Fischbacher U, Gachter S, Fehr E, Are people condition-ally cooperative? Evidence from a public goods experi-ment,Economics letters, 71, 397–404 (2001).
[16] Barabasi AL, Albert R, Emergence of scaling in randomnetworks, Science, 286, 509–512 (1999).
[17] Tomassini M, Pestelacci Enea, Luthi L, Social dilemmasand cooperation in complex networks, International Jour-nal of Modern Physics C, 18, 1173–1185 (2007).
[18] Adami C, Schossau J, Hintze A, Evolutionary game the-ory using agent-based methods, Physics of life reviews,19, 1–26 (2016).
[19] Couzin I, Collective minds, Nature, 445, 715 (2007).[20] Li C, Liu F, Li P, Ising model of user behavior decision in
network rumor propagation, Discrete Dynamics in Natureand Society, 2018, (2018).
[21] Mahmoodi K, Gonzalez C, Emergence of collec-tive cooperation and neworks from selfish-trust andselfish-connections, Cognitive Science (The 41st An-nual Meeting of the Cognitive Science Society),https://mindmodeling.org/cogsci2019/papers/0392/0392.pdf,2254–2260 (2019).
[22] Gintis H, The Bounds of Reason: Game Theory and theUnification of the Behavioral Sciences-Revised Edition,Princeton University Press (2014).
[23] Gonzalez C, Mahmoodi K, Singh K, Emergence of Col-lective Cooperation in the Absence of Interdependency In-formation, (in preparation) 2020.
[24] West BJ, Natures Patterns and the Fractional Calculus,Walter de Gruyter GmbH & Co KG (2017).
[25] Bettencourt LMA, The origins of scaling in cities, Sci-ence, 340, 1438–1441 (2013).
Appendix A: Details for the SA algorithm
The following steps are executed during a single cy-cle initiated at time t of the SA algorithm depicted inFigure 12
a. 1. Selfish algorithm - connection (SAC) Agentsi and j are picked randomly such that at time t the SACagent i has the propensity:
Pij(t) =Mij(t)∑kMik(t)
(2)
to play with agent j, where the propensity falls in theinterval 0 < Pij(t) < 1. The quantity Mij(t) is the cu-mulative tendency for agent i to select agent j to playat time t. This cumulative tendency changes at step 7,according to the last two payoffs received by agent i.
At the same time, the SAC agent j has a propen-sity given by Eq. (2), with the indices interchanged, toplay with agent i, where the propensity falls in the in-terval 0 < Pji(t) < 1. Two agents i and j partner if twonumbers r1 and r2 are randomly chosen from the interval(0,1), and satisfy inequalities r1 < Pij(t) and r2 < Pji(t).If both inequalities are not satisfied another two agentsare randomly selected at each time t until the inequal-ities are satisfied and the two agents ”agree” to play aPDG. In the flowchart wherever letter r is called it re-turns a single uniformly distributed random number inthe interval (0,1).
b. 2. Selfish algorithm - learning (SAL) Agent i,playing with agent j, initially selects an action, C or D,using SAL. The agent i has the propensity:
PCij(t) =Cij(t)
Cij(t) +Dij(t)(3)
to pick C and the propensity:
PDij(t) =Dij(t)
Cij(t) +Dij(t)(4)
to pick D, as it’s next potential decision. Note that thesum of these two terms is one. The quantities Cij(t) andDij(t) are cumulative tendencies for agent i playing with
14
agent j, at time t, for the choice C or D, respectively.These cumulative tendencies change at step 6 based onthe last two payoffs of agent i.
To decide on an action a random number r is selectedfrom the interval (0,1). If r < PCij(t) then the nextdecision of SAL agent i will be C, otherwise will be D.The same reasoning applies for agent j.
c. 3. Selfish algorithm - trust (SAT ) Instead of ex-ecuting the decision determined by SAL in step 2, agenti has a propensity to trust the decision made by agent j,which also used SAL in step 2. The propensity for agenti to trust the decision of agent j is:
PTij(t) =Tij(t)
Tij(t) + T ij(t). (5)
Here again, if a random number r, chosen from the in-terval (0,1), is less than PTij(t) then trust is established.
The quantities Tij(t) and T ij(t) are cumulative tenden-cies for agent i to execute the choice of agent j, at time t,or to not rely on trust and to execute its choice based onSAL, respectively. These cumulative tendencies updatein step 5 based on the last two payoffs of agent i.
d. 4. Evaluating Own Payoffs After agent i and jexecuted their action, C or D, their payoff is evaluatedusing the payoffs matrix of the PDG, Πij(t) and Πji(t),respectively.
e. 5. Update of cumulative tendency of SAT Ifagent i used SAT playing with agent j then the accu-mulative tendencies Tij and T ij change to Tij + ∆i,jk
and T ij −∆i,jk for the next time agent i and j partner.The same happens for agent j. Similarly, if agent i didnot use SAT , but relied on its own SAL, then the ac-cumulative tendencies T ij and Tij change to T ij + ∆i,jk
and Tij −∆i,jk for the next time agent i and j partner.The same happens for agent j.
f. 6. Update of cumulative tendency of SAL Step6 is only active if the agent did not use SAT at step 3.If agent i played C with agent j, then the accumulativetendencies Cij and Dij change to Cij + ∆i,jk and Dij +∆i,jk for the next time agent i and j partner. If agent iplayed D with agent j, then the accumulative tendenciesDij and Cij change to Dij +∆i,jk and Cij−∆i,jk for thenext time agent i and j partner. The same happens foragent j.
g. 7. Update of cumulative tendency of SAC In thisstep the cumulative tendency to play with a specific agentchanges. If agent i played with agent j then the cumu-lative tendency of pairing with agent j, Mij changes toMij + ∆i,jk. The same happens for agent j.
As boundary condition for steps 5, 6 and 7, if the up-dated cumulative tendency goes beyond its defined max-imum (or below its defined minimum) then it has to setback to the maximum value (minimum value).
Appendix B: Effect of zealots on the dynamics ofthe SA
Figure 13 shows the time evolution of the propensityof SAC of one agent 1 to other 19 agents, in systemof 20 agents which used SALT (left panel) or SALTC(right panel) to make decision until tz where 10 (out ofthe 19) agents turned to zealots. This figure shows thatagent 1, before t = tz, mostly played with the agentcorresponding to the purple or green curve of left or rightpanel respectively. But after these agents switched tozealots then agent 1 decreased its propensity to pair upand play with them and switched to pair with the agentcorresponding to blue curves (not a zealot).
Figure 14 shows the snapshots of the propensities ofconnections between 20 agents, using SALTC to makedecisions, before and after one of them turned to a zealot(agent 10). This figure shows that the network is intelli-gent and is able to isolate the zealot, in order to sustainthe highest level of mutual cooperation possible.
Appendix C: Effect of trust (fixed chance of trust)on the evolution of decisions
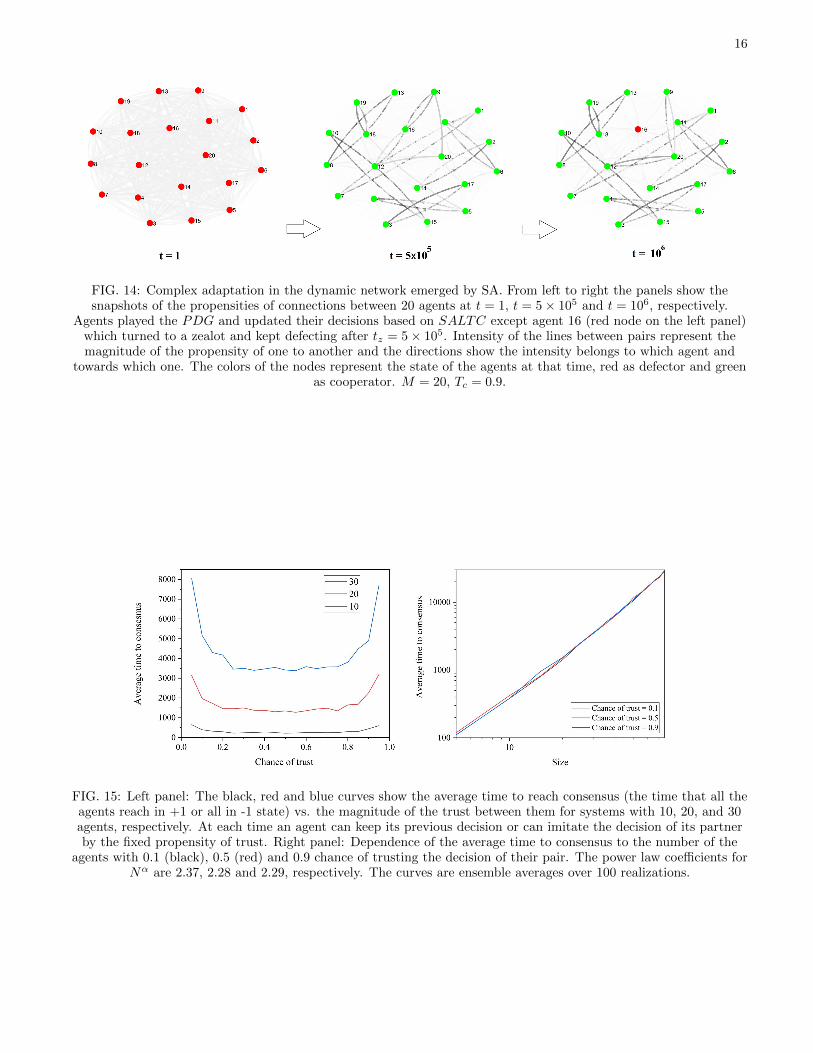
The aim of this section is to highlight the difference be-tween trust used in the literature with our dynamic trust.We introduced ”trust” and ”not trust” as a ”decision”(while the word trust means ”not making a decision”).We connected trust to a reinforcement learning mecha-nism to make it adaptable. To show the difference, herewe determine the effect of fixed chance of trust betweenthe agents on the dynamics of decisions where there is noreinforcement learning active, which is to say that trustis the only learning mechanism through SAT . We in-vestigated the dynamics of the decisions made by socialgroups consisting of 10, 20, or 30 agents. These agentsrandomly partner at time t and can either retain theirdecision, or exchange it with a fixed chance for their part-ner’s decision (trusting). In left panel of Figure 15 theaverage time for the agents to reach consensus is plottedversus the chance of trust that agents have to take thedecision of their partner as their next decision in each ofthe three groups. This figure shows that there is a broadflat minimum (optimum) value of trust that leads theagents to achieving consensus faster and that this timeincreases with the size of the network.
It is interesting to note that the evolution of mutualcooperation when one of the agents becomes a zealot,which is to say, that agent remains the same all the time,the network rapidly relaxes to the value of the zealot.The conclusion is that this network is highly sensitive tothis small perturbation depending on the chance of trust.In other words, this system, that learns only throughtrust is not significantly resilient (is not robust).
The panel on the right of the Figure 15 indicates adependence of the average time for a group to reach con-sensus from a random initial state is a monotonously

15
FIG. 12: Flowchart of the SA. ”Y” and ”N” letters represent ”Yes” and ”No”, respectively.
FIG. 13: Time evolution of the propensity of agent 1 to pair with the other 19 agents P1j , where agents used SALC(left panel) and SALTC (right panel) before tz = 2.5× 10⁶ and after tz 10 of the agents (out of 19) turned to
zealots. N = 20, Tc = 0.9.
increasing function of group size N. The average timeto reach consensus satisfies an allometry equation [24]:Y = aXb, where Y is the functionality of the system, Xis a measure of system size and the empirical parame-ters a and b are determined by data. Allometry relations(ARs) have only recently been applied to social phenom-ena [25] but on those applications the scaling has alwaysbeen superlinear (b¿1). Bettencourt [25] point out thatthe superlinear scale reflects unique social characteristicswith no equivalent in biology in which the ARs scalingis invariably sublinear (b¡1). They point out that the
knowledge spillover in urban settings drive the growthof functionality such as wages, income, gross domesticproduct, bank deposits, as well as rates of invention...allscale superlinearly with city size.
In this paper the agents were allowed to learn througha variety of modalities and to find their individual opti-mum value of trust regarding other agents. Subsequently,we showed that this dynamic trust acting, in concert withother learning modalities, leads to robust mutual coop-eration.
16
FIG. 14: Complex adaptation in the dynamic network emerged by SA. From left to right the panels show thesnapshots of the propensities of connections between 20 agents at t = 1, t = 5× 10⁵ and t = 106, respectively.
Agents played the PDG and updated their decisions based on SALTC except agent 16 (red node on the left panel)which turned to a zealot and kept defecting after tz = 5× 10⁵. Intensity of the lines between pairs represent themagnitude of the propensity of one to another and the directions show the intensity belongs to which agent and
towards which one. The colors of the nodes represent the state of the agents at that time, red as defector and greenas cooperator. M = 20, Tc = 0.9.
FIG. 15: Left panel: The black, red and blue curves show the average time to reach consensus (the time that all theagents reach in +1 or all in -1 state) vs. the magnitude of the trust between them for systems with 10, 20, and 30agents, respectively. At each time an agent can keep its previous decision or can imitate the decision of its partnerby the fixed propensity of trust. Right panel: Dependence of the average time to consensus to the number of the
agents with 0.1 (black), 0.5 (red) and 0.9 chance of trusting the decision of their pair. The power law coefficients forNα are 2.37, 2.28 and 2.29, respectively. The curves are ensemble averages over 100 realizations.
![The Price of Anarchy - Universiteit Leiden · Sel sh routing 1.1 Introduction This chapter focuses on Tim Roughgarden’s work on routing games [14,16], the ‘paradigmatic’ study](https://static.fdocuments.in/doc/165x107/6014a490ecacf878e2067902/the-price-of-anarchy-universiteit-leiden-sel-sh-routing-11-introduction-this.jpg)