Second Quarter 2020 Earnings Presentation
14
Second Quarter 2020 Earnings Presentation August 6, 2020
Transcript of Second Quarter 2020 Earnings Presentation
Second Quarter 2020
Earnings PresentationAugust 6, 2020

Westlake’s commitment to social responsibility and advancing sustainability is
formed by the company’s longstanding core values:
Health, Safety & Environmental - The vigilant stewardship of the environment and sustainability are of utmost
importance and at the forefront of everything we do.
Our People - Support, develop and inspire our people to achieve their personal best and treat them with dignity and
respect.
Quality & Continuous Improvement – An intensive practice of “never-ending process of improvement.”
Competitiveness - Providing innovative and useful products, maintaining high standards of customer service and
operational excellence with a constant focus on managing costs.
Citizenship - Recognizing the importance of supporting the communities in which we work and live and make it a priority
to take an active role in making these communities better.
Westlake’s Commitment to Social Responsibility
and Advancing Sustainability
Participating in Multi-Industry Associations for Environmental Protection Westlake is a proud partner with the following organizations to drive sustainable action to eliminate plastic waste, capture more
flexible food packaging waste for recycling and support vinyls’ sustainable impact in the world, along with many other initiatives.
Protecting the EnvironmentWestlake has numerous programs designed to promote safe, ethical, environmentally and socially responsible practices
including: a worldwide recycling program, operating in an energy efficient manner that stabilizes the power grids and
reducing water usage and emissions. Over the past five years, Westlake has reduced Sulphur Dioxide emissions to
almost zero, reduced energy usage per ton of global production and achieved a nearly 30% reduction on CO2 emissions.
2

Westlake Chemical Second Quarter 2020 Highlights
Business Highlights
Strategies to reduce costs and increase operational efficiencies; generated $448 million in
cash flows from operations in the second quarter of 2020
Issued in June 2020 $300 million of ten-year senior unsecured notes at a coupon of 3.375%
per annum to fund retirement of $254 million of GO Zone Revenue Bonds by year-end;
annualized interest expense savings of $6 million while maintaining long-dated maturity profile
Committed to maintaining solid investment grade credit metrics and ratings
Industry Outlook
Robust demand in flexible packaging keeping polyethylene operating rates high
Recovery in PVC demand during the second quarter drove improved industry operating rates
3

Westlake Chemical Corporation
Second Quarter 2020 Financial Highlights
(1) Reconciliations of EBITDA, Vinyls EBITDA, Olefins EBITDA and Other EBITDA to the applicable GAAP measures can be found on
pages 8, 9 and 10
Second Quarter 2020 vs.
First Quarter 2020
– Lower sales volumes for caustic soda
– Lower sales prices and margins for
polyethylene and PVC resin
+ Higher sales prices for caustic soda
+ Lower fuel and operating costs
Second Quarter 2020 vs.
Second Quarter 2019
– Lower global sales prices for our major
products
– Reduced sales volumes for caustic soda and
downstream vinyls products
+ Lower ethane feedstock and fuel costs
+ Reduced operating and selling, general and
administrative expenses
4
($ in millions) 2Q 2020 1Q 20202Q 2020 vs.
1Q 2020 2Q 20192Q 2020 vs.
2Q 2019
YTD
2020
YTD
2019YTD 2020 vs.
YTD 2019
Sales $1,709 $1,932 (12%) $2,144 (20%) $3,641 $4,169 (13%)
Operating Income $36 $136 (74%) $194 (81%) $172 $328 (48%)
Vinyls EBITDA $182 $232 (22%) $269 (32%) $414 $508 (19%)
Olefins EBITDA $60 $98 (39%) $119 (50%) $158 $193 (18%)
Corporate EBITDA ($6) $7 - ($16) - $1 ($15) -
EBITDA¹ $236 $337 (30%) $372 (37%) $573 $686 (16%)

Vinyls Segment Performance
5
Second Quarter 2020 vs.
First Quarter 2020
– Lower sales volumes for caustic soda
– Lower global sales prices for PVC resin
– Higher ethane feedstock
+ Lower fuel costs, operating expenses and
planned turnarounds costs
Second Quarter 2020 vs.
Second Quarter 2019
– Lower global sales prices for our major
products
– Lower sales volumes for caustic soda and
downstream vinyl products
+ Lower ethane feedstock costs
+ Reduced operating and fuel costs as well as
costs associated with planned turnarounds
($ in millions) 2Q 2020 1Q 20202Q 2020 vs.
1Q 2020 2Q 20192Q 2020 vs.
2Q 2019
YTD
2020
YTD
2019YTD 2020 vs.
YTD 2019
Sales $1,348 $1,505 (10%) $1,667 (19%) $2,853 $3,233 (12%)
Operating Income $20 $73 (73%) $129 (84%) $93 $230 (60%)
EBITDA $182 $232 (22%) $269 (32%) $414 $508 (19%)

Olefins Segment Performance
6
Second Quarter 2020 vs.
First Quarter 2020
– Lower sales prices for polyethylene
– Higher feedstock costs
+ Increased polyethylene sales volumes
+ Lower fuel costs
Second Quarter 2020 vs.
Second Quarter 2019
– Lower sales prices for polyethylene
+ Increased polyethylene sales volumes
+ Lower feedstock and fuel costs
($ in millions) 2Q 2020 1Q 20202Q 2020 vs.
1Q 2020 2Q 20192Q 2020 vs.
2Q 2019 YTD 2020YTD 2019YTD 2020 vs.
YTD 2019
Sales $361 $427 (15%) $477 (24%) $788 $936 (16%)
Operating Income $25 $62 (60%) $82 (70%) $87 $119 (27%)
EBITDA $60 $98 (39%) $119 (50%) $158 $193 (18%)
-

Financial Reconciliations
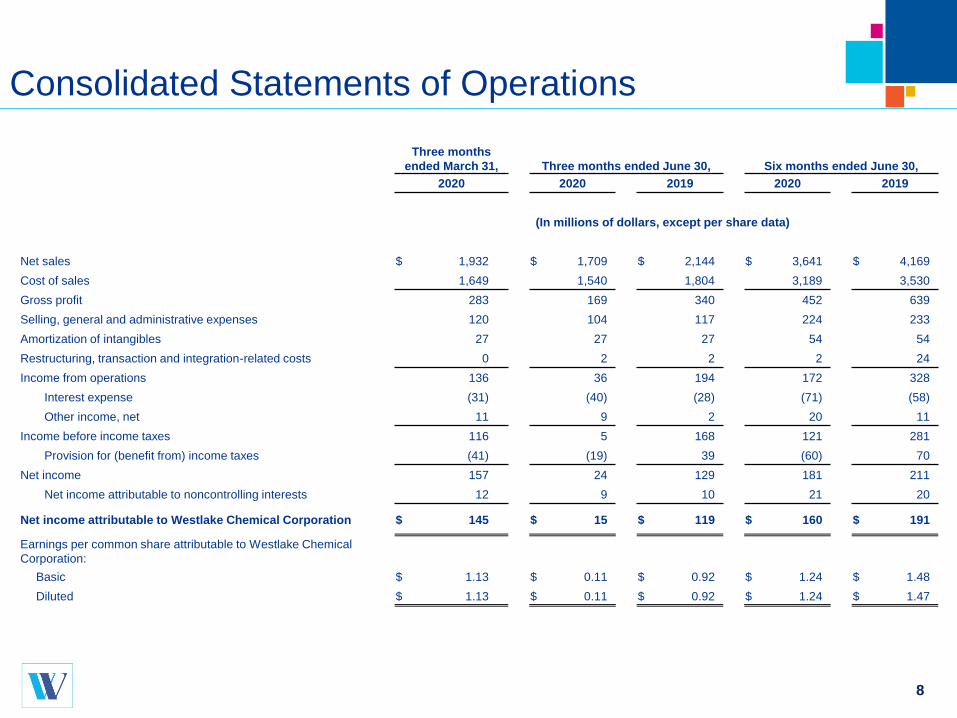
Consolidated Statements of Operations
Three months
ended March 31, Three months ended June 30, Six months ended June 30,
2020 2020 2019 2020 2019
(In millions of dollars, except per share data)
Net sales $ 1,932 $ 1,709 $ 2,144 $ 3,641 $ 4,169
Cost of sales 1,649 1,540 1,804 3,189 3,530
Gross profit 283 169 340 452 639
Selling, general and administrative expenses 120 104 117 224 233
Amortization of intangibles 27 27 27 54 54
Restructuring, transaction and integration-related costs 0 2 2 2 24
Income from operations 136 36 194 172 328
Interest expense (31) (40) (28) (71) (58)
Other income, net 11 9 2 20 11
Income before income taxes 116 5 168 121 281
Provision for (benefit from) income taxes (41) (19) 39 (60) 70
Net income 157 24 129 181 211
Net income attributable to noncontrolling interests 12 9 10 21 20
Net income attributable to Westlake Chemical Corporation $ 145 $ 15 $ 119 $ 160 $ 191
Earnings per common share attributable to Westlake Chemical
Corporation:
Basic $ 1.13 $ 0.11 $ 0.92 $ 1.24 $ 1.48
Diluted $ 1.13 $ 0.11 $ 0.92 $ 1.24 $ 1.47
8

Reconciliation of EBITDA to Net Income, Income from
Operations and Net Cash Provided by Operating Activities
Three Months
Ended March 31, Three Months Ended June 30, Six Months Ended June 30,
2020 2020 2019 2020 2019
(In millions of dollars)
Net cash provided by operating activities $ 61 $ 448 $ 320 $ 509 $ 467
Changes in operating assets and liabilities and other 222 (454) (191) (232) (241)
Deferred income taxes (126) 30 — (96) (15)
Net income 157 24 129 181 211
Less:
Other income, net 11 9 2 20 11
Interest expense (31) (40) (28) (71) (58)
Benefit from (provision for) income taxes 41 19 (39) 60 (70)
Income from operations 136 36 194 172 328
Add:
Depreciation and amortization 190 191 176 381 347
Other income, net 11 9 2 20 11
EBITDA $ 337 $ 236 $ 372 $ 573 $ 686
9

Reconciliation of Vinyls, Olefins and Corporate EBITDA to
Applicable Operating Income (Loss)
10
Three months ended March 31, Three months ended June 30, Six months ended June 30,
2020 2020 2019 2020 2019
(In millions of dollars)
Vinyls EBITDA $ 232 $ 182 $ 269 $ 414 $ 508
Less:
Depreciation and Amortization 153 154 138 307 272
Other Income (Expenses) 6 8 2 14 6
Vinyls Operating Income (Loss) 73 20 129 93 230
Olefins EBITDA 98 60 119 158 193
Less:
Depreciation and Amortization 35 35 36 70 71
Other Income (Expenses) 1 0 1 1 3
Olefins Operating Income (Loss) 62 25 82 87 119
Corporate EBITDA 7 (6) (16) 1 (15)
Less:
Depreciation and Amortization 2 2 2 4 4
Other Income (Expenses) 4 1 (1) 5 2
Corporate Operating Income (Loss) 1 (9) (17) (8) (21)
Vinyls Operating Income (Loss) 73 20 129 93 230
Olefins Operating Income (Loss) 62 25 82 87 119
Corporate Operating Income (Loss) 1 (9) (17) (8) (21)
Total Operating Income (Loss) $ 136 $ 36 $ 194 $ 172 $ 328

Quarterly Industry Pricing

1) Industry pricing data was obtained through IHS Markit ("IHS"). We have not independently verified the data.
2) Average Mont Belvieu spot prices of purity ethane over the period.
3) Average Mont Belvieu spot prices of non-TET propane over the period.
4) Average North American spot prices of ethylene over the period.
5) Average North American Net Transaction prices of polyethylene low density GP-Film grade over the period.
6) Average North American contract prices of styrene over the period.
7) Average USGC-CSLi index values for caustic soda over the period. As stated by IHS, "the caustic soda price listing represents the USGC-CSLi values. USGC-CSLi does not reflect contract
price discounts, implementation lags, caps or other adjustments factors. Additionally, it is not intended to represent a simple arithmetic average of all market transactions occurring during the
month. Rather, the USGC-CSLi is most representative of the month-to-month caustic soda price movement for contract volumes of liquid 50% caustic soda rather than the absolute value of
contract prices at a particular point in time. It is intended to serve only as a benchmark."
8) Average North American contract prices of chlorine over the period.
9) Average North American contract prices of pipe grade polyvinyl chloride ("PVC") over the period. As stated by IHS, "the contract resin prices posted reflect an "index" or "market" for prices
before discounts, rebates, incentives, etc."
10) Average North American export price for low density polyethylene GP-Film grade over the period.
11) Average North American low spot export prices of caustic soda over the period.
12) Average North American spot export prices of PVC over the period.
Average Quarterly Industry Prices (1)
Quarter Ended
June 30,
2019
September 30,
2019
December 31,
2019
March 31,
2020
June 30,
2020
Average domestic prices
Ethane (cents/lb) (2) 7.1 5.8 6.3 4.7 6.4
Propane (cents/lb) (3) 12.8 10.3 11.8 8.8 9.6
Ethylene (cents/lb) (4) 13.7 20.7 22.8 15.8 11.0
Polyethylene (cents/lb) (5) 63.0 59.0 54.0 52.3 49.0
Styrene (cents/lb) (6) 80.8 79.9 77.1 62.3 48.3
Caustic soda ($/short ton) (7) 697 692 662 648 698
Chlorine ($/short ton) (8) 175 175 175 176 175
PVC (cents/lb) (9) 68.2 68.8 67.8 71.8 66.5
Average export prices
Polyethylene (cents/lb) (10) 42.8 39.7 37.7 38.9 36.3
Caustic soda ($/short ton) (11) 283 275 219 203 319
PVC (cents/lb) (12) 35.0 35.1 33.6 36.9 27.5
12
Safe Harbor LanguageThis presentation contains certain forward-looking statements including statements regarding demand for our products
and commitment to an investment grade credit rating. Actual results may differ materially depending on factors such as
general economic and business conditions; the cyclical nature of the chemical industry; the availability, cost and volatility
of raw materials and energy; uncertainties associated with the United States, Europe and worldwide economies, including
those due to political tensions in the Middle East and elsewhere; current and potential governmental regulatory actions in
the United States and Europe and regulatory actions and political unrest in other countries; industry production capacity
and operating rates; the supply/ demand balance for our products; competitive products and pricing pressures; instability
in the credit and financial markets; access to capital markets; terrorist acts; operating interruptions including leaks,
explosions, fires, weather-related incidents, mechanical failure, unscheduled downtime, labor difficulties, transportation
interruptions, spills and releases and other environmental risks; changes in laws or regulations; technological
developments; our ability to implement our business strategies; creditworthiness of our customers; and other factors
described in our reports filed with the Securities and Exchange Commission. Many of these factors are beyond our ability
to control or predict. Any of these factors, or a combination of these factors, could materially affect our future results of
operations and the ultimate accuracy of the forward-looking statements. These forward-looking statements are not
guarantees of our future performance, and our actual results and future developments may differ materially from those
projected in the forward-looking statements. Management cautions against putting undue reliance on forward-looking
statements. Every forward-looking statement speaks only as of the date of the particular statement, and we undertake no
obligation to publicly update or revise any forward-looking statements.
Investor Relations Contacts
Westlake Chemical
2801 Post Oak Boulevard, Suite 600
Houston, Texas 77056
713-960-9111
Steve Bender
Executive Vice President &
Chief Financial Officer
Jeff Holy
Vice President &
Treasurer
13